
Abstract
Paracetamol (P), one of the most popular and commonly used analgesic and antipyretic agents, causes hepatotoxicity in overdoses. Amlodipine (AML), an L-type calcium channel blocker, has been shown to have anti-inflammatory activity by reversing the effect of calcium in the inflammation pathogenesis. In this study, the hepatoprotective activity of AML on P-induced hepatotoxicity was evaluated. Thirty male albino Wistar rats were divided into five groups: (1) control, (2) 2 g/kg of P, (3) 2 g/kg of P + 5 mg/kg of AML, (4) 2 g/kg of P + 10 mg/kg of AML, and (5) 10 mg/kg of AML. Some liver enzymes, oxidative parameters, cytokine mRNA expressions, histopathology, and immunohistochemical studies were performed in liver and blood samples. The serum levels of alanine aminotransferase and aspartate aminotransferase and the mRNA expression of tumor necrosis factor-alpha (TNF-α) and transforming growth factor-beta in the liver tissues were significantly increased in the group treated with P. The superoxide dismutase and glutathione parameters decreased and malondialdehyde levels increased in the livers of the rats treated with P. All these parameters were increased with both doses of the AML similar to the control group. A histopathological examination of the liver showed that AML administration ameliorated the P-induced inflammatory liver damage. In immunohistochemical staining, the expression of TNF-α in the cytoplasm of the hepatocytes was increased in the P group but not in other treatment groups when compared to the control. In conclusion, AML treatment showed significant protective effects against P-induced hepatotoxicity by increasing the activity of antioxidants and reducing inflammatory cytokines.
Introduction
Acute liver failure is one of the most common problems following drug intoxication, and paracetamol (P) toxicity is responsible for 20–70% of cases of acute live failure. 1 –3 P is commonly used as an analgesic and antipyretic agent, but hepatotoxicity due to P overdoses is a major problem worldwide. 4 Overdoses of P in humans and animal models were reported to cause hepatic and renal damage. Using P above the therapeutic dose at one time (i.e. over 150 mg/kg in children and 7.5 g in adults) 5 or in a 24 h period (i.e. over 250 mg/kg in children and 12 g in adults) can result in P toxicity. 6,7
P is metabolized mainly in the liver to nontoxic major metabolites, such as glucuronic acid–sulfate conjugates, and excreted in the urine. Only a small amount of P is converted by the hepatic cytochrome P450 (CYP) enzyme system (CYP 2E1 and CYP 1A2 isoenzymes) into the reactive hepatotoxic substance N-acetyl-para-benzoquinone imine (NAPQI). 8 This metabolite is a highly reactive electrophilic molecule, which covalently binds to intracellular proteins and leads to damage in liver parenchymal cells.
At therapeutic doses, NAPQI is detoxified by the antioxidant molecule glutathione (GSH) and excreted via bile after glucuronidation. 9 However, in overdoses of P, the conjugation pathways are saturated, and normal GSH levels in liver cells are decreased, leading to an increase in the toxic metabolite NAPQI. GSH is one of the most important cellular defense molecules against oxidative stress or reactive toxic compounds. 10 As a result of occurrence of NAPQI and depletion of GSH, suppression of mitochondrial respiration, ATP consumption, and mitochondrial oxidative stress can be observed. The consumption of ATP can lead to cellular oncotic necrosis in hepatocytes and sinusoidal endothelial cells. Calcium plays an important role in physiological processes of liver cells but can cause cell death at higher concentrations. Excess calcium levels are one of the major causes of Kupffer cell activation. 11 The L-type voltage-dependent calcium channel is involved in calcium ion-dependent activation of Kupffer cells. 12 Intracellular calcium plays an important role in the activation of various enzymes needed to regulate the function of parenchymal, endothelial, and Kupffer cells. 13 Therefore, irregularities in the calcium balance have serious consequences for the liver and are thought to mediate events that lead to cell death. 14
A previous study demonstrated that amlodipine (AML), an L-type calcium channel blocker, decreased the activation of Kupffer cells, increased the viability of hepatocytes, and protected hepatocytes from superoxide-induced damage in hypertensive rats. 14 Another study reported that elevation of NAPQI in P-induced toxicity changed the structure of liver cells by disrupting calcium homeostasis and increasing the level of intracellular calcium, thereby disrupting mitochondrial function. 15
AML, a dihydropyran derivative, was shown to exhibit potent antioxidant 12 and anti-inflammatory activity. 16 Studies demonstrated that calcium ions played an important role in the synthesis and release of mediators that lead to the inflammation process. 17,18 Experimental studies also showed that a reduction in calcium ions in tissue decreased pain and inflammation, whereas elevated calcium ions in tissue increased pain and inflammation. 11,19 The anti-inflammatory effect of AML was shown to be due to its ability to reverse the effect of calcium in the pathogenesis of inflammation. 14
According to the literature, AML has a positive impact on the balance between inflammatory cytokines 20 and oxidant/antioxidant levels. 21 Thus, AML can be used not only in antihypertensive therapy but also in the treatment of many diseases experimentally. In this study, we evaluated the biochemical, molecular, and histopathological effects of different doses of AML on P-induced liver injury.
Materials and method
Animals
In this study, we used 30 male albino Wistar rats, which were obtained from the Medical Experimental Research Center, Ataturk University. The animals weighed between 200 and 215 g and were fed under normal temperature conditions (22°C) in separate groups before the experiments. The animal care and experimental protocols were approved by the Experimental Animal Ethics Committee, Ataturk University, Erzurum, Turkey (May 31, 2013/5).
Chemicals
P was purchased from Doga Ilac Hammaddeleri Tic. Ltd Sti. (Istanbul, Turkey). We obtained thiopental sodium from IE Ulagay A.S. (Istanbul, Turkey), and AML (Norvasc 10 mg Tb) was obtained from the Pfizer Drug Company (Istanbul, Turkey).
Treatment
Animals fasted overnight and were divided into five equal groups (n = 6). The effects of AML on P-induced hepatotoxicity were studied in rats. Groups and details were performed as shown below. In P + AML groups, AML was administrated 1 h later P administration. Rats were allowed food postadministration of drugs for the next 24 h until they were killed. P was suspended in 1% CMC in 1× PBS and given 10 ml/kg per rat. AML was suspended in water and given in 10 ml/kg per rat. During AML administration, water was given by oral way to control and P groups. Group 1: Control. Group 2: 2 g/kg P (suspended in 1% CMC in 1× PBS), p.o. Group 3: 2 g/kg P (suspended in 1% CMC in 1× PBS), p.o. + 5 mg/kg AML, p.o. (P + AML 5). Group 4: 2 g/kg P (suspended in 1% CMC in 1× PBS), p.o. + 10 mg/kg AML, p.o. (P + AML 10). Group 5: 10 mg/kg AML, p.o. (AML 10).
Dose selection of AML was done according to its anti-inflammatory and hepatoprotective effect from previous studies. 22,23 P dose was also selected from our previous P toxicity studies. 24 –26
Twenty-four hours after the induction of P toxicity, the rats were anesthetized using a 50 mg/kg lethal dose of thiopental by intraperitoneal administration. Blood samples were collected into bottles using a heart puncture. The liver was removed immediately after killed.
Biochemical investigations
Alanine aminotransferase and aspartate aminotransferase serum measurements according to the manufacturer’s instructions
In separated serum samples, alanine aminotransferase (ALT) and aspartate aminotransferase (AST) from each serum sample were measured in duplicate with an autoanalyzer (ChemWell 2910; EIA & Chemistry analyzer, Megazyme, USA).
Biochemical investigation of liver tissues (superoxide dismutase, glutathione, and malondialdehyde)
After the surgical procedures, approximately 100 mg of ground tissue was homogenized in 1 ml of PBS homogenate buffer in an Eppendorf tube using the TissueLyser II, Qiagen, Hilden, Germany and then centrifuged. Superoxide dismutase (SOD), 27 GSH, 28 and malondialdehyde (MDA) 29 levels from each sample supernatant and standards were measured at room temperature in duplicate according to the modified methods of the ELISA reader as described previously. 30
Molecular investigations
Total RNA extraction and cDNA synthesis
Tissues were stabilized in RNA stabilization reagent (RNAlater; Qiagen) and then disrupted using the TissueLyser II (1 × 5 min for liver; Qiagen). Total RNA was purified using RNeasy Mini Kit Qiagen according to the manufacturer’s instructions in QIAcube (Qiagen). The RNA samples were reverse-transcribed into complementary DNA using the High-Capacity cDNA Reverse Transcription Kit (Applied Biosystem, Thermo Fisher Scientific, California, USA) as described previously. 30
Relative quantification of gene expression
Relative tumor necrosis factor-alpha (TNF-α) and transforming growth factor-beta (TGF-β) expression analyses were performed with the StepOne Plus Real-Time PCR System technology (Applied Biosystem) using cDNA synthesized from the RNAs of rat as described previously. 30 All data are expressed as fold change in expressions compared with the expressions in other animal groups using the 2-ΔΔCt method. 31
Immunohistochemical study
Tissue sections were deparaffinized in xylene and rehydrated in ethanol followed by water and phosphate-buffered saline. Subsequently, the sections were washed in distilled water and immersed in 3% hydrogen peroxide for 15 min to block endogenous peroxide. After several washes in PBS, the sections were immersed in equilibration buffer at room temperature for 20 min. The tissue sections were then incubated with primary antibody (rabbit polyclonal to TNF-α antibody, diluted 1:100, ab6671, Abcam, England; diluted 1:100 with bovine serum albumin in PBS) for 1 h at room temperature. Sections were incubated with 0.5% biotinylated second antibody in 1.5% blocking serum in PBS pH 7.2 for 2 h at room temperature without a primary antibody. The sections were counterstained with hematoxylin. The sections were examined and photographed under a light microscope (Olympus BH-40; Olympus Tokyo, Japan).
Inflammation scoring study
All group’s liver tissue sections were scored by two histologists using Knodell’s histological activity index (HAI) method. 32
Statistical analyses
For the molecular analyses, we used GraphPad Prism, version 5.0, and the results are presented as the mean ± standard deviation (SD). Comparisons between the groups were performed using the one-way analysis of variance (ANOVA) and Tukey’s multiple comparison test; significance was accepted at p < 0.001. For the biochemical analyses, we used the IBM SPSS Program, version 20, and the results are presented as the mean ± SD. Comparisons between the groups were performed using the one-way ANOVA and Duncan’s multiple comparison test; significance was accepted at p < 0.05.
Results
Biochemical results
Effects of AML on serum ALT and AST levels
The effects of AML on the serum enzymes ALT and AST are shown in Table 1. There were statistically significant (p < 0.05) increases in the plasma activities of AST and ALT in the group treated with P as compared with the control. AML administration significantly decreased the activities of the serum enzymes when compared with those in the group treated with P (p < 0.05).
Effect of AML treatment on hepatic injury biomarkers in the study groups.a
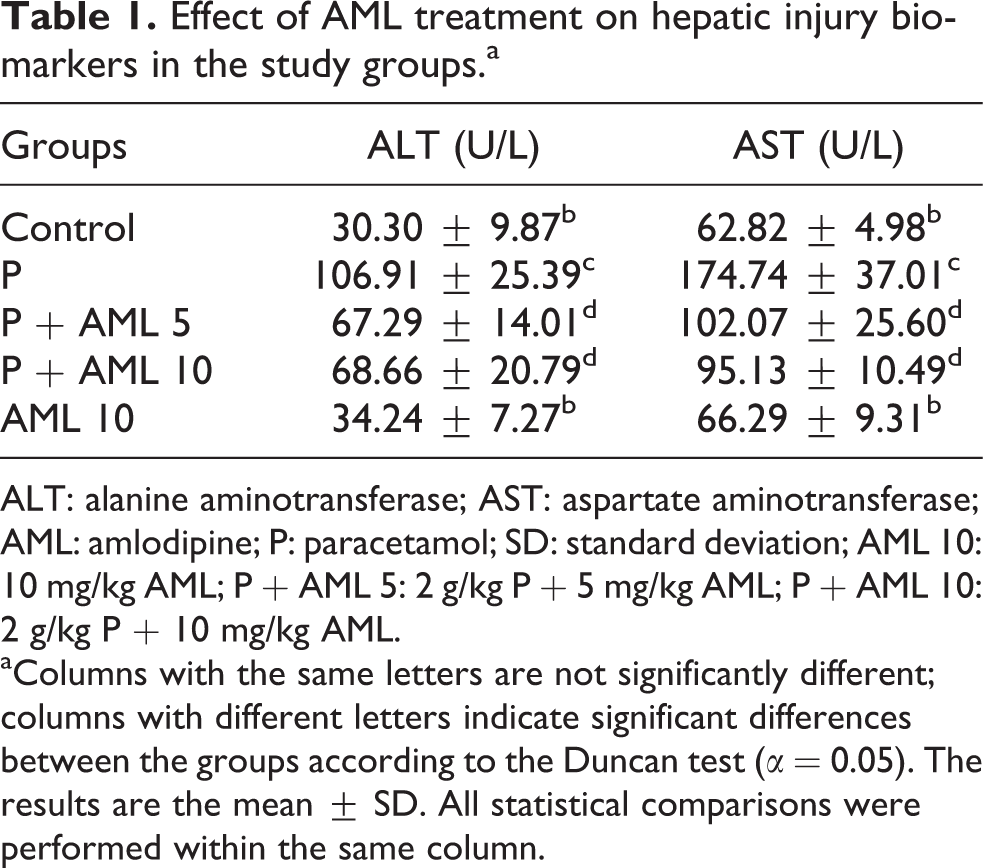
ALT: alanine aminotransferase; AST: aspartate aminotransferase; AML: amlodipine; P: paracetamol; SD: standard deviation; AML 10: 10 mg/kg AML; P + AML 5: 2 g/kg P + 5 mg/kg AML; P + AML 10: 2 g/kg P + 10 mg/kg AML.
aColumns with the same letters are not significantly different; columns with different letters indicate significant differences between the groups according to the Duncan test (α = 0.05). The results are the mean ± SD. All statistical comparisons were performed within the same column.
Effects of AML on liver oxidant and antioxidant levels
The activity of SOD and the level of GSH, as well as MDA levels, were evaluated in all rat livers. The results are shown in Table 2. The hepatic SOD activity and GSH level were markedly (p < 0.05) reduced in the group treated with P, whereas the MDA level increased as compared with that in the control group. In contrast to the group treated with P, pretreatment with both doses of AML increased the GSH level and SOD activity and reduced the MDA level.
Effect of AML treatment on antioxidant parameters in the study groups.a

SOD: superoxide dismutase; GSH: glutathione; MDA: malondialdehyde; AML: amlodipine; P: paracetamol; SD: standard deviation; AML 10: 10 mg/kg AML; P + AML 5: 2 g/kg P + 5 mg/kg AML; P + AML 10: 2 g/kg P + 10 mg/kg AML.
aColumns with the same letters are not significantly different; columns with different letters indicate significant differences between the groups according to the Duncan test (α = 0.05). The results are the mean ± SD. All statistical comparisons were performed within the same column.
Molecular parameters
As shown in Figure 1(a), the mRNA expression of TNF-α increased 4.68 fold in the group treated with P compared to the control group (p < 0.001). Both doses of AML administration decreased the mRNA expression of TNF-α 8.64- and 8.46-fold compared to the group treated with P (p < 0.001). Similarly, the mRNA expression of TGF-β significantly increased (Figure 1(b)) in the group treated with P compared to the control group (10.78-fold; p < 0.001). In the AML-treated P groups, the mRNA expression of TGF-β decreased with both doses of AML (5 and 10 mg/kg) 13.01- and 10.07-fold compared to group treated with P, respectively. Both doses of AML were effective in decreasing this parameter when compared to the group treated with P groups.

TNF-α (a) and TGF-β (b) mRNA expression levels of the tissues treated with P and/or AML. ***p < 0.001 versus other groups. TNF-α: tumor necrosis factor-alpha; TGF-β: transforming growth factor-beta; AML: amlodipine; P: paracetamol.
Histopathological results
In the control group, regular healthy liver histology was seen (Figure 2(a)). In the livers of the group treated with P, thin severe inflammatory cell infiltration and gross necrosis of the entire centrilobular areas were obvious. In the hepatocytes of the group treated with P, hydropic degeneration was present. The perinuclear cytoplasm of the hepatocytes in this group was dense or cloudy, and the nucleus was abnormally shaped and basophilic stained. The group treated with P also exhibited central vein and sinusoidal congestion and hemorrhage (Figure 2(b)). The hepatocytes of the AML 10 group were similar to those of the control group, with control liver histology (Figure 2(c)). Similar findings were observed in the P + AML 5 (Figure 2(d)) and P + AML 10 (Figure 2(e)) groups, with the hepatocytes and sinusoids having a healthy appearance. The structure of the parenchyma was regular and contained typical Kupffer cells.

Light microscopic section of liver tissue in all groups (Dye: H&E). (A) Control—normal hepatocytes (arrow); sinusoids (s) and parenchyma with radial structure regularly were observed in control group sections (HAI: 0.00). (B): P—Severe inflammatory cell infiltration (spirally arrow), and gross necrosis of the entire centrilobular areas was evident in P group. Atypical hepatocytes with hydropic degeneration (arrow) with sinusoidal congestion (c) and hemorrhage were observed (HAI: 3.50). (C) AML 10—Typical hepatocytes (arrow) and sinusoids were observed (HAI: 0.00). (D) P+ AML 5 typical and (E) P + AML 10 Kupffer cell (arrowhead) —Photographs demonstrated regularly hepatocytes (arrow), sinusoids, and parenchyma with radial structure (HAI: 1.00). Central ven (v). AML: amlodipine; P: paracetamol; HAI: histological activity index; AML 10: 10 mg/kg AML; P + AML 5: 2 g/kg P + 5 mg/kg AML; P + AML 10: 2 g/kg P + 10 mg/kg AML; H&E: hematoxylin and eosin.
Immunohistochemical results
Immune staining for TNF-αTNF-α was not expressed in the cytoplasm of the hepatocytes of the control group (Figure 3(a)) or in the cytoplasm of the AML 10 (Figure 3(e)). It was also reduced clearly in the cytoplasm of the hepatocytes of the P + AML 5 group (Figure 3(c)) or in the P + AML 10 group (Figure 3(d)). TNF-α was expressed in the cytoplasm of the hepatocytes of P group (Figure 3(b)).

AML pretreatment prevents hepatocyte apoptosis induced by P. (A) Control group. We show regular parenchyma. Hepatocytes (arrow; original magnification: ×400). (B) Liver samples were collected P group. TNF-α positive hepatocytes (arrow head). (C) P + AML 5 group. Microphotograph shows typical parenchyma. Hepatocytes (arrow). (D) P + AML 10 group. Microphotograph shows normal parenchyma. Hepatocytes (arrow). (E) AML 10 group. AML: amlodipine; P: paracetamol; AML 10: 10 mg/kg AML; P + AML 5: 2 g/kg P + 5 mg/kg AML; P + AML 10: 2 g/kg P + 10 mg/kg AML.
Inflammation scoring results
The results also revealed larger HAI score of the P group (HAI score median: 3.50) compared to the control group (p < 0.05; Tables 3 and 4). AML treatment groups showed decreased HAI score than the P (p < 0.05; Tables 3 and 4).
Histological damage grade scores data (median ± SD).
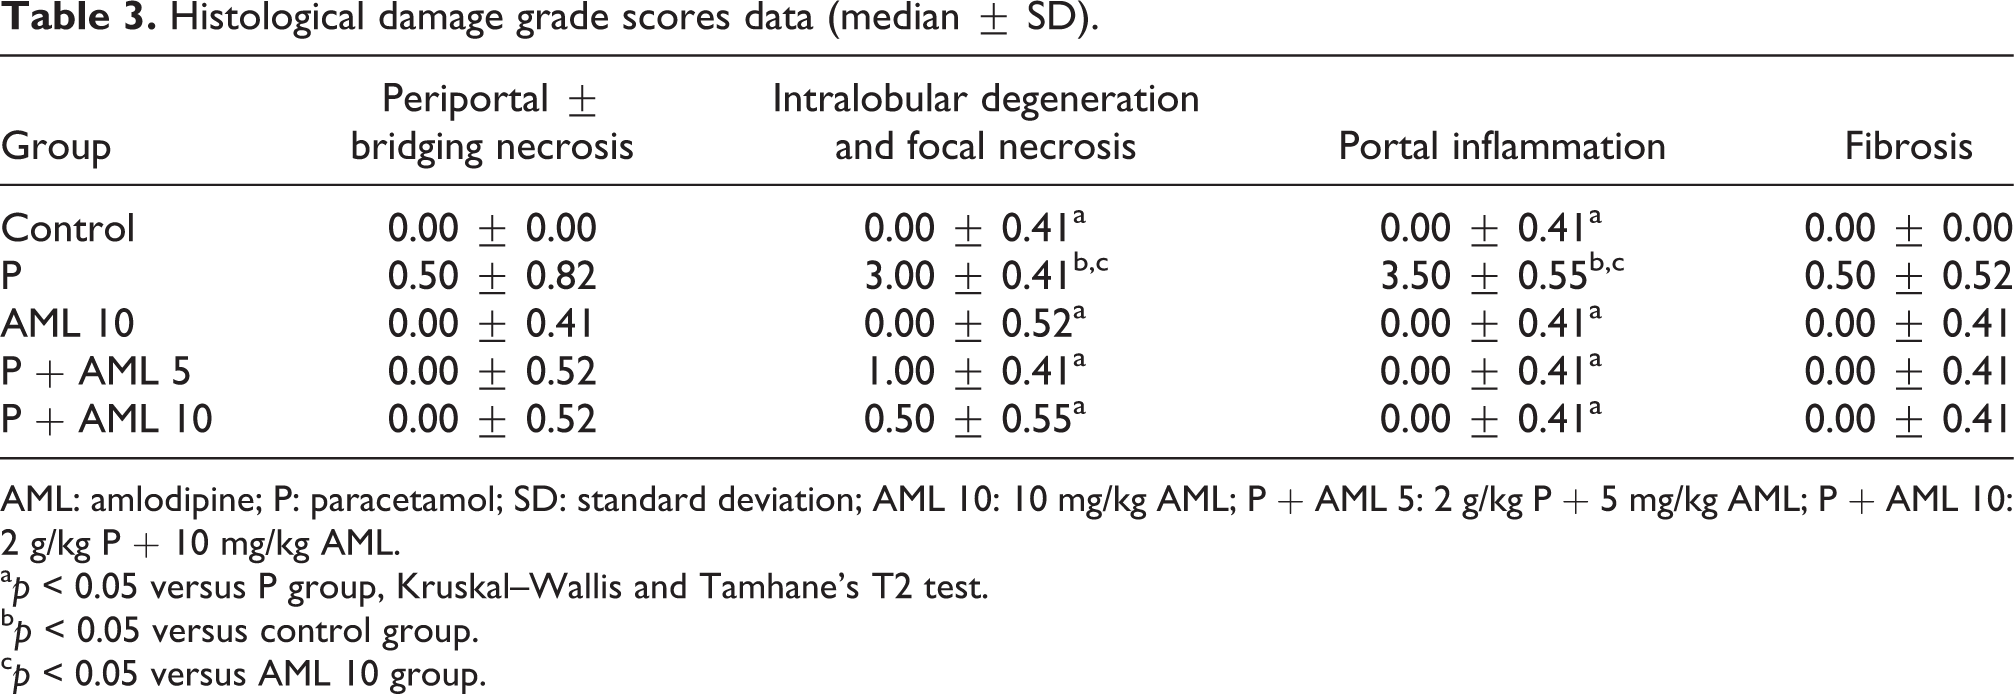
AML: amlodipine; P: paracetamol; SD: standard deviation; AML 10: 10 mg/kg AML; P + AML 5: 2 g/kg P + 5 mg/kg AML; P + AML 10: 2 g/kg P + 10 mg/kg AML.
a p < 0.05 versus P group, Kruskal–Wallis and Tamhane’s T2 test.
b p < 0.05 versus control group.
c p < 0.05 versus AML 10 group.
HAI scores data.
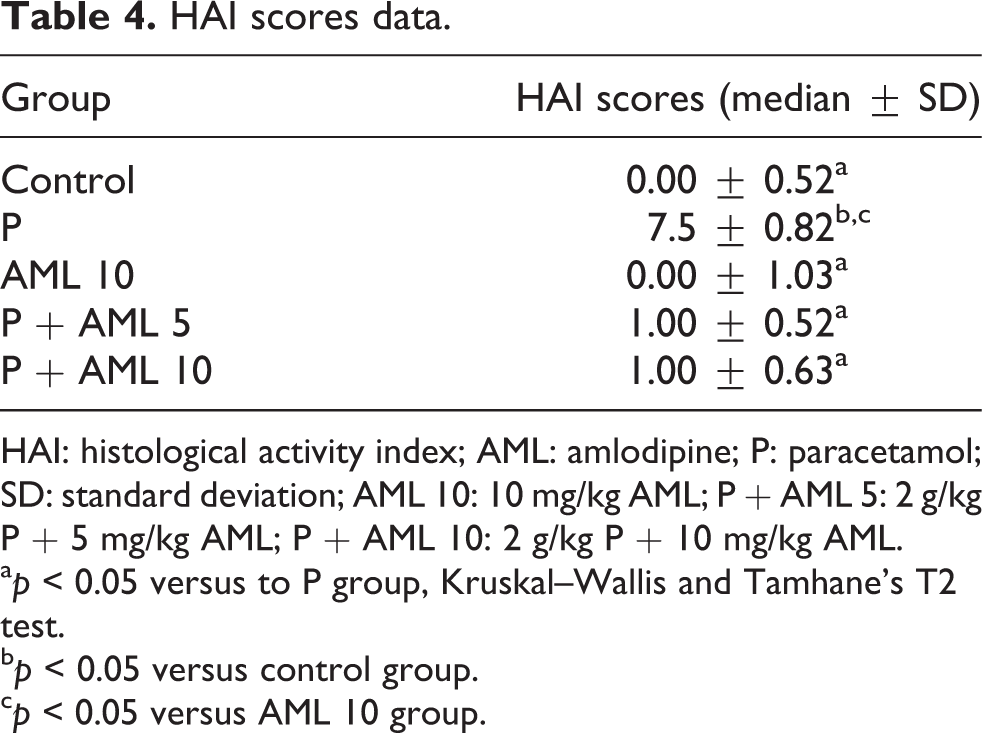
HAI: histological activity index; AML: amlodipine; P: paracetamol; SD: standard deviation; AML 10: 10 mg/kg AML; P + AML 5: 2 g/kg P + 5 mg/kg AML; P + AML 10: 2 g/kg P + 10 mg/kg AML.
a p < 0.05 versus to P group, Kruskal–Wallis and Tamhane’s T2 test.
b p < 0.05 versus control group.
c p < 0.05 versus AML 10 group.
Discussion
In this study, the hepatoprotective effect of AML was studied in P-induced hepatotoxicity model in rats. For this reason, two different doses of AML were administrated before P induction. After killing animals, ALT and AST liver enzyme activities; SOD, GSH, and MDA oxidative stress markers; and TNF-α and TGF-β mRNA expressions were measured. Also, in liver sections, hematoxylin and eosin (H&E) staining and TNF-α IHC study were performed and inflammation scoring was calculated.
The effect of AML, a calcium channel blocker, against P-induced hepatic damage in rats was studied in this study. P is commonly used as an analgesic and antipyretic agent. However, when used at high doses, P is known to cause liver damage in humans and in animal models. 26,33,34 P is metabolized mainly in the liver. At therapeutic doses, P is eliminated as nontoxic, major metabolites, such as glucuronic acid–sulfate conjugates. Only a small amount of P (less than 5%) is converted by the cytochrome P450 enzyme system (CYP2E1 and CYP 1A2) to the highly reactive metabolite NAPQI, which causes toxicity via the oxidative pathway. 8,35 Under normal conditions, this toxic metabolite is detoxified by the cellular defense molecule GSH. However, at therapeutic doses, the conjugation pathway is saturated. This leads to a decline in the levels of GSH and an increase in toxic reactive metabolites, which leads to tissue damage. 10,35
In the literature, a lot of papers about the P-induced hepatotoxicity can be seen. There are also a lot of studies about the prophylactic activity about different substances in P-induced hepatotoxicity. A recent study of Mohammed et al. was about the protective effect of AML, lisinopril, and allopurinol on P-induced hepatotoxicity. 36 In this study, single dose of these three drugs was administrated for 14 days and then P toxicity was induced. At the end some, oxidative stress parameters (TBAR, GSH, CAT, NOx, and MPO) and liver enzymes (ALT and AST) were measured and tissues were evaluated by H&E staining. But in our study, we focused only protective effect of AML in two different doses and in single administration according to dose–response rules. We also studied the difference on oxidative stress parameters and mRNA expressions of TNF-α and TGF-β by RT-PCR between these three doses. Another difference between the studies is that inflammation scoring was performed in H&E staining and immune-positivity of TNF-α was observed in TNF-α staining studies. From this perspective, this study has novelty.
ALT and AST levels should be determined first in an assessment of P-induced liver damage. These enzymes are sensitive biomarkers used for the diagnosis of liver diseases. 34 In studies of serum ALT and AST levels of animals, Karakus et al. and Grespan et al. reported that they were significantly increased in a P-induced toxicity group but decreased with treatment strategies. 34,37 In the present study, increased serum ALT and AST levels were observed in the P-induced toxicity group, and AML treatment significantly decreased ALT and AST levels compared to those in the P-induced toxicity group. These results suggest that AML treatment ameliorates hepatic damage.
In previous studies, a causative link between the inflammatory signals of cytokines such as TNF-α and the oxidative stress and liver damage was mentioned in P hepatotoxicity. 24,26 Oxidative stress induces hepatocyte damage and activates hepatic stellate cells (HSCs) and Kupffer cells that result in liver fibrosis. 38 P toxicity is believed to involve in production of ROS which can cause abstraction of a hydrogen atom from an unsaturated lipid and initiating lipid peroxidation. Peroxidation of lipids results in considerable changes in membrane structure and functions of the cell and causes DNA damage, cytotoxicity, and eventually cell death. 24
Other studies reported that antioxidant enzyme activities, inflammatory cytokines, histopathological evaluations, and levels of nonenzymatic oxidants, such as MDA, which is an end product of lipid peroxidation, could be used as markers of hepatic damage induced by P-induced toxicity. 24,25,34 Protecting cells against the harmful effects of superoxide radicals is a physiological role of SOD. Previous studies found decreased SOD levels in P toxicity-induced liver damage and increased levels with treatment options. 24,25,34 We obtained similar results in our study. Another study found that L-type calcium channel inhibitors reduced the activation of Kupffer cells, increased the viability of hepatocytes, and protected hepatocytes against superoxide-induced damage. 14 In addition, AML was shown to increase SOD activity and to have high antioxidant properties in tissues other than the liver. 39
MDA was evaluated in our study. Lipid peroxidation is an important mechanism of P-induced hepatotoxicity. It occurs due to free oxygen radicals and leads to changes in membrane structure, tissue damage, and failure of antioxidant defense mechanisms to prevent the formation of excessive free radicals. 40 Previous studies reported increased MDA levels in P-induced hepatotoxicity and that treatment options decreased MDA levels. 24,25 Coskun et al. demonstrated that AML treatment decreased MDA levels. 41 In the present study, MDA levels were increased in the P-induced toxicity groups, and the treatment with AML significantly reduced these levels.
GSH is a tripeptide nonenzymatic antioxidant, which plays a key role in the detoxification of NAPQI. NAPQI, as an oxidative mediator, is known to decrease GSH levels at high doses of P, resulting in an increase in lipid peroxidation. 35 Clinical and experimental studies reported that P overdoses depleted GSH levels and that treatment strategies increased GSH levels. 25,34 Similar to these studies, we found decreased levels of GSH due to P-induced toxicity increased following the AML treatment. These results suggest that AML prevents the depletion of GSH.
We also evaluated the expression of TNF-α in our study and the effect of AML treatment on the pathogenesis of P-induced toxicity. TNF-α is a proinflammatory cytokine that has an important role in immunity, inflammation, and apoptosis. 42 Excess calcium levels are one of the major causes of Kupffer cell activation. 11 TNF-α is secreted by activated Kupffer cells 43 and mediates innate immunity. 44 TNF-α is released by Kupffer cells following an overdose of P. 45 The hepatoprotective role of Kupffer cells in P toxicity is attributed to the production and release of TNF-α. 46 However, the precise role of TNF-α in P-induced hepatotoxicity is controversial. Although Simpson et al. indicated that TNF-α had no impact on hepatotoxicity, 47 Blazka et al. claimed that it contributed to hepatotoxicity. 48 Blazka et al. reported that clinical symptoms of liver disease, such as cirrhosis and inflammation, were associated with inflammatory cytokines, including TNF-α, IL-1α, and IL-6. 49,50 Many symptoms of liver diseases induced by inflammatory cytokine administration have been observed. 51 Blazka et al. reported that the increase in proinflammatory cytokines, such as TNF-α and IL-1, caused secondary hepatic damage, in addition to NAPQI-induced damage. 52 In experimental and clinical studies, elevated levels of TNF-α returned to normal following AML treatment. 53,54 In our study, the decreased levels of TNF-α with the AML treatment may have been due to the antioxidant and anti-inflammatory effects of AML or to the need for L-type channels for Kupffer cell activation, as previously described. 12,14
We evaluated the mRNA expression levels of another cytokine, TGF-β, synthesized by endothelial and Kupffer cells in the liver. 55 TGF-β is a multifunctional cytokine that regulates cell growth, differentiation, and matrix production. 56 Research has shown that it plays an important role in the regulation of physiological homeostasis. 57 and that increased TGF-β activity plays a major role in fibrotic diseases, characterized by excessive matrix material in the lung, kidney, liver, and other organs. 58 Research has shown that TGF-β regulated hepatic regeneration in the liver via inhibition of hepatocyte proliferation. It also increased the production of collagen by interacting with mesenchymal cells. TGF-β levels have been reported to increase after exposure to various toxic substances exposure. 59 TGF-β levels also increased in carbon tetrachloride–induced liver injury in mice and decreased following treatment with diethylcarbamazine. 60 AML treatment normalized increased TGF-β levels. 61 In the present study, P-induced hepatotoxicity increased the expression level of TGF-β and the AML treatment significantly decreased this level.
P toxicity-induced liver necrosis not only causes enzymatic changes but also leads to histopathological changes in the liver. Overdoses of P resulted in centrilobular necrosis. 62 We also observed severe necrotic foci in the liver of the P-induced group in our study, supporting the findings of earlier experimental studies. 25,34 In the present study, both doses of AML significantly prevented P-induced toxicity histopathologically. In the AML-treated P groups, the sequence of hepatocyte cords extending from the vena centralis in the parenchyma were quite different from the group treated with P and similar to those of the control group. These results indicated that AML treatment provided protection against P-induced hepatic injury in rats, enzymatically and histopathologically. Our inflammation scoring results were in accordance with histopathological results.
Conclusion
In conclusion, the results indicate that AML might have a protective role in P-induced hepatic damage. The protective effect of AML treatment was due to its positive impact on the oxidant/antioxidant balance and positive regulation of the expression of TNF-α and TGF-β. These results suggest that AML is a promising treatment for P-induced hepatotoxicity in the future.
Footnotes
Authors’ note
This research is included in the master thesis of Hilal Kaya and was conducted in the Laboratory of Pharmacology at Ataturk University, Faculty of Medicine, 25240 Erzurum/Turkey.
Declaration of Conflicting Interests
The author(s) declared no potential conflicts of interest with respect to the research, authorship, and/or publication of this article.
Funding
The author(s) received no financial support for the research, authorship, and/or publication of this article.