
Abstract
The geographical distribution of oesophageal cancer is linked to the exposure of fumonisin B1 (FB1), a mycotoxin produced by fungi that contaminates staple food worldwide. Non-genotoxic carcinogens like FB1 disturb homeostasis through increased cell proliferation or suppression of apoptosis. This study investigated the involvement of FB1 (0–20 μM) in spindle-shaped N-cadherin (+) CD45 (−) osteoblastic (SNO) cell death. Cell viability and death were assessed using the MTS and Annexin V-Fluos assays, respectively. Caspase activities were determined luminometrically and the comet assay assessed DNA damage. Induction of oxoguanine glycosylase 1 (OGG1) was measured using quantitative Polymerase Chain Reaction (qPCR), while cleaved poly (ADP-ribose) polymerase 1 (PARP-1) and Bax were determined by western blotting. Cell viability and PARP-1 cleavage were not affected by 1.25 μM FB1, but phosphatidylserine externalization, Bax protein expression, caspase activity, comet tail length and OGG1 transcripts were increased. The reduced cell viability in 10 μM FB1-treated cells was accompanied by corresponding increases in externalized phosphatidylserine, Bax, caspase-3/7 activity and cleaved PARP-1. The OGG1 transcripts were not significantly increased, but comet tails were increased. Bax, caspase-3/7 activities and cleaved PARP-1 were inhibited at 20 μM FB1. In addition, the OGG1 transcript levels were decreased (p < 0.0001) along with comet lengths (p < 0.0001). This study showed that FB1-induced apoptosis in SNO cells may be caspase-dependent or caspase-independent; the pathway used depends on the exposure concentration.
Introduction
The incidence of oesophageal cancer (OC) has been associated with mycotoxin exposure in South Africa (SA), Iran, Brazil and China. 1 –3 The incriminated culprit is fumonisin, a mycotoxin produced by contaminating fungi Fusarium verticillioides and Fusarium proliferatum that infect maize-based products worldwide. 2,4,5 Fumonisin B1 (FB1), the most abundant and toxic member of the family, has been detected in both commercial and home-grown maize products. 4 –6 However, consumption of home-grown maize results in higher exposure than if commercial maize was consumed. 4,5 While acute effects are not expected, carcinogenicity resulting from chronic exposure is of concern.
Cancer development involves the acquisition of several traits such as evasion of apoptosis, accompanied by increased proliferation and a disturbed homeostatic balance between life and death. 7 On the other hand, increased apoptosis may well result in compensatory cell proliferation that also results in cancer. 1,8,9 The biochemical mechanism of action of FB1 involves disruption of sphingolipid metabolism. 1 –3 FB1 is a structural analogue of sphingoid bases that competitively inhibits ceramide synthase resulting in an increase in sphinganine and sphingosine and a decrease in ceramide and complex sphingolipids. 10 These bioactive signalling molecules are the key mediators of apoptosis. Conversion to their 1-phosphate derivatives may confer resistance to stress-induced cell death. Indeed, several studies have shown that FB1 is an inducer of apoptosis, while others suggest that FB1 confers resistance to apoptosis. 10 –12
Induction of apoptosis by FB1 varies by cell type and species tested. Some studies show that the activation of the TNF-α pathway may induce apoptosis by initiator caspase-8 (extrinsic pathway) and executioner caspase-3 activation or DNA fragmentation, but induction does not involve p53 or Bcl-2 family proteins. 13 Other studies show that apoptosis is not induced by FB1 and that cells may in fact be protected from apoptosis following FB1 treatment, because the inhibitor of apoptosis (IAP) gene is upregulated. 13
Apoptosis may also be initiated intrinsically. Ultimately, the two pathways converge on the mitochondrion and the stress signal induces a conformational change in the pro-apoptotic Bax monomer that results in Bax polymerization. The Bax polymer inserts into the mitochondrial membrane and provides an outlet for the release of cytochrome C from the mitochondrion with the formation of an apoptosome and subsequent recruitment and activation of initiator caspase 9. Caspase 9 then cleaves and activates downstream executioner caspases 3 and 7 initiating a cascade of events that include cleavage of PARP-1 (cPARP) and DNA fragmentation (death cascade). 14
Tolleson et al. (1996) first reported apoptosis in human cells in vitro. 15 Seefelder et al. exposed human proximal tubule cells to 10 μM FB1 and reported activated caspase-3, chromatin condensation and DNA ladder formation that are consistent with increased apoptosis. 16 This is supported by a study that showed that HEK-293 cells were more sensitive to FB1-mediated apoptosis in the presence of DL-threo-dihydrosphingosine, a potent inhibitor of sphingosine kinase. 12 However, when immortalized keratinocytes were exposed to 20 μM FB1, an increase in sphingoid bases and their 1-phosphates occurred. 11 In addition, LLC-PK cells treated with 50 μM FB1 for 48 h resulted in increased sphingosine-1-phosphate (10) and FB1-inhibited apoptosis in HepG2 cells treated with 200 μM FB1. 17 Thus, treatment with higher FB1 concentrations may confer resistance to apoptosis.
Myburg et al. speculated that the concentration FB1 was an important factor influencing the cell death process in human oesophageal carcinoma (SNO) cells. 18 At lower FB1 concentrations (4 and 8 μM), morphological changes observed were associated with apoptosis and included features such as blebbing or vesiculation of the plasma membrane and smaller membrane-bound apoptotic bodies, and the treated cells broke up into smaller bodies with no swelling. Swelling as an indicator of necrosis appeared at higher concentrations (16 μM and above). The authors concluded that apoptosis was the likely mechanism of cell death at lower concentrations, whereas necrosis was the mechanism of death at higher concentrations of FB1. 18 However, the molecular events associated with these morphological observations were not studied.
While FB1 is not a genotoxic carcinogen, it does increase micronucleus frequency and single-strand DNA breaks as assessed by the comet assay in a range of human cell lines. 19,20 The immediate response to single-strand DNA breaks involves PARP-1 induction of DNA repair, termed base excision repair (BER), and occurs in four steps that include the recruitment of DNA glycosylase, apurinic/apyrimidinic (AP) endonuclease, DNA polymerase and DNA ligase. Oxoguanine glycosylase 1 (OGG1) is a DNA glycosylase that recognizes and removes the 8-oxyguanine (8-OH-G) that is formed following exposure to FB1. 21,22 cPARP by caspase-3/7 leads to its inactivation, and thus, DNA lesions are not repaired and the cell death process will proceed.
This study investigated the apoptotic-inducing potential of FB1 (0–20 µM) in human OC (SNO) cells. These concentrations were chosen based on cytotoxicity demonstrated at low FB1 concentrations (0–35 µM) in our laboratory 18,23 and is comparable to concentrations used by other researchers. 12,16,24 Kidney epithelial cells are sensitive to FB1-mediated toxicity. Increased apoptosis was observed in LLCPK cells exposed to 1 and 10 µM FB1 (24–72 h) and 25 µM FB1 for 48 h. 12,24 In addition, exposure of IHKE cells to 10 µM FB1 for 24 h resulted in increased cytotoxicity. 16 However, HEK-293 cells were resistant to FB1 12 and both normal liver and oesophageal cells proliferated in the presence of low FB1 concentrations (0–40 µM). 2,25
Materials and methods
Materials
The SNO cells were purchased from Highveld Biological (Johannesburg, SA) and FB1 from PROMEC (MRC, Cape Town, SA). Cell culture reagents and consumables were purchased from Whitehead Scientific (Johannesburg, SA) except foetal calf serum (Scientific Group, SA). Western blot and qPCR reagents were procured from Bio-Rad (Hercules, CA, USA), primers from Inqaba Biotec (Johannesburg, SA) and antibodies from Cell Signalling Technology (Johannesburg, SA). All other reagents were obtained from Merck (Johannesburg, SA).
Tissue culture
Confluent SNO cells (10% CCM – 10% foetal calf serum (Biochrom, UK), 1% penstrep fungizone and 1% L-glutamine in Lonza Eagles Minimum Essential Medium, 37°C) were treated with 1.25, 10 and 20 μM FB1, respectively, for 48 h. Untreated cells (CCM only) served as the control. The cells were washed with phosphate buffered saline and harvested by trypsinization. Cells were counted using the trypan blue method for utilization in the various assays.
MTS assay
Cell proliferation and viability were measured using the CellTiter AQ One Solution Cell Proliferation™ assay kit (Promega, Southampton, UK) which is a colorimetric method for determining the number of viable cells. The assay was performed according to the manufacturer’s instructions. Briefly, SNO cells were seeded in a 96-well microtiter plate (triplicate, 1 × 10⁵ cells/well) and allowed to grow overnight. Cells were treated with 1.25, 10 and 20 μM FB1, respectively, for 48 h. The treatment media were removed and replaced with 100 µl CCM and 20 μl of CellTiter AQ reagent (contains 3-(4,5-dimethylthiazol-2-yl)-5-(3-carboxymethyoxyphenyl)-2-(4-sulfophenyl)-2H-tetrazolium, inner salt (MTS) and phenazine ethosulfate) into the relevant sample wells and incubated for 4 h, before the absorbance was read at 492 nm using a BioTek µQuant plate reader (Bio-Tek Instruments Inc., USA).
Annexin V-fluos apoptosis assay
Externalized phosphatidylserine is an early marker of apoptosis that is routinely measured using the Annexin V-Fluos assay. Following the manufacturer’s instructions (BD Biosciences, SA), 1 × 10⁶ cells/treatment were incubated in cytometer tubes (15 min, room temperature (RT)) in 100 μl binding buffer containing Annexin-V-Fluos and propidium iodide, followed by the addition of 0.5 ml sheath fluid. The data were acquired using an FACSCalibur flow cytometer (BD Biosciences, SA) using the 488 nm excitation and 515 nm bandpass filters for fluorescein detection and analysed using CellQuest PRO v4.02.
Caspase assays
The luminescence-based Promega Caspase-Glo® 8, Caspase-Glo 9 and Caspase-Glo 3/7 assays (Southampton, UK) were used to measure the activities of the initiator caspase-8 and caspase-9 and effector caspases viz caspase-3/7 in SNO cells treated with FB1. The treated cells (1 × 10⁴) were aliquoted (50 µl) into duplicate wells of a 96-well luminometer plate. A blank containing cell culture medium was also prepared. The Caspase-Glo reagent (50 µl) was then added to each well. The contents of the wells were mixed by gentle agitation on an orbital shaker for 30 s. The plate was incubated (room temperature) for 30 min and read on a Modulus™ microplate reader (Turner BioSystems, USA).
Single cell gel electrophoresis (SCGE assay)
Three layers of low melting point agarose (LMPA) were prepared. All layers were coverslipped and allowed to solidify at 4°C for 10 min before application of the next layer as follows: the first layer was formed by adding 400 µl of 1% LMPA, the middle layer contained 25 µl of treated and stained (GelRed) cell suspension embedded in 175 µl of 0.5% LMPA and the third layer consisted of 300 µl of 0.5% LMPA. The gel sandwich was immersed in ice cold lysing solution (2.5 sodium chloride , 100 mM ethylenediaminetetraacetic acid (EDTA), 1% Tris (pH 10), 1% Triton X100 and 10% dimethyl sulfoxide ) for 1 h at 4°C. The slides were then placed in alkaline buffer (300 mM sodium hydroxide and 1 mM EDTA, pH 13) for 20 min to equilibrate before being electrophoresed at 25 V for 35 min. The slides were then washed three times (10 min intervals) with 0.4 M Tris (pH 7.4), then coverslipped before being visualized using the Olympus IX51 fluorescent microscope (Olympus Optical Co. Ltd., Japan). Images of 50 cells were captured using the analySIS 5 software and the tails of the cells were then measured and analysed.
qPCR
The triazol method was used to extract RNA from treated cells. The cells were lysed in triazol reagent (−80°C overnight). Chloroform was added to each of the lysed cell suspensions (RT, 3 min) and RNA was collected in the aqueous phase after centrifugation at 12,000 × g (4°C, 15 min), then precipitated by adding isopropanol (−80°C overnight). The pelleted RNA (12,000 × g, 4°C, 20 min) was washed in ethanol and air dried before solubilising 15 μl nuclease-free water (RT, 3 min). The RNA was quantified using the Nanodrop 2000 spectrophotometer (Thermo-Scientific, USA) and the A260/A280 was used to assess the purity of the RNA yield.
The Bio-Rad iScript™ cDNA synthesis kit was used to prepare cDNA from standardized RNA (700 ng/ml – 2 μl iScript reaction mix, 0.5 μl iScript reverse transcriptase, 5.5 μl nuclease free water and 4 μl RNA per sample). The reaction protocol (5 min at 25°C, 30 min at 42°C, 5 min at 85°C and a hold at 4°C) was performed using the GeneAmp PCR System 9700 (Applied Biosystems, USA).
The mRNA expression of OGG1 (forward 5′-GCATCGTACTCTAGCCTCCAC-3′; reverse 5′-AGGACTTTGCTCCCTCCAC-3′) was evaluated using 18 S as the housekeeping gene (sense: 5′-ACAGGGACAGGATTGACAGA-3′; antisense: 5′-CAAATCGCTCCACCAACCTAA-3′). The expression of each gene of interest was assessed using the Bio-Rad iTaq™ Universal SYBR® Green Supermix according to the manufacturer’s instructions (12.5 μl SYBR Green, 1 μl forward primer, 1 μl reverse primer, 9 μl nuclease-free water and 1.5 μl cDNA per sample). The Bio-Rad CFX96™ Real-Time system facilitated the initial denaturation at 95°C (4 min), followed by 37 cycles of denaturation (95°C, 15 s), annealing (40 s, 60°C) and extension (72°C, 30 s). Fold change in mRNA expression of OGG1 was analysed as described by Livak and Schmittgen. 26
Western blotting
Protein was isolated (cytobuster containing proteinase and phosphatase inhibitors), quantified (bichinchoninic acid assay), standardized and denatured in 5× Laemmli sample buffer (1:4, 100°C for 5 min). The protein was loaded into precast gels (10% resolving and 4% stacking), separated by sodium dodecyl sulphate polyacrylamide gel electrophoresis (SDS-PAGE) (150 V) and then transferred to nitrocellulose membrane (0.45 µm) using the Bio-Rad Transblot Turbo transfer system (2.5 A, 30 min) according to the manufacturer’s instructions. The membrane was blocked for 2 h with 5% BSA in tris-buffered saline and Tween 20 (TTBS). The primary antibody (rabbit anti-PARP-1 and rabbit anti-Bax; 1:1000 in 5% bovine serum albumin) was added to the membrane and incubated overnight. The primary antibody was removed, and the membrane was washed five times with TTBS (10 min per wash). After the final wash, the membrane was exposed to secondary antibody (anti-rabbit IgG 1:5000 in 5% BSA) for 1 h with agitation. The membrane was washed five times with TTBS, then visualized (400 µl LumiGLO chemiluminescent reagent, Bio-Rad). The membranes were stripped and probed for β-actin as described above.
Statistical analysis
All experiments were performed in triplicate and repeated to confirm the results obtained. Statistical analyses were performed using GraphPad Prism V5. A one-way analysis of variance was used, followed by the Tukey–Kramer multiple comparisons post-test. An unpaired Student’s t-test employing Welch’s correction was also done. The level of statistical significance was set at p < 0.05 for all tests.
Results
MTS
The cell viability was not altered relative to the control at 1.25 µM FB1 and only decreased by ±25% at both 10 and 20 μM FB1 exposures.Annexin
Externalization of phosphatidylserine, an early event in apoptosis, was significantly increased at all concentrations tested. A 1.4-fold and 1.5-fold increase occurred at 1.25 and 10 µM FB1, respectively.
Caspases
Since activation of caspases is associated with apoptosis, caspase-8 (Figure 3(a)), caspase-9 (Figure 3(b)) and caspase-3/7 (Figure 3(c)) activities were determined. Caspase-8 activity did not vary significantly from the control, except at the 20 µM treatment that decreased its activity by 33% (p = 0.0211). However, caspase-9 activity was significantly activated by 1.25 μM FB1 (p = 0.0337), but decreased at 10 μM FB1 and 20 μM FB1 (p = 0.0171). Caspase-3/7 activity was more than doubled at 1.25 μM FB1 (p = 0.0014) and 10 μM FB1 (p = 0.0052) exposure, but the 20 μM FB1 exposure did not differ significantly from the control after 48 h.
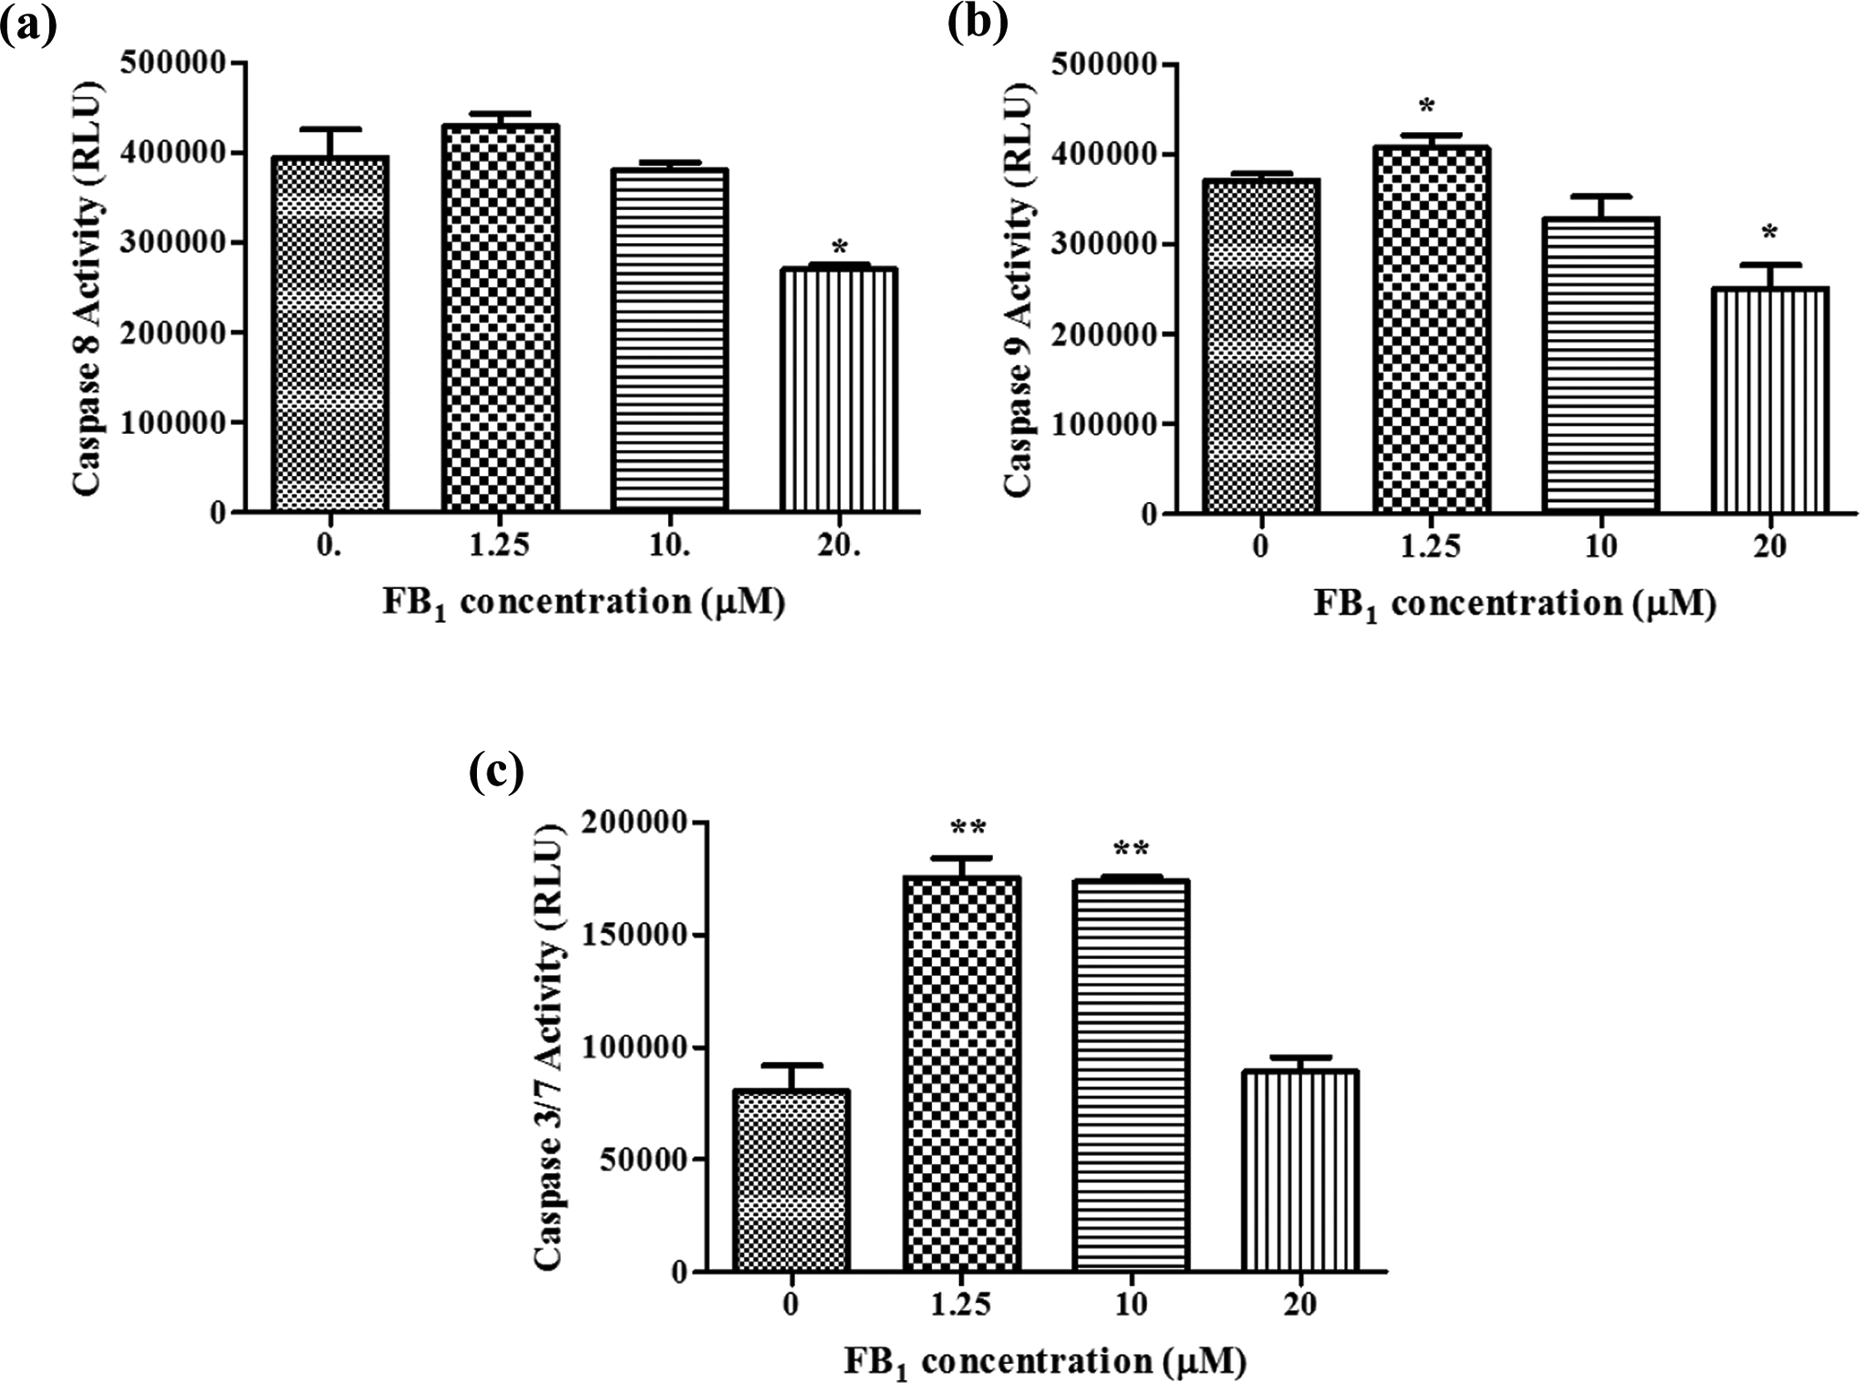
Initiator and executioner caspase activity after 48 h FB1 exposure. (a) Caspase-8 activity was similar to control at all concentration except 20 μM FB1 exposure that decreased significantly. (b) The 1.25 µM FB1 treatment increased caspase-9, but 10 and 20 µM treatments resulted in decreased activity of caspase-9. (c) Caspase-3 activity was ± doubled at all concentrations tested, except the 20 µM FB1 treatment. */** Treatments that were significantly different from the control. FB1: fumonisin B1.
SCGE
DNA migration from the nucleus to form comet tails occurred at all concentrations tested (Figure 4). The control measurement of 9.46 ± 2.16 is principally the comet head (intact nucleus) as no comet tails were seen. The 1.25 µM FB1 treatment caused a doubling in comet tail lengths, while the 10 and 20 µM FB1 exposures tripled comet tail lengths.

Comet tail lengths were increased at all concentrations following FB1 exposure. Unpaired Student’s t-test with Welch correction: ***p < 0.0001. FB1: fumonisin B1.
qPCR
The transcript levels of OGG1 were increased threefold at 1.25 μM FB1. No change occurred at 10 μM FB1 and a significant decrease was recorded for the 20 μM FB1 treatment.
Western blotting
Bax protein levels increased at all concentrations tested, while cPARP was significantly decreased at 20 µM FB1 exposure.
Discussion
It is generally accepted that FB1 is a non-genotoxic mycotoxin, because direct interaction with DNA has not been detected. 1,17 Both sustained cell proliferation following oncotic/apoptotic necrosis or the acquisition of apoptosis resistance in a subset of cells have been suggested to influence the ability of non-genotoxic mycotoxins to induce tumours. 1,7 –9 Several studies have reported both apoptotic-inducing and inhibiting effects of FB1. 12,15 –17,19,24 These observations are dependent on the concentration of FB1 applied. We have previously reported morphological alterations in FB1-treated SNO cells that may be consistent with apoptosis. 18 This study showed that FB1 induced apoptosis in SNO cells by different mechanisms that were concentration dependent.
Cell viability at 1.25 µM FB1 is similar to the control, but decreases at the 10 and 20 µM FB1 treatments (Figure 1). This is in agreement with other studies that reported FB1 inhibition of cell proliferation. 25,27 –29 Anti-proliferative effects of FB1 reported in human hepatoma cells (<26%; 25) and SF-9 cells (approximately 20%; 29) are similar to results in Figure 1 of this study. The decreased viability may be associated with decreased metabolic activity or increased cell death.

FB1 had no effect on percentage cell viability at 1.25 μM, but decreased percentage cell viability at 10 and 20 μM exposures. Unpaired Student’s t-test with Welch correction: **p = 0.0002 and ***p = 0.0085. FB1: fumonisin B1.
Externalized phosphatidylserine (early marker, Figure 2) and the presence of DNA comet tails (late marker, Figure 4) were increased at all concentrations tested, which confirmed that these FB1-exposed cells are primed for death by apoptosis. This is in agreement with several studies that show increased apoptosis after administration of FB1. 15,19,24,30,31

FB1 increased apoptosis at all concentrations tested. Unpaired Student’s t-test with Welch correction: 1.25 μM FB1 – ***p = 0.0001; 10 μM FB1 – ***p < 0.0001; 20 μM FB1 – *p = 0.0294. FB1: fumonisin B1.
A key feature of apoptosis is the cascade of caspase activation that marks the beginning of both the intrinsic and extrinsic pathways and culminates in the execution of apoptosis. 14 Caspase-8 is an initiator caspase that is activated following the ligation of a death receptor. 14 Caspase-8 activity was not significantly increased at 1.25 µM exposure, did not decrease significantly at 10 µM and subsequently decreased significantly at 20 µM FB1 treatment (Figure 3(a)), suggesting that apoptosis was not initiated via the extrinsic pathway at 10 and 20 µM FB1 exposures.
Caspase-8 functions to cleave and activate downstream effector caspases or cleave Bid to truncated Bid (tBid). 14,32 Recruitment and activation of Bax are accomplished by tBid (extrinsic pathway) or p53 (intrinsic pathway). 14,32 In this study, Bax, a pro-apoptotic member of the Bcl-2 family of proteins, was activated at all FB1 concentrations (Figure 6(a)) and corresponds to phosphatidylserine externalization that also occurred at all concentrations tested (Figure 2). However, caspase-8 could only contribute to Bax activation at 1.25 µM FB1, since it was decreased at the other concentrations (Figure 3(a)). Thus, Bax activation could have been via the intrinsic apoptotic pathway. 14 The insertion of Bax into the mitochondrial membrane facilitates the formation of pores that are necessary for cytochrome c, Smac/DIABLO, apoptosis-inducing factor (AIF) and endonuclease G extrusion into the cytoplasm. 14,32

Protein expression of Bax and cleaved PARP was increased at all concentrations. (a) Unpaired Student’s t-test with Welch correction: Bax: ***p = 0.0006, ** p = 0.0062 and *p = 0.0280; cPARP: *p = 0.0147 and ***p < 0.0003. cPARP: cleavage of PARP-1.
Cytochrome c initiates apoptosome formation that is essential for the cleavage of procaspase-9 into active caspase-9. 14 Increased caspase-9 activity in the 1.25 µM treatment (Figure 3(b)) indicates that apoptosome formation resulted in the cleavage of procaspase-9 to caspase-9. This did not occur at 10 and 20 µM exposure where caspase-9 activity was decreased even though Bax levels were increased. It is possible that the apoptosome did not form, caspase-9 was degraded or caspase-9 is inhibited by IAPs in the cytoplasm. Hajra and Lui (2004) proposed that the disruption of normal apoptosome formation and function may lead to tumour development and progression. 33 In addition, a recent study by Chuturgoon et al. showed that 200 μM FB1 caused a sevenfold decrease in Smac/DIABLO in HepG2-treated cells and upregulation of the IAP Birc-8 at the gene and protein levels. 17 This mechanism will also result in inhibition of caspase-3/7.
Activated caspase-8 and caspase-9 cleaves and activates procaspase-3/7. Caspase-3/7 is executioner caspases and activation marks the beginning of the death cascade. 14 In this study, caspase-3/7 was increased at 1.25 and 10 μM FB1 concentration (Figure 3(c)) and is in agreement with several studies that showed that FB1 induces apoptosis by activating caspase-3. 16,24,30,31 Despite the low activity recorded for the upstream initiator caspases, and in agreement with the study by Seefelder et al., 16 caspase-3/7 was activated at 10 µM FB1 exposure (Figure 3(c)). In the 20 μM FB1 treatment, none of the caspases were activated (Figure 3).
Activation of caspase-3/7 is responsible for the cPARP into 89 and 24 kDa cPARP fragments. 34 However, activated caspase-3/7 did not result in cPARP for the 1.25 μM treatment as was expected, but cPARP was increased at 10 µM FB1 and decreased at 20 µM FB1 (Figure 6(b)). Decreased cPARP (increased full-length PARP) at 20 µM FB1 was expected, since active caspase-3/7 is necessary for its cleavage. Apoptosis is a tightly regulated process. The intrinsic pathway is partly regulated by a relationship that exists between IAPs and Smac/DIABLO. The IAPs bind the catalytic site and inhibit caspase-9 activity and caspase-3/7 activity. Smac/DIABLO, a pro-apoptotic protein that resides in the mitochondrial intermembrane space and is released with cytochrome c following Bax-induced pore formation, competitively inhibits the IAPs. The failure to cleave PARP in the 1.25 µM FB1 treatment may be due to inhibition of caspase-3/7 by IAPs. It has been shown that IAPs are upregulated, while Smac/DIABLO is downregulated following exposure of HepG2 cells to FB1. 17
PARP-1 is inactive in its cleaved state and is associated with increased DNA damage; cPARP activates an endonuclease that cleaves DNA into 200 base pair fragments. 34 This could explain the increased comet tail lengths at 1.25 and 10 µM FB1 (Figure 4) and is in agreement with a study by Gopee et al. that showed increased DNA damage associated with caspase-3 and cleaved PARP-1. 24 In addition, caspase-3/7 is also responsible for the activation of caspase-activated DNase and may have contributed to the increased DNA fragmentation at 1.25 and 10 µM FB1 (Figure 4).
Failure to activate the initiator and executioner caspases (Figure 3) or cleave PARP-1 (Figure 6(b)) does not dispute that 20 µM FB1 can induce apoptosis, since phosphatidylserine externalization (Figure 2) and increased comets (Figure 4) suggest that apoptosis is occurring. In the absence of caspase activation, cells can submit to caspase-independent cell death. 14 During caspase-independent apoptosis, DNA fragmentation is achieved by AIF and endonuclease G, which are released from apoptotic mitochondria (those with pores formed by Bax); Bax protein levels were increased at 20 µM FB1 (Figure 6(a)). However, it is also possible that in the absence of caspase activation, the cells may be protected from apoptosis by various means, allowing for continued proliferation of cells that were once destined to die. Failure of apoptosis is associated with various diseases including cancer 14,33,35 and may be the mechanism by which FB1 initiates OC.
The alkaline comet assay is also able to detect oxidative DNA damage. 36 It is therefore possible that the increased comet tails (Figure 4) were due to oxidative DNA damage that resulted in the formation of 8-OH-dG. It has been demonstrated that FB1 increased 8-OH-dG in rat C6 glioma cells. 37 The presence of 8-OH-G can induce DNA hypomethylation by inhibiting DNA methylation on nearby cytosine bases, and therefore has implications for gene stability and cancer. 22 The DNA glycosylase, OGG1, recognizes and removes 8-OH-G that is base-paired with cytosine. 22 Increased OGG1 transcripts at 1.25 µM FB1 (Figure 5) suggest that OGG1 is upregulated in an effort to repair the damaged DNA. However, OGG1 levels were similar to the control at 10 µM FB1 and significantly decreased at 20 µM FB1 (Figure 5). At 10 µM FB1, increased cPARP (Figure 6(b)) contributes to the DNA damage seen in Figure 4. In addition, increased cPARP is associated with decreased OGG1 (Figure 5) to control levels and indicates that DNA repair mechanisms were not activated. The full-length PARP is critical for the response to DNA damage by initiating BER mechanisms including DNA glycosylase activation. 34

Relative expression levels of OGG1 were increased at 1.25 μM FB1 and decreased at 20 μM FB1 exposures. Unpaired Student’s t-test with Welch correction: **p = 0.0014 and ***p < 0.0001. OGG1: oxoguanine glycosylase 1; FB1: fumonisin B1.
Conclusion
FB1 primes SNO cells for apoptosis as evidenced by decreased viability, phosphatidylserine externalization, increased Bax protein expression and DNA fragmentation. Caspase-dependent apoptosis is initiated at 1.25 and 10 µM FB1 (increased caspase activity and cPARP), but execution at 20 µM FB1 is possibly mediated by a caspase-independent pathway (decreased caspase activity and cPARP).
Footnotes
Declaration of Conflicting Interests
The author(s) declared no potential conflicts of interest with respect to the research, authorship, and/or publication of this article.
Funding
The author(s) disclosed receipt of the following financial support for the research, authorship, and/or publication of this article: The authors received funding from the National Research Foundation (Thuthuka) and the College of Health Sciences (University of KwaZulu Natal).