
Abstract
Drug-induced autoimmunity (DIA) refers to a group of adverse drug reactions, and they remain unpredictable largely due to the limited understanding of the mechanisms involved. There is evidence that procainamide can cause autoimmune reactions in humans but the mechanisms involved remain unclear. To examine the cellular and genetic factors involved in the procainamide-induced autoimmune response, we compared rats that are genetically T-helper (Th)2-predisposed (Brown Norway (BN)), Th1-predisposed (Lewis (LEW)) or not genetically predisposed (Sprague Dawley (SD)). We revealed significant differences in response to autoimmunity induced by procainamide among three strains rats, BN was the most sensitive one, SD exhibited less sensitive, while LEW resistance to procainamide. Much more pronounced of Th2-type responses and more complex differentially expressed genes involved in immune regulation and response in BN might contribute to its susceptibleness to DIA. Moreover, similar immune mechanisms were found between BN and SD, which suggesting that these changes would serve as the potential bridge biomarkers to predict DIA among species. This study may also benefit to further understand the toxicological mechanism of drug-induced autoimmune reactions.
Introduction
Drug-induced autoimmunity (DIA) is a side effect of long-term therapy with over 80 types of medications. Its clinical and laboratory features are similar to systemic lupus erythematosus (SLE). DIA can be severe, even life threatening, thus representing a significant clinical problem. They also present a challenge to the pharmaceutical industry by adding an additional level of uncertainty to new drug development. As an idiosyncratic drug reaction, DIA do not occur in most patients. 1 Although there is a significant genetic predisposition to the development of DIA in humans, it is still difficult to localize and ultimately identify the genes coding for this predisposition in genetically heterogeneous human populations. Large studies are required to obtain meaningful results.
The understanding of the mechanisms of immune tolerance and the unraveling of genetic predisposition of autoimmune diseases rely on animal models. Penicillamine-induced autoimmunity in Brown Norway (BN) rats represents an important model for the mechanistic study of DIA, because it mirrors the variety of autoimmune reactions it can cause in humans 2 : both can involve the presence of antinuclear antibodies (ANAs), a skin rash, deposits of immunoglobulin G (IgG) along the glomerular basement membrane, arthritis, hepatic necrosis, and weight loss. 3,4 Penicillamine-induced autoimmunity in rats is also idiosyncratic: it is strain specific—treatment of Lewis (LEW) and Sprague Dawley (SD) rats does not induce autoimmunity.
Previous studies have revealed that BN and LEW rats are extremes with respect to their polarization of the immune response as well as their susceptibility to autoimmune diseases. 5 LEW rats are susceptible to experimental organ-specific autoimmune diseases such as experimental autoimmune encephalomyelitis. 6 These types of diseases are mediated by T-helper (Th)1-dominant immune responses. 7 –9 In contrast to Th1-dominant immunity induced in LEW rats, BN rats are susceptible to experimental systemic autoimmune diseases such as mercuric chloride–induced autoimmune disease 10 and penicillamine-induced autoimmunity, 11 which are related to Th2-dominant immune responses. 12 At present, although the SD rat is not Th2 predisposed, it still was able to respond in a Th2-like way to certain antigens. 13 These data strongly suggest that genetic background determines the nature of the induced immune responses and leads to a high susceptibility of certain types of diseases. 14 In this context, it is vital to get detailed information about the differences among BN, LEW, and SD rats with respect to their susceptibility to drug-induced autoimmune diseases and the cellular and genetic factors that may be involved in these differences.
Over 80 drugs have been implicated in DIA, by far procainamide poses the greatest risk for development of this syndrome with an annual incidence of ∼20% among treated patients. 15,16 Most patients treated with procainamide develop histone-reactive antibodies and antidenatured DNA (anti-dDNA) antibodies after prolonged therapy. 17 Numerous studies have been undertaken to explore how procainamide induces autoimmunity but the mechanisms involved remain unclear.
Toxicological research for human requires model animals. To further understand the immune mechanism of drug-induced autoimmune reaction, different responses of BN, SD, and LEW to procainamide were first analyzed in different levels of immune systems such as gene, protein, cell, and organ levels to explore the relative contributions of cellular and genetic factors to the development of autoimmune disease induced by drug. The results may also provide a scientific basis for the high sensitivity of BN rats in predicting immunotoxicity in preclinical studies.
Materials and methods
Animals
Male, 7-week-old BN, SD, and LEW rats were obtained from Beijing Vital River Laboratory Animal Technology Co. Ltd (licensed by Beijing Administrative Office of Laboratory Animal, China). All animals were bred specific pathogen-free and kept in polycarbonate cages under conditions of 22 °C, 40∼70% relative humidity and 12 h light–dark cycle. Standard rodent diet and water were available ad libitum throughout the study. Rats were housed three per cage. Animal procedures were approved by the Institutional Animal Care and Use Committee of National Institute for Food and Drug Control, China (Permit Number: 2013-085).
Chemicals, antibodies, and kits
Procainamide was purchased from Enzo Life Sciences Inc. (Farmingdale, New York, USA). ELISA kits for the detection of specific ANAs were purchased from Corgenix Medical Corporation (Broomfield, Colorado, USA). Luminex kits were purchased from Millipore (Billerica, Massachusetts, United States). Antibodies used in this study were Anti-Rat CD4 FITC, Anti-Rat CD3 FITC, Anti-Rat CD45 R (B220) PE-Cyanine7, Anti-Rat CD86 (B7-2) PE, Anti-Rat CD25 PE, Anti-Rat CD11b/c PerCP-eFluor 710. These antibodies were purchased from eBioscience (San Diego, California, USA).
Procainamide treatment
After a week of acclimatization, each strain of rats was randomly divided into three groups (five animals per group) including normal saline (NS) control group and two procainamide groups (treated with 10 mg/kg or 40 mg/kg of procainamide). No contaminants were detected in the batch of procainamide used in this study. All animals were administered NS or procainamide by tail intravenous injection three times per week for eight consecutive weeks.
Determination of ANAs
Blood samples were drawn via venous sinus of eye during procainamide treatment of male BN rats at days 14, 21, 28, 35, and 56. Blood samples were allowed to clot for 2 h at room temperature before centrifuging for 20 min at approximately 2000g. Sera were aliquoted and stored at −80 °C. Serum ANA levels were determined by ELISA.
Dissection for microarray test and histopathology examination
All rats were killed at the end of experiment. The animals were euthanized by carbon dioxide/oxygen exposure, weighed, and exsanguinated. The spleen of each rat was dissected and weighed. About one-third of the spleen of each rat was immediately collected in RNA stabilization reagent (RNALater, Qiagen, Hilden, Germany) and stored at −80 °C until further microarray test. Also, one-third of the spleen of each rat was collected for further phenotype analysis by flow cytometry. The remaining spleen samples of each rat fixed in 10% (v/v) neutral buffered formalin were embedded in paraffin, sectioned (3 mm thickness) and stained with hematoxylin and eosin for light microscopic observations. The results of histopathology examination minced were reviewed by two certified pathologists.
Cell preparation and flow cytometry
On necropsy day, single-cell suspensions free of red blood cells were prepared from the spleens as described. Briefly, rats were killed and the spleen samples were removed and flushed in cold phosphate buffered saline to remove any blood. Purified spleen cells were obtained by grinding and passing the minced spleen tissue through a stainless steel mesh and subsequently performing centrifugation at 1000 r/min for 5 min. After removing the supernatant, red cells were lysed by hypotonic treatment and the remaining cells were washed and resuspended. For the detection of T- and B-cell subsets, the cells were incubated with monoclonal antibody (eBioscience) for 30 min and then were centrifuged. Stained cells were all analyzed by flow cytometry (FACS Callibur; BD, San Jose, California, USA), and data were analyzed by FlowJo software [FlowJo 7.6].
Profiling cytokines/chemokines
Male BN, SD, and LEW rats were treated with procainamide, and blood samples were drawn via venous sinus of eye at the end of treatment. Serum was isolated as described above. A Luminex assay of 12 cytokines/chemokines (Granulocyte colony-stimulating factor, macrophage inflammatory protein-1α, interleukin (IL)-1α, IL-1β, IL-4, IL-5, IL-6, IL-10, IL-17α, interferon (IFN)-γ, tumor necrosis factor-α, IL-12p70) was performed to determine the overall pattern of serum cytokines/chemokines after the procainamide treatment using the protocol provided by the manufacturer.
RNA isolation and processing
Total RNA was isolated using Trizol reagent (Invitrogen, Carlsbad, California, USA) according to the manufacturer’s instructions. The quantity of RNA in each sample was assessed spectrophotometrically (NanoDrop Technologies, Wilmington, Delaware, USA) and RNA integrity was assessed by formaldehyde agarose gel electrophoresis. Five RNA samples of each group were selected for subsequent microarray analysis.
Labeling, hybridization, and scanning
RNA was amplified and labeled using Agilent Low Input Quick Amp Labeling Kit (Agilent, Santa Clara, USA). Then, fluorescence dye-labeled cRNA was hybridized to an Agilent Rat Whole Genome 8x60 K array. Hybridization, scanning, and washing were performed on Agilent’s Microarray Platform according to Agilent’s Standard Protocols. The array data were analyzed with Agilent Feature Extraction software [Versions: 10.7]. After global mean normalization, probes with intensity <400 were removed for further analysis. Considering that there were five replicates for control and treatment groups, Significance Analysis of Microarrays (SAM) software was used to find differentially expressed genes (DEGs) with threshold set at fold change >1.5 and q value <0.05. The DEGs were further analyzed on significant enrichment of Gene Ontology (GO) terms using hypergeometric distribution in the R language package software.
Statistical analysis
For conventional toxicological parameters, the results are expressed as mean ± SD. Sample distribution was first tested for normality using the Bartlett’s test. Then, statistical analysis of data was performed using analysis of variance for comparison of differences between group mean values. The level of statistics significance for all tests was the p < 0.05 level. For gene expression data, SAM software and R language package software were used to find DEGs and further GO terms analysis as mentioned above.
Results
Serum levels of ANA during procainamide treatment
The result of ANA test showed that antibody level of BN rats receiving 40 mg/kg of procainamide began to increase (p < 0.05) from day 28 onward and an increase trend was also observed in 10 mg/kg group. For day 35 of treatment, it showed significantly increasing ANA level in 10 mg/kg and 40 mg/kg groups when compared to the control groups (p < 0.05 or p < 0.01), suggesting the changes in ANA had associated with the time and dosage of administration (Figure 1(a)). It was also found that ANA were markedly elevated in SD rats treated with 40 mg/kg procainamide (day 35), whereas the elevated appeared earlier in BN rats, and the magnitude of its increase was much higher than that of SD rats (Figure 1(a) and (b)). No significant changes in serum ANA were observed between the treatment groups and control in LEW rats.

Changes of serum ANA in BN (A) and SD (B) rats that were treated with 10 mg/kg or 40 mg/kg procainamide (n = 5) for 8 weeks. Statistically significant differences comparing with values of control group are highlighted by asterisks (*p < 0.05, **p < 0.01). Asterisks (*) indicate a statistical significance between the control group and the procainamide-treated groups. BN: Brown Norway; SD: Sprague Dawley; ANA: antinuclear antibody.
Spleen weights and histopathology examination
The spleen weights and histopathology examination of spleens of all animals was performed after 56 days of treatment with procainamide. The absolute and relative weights of spleens of all animals are shown in Figure 2. Compared with the control group, significant differences were noted in 10 mg/kg and 40 mg/kg procainamide-treated groups in BN rats after statistical analysis, which indicated an obvious dose-dependence (p < 0.01; Figure 2). In the SD rats, the absolute and relative weights of spleens were also increased in 40 mg/kg group when compared to the NS control (p < 0.01; Figure 2). Histopathological analysis indicated that in BN rats, four out of five animals given 10 mg/kg procainamide and all five animals given 40 mg/kg procainamide had spleen lesions (Figure 3(d)), which were characterized by tingible body macrophages increased in splenic white pulp. After treatment, two out of five SD rats given 10 mg/kg procainamide and all five SD rats given 40 mg/kg procainamide had spleen lesions (Figure 3(h)), as the spleen lesions were characterized by lymphatic nuclear division phase number increased, which were histologically distinguishable from those described for procainamide-treated BN rats. No significant changes in spleen weight and lesions were observed in 10 mg/kg and 40 mg/kg procainamide groups compared with NS control group in LEW rats.

The absolute (A) and relative weights (B) of spleens in three different rat strains treated with NS control, 10 mg/kg or 40 mg/kg procainamide (n = 5), 8 weeks after procainamide/NS treatment. Data are presented as the mean ± SD. **Value significantly different from rats treated with NS control (p < 0·01). NS: normal saline.
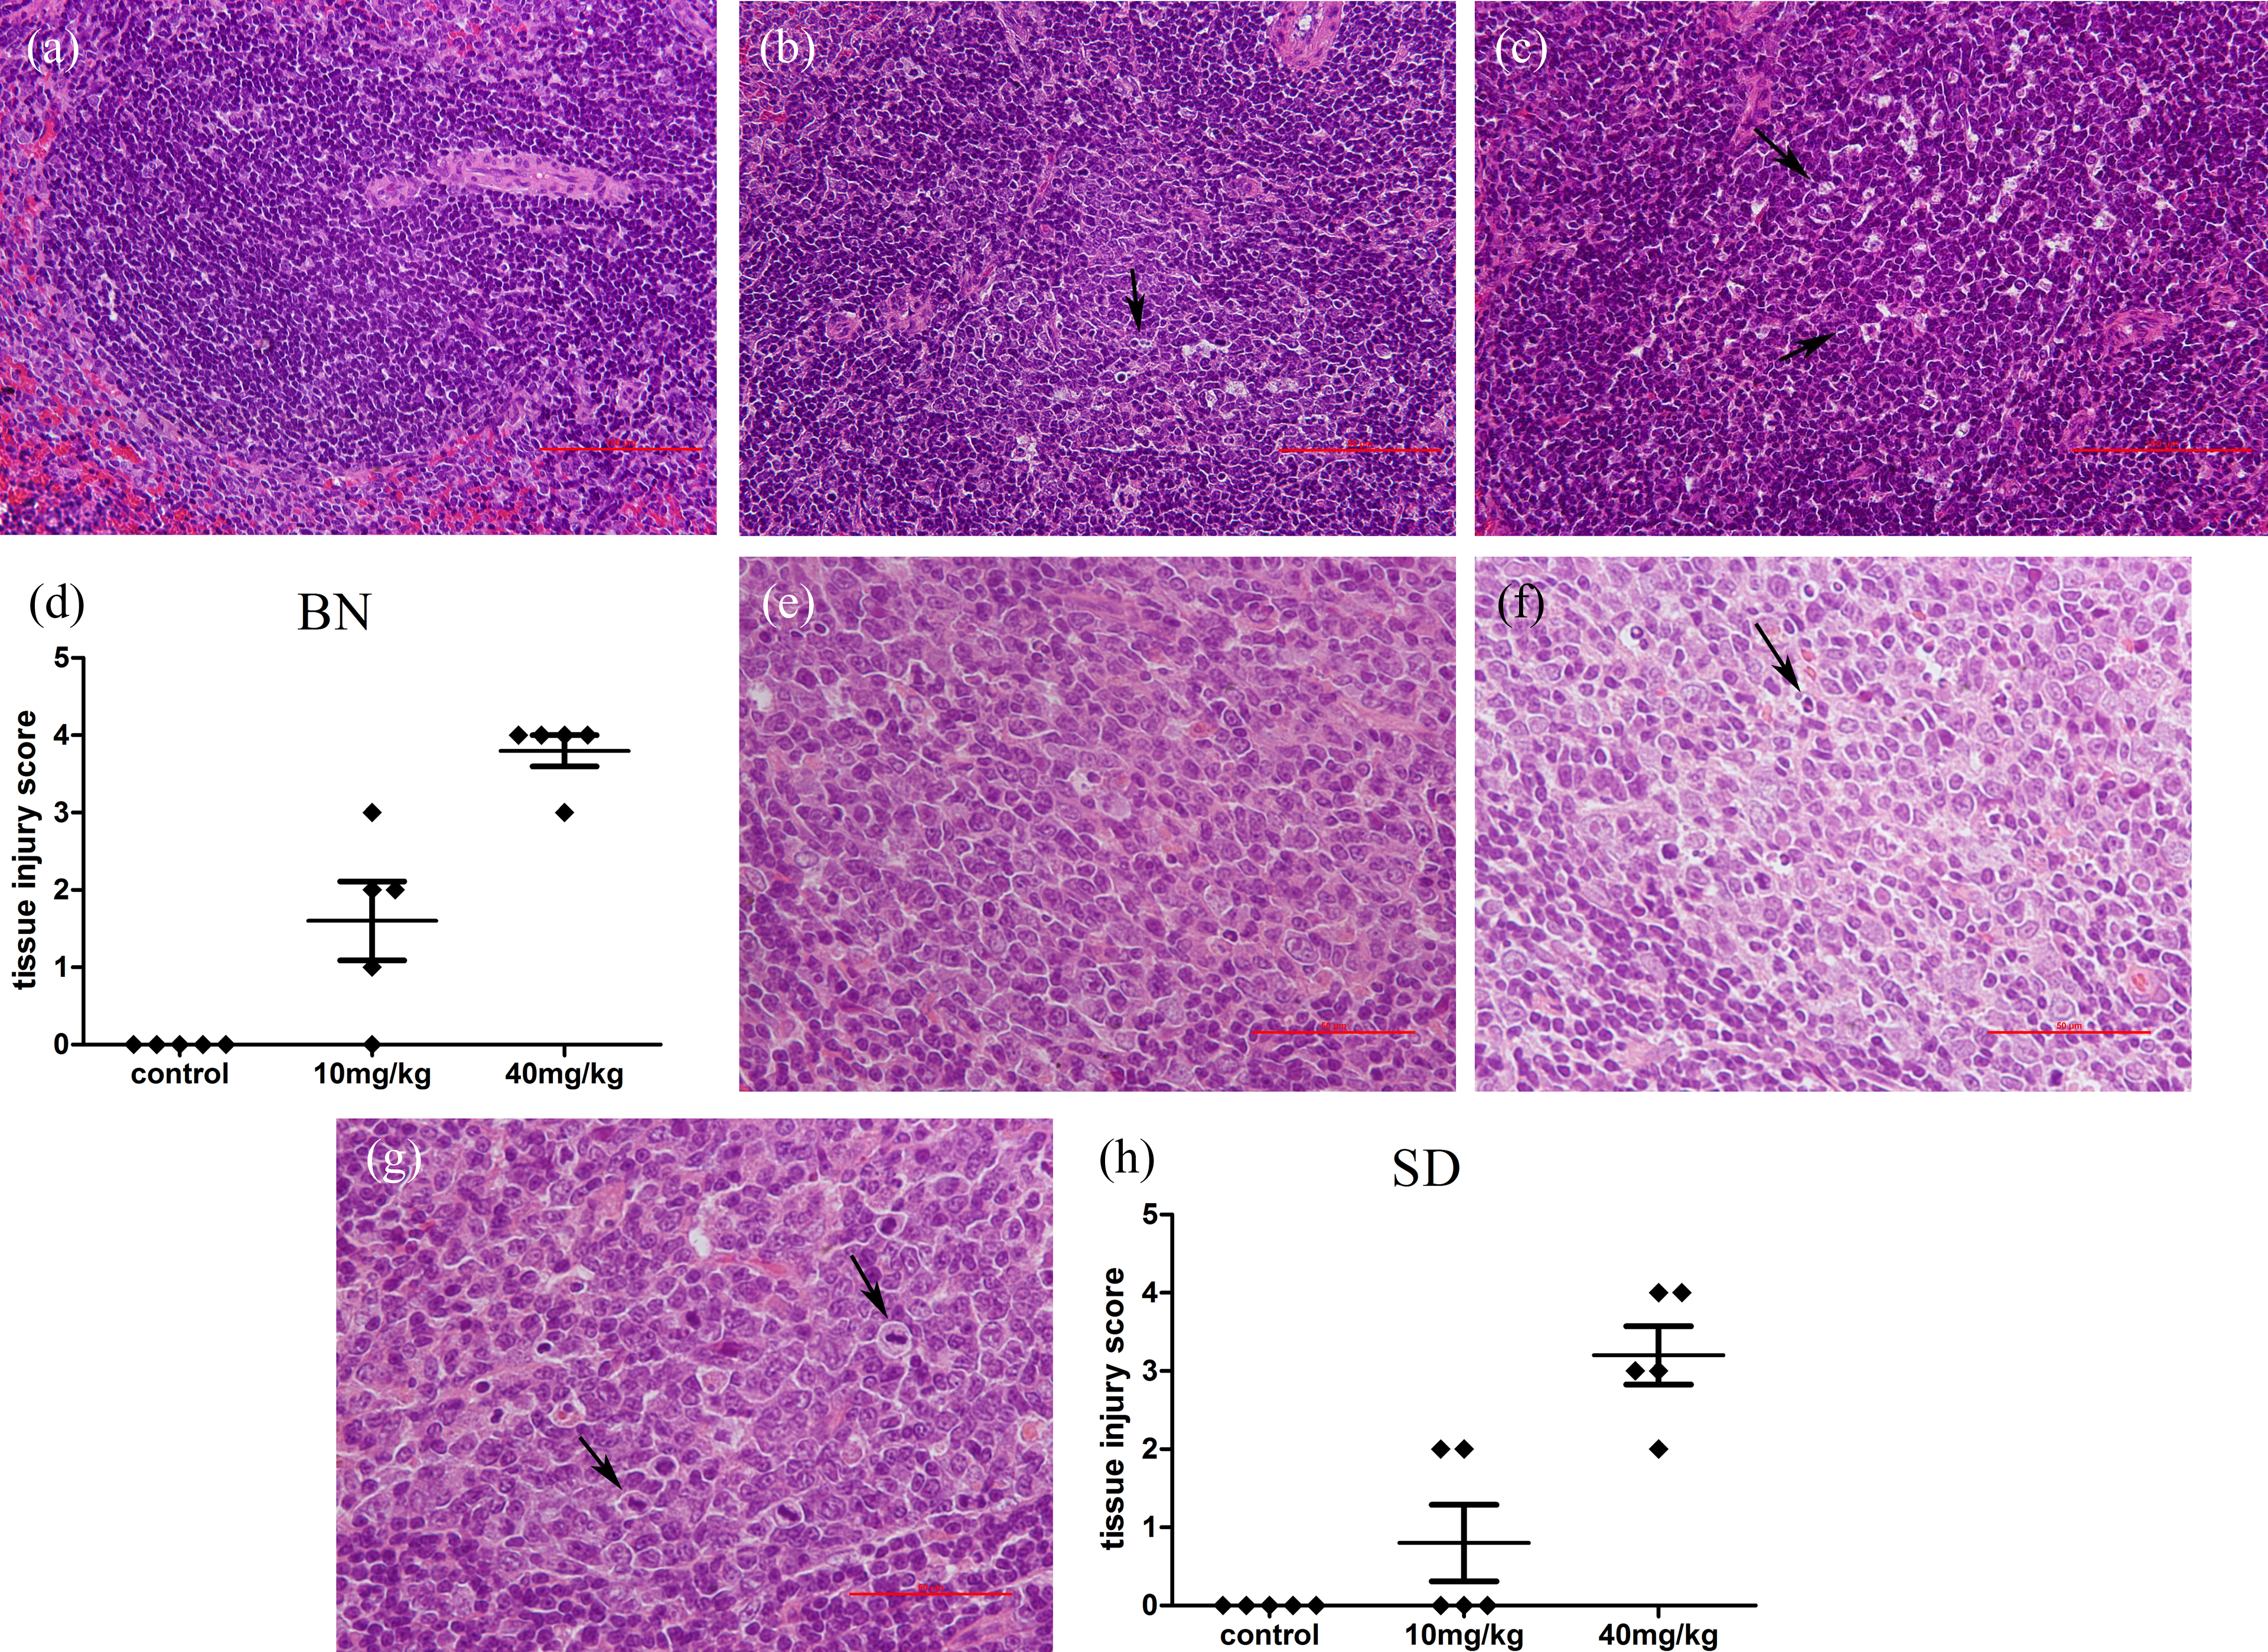
Histopathological change of spleens in three different rat strains dosed with NS control, 10 mg/kg or 40 mg/kg procainamide (n = 5), necropsied after 8 weeks dosing. Scale bar = 50 μm or 100 μm. (a) BN treated with NS control; (b) BN treated with 10 mg/kg procainamide; (c) BN treated with 40 mg/kg procainamide, tingible body macrophage increase was seen in splenic white pulp (as denoted by arrows); (e) SD treated with NS control; (f) SD treated with 10 mg/kg procainamide; (g) SD treated with 40 mg/kg procainamide, the lesions were characterized by increased mitotic figures (arrows); (d) and (h) histological tissue injury scores after procainamide/NS treatment. —, mean score of the treatment group ± SD; ♦, scores for individual animals. The degree of injury mirrored the severity of changes in the spleen. BN: Brown Norway; SD: Sprague Dawley; NS: normal saline.
Detection of lymphocytes subsets
To compare frequencies of different T-cell subsets and B cells after procainamide treatment in both rat strains, leucocytes isolated from the spleen were analyzed for expression of CD86 (activated lymphoid cells), CD45 R (B cells), or CD3 (T cells) by three-color flow cytometry. The percentage of CD86-positive cells of BN rats treated with 40 mg/kg procainamide increased significantly (36.39 ± 7.20 for treated rats vs. 28.47 ± 4.37 for control, p < 0.05), while the percentage of CD86-positive cells of SD rats treated with 40 mg/kg procainamide decreased significantly when compared to rats treated with NS control (12.02 ± 2.06 for treated rats vs. 18.11 ± 3.97 for control, p < 0.05; Figure 4(c)). In addition to looking at the subset of CD86-positive cells, the percentage of CD45+CD86+cells and CD3+CD86+ cells was also determined after procainamide treatment. Similarly, the percentage of CD45+CD86+ cells and CD3+CD86+ cells increased significantly in BN rats treated with 40 mg/kg procainamide, while the percentage of CD3+CD86+ cells significantly decreased in SD rats treated with 40 mg/kg procainamide than control rats (Figure 4(d) and (e)).

Percentage of CD86+ cells, CD45+CD86+ cells, and CD3+CD86+ cells in three different rat strains dosed with NS control, 10 mg/kg, or 40 mg/kg procainamide. Panel A and B shows a representative plot from one animal from each group, and panel C, D, E show the average percentage of CD86+ cells, CD45+CD86+ cells, and CD3+CD86+ cells (n = 5). Bars represent the mean ± SD of the percentage of cells staining positive for the selected cell surface molecules. Statistically significant differences comparing with values of control group are highlighted by asterisks (*p < 0.05, **p < 0.01). NS: normal saline.
Preliminary study found that treatments that increase the incidence of autoimmunity also affected the percentage of CD4+CD25+ cells. In addition, we further test if there is a relationship between the number of CD4+CD25+ cells and procainamide treatment. As shown in Figure 5, the decrease in CD4+CD25+ cells was significant in BN rats treated with 10 mg/kg and 40 mg/kg procainamide (6.56 ± 0.81 and 6.49 ± 0.35, respectively, for treated rats vs. 7.95 ± 1.06 for control, p < 0.05; Figure 5). Although not statistically significant, the percentage of CD4+CD25+ cells appeared to decrease in SD rats treated with procainamide for 8 week. No significant differences were found between 10 mg/kg and 40 mg/kg procainamide groups and the NS control group in LEW rats.
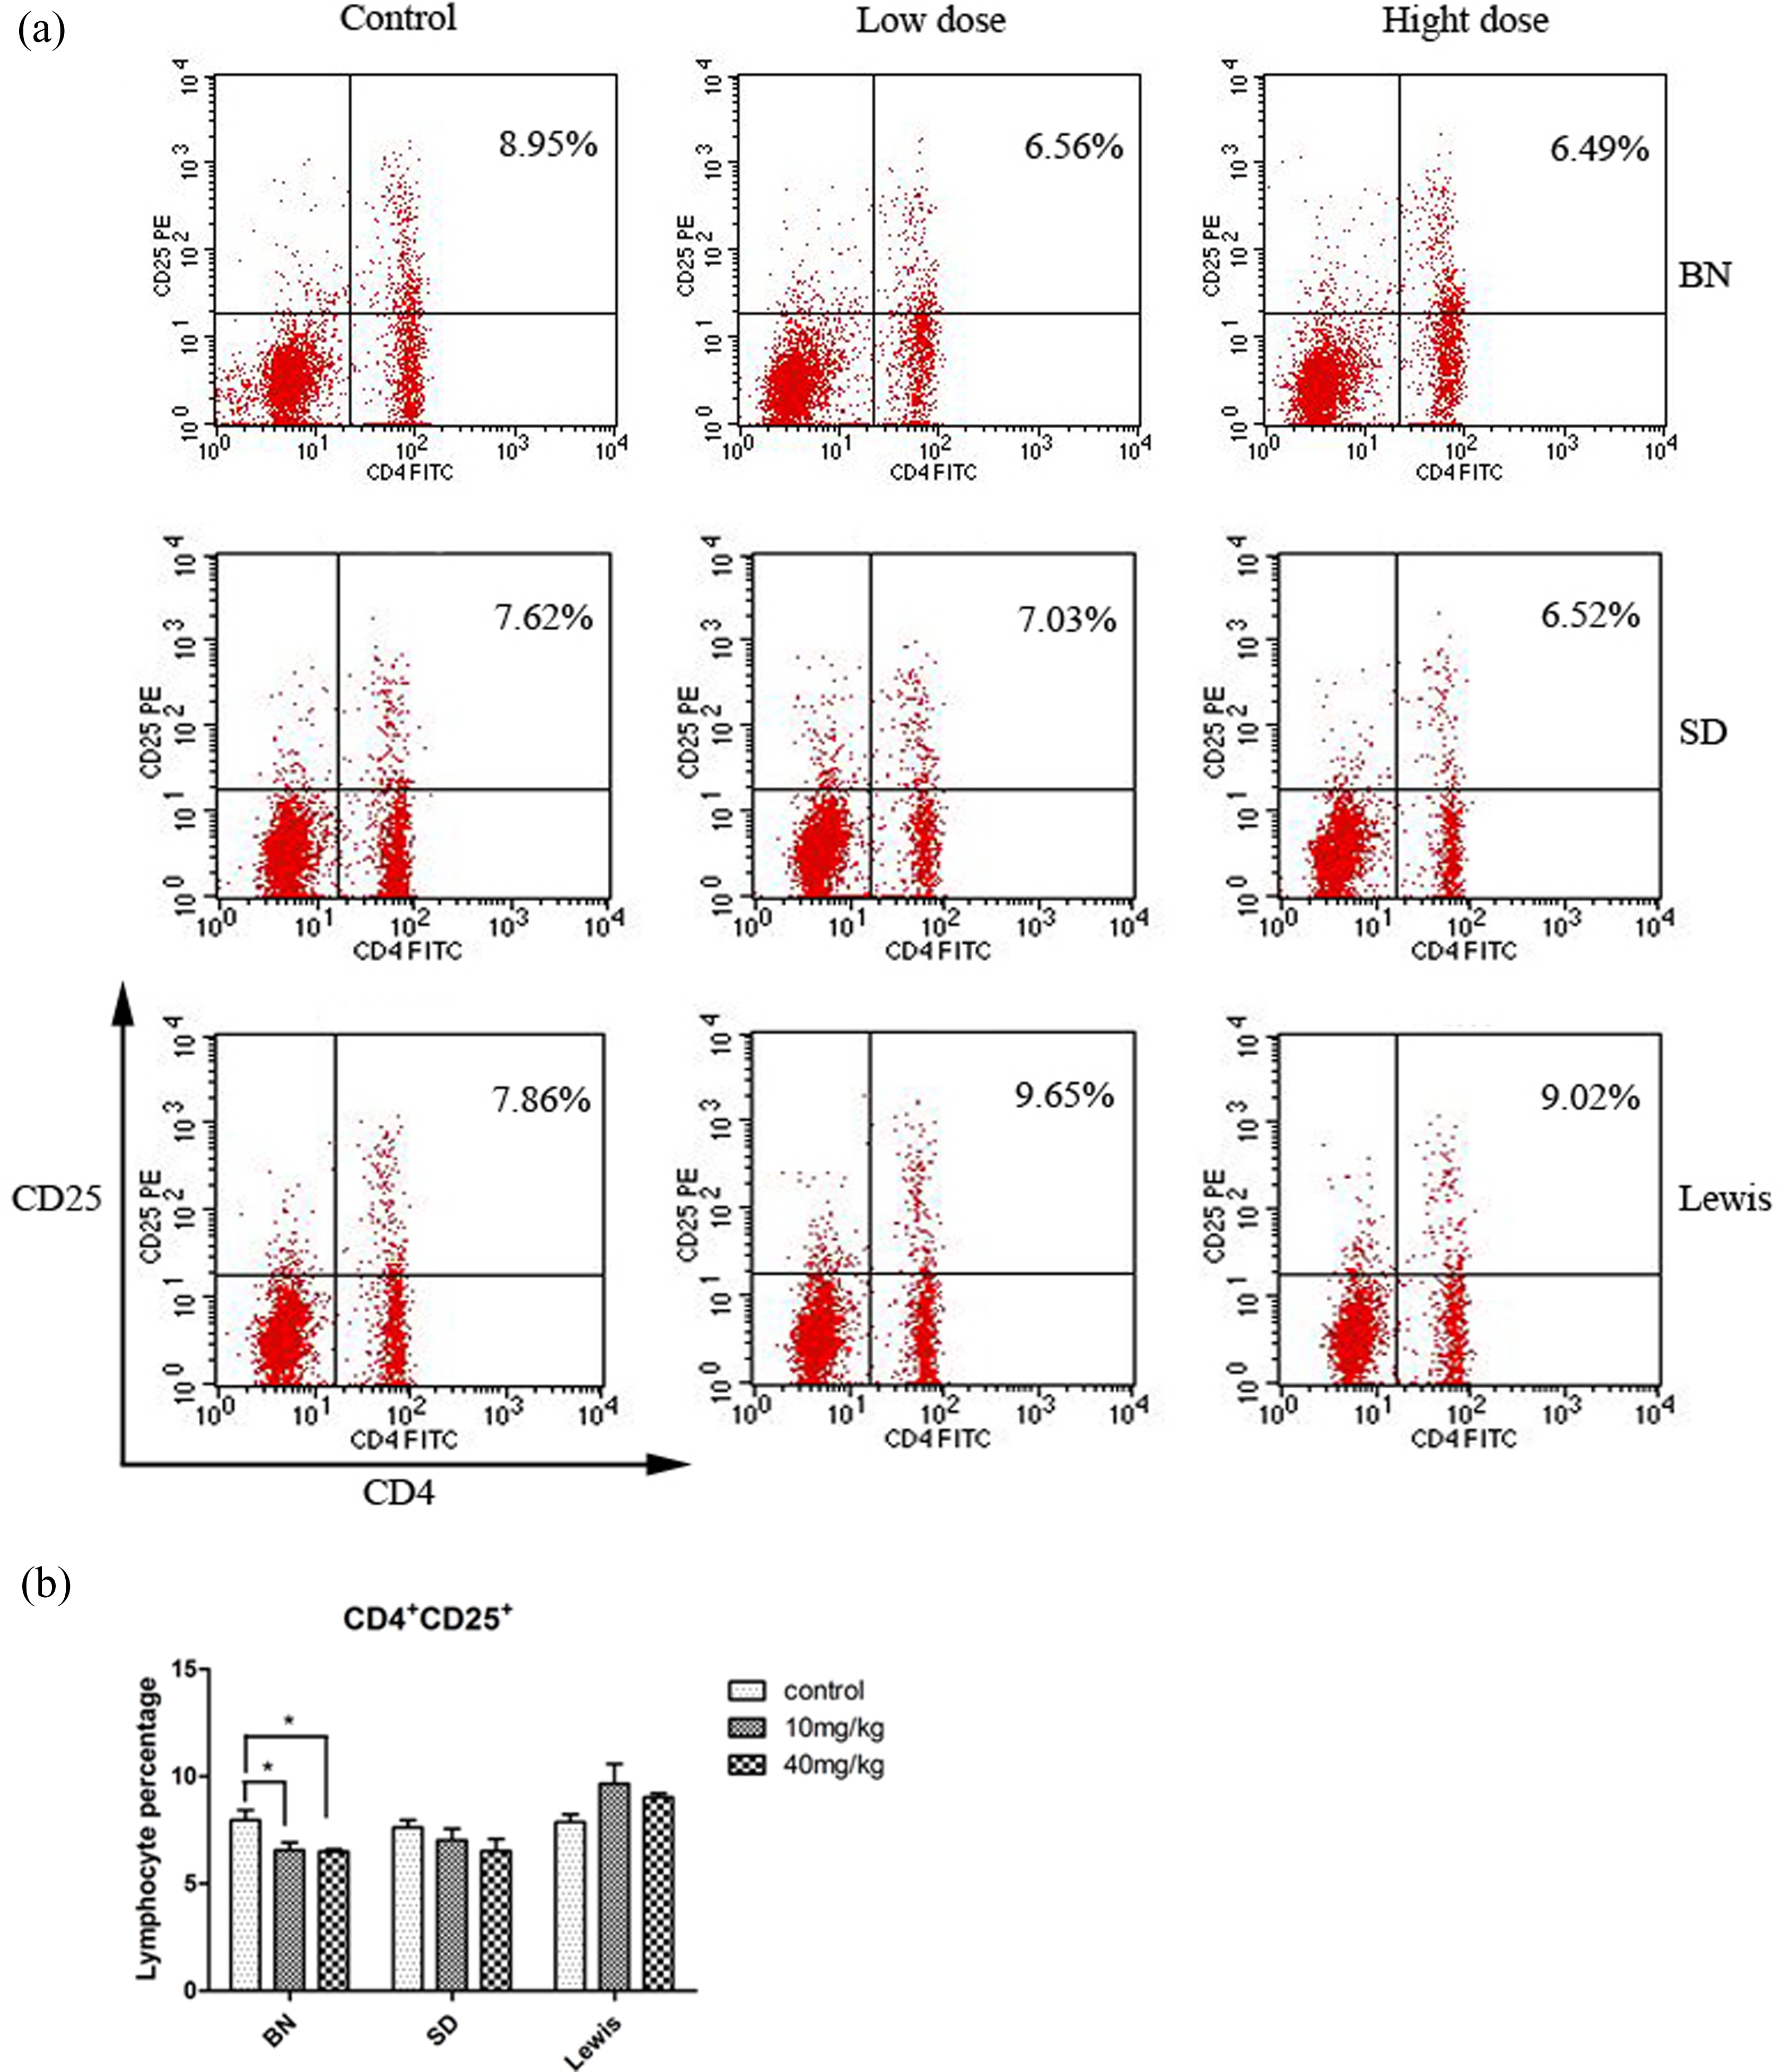
Percentage of CD4+CD25+ cells in three different rat strains dosed with NS control, 10 mg/kg, or 40 mg/kg procainamide. Panel A shows a representative plot from one animal from each group, and panel B shows the average percentage of CD4+CD25+ cells (n = 5). Bars represent the mean ± SD of the percentage of cells staining positive for the selected cell surface molecules. Statistically significant differences comparing with values of control group are highlighted by asterisks (*p < 0.05). NS: normal saline.
CD11b/c is present on dendritic cells (DCs) as well as macrophages, it is possible that DCs also increase in response to drug-induced autoimmune. To compare frequencies of DCs after procainamide treatment in three rat strains, the CD11b/c+ cells in spleen were counted after 8 weeks of treatment. The results showed that the treatment with procainamide caused obvious decrease in frequencies of 11b/c+ cells compared with the NS control group (Figure 6). In addition, the decrease in 11b/c+ cells was greater in SD rats treated with 10 mg/kg and 40 mg/kg procainamide than in BN rats treated with 40 mg/kg procainamide. As well, we did not see a significant shift in procainamide-treated groups than control in LEW rats.

Percentage of CD11b/c+ cells in three different rat strains dosed with NS control, 10 mg/kg, or 40 mg/kg procainamide. Panel A shows a representative plot from one animal from each group, and panel B shows the average percentage of CD11b/c+ cells (n = 5). Bars represent the mean ± SD of the percentage of cells staining positive for the selected cell surface molecules. Statistically significant differences comparing with values of control group are highlighted by asterisks (*p < 0.05, **p < 0.01). NS: normal saline.
Serum cytokine/chemokine pattern after procainamide treatment
To compare the overall pattern of serum cytokines/chemokines after procainamide treatment in both rat strains, a Luminex assay of 12 cytokines/chemokines was performed at the end of treatment. As shown in Figure 7, the levels of Th2 (IL-10), Th1-type cytokine (IFN-γ), and chemokine (IL-1β) in serum were markedly elevated both in BN and SD rats after administration of procainamide. Furthermore, Th2 cytokine (IL-4 and IL-6), and chemokine (IL-1α) in serum were also markedly increased in BN rats. As well, no significant changes were noted in 10 mg/kg or 40 mg/kg procainamide groups compared with NS control group in LEW rats.

Serum cytokine/chemokine profiles of three different rat strains treated with procainamide or NS control (n = 5). Data are presented as the mean ± SD. Statistically significant differences comparing with values of control group are highlighted by asterisks (*p < 0.05, **p < 0.01). NS: normal saline.
DEGs by SAM analysis
The numbers of total DEGs induced by procainamide are displayed in Figure 8. The numbers of dysregulated genes in BN rats and SD rats treated with 40 mg/kg procainamide were 1007 and 357, respectively, compared with saline control. The DEGs induced by 40 mg/kg procainamide were hierarchical clusters as shown in Figure 9 to reveal the DEG reproducibility in five biological replicates. According to the differences in gene expression profiles in spleen, higher numbers of DEGs were found in the BN rat than in the SD rat after dosing. The raw microarray data have been deposited in the GEO database under accession number GSE92500.

Up- and downregulated genes in BN rat or SD rat spleen by 40 mg/kg procainamide treatment compared to NS control. The bar charts in gray and dark represent the number of up- and downregulated genes, respectively. BN: Brown Norway; SD: Sprague Dawley; NS: normal saline.

Two-dimensional hierarchical clustering of differentially regulated genes in BN rat or SD rat spleen treated by 40 mg/kg procainamide or NS. Gene expression levels are indicated by the color bar: green represents downregulation and red upregulation. Ratio_b10*: BN treated with NS control; ratio_b30*: BN treated with 40 mg/kg procainamide; ratio_s10*: SD treated with NS control; ratio_ s30*: SD treated with 40 mg/kg procainamide. BN: Brown Norway; SD: Sprague Dawley; NS: normal saline.
Functional group of DEGs by GO enrichment analysis
Since large numbers of DEGs in BN rats and SD rats were induced by 40 mg/kg of procainamide treatment, it was hard to manually inspect them to characterize the functional outcome of procainamide effect. We performed automated GO enrichment analysis to identify significant functional group genes that could reflect procainamide’s biological effects on two different rat strains. Four significant functional group genes (p < 0.01) that could clarify procainamide’s biological processes are listed in Table 1. Similar immune mechanisms were found between BN and SD rat, such as immune-related genes (Ccl20, Ccl2, Cxcl9, Ccl7, C2), antigen processing, and presentation-related genes (Psmb9, Klrc1), inflammatory-related genes (Ass1) and positive regulation of cell proliferation (STAT1) were upregulated, suggesting these changes would served as the potential bridge biomarkers to predict drug-induced autoimmune reactions among species. Moreover, DEGs involved in immune regulation and response in BN rats are more pronounced and complex in the BN rat than in the SD rat.
Functional group genes in spleens of two different rat strains after 40 mg/kg of procainamide treatment with significant enrichment analysis of GO terms.

BN: Brown Norway; SD: Sprague Dawley; GO: gene ontology.
Discussion
The rat is the second most frequently used animal (after mouse) in the field of immunological research. However, it is the major model for physiological investigation and it provides the most relevant models for the genetic study of autoimmune diseases. In this respect, BN, SD, and LEW rats represent models of choice to study DIA from the cellular and genetic points of view.
Drug-induced lupus erythematosus (DILE) is defined as a lupus-like syndrome temporally related to continuous drug exposure which resolves after discontinuation of the offending drug. Similar to clinical SLE, variable and often high level of ANAs has been found, with a larger increase over that of control subjects. 18,19 It was also found that most patients treated with procainamide develop anti-dDNA antibodies after prolonged therapy. When exposed to certain chemicals, BN rats develop autoimmune disease similar to human SLE characterized by elevation of antibody levels to self- and nonself-antigens which can result in the formation of immune complexes and lead to a fatal glomerulonephritis. 20 Since it has been reported that the ANA response could be used in identifying compounds capable of initiating autoimmune responses, we first evaluated the serum level of ANA after procainamide challenge. Our data demonstrated that procainamide could significantly increase the ANA levels of BN or SD rats in a dosage-dependent manner and time-dependent manner, which suggested that procainamide could induce autoimmunity by affecting the level of ANAs in rat serum. We also found that the increase of ANA levels after procainamide challenge was much higher in the BN rat than in the SD rat, while there was no difference in ANA levels between NS and treatment groups in LEW rats, which provided evidence that the response to autoimmunity induced by procainamide among the three strains rats was significantly different, the BN rats was the most sensitive one, SD rats exhibited less sensitive, while LEW resistance to procainamide.
For conventional toxicological parameters evaluation, significant changes in spleen weight and histopathological examination of spleens were noted both in BN and SD rats after administration of procainamide. However, the lesions induced by procainamide were histologically indistinguishable from BN and SD rats. Our current study demonstrates that procainamide might have substantial impact on immune system through different mechanism, which is needed to be further investigated.
It is clear that the Th-cell population, which plays a central role in the induction and regulation of the immune response, comprises functionally distinct subsets that are characterized by the patterns of lymphokines they produce following activation. Activated effector CD4 T cells have been subclassified on the basis of their phenotypic pattern of cytokine production into at least two subsets: Th1 and Th2. Th1 cells produce IL-2 and IFN-γ, whereas Th2 cells produce IL-4, IL-5, and IL-13. 21 –23 The functions of Th1 and Th2 cells correlate well with their distinctive cytokine profiles. Th1 cells are responsible for directing cell-mediated immune responses leading to the eradication of intracellular pathogens. 21 This cell subset may also cause organ-specific autoimmune diseases if dysregulated. 24 Conversely, Th2 cells help B cells to produce IgG1 and IgE and this cell subset has been strongly implicated in systemic autoimmunity. Ever since it was proposed in 1986, the Th1-Th2 hypothesis has been a significant aspect of mechanistic theories of T-cell-mediated diseases. 25 Although it is evident that LEW rats are susceptible to Th1-mediated diseases, whereas BN rats are susceptible to Th2-mediated diseases, 6,10,26,27 the factors responsible for the difference in immune responses between BN rats and LEW rats have not been clearly established. Studies had shown that cytokine pattern is obviously involved in these genetic differences. In this regard, we also explored the Th1/Th2 cytokine pattern after procainamide treatment in susceptible and resistant rat strains. Consistent with previous reports, our results showed that IL-4, IL-6, and IL-10, the major product of Th2 cells, were increased in BN rats after procainamide treatment. Serum level of IFN-γ, a Th1 cytokine, was also increased in BN rats after treatment. In addition to the Th1/Th2 cytokines, there is also a marked increase in IL-1α and IL-1β. The major source of IL-1 is macrophages, and these cytokines/chemokines are associated with inflammation and generally increased in autoimmune reactions. In contrast, only IL-10 and IFN-γ were increased in SD rats, but there was no marked change in IL-4, IL-6, or IL-1 in SD rats. However, the failure to increase Th2 cytokine, that is, IL-4, IL-6, and IL-10 in serum was seen in LEW rats after procainamide treatment. These data further support the key role of Th2 cytokines in procainamide-induced autoimmunity and suggest that failure of upregulation of Th2 cytokines may account for resistance of LEW rats to DILE.
As a member of the B7 family of costimulatory molecules, CD86 is expressed by germinal center B cells and at low levels on macrophages, DCs, and nonlymphoid cells in the thymus. Its expression is upregulated on B cells through a variety of surface stimuli including lipopolysaccharide. In addition to CD80 (B7-1), CD86 is a counterreceptor for the T-cell surface molecules CD28 and CD152 (CTLA-4). The interaction of CD86 with its ligands plays a critical role in T-B cross talk, T-cell costimulation, autoantibody production, and Th2-mediated Ig production. The kinetics of upregulation of CD86 upon stimulation supports its major contribution during the primary phase of an immune response. Several studies have reported that the percentage of CD86+ cells was significantly higher in all B-cell subsets in the SLE patients compared to either normal controls or allergy patients, which suggests that the B7 family of molecules, and CD86 in particular, may reflect immunologic dysregulation in patients with autoimmune disease and may reflect a state facilitating heightened B-cell activity and hypergammaglobulinemia that occur in active SLE. 28,29 In this regard, we wonder if the expression of costimulatory molecules on spleens lymphocytes is increased after procainamide treatment in susceptible rat strains. As expected, we found the percentage of CD45R+ B cells and CD3+ T cells expressing CD86 increased in BN rats. In contrast, CD86 expression on CD3+ T cells decreased in SD rats after dosing. No changes in CD86 expression were observed in LEW rats treated with procainamide. Our current study demonstrates that procainamide could induce autoimmunity by promoting polyclonal T-/B-cell activation. Further, studies have implicated the CD80 (B7-1) and CD86 (B7-2), which are expressed on human tonsillar B cells, are upregulated by IL-4 and IL-13. 30 Here, our results also show that there is also a marked increase in IL-4 after procainamide treatment in BN rats. In view of these observations, we proposed that enhanced CD86 expression on T/B cells is associated with autoimmune disease activity, B-cell activation, and levels of Th2-associated cytokines.
It has become increasingly evident that peripheral tolerance is mediated by suppressor T cells with a regulatory function. 31,32 The best characterized are the CD4+CD25+cells, which constitute 5–10% of the CD4+ cells. 33 Recently, it was reported that the number of CD4+CD25+ cells is diminished in patients with SLE as well as in (NZB×NZW) F1 female mice with established lupus, 34 thus suggesting a role for these cells in regulating the disease. Because CD4+CD25+ cells are the most characterized immunoregulatory cells and because these cells were shown to be protective against autoimmune responses, we compared frequencies of CD4+CD25+ cells after treatment in both rat strains and studied its possible role in procainamide-induced autoimmunity. Our results showed that BN rats that are genetically Th2-predisposed had a marked decrease in CD4+CD25+ cells, which defines regulatory T cells. This result was not observed in SD rats or LEW rats after procainamide treatment. Based on previous studies mentioned above and our data, it is possible to conclude that CD4+CD25+ cells may be involved in procainamide-induced autoimmunity and dysfunctional of this cells may account for susceptibility of BN rats to DIA.
Immune responses against foreign antigens are initiated and controlled by DCs. Accumulating evidence suggests that autoimmunity, involving T cells directed against self, can also be primed by DCs. Recent studies suggest a role for DCs in initiating autoimmune and propose two general scenarios consistent. 35 First, if DCs receive an imbalance of cytokine signals, they can differentiate into potentially harmful forms that behave in ways distinct from classically mature types. This behavior could include altered migration, altered release of cytokines (such as IL-10 and IL-12), or altered antigen processing so that cryptic self-determinants and/or self-determinants derived from apoptotic bodies are presented. Second, defects in genes affecting DC function could lead to DCs that cause immune deviation and provoke autoimmunity. Here in both BN and SD rats treated with procainamide, we found the numbers of CD11+ cells, which define DCs, decreased markedly, and this observation provides strong evidence for their involvement in procainamide-induced autoimmunity. The imbalance of cytokines and/or the inability of DCs to respond to signals incorrectly might lead to differentiation of DCs into forms that can initiate autoimmunity. However, the mechanism by which DCs initiate anti-self responses remains to be further investigated.
Evaluation of xenobiotic-induced changes in gene expression as a method to understand the mechanism and identify biomarkers that predicted the risk of toxicants is being pursued by industry and regulatory agencies worldwide, especially in drug research and development. 36 Several microarray gene expression studies have been published regarding immunotoxicity of chemical compounds with in vivo and in vitro models. 37 Therefore, we also used the gene expression profiles to investigate whether procainamide would affect the gene expression in rat spleens. Our data demonstrated that procainamide showed an obvious effect on the gene expression profiles of spleens both in BN and SD rats. However, the number of DEGs in BN rats was higher than that in SD rats after dosing.
Analysis of differential expression of individual genes could provide additional insight into regulation of biological processes. Therefore, GO enrichment analysis of DEGs was performed to further investigate the molecular mechanism of procainamide on different rat strains. We found that in BN rats, the altered genes were mostly associated with antigen processing and presentation (Psmb9, Klrc1), immune response (CCL20, CCL2, CXCL9, IRGM, CCL7), inflammatory response (ASS1), and positive regulation of cell proliferation (STAT1). Similar immune mechanisms were found in SD but this immune response was less pronounced in the SD rat. This suggested that the intake of procainamide as a xenobiotic could stimulate the immune system and induce the immune response in spleens. In addition, splenocytes also showed obvious cellular response to chemokine signaling pathway and complement and coagulation cascades, which was related to procainamide intake. Klrc1 gene involved in the natural killer cell mediated was also significantly altered by procainamide. One study has implicated the Klrc1 is polymorphic among individuals, and is one of the candidate chromosomal regions for rheumatic diseases. 38,39 So it is possible to suggest that there may be possible association between variations in Klrc1 genes and genetic susceptibility to DILE.
Overall, the present study revealed that there were significant differences in response to autoimmunity induced by procainamide among the three strains rats, the BN rats was the most sensitive one, SD rats exhibited less sensitive, while LEW resistance to procainamide. Moreover, similar immune mechanisms were found between BN and SD rat, such as immune-related genes, antigen processing, and presentation-related genes were upregulated, DCs were decreased, Th2-type immune response were promoted, suggesting these changes would serve as the potential bridge biomarkers to predict drug-induced autoimmune reactions among species. Differ from SD rats, T- and B-lymphocyte proliferation in BN rats was also promoted and regulatory T cells were decreased significantly. Furthermore, much more extensive Th2-response was observed and DEGs involved in immune regulation and response in BN rats are more complex after dosing. This study may also benefit to further understand the toxicological mechanism of drug-induced autoimmune reactions.
Footnotes
Acknowledgments
We thank the reviewers for their comments and suggestions which help to improve the presentation of the article. This work was supported by Key Projects in the National Science and Technology Pillar Program (Grant no. 2012ZX09302001), the program for Key Techniques of New Drug Research and Development (Grant no. 2012ZX09505001-004), National Major Scientific and Technological Special Project for Biotechnology Pharmaceuticals Development (Grant no. 2015ZX09501007-004), and the Youth Development Research Foundation of NIFDC (Grant no. 2014C5).
Author’s contribution
Y Huang and Z Lin contributed equally to this work.
Declaration of Conflicting Interests
The author(s) declared no potential conflicts of interest with respect to the research, authorship, and/or publication of this article.
Funding
The author(s) disclosed receipt of the following financial support for the research, authorship, and/or publication of this article: This work was supported by Key Projects in the National Science and Technology Pillar Program (Grant no. 2012ZX09302001), the program for Key Techniques of New Drug Research and Development (Grant no.2012ZX09505001-004), National Major Scientific and Technological Special Project for Biotechnology Pharmaceuticals Development (Grant no. 2015ZX09501007-004),and the Youth Development Research Foundation of NIFDC (Grant no. 2014C5).