
Abstract
The primary hepatocytes were extracted and purified from mice through improved Seglen two-step perfusion method. Ethanol-induced injury hepatocytes model in mice was used to investigate the importance of glutathione S-transferase A1 (GSTA1) in hepatocytes injury by comparison with other indicators, such as alanine aminotransferase, aspartate aminotransferase, malondialdehyde, glutathione and superoxide dismutase. The release of GSTA1 was demonstrated to be an earlier and more sensitive indicator of hepatocytes injury than other indicators. Significant increases in GSTA1 were detected at 2 h after ethanol exposure, while other indicators were undetected at this time. A markedly difference in other indicators were observed at 6 and 8 h. The release of GSTA1 was significantly increased at a concentration of 50 mmol/L ethanol, the lowest exposure concentration than that in other indicators. In contrast, other indicators release was not statistically significant until concentrations of 75 mmol/L and 100 mmol/L ethanol. These results suggest that GSTA1 can be detected at the early stage of low concentration ethanol exposure and that GSTA1 is more sensitive and reliable marker in ethanol-induced hepatic injury.
Introduction
Ethanol has been one of the common hepatotoxicant and its intake is the most dangerous incentive for ethanolic hepatic disease development. 1 Hepatic ethanol-induced injury is caused by a variety of ways, such as ethanol-induced hepatotoxic metabolite, 2 oxidative stress and lipid peroxidation, 3 mitochondrial damage, 4,5 certain cytokines activation 6,7 and some immune response. 8,9 Therefore, the study of hepatic ethanol-induced injury is a serious global issue.
Primary hepatocytes are widely used in drug metabolism and toxicology studies, because of its outstanding reproducibility in vitro experimental. Due to better retain levels of various types of liver enzymes including cytochrome P450 basically maintained metabolic function of the liver, it can provide absorption, metabolism, transport and other life processes at the cellular level and then provide the basis platform for our research. At present, extraction processes of primary hepatocytes are varied, but the easiest and most commonly used one is Seglen two-step perfusion method. 10,11
As a supergene family with multiple genes encoding, glutathione S-transferases (GSTs) are a group of isoenzymes with a variety of physiological functions, which are usually divided into eight superfamilies, such as Alpha (A), KaPPa (K), Mu (M), Pi (P), Sigma (S), Theta (T), Zeta (Z) and Omega (O). 12 GSTs are phase II drug-metabolizing enzymes with detoxification function and an important member of the body’s anti-oxidative damage system. In general, they withstand pro-electronics physical attack and catalyze the exogenous chemical decomposition reaction followed excrete in the cell, and thus protect the body. GSTs play an important role in detoxification of a series of exogenous and endogenous compounds, including carcinogenic substances, drugs, environmental toxins and oxidative stress products and the like. 13 Alpha-GST (GSTA), contained five genes encoding glutathione S-transferase A1-A5 (GSTA1-A5), is coded by a gene cluster located in No. 6 chromosome P12, most present in the human liver. Studies confirmed that GSTA1, a principal member of the family GSTA, 14 has anti-tumor effect 15 and can regulate cell signalling. 16
In addition, GSTA1 serve also as a marker of liver injury. The diagnostic indicators of hepatic injury are commonly used transaminases, including alanine aminotransferase (ALT) and aspartate aminotransferase (AST). However, as a result of the concentration of serum AST are significantly increased for other lesions outside hepatic injury, such as in the heart, skeletal muscle, pancreas, kidney, red blood-cell disease and hemolytic disease, 17 AST cannot be the specific marker of hepatic injury and that of ALT, which cannot react in a timely manner of hepatic injury due to having a long half-life, despite its high specificity. Therefore, we should explore more specific description of factors to hepatic injury. Malondialdehyde (MDA), one of the most important intermediates produced during lipid peroxidation, is strongly related to proteins damage. 18 Higher content of MDA is found in cirrhosis than in matched healthy controls in alcoholics with or without cirrhosis and in viral. 19 It is well known that, superoxide dismutase (SOD) is the enzymatic antioxidants 20 and glutathione (GSH) is the common non-enzymatic antioxidants. The superoxide radicals are scavenged and converted into hydrogen peroxide and oxygen by SOD. 20 GSH is an inducible component of the superoxide adaptive stress response correlating with a reduction in intracellular oxidation. 21 Therefore, these factors will serve as a measure of hepatic injury indicators. GSTA1 distributes evenly in the centre of the hepatic lobule and has a strong specificity and short half-life (approximately 1 h). Therefore, in the hepatocytes injury, it is incredibly important for instruction and diagnosis of hepatocytes injury to detect the level of GSTA1. This study aimed to investigate the release of GSTA1 on ethanol-induced injury on primary hepatocytes from mice and thus to determine whether GSTA1 can be used as a sensitive marker of hepatic injury.
Methods
Reagents
Dulbecco’s modified Eagle medium (high glucose) was purchased from GIBCO Company. Trypan blue was purchased from Sigma-Aldrich (St Louis, Missouri, USA). Collagen from rat tail was purchased from Hangzhou Shengyou Biotechnology Co., Ltd (Hangzhou, China). The glutathione S-transferase A1 (GSTA1) detection kit was obtained from American Rapidbio (RB) company. The detection kits of ALT, AST, SOD, MDA and GSH were purchased from the Nanjing Jiancheng Institute of Biotechnology (Nanjing, China).
Animals and treatment
Adult male Kunming mice (18–22 g body weight) were obtained from the Harbin Pharmaceutical Group Co., Ltd, General Pharm. Factory, laboratory animal centre. The animals were housed in a controlled environment under standard conditions at a temperature (20 ± 2°C), a relative humidity (40–60%), and allowed free access to food (standard mice pellets) and water and were acclimatized for at least 1 week before use. All procedures involving animals complied with the China National Institutes of Healthy Guidelines for the Care and Use of Laboratory Animals.
Experimental design
After being anesthetized and disinfected, the mice were transferred to the super clean bench and fixed on the sterilized polyethylene foam board. The abdomen was cut along the peritoneal midline. By inverse perfusion method, the vein detained needle was inserted into suprahepatic vena cava, then the first perfusion fluid (37°C preheated) and the enzyme digestive fluid (37°C preheated) were successively poured into (flow rate, 3–4 mL/min). Before the perfusion stopping, livers were separated and removed in an aseptic petri dish. After washed three times with HBSS buffer solution and aseptic medium, the liver finally dispersed into cell suspension with tweezers. Hepatocytes motility rate were determined with trypan blue assay by cell count under inverted microscope.
To get a good adherent effect, each well was filled with 300 μL collagen in a 24-well plate and the plates were opened overnight washed with phosphate-buffered saline 3–4 times before utilized. In time–response study, each group was incubated in 1 mL complete medium with ethanol (100 mmol/L) per well. Supernatant and cells were collected at 0 h (control group), 1 h, 2 h, 4 h, 6 h, 8 h, 10 h and 16 h (test groups). In dose–response study, culture medium were prepared with ethanol (25 mmol/L, 50 mmol/L, 75 mmol/L, 100 mmol/L, 125 mmol/L and 150 mmol/L) in test groups and that with an equal volume of phosphate buffer saline in control group after 24 h. Then the supernatant and cells were collected at 8 h.
Determination of ALT and AST in cell culture supernatant
ALT and AST activities in cell culture supernatant were determined using detection kits according to the manufacturer’s instructions.
Determination of MDA, SOD and GSH in cell
MDA, SOD and GSH in cells were determined using detection kits according to the manufacturer’s instructions.
Determination of GSTA1 concentration in cell culture supernatant
GSTA1 content in cell culture supernatant was detected with a Mouse Glutathione S-Transferase Alpha1 (GSTA1) ELISA Kit that used Purified Mouse GSTA1 to coat microtiter plate wells, making a solid-phase antibody. The procedure was performed according to the manufacturer’s instructions. The antibody was diluted 500-fold. The concentration of GSTA1 was determined by a colorimetric reaction that produced a yellow complex with an absorption maximum at 450 nm. The concentration of GSTA in the sample was calculated using the generated standard curve. Confidence limits were determined to be 0.7–125 ng/mL. All values were normalized by the total protein concentration of the sample.
Statistical analysis
Values were expressed as the mean ± SD and statistical significance was determined by one-way analysis of variance using the SPSS software version 19.0. The Tukey’s multiple comparison test in post hoc multiple comparisons was used to examine the statistical significance (p < 0.05 and p < 0.01) between groups.
Results
Isolation and purification of primary hepatocytes
Through the modified Seglen two-step perfusion method, the primary hepatocytes were obtained and the motility rate was more than 85% by using trypan blue exclusion assay. The primary hepatocytes cultured for 12 h are presented in Figure 1. The freshly isolated primary hepatocytes were discrete, ovate and translucent observed under inverted phase contrast microscope. After cultured for 24 h, the primary hepatocytes were oval or polygonal and increased in size. The cell body was flat and thin and dual-core hepatocytes were increased.

The primary hepatocytes cultured 12 h.
Ethanol-induced injury hepatocyte model
The ethanol-induced injury hepatocyte model was successfully duplicated at 8 h with a dose of 100 mmol/L ethanol.
Time–response study
The results of ALT and AST activities in cell culture supernatant at various time points are presented in Figure 2. The first significant increase (p < 0.05) in the supernatant ALT and AST activities in treated hepatocytes was observed at the 6 h, and the second (p < 0.01) was observed at the 8 h.

Changes of ALT and AST in cell culture supernatant at various times (0, 1, 2, 4, 6, 8, 10 and 16 h) after ethanol exposure (100 mmol/L). (a) Changes of ALT; (b) changes of AST. Values are expressed as the mean ± SD for each group. *p < 0.05, **p < 0.01; n = 6. ALT: alanine aminotransferase; AST: aspartate aminotransferase.
The results of cell GSH content and SOD activity in cells at various time points were presented in Figure 3. A markedly decrease (p < 0.01) in the cell SOD activity and GSH content appeared at the 8 h.
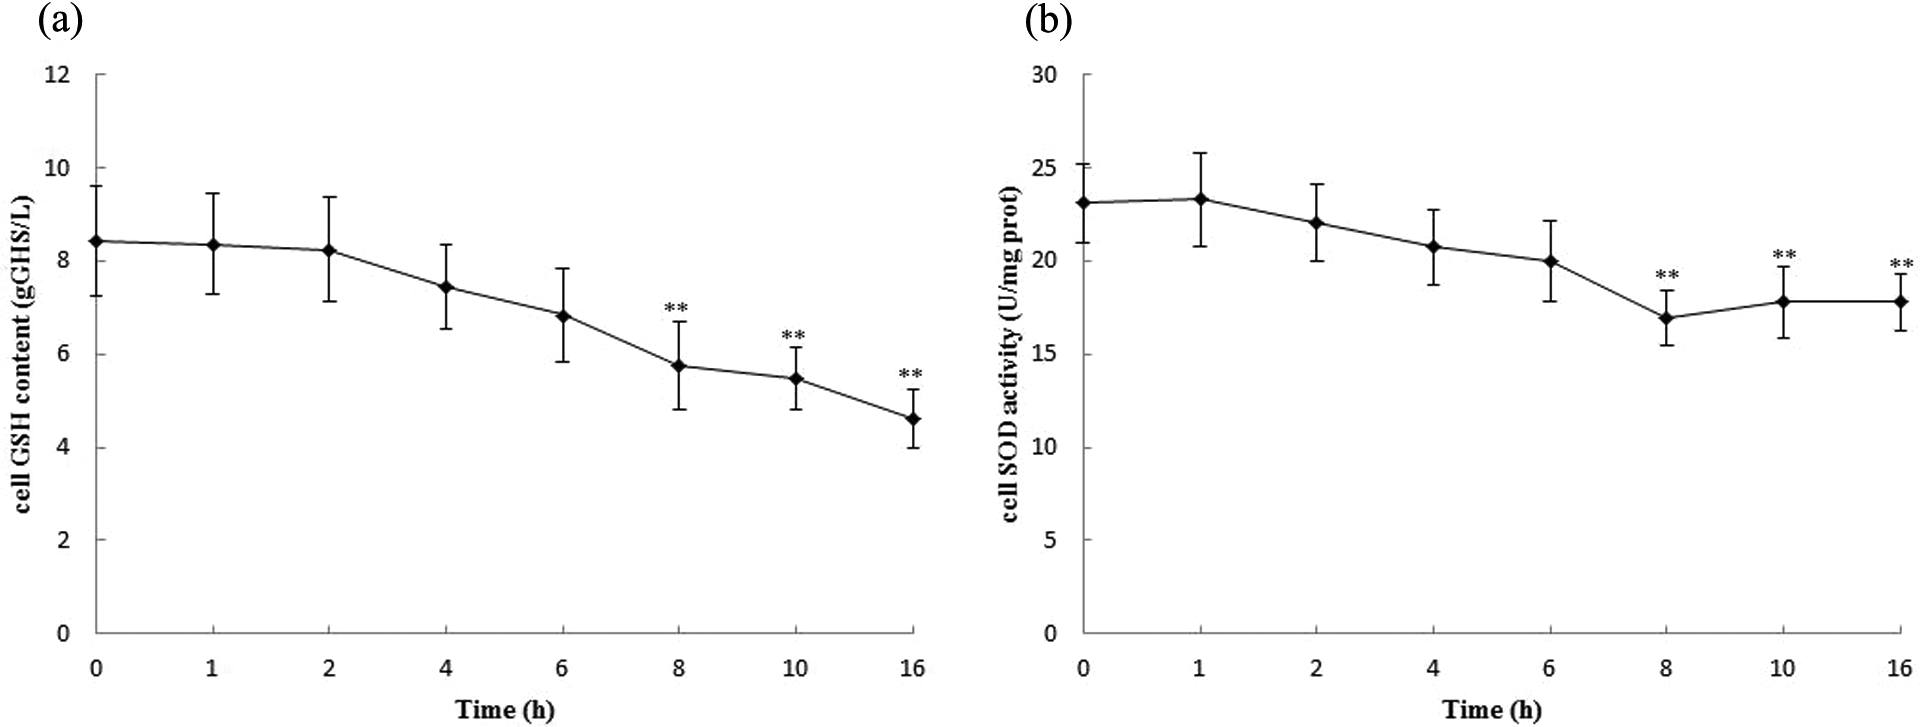
Changes of GSH and SOD in cells at various times (0, 1, 2, 4, 6, 8, 10 and 16 h) after ethanol exposure (100 mmol/L). (a) Changes of GSH; (b) changes of SOD. Values are expressed as the mean ± SD for each group. *p < 0.05, **p < 0.01; n = 6. GSH: glutathione; SOD: superoxide dismutase.
The results of cell culture supernatant GSTA1 and cell MDA levels at various time points are presented in Figure 4. A significant increase (p < 0.01) in the supernatant content of GSTA1 in treated hepatocytes was observed at the 2 h, while other indicators were undetected at this time, and the cell MDA content had not a statistically significant difference until the 6 h (p < 0.05) and the significant increase (p < 0.01) of MDA content was observed at the 8 h. All the indicators were released in a time-dependent manner. The variability of GSTA1 can be observed at the earliest time studied.

Changes of GSTA1 in cell culture supernatant and MDA in cells at various times (0, 1, 2, 4, 6, 8, 10 and 16 h) after ethanol exposure (100 mmol/L). (a) Changes of GSTA1; (b) changes of MDA. Values are expressed as the mean ± SD for each group. *p < 0.05, **p < 0.01; n = 6. GSTA1: glutathione S-transferase A1; MDA: malondialdehyde.
Dose–response study
The results of ALT and AST activities in cell culture supernatant at various concentrations of ethanol are presented in Figure 5. The first significant increase (p < 0.05) in the supernatant ALT and AST activities in treated hepatocytes was observed at the concentration of ethanol, 75 mmol/L, and the second (p < 0.01) was observed at the concentration 100 mmol/L.

Changes of ALT and AST in cell culture supernatant after ethanol exposure (after 8 h) at various concentrations (0, 25, 50, 75, 100, 125 and 150 mmol/L). (a) Changes of ALT; (b) changes of AST. Values are expressed as the mean ± SD for each group. *p < 0.05, **p < 0.01; n = 6. ALT: alanine aminotransferase; AST: aspartate aminotransferase.
The results of GSH content and SOD activity in cells at various concentrations of ethanol are presented in Figure 6. A significant decrease (p < 0.01) in cell GSH content was received at the concentration of ethanol, 100 mmol/L. The first significant decrease (p < 0.05) in cell SOD activity was found at the concentration of ethanol, 75 mmol/L, and the second (p < 0.01) was observed at the concentration 100 mmol/L.

Changes of GSH and SOD in cells after ethanol exposure (after 8 h) at various concentrations (0, 25, 50, 75, 100, 125 and 150 mmol/L). (a) Changes of GSH; (b) changes of SOD. Values are expressed as the mean ± SD for each group. *p < 0.05, **p < 0.01; n = 6. GSH: glutathione; SOD: superoxide dismutase.
The results of cell culture supernatant GSTA1 and the cell MDA levels at various concentrations of ethanol are presented in Figure 7. There had been a significant increase (p < 0.01) in the supernatant content of GSTA1 in treated hepatocytes observed at the concentration of ethanol, 50 mmol/L, but cell MDA content had not a statistically significant difference until the concentration of ethanol, 100 mmol/L. So the variability of GSTA1 can be observed at the lowest dose studied.

Changes of GSTA1 in cell culture supernatant and MDA in cells after ethanol exposure (after 8 h) at various concentrations (0, 25, 50, 75, 100, 125 and 150 mmol/L). (a) Changes of GSTA1; (b) changes of MDA. Values are expressed as the mean ± SD for each group. *p < 0.05, **p < 0.01; n = 6. GSTA1: glutathione S-transferase A1; MDA: malondialdehyde.
Discussion
GSTA1, a phase II metabolic enzyme, can catalyze the binding of glutathione stimulating hormone to electron affinity substances for excretion. 22 GSTA1 induction can occur as a cytoprotective against increased oxidative stress. Recently, studies reported that GSTA1 overexpression can attenuate hydrogen peroxide-induced oxidative stress and protect two species of cells to respond to the associated cytotoxicity by attenuating lipid peroxidation. 16 GSTA1 is an essential component in determining cellular fate and serves also as a sensor for oxidative stress. The biological relevance of increased GSTA1 expression with increasing confluency, it has been said, contributes to a sensor capacity to respond to changes in redox potential during oxidative stress. 21
Long-term excessive alcohol consumption can lead to alcoholic liver disease. Hepatocytes are a primary target of the toxic effects of ethanol in the liver. Previous findings by our group have established ethanol-induced acute hepatic injury model in mice, and liver histology analysis has demonstrated salient features of the model. Alcoholic acute hepatic injury was characterized by round vacuoles, inflammatory cell infiltration and hepatocyte spotty necrosis. 23 However, the mechanisms underlying alcohol-induced hepatotoxicity are complex and remain to be poorly understood. Then we verified GSTA1 was a more sensitive and more accurate indicator of acute hepatic injury in mice than ALT by time–response and dose–response study. 24 The present research was conducted to duplicate the ethanol-induced model in vitro and to determine whether GSTA1 could be used as a sensitive marker of hepatocyte injury by time–response and dose–response study.
In this experiment, the primary hepatocytes with high yield, high activity and strong function were ultimately obtained through a series of improvements of the separation and culture technique. Because of the mice hepatic portal vein was too thin and attached to the ansa interstinalis, the inserting and fixing operation for the vein detained needle was very difficult. In order to avoid the waste of resources caused by the operation fails, the inverse perfusion method of the cannula in the suprahepatic vena cava was adopted in this test. To increase the proliferation and differentiation of primary hepatocytes, the dexamethasone, transferrin, insulin and fetal calf serum was added to the culture medium in this test. Insulin and dexamethasone were used to promote the adherent growth of hepatocytes and maintain the differentiation of hepatic phenotypic characteristics. 25 Furthermore, in order to obtain better adherent effect of hepatocytes, the cell culture plate was pretreated by the collagen from rat tail.
To promptly detect and treat liver injury at an early stage is of great significance for prevention and treatment of ethanolic-induced hepatic injury and other liver diseases. Consequently, it was important to discover the diagnostic index at the early stage that reflects liver injury. ALT and AST activities were the common indicators to evaluate the hepatocyte injury, in view of the fact that both of them are abundant in the hepatocytes cytosol and especially in the process of ethanol-induced hepatocyte injury, the intracellular ALT and AST are released into the bloodstream. Research demonstrated it could be an early diagnosis of anicteric and asymptomatic hepatitis since ALT significantly increased in patients with acute hepatitis. However, in some obese, healthy or with metabolic diseases subjects, there would be the phenomenon of increased ALT, and in some patients had been diagnosed with liver injury, ALT activity was not increased. In addition, ALT has a long half-life, which has limitation for the early diagnosis of liver injury. AST has a short half-life, but it is also significantly increased in the heart, skeletal muscle, kidney and other organ diseases, 17 which indicated that it is a non-specific marker. Therefore, a more sensitive, rapid and specific diagnostic indicators need to be found.
From our experimental results, the cell culture supernatant ALT and AST activities were increased with increasing ethanol concentration and reaction time. A markedly increased (p < 0.01) in the cell culture supernatant ALT and AST levels appeared at the 8 h after ethanol (100 mmol/L) exposure, which suggested that a lot of ALT and AST were secreted into the cell supernatant from now. Furthermore, the degree of hepatocytes injury would be more and more serious.
Ethanol promotes systemic oxidative stress by generating reactive oxygen species (ROS) 20 which generate through ethanol dehydrogenase and CYP2E1-mediated reactions by the excess ethanol in hepatocytes. 26 A large number of antioxidants are quickly mobilized and exhausted to continually remove ROS, such as SOD, GSH and the like. 27 The balance of antioxidants and free radicals will be broken when there are not sufficient antioxidants to resist free radicals. The cell membrane and mitochondria of hepatocytes were damaged by a great quantity of free radicals, which gradually lead to hepatocytes death. Lipid peroxidation was likewise produced by the large amount of free radicals. 28 Excessive free radicals can inhibit fatty acid oxidation, then lead to intrahepatic fat accumulation and eventually lead to hepatocytes membrane lipid peroxidation. After the occurrence of lipid peroxidation, membrane permeability and fluidity are changed by the reduction of membrane phospholipids, so that the function of some enzymes, receptors, ion channels in membrane occur disorder by the change of micro-environment. The main product of lipid peroxidation is MDA 18 whose determination may reflect the degree of hepatic lipid peroxidation so as to reflect the degree of hepatocytes ruin.
From our experimental results, ethanol concentration and reaction time were in proportion to the degree of hepatocytes damage. Both with increased ethanol concentration and with increased influence time of ethanol, decreased hepatocytes and the constantly serious degree of cell damage could be discovered from increased degree of lipid peroxidation and declined antioxidant activity. MDA, SOD and GSH levels were significantly different (p < 0.01) from control group at a dose of 100 mmol/L ethanol. It was probably because antioxidants scavenging capacity was exceeded by the formation of ROS so that oxidative damage and lipid peroxidation were increasingly serious, eventually leading to cell damage at this dose. When the ethanol exposure reached 8 h, the degree of hepatocytes injury was obvious and the indicators were significantly different (p < 0.01) from control group, among which MDA reached the peak and SOD reached the lowest value, and it might be related with the compensatory effect.
GSTA1, an important member of the body’s anti-oxidative damage system, can withstand pro-electronics physical attack and catalyze the exogenous chemical decomposition reaction and then excreted in the cell so as to protect the body. GSTA1 content was detected increased in acute liver injury, which suggest that it might be important as an early diagnostic marker for liver injury treatment. In addition, GSTA1 was more evenly widely distributed in the centrilobular hepatocytes than the limited periportal ALT and AST and had a shorter half-life (approximately 1 h). It suggested that it was more reliable in the early diagnosis of liver injury.
Currently, the major studies about GSTA1 as a specific diagnostic marker for early liver injury are in vivo tests on the basis of animal models and clinical patients. In this study, GSTA1 dose–response and time–response studies were at the cellular level. In primary hepatocytes with ethanol-induced injury, GSTA1 content was proportional to the concentration and reaction time of ethanol. According to dose–response study, GSTA1 content was significantly increased (p < 0.01) at a dose of 50 mmol/L ethanol than the control group, while there was no significant difference for other indicators until a dose of 75 mmol/L. Consequently, comparing with other indicators, GSTA1 could be detected at a lower ethanol dose. In the time–response study, GSTA1 was significantly increased (p < 0.01) as early as 2 h after ethanol exposure, while there was no significant difference for other indicators until 6 h. It suggested that GSTA1 could be detected at an early stage of ethanol exposure.
In conclusion, GSTA1 is more sensitive and reliable than other indicators as an early marker of hepatocyte injury.
Footnotes
Declaration of Conflicting Interests
The author(s) declared no potential conflicts of interest with respect to the research, authorship, and/or publication of this article.
Funding
The author(s) disclosed receipt of the following financial support for the research, authorship, and/or publication of this article: This work was supported by the National Natural Science Foundation of China (grant no. 31472241) and the Application Technology Research and Development Projects in Heilongjiang Province of China (grant no. PC13S03).