
Abstract
Introduction:
Thyroid epithelial cells produce moderate amounts of reactive oxygen species that are physiologically required for thyroid hormone synthesis. Nevertheless, when they are produced in excessive amounts, they may become toxic.
Objective:
The present study is aimed to compare the lipid peroxidation (LPO), antioxidant enzymes – superoxide dismutase (SOD), catalase (CAT), glutathione peroxidase (GPx) and non-protein thiols (reduced glutathione (GSH)) in human thyroid tissues with malignant and non-malignant disorders.
Design and Methods:
The study used human thyroid tissues and blood samples from 157 women (147 diseased and 10 normal). Thyroid hormones, oxidative stress markers and antioxidants were estimated by standard methods.
Results:
LPO significantly increased in most of the papillary thyroid carcinoma (PTC: 82.9%) and follicular thyroid adenoma (FTA: 72.9%) tissues, whilst in a majority of nodular goitre (69.2%) and Hashimoto’s thyroiditis (HT: 73.7%) thyroid tissues, it remained unaltered. GSH increased in PTC (55.3%), remained unaltered in FTA (97.3%) and all other goiter samples studied. SOD increased in PTC (51.1%) and all other malignant thyroid tissues studied. CAT remained unaltered in PTC (95.7%), FTA (97.3%) and all other non-malignant samples (HT, MNG, TMNG) studied. GPx increased in PTC (63.8%), all other malignant thyroid tissues and remained unaltered in many of the FTA (91.9%) tissues and all other non-malignant samples (HT, MNG, TMNG) studied.
Conclusions:
In the case of non-malignant thyroid tumours, the oxidant–antioxidant balance was undisturbed, whilst in malignant tumours the balance was altered, and the change in r value observed in the LPO and SOD pairs between normal and PTC tissues and also in many pairs with multi-nodular goitre (MNG)/toxic MNG tissues may be used as a marker to differentiate/detect different malignant/non-malignant thyroid tumours.
Introduction
One of the common features associated with cancer cells are increased production of free radicals. Free radicals promote several stages of malignant transformation. 1 Studies carried out in both humans and experimental animals showed that lipid peroxidation (LPO) has a very important role in the initiation and promotion of cancer. 2 In the thyroid, reactive oxygen species (ROS) are constantly formed and participate in physiological and pathological processes in the gland. Thyroid cancer is a known inflammatory disease, and the inflammatory microenvironments play an integral part in the pathogenesis of thyroid cancer. This inflammatory environment is a major source of ROS since inflammation is a well-established classical condition that produces high oxidative stress (OS). 3 Thyroid epithelial cells are constantly exposed to ROS and are physiologically necessary and associated with thyroid hormone synthesis. 4 In normal thyroid gland, ROS are actively generated through the process of iodide metabolism and thyroid hormone synthesis. The thyroid-stimulating hormone (TSH) receptor signalling stimulates the synthesis of hydrogen peroxide (H2O2), which is the substrate of thyroperoxidase in thyroglobulin iodination and thyroid hormone synthesis. 5 ROS is therefore generated actively in the process of TSH stimulation of thyroid cells. Altered TSH levels in differentiated malignant thyroid cancers 6 suggested that TSH stimulation could actively produce H2O2, thus contributing to the high OS.
It is crucial for thyrocytes to be efficiently protected against excessive ROS production to function properly. Antioxidant enzymes can limit the toxicity of endogenously and naturally produced ROS. Antioxidants show different patterns during cancerous transformation, and cancerous cells exhibit high variability of antioxidant enzyme activities when compared with their appropriate normal cell counterparts. 7 Thyroid gland is an ideal model to study the involvement of ROS in the pathogenesis of spectrum of thyroid abnormalities, as it presents with many pathologies from harmless goitres to benign adenomas to indolent malignant carcinomas. However, there is no detailed comparative report available to evaluate the oxidant/antioxidant balance in thyroid tissues of patients with malignant and non-malignant thyroid disorders. Thus, the current study is aimed to evaluate the level of oxidant/antioxidant enzyme levels and the role of OS in thyroid tissues of patients diagnosed for various thyroid disorders.
Materials and methods
Collection of thyroid tissues
The research plan on human thyroid tissues has been carried out in accordance with the Declaration of Helsinki (2000) of the World Medical Association and has been approved by our Institutional Ethical Committee for Research in Humans (UNOM/HEC/2003/9). Thyroid tumour tissues excised during surgery from 147 women patients (Department of Endocrine Surgery, Madras Medical College, Chennai, Tamil Nadu, India, during the period from April 2005 to December 2007) were used in the present study. The tumour type was confirmed and categorized on the basis of histopathological report from the Department of Pathology, Madras Medical College, Chennai, Tamil Nadu, India, into the following groups: multi-nodular goitres, 26; toxic multi-nodular goitres, 10; Hashimoto’s thyroiditis (HT), 19; follicular adenomas, 37; medullary carcinomas, 2; follicular carcinomas, 4; papillary carcinomas, 47; and insular thyroid carcinoma, 2.
Patients previously treated with radiation therapy or those who had irradiation to the neck were excluded from the study. Tissues from opposite lobe of the thyroid in patients subjected to total thyroidectomy (10 females) were considered normal, confirmed based on the histopathological report and used as controls. Informed consent was obtained from the patients or their caretakers for the use of any data and tissues for research after explaining the purpose and nature of all procedures used. Every sample was assigned a unique identifier to protect patient confidentiality.
Processing of thyroid tissues
The thyroid tissues obtained during surgery were immediately placed in RNA stabilization reagent and brought to the laboratory in ice, cleared from adhering tissues and fat if any, rinsed several times in ice-cold physiological saline to remove blood, snap-frozen immediately in liquid nitrogen, and stored at −80°C for biochemical assays as we described earlier. 8
Collection of blood samples
Blood samples from patients and normal subjects were collected and kept at room temperature for 30 min, centrifuged at 1500g for 5 min to separate sera and subsequently stored at −80°C as described earlier. 8
Immunoradiometric assay of TSH
TSH immunoradiometric assay kit was obtained from Diasorin (Saluggia, Italy). First, 100 µl serum was added in duplicate into TSH antibody-coated tubes along with standards. Then, 200 µL tracer (Iodine 125-labelled TSH antibody), including two non-antibody–coated tubes (to measure the total radioactivity), was added. All tubes were covered with adhesive foil and incubated in an orbital shaker for 1 h at room temperature. All tubes were washed, except non-anti-TSH antibody-coated tubes, twice with 22 mL washing solution and the liquid residue drained completely. The radioactivity in each tube was counted in a Wallac Wizard 1470-010 gamma counter (PerkinElmer, USA). The sensitivity of the assay was 0.07 mU/L. The cross-reactivity with other hormones was 0.1%, 0.01% and 0.1%, respectively, for LH, FSH and hCG. Inter- and intra-assay variation was 2.3–13.6% and 1.5–5.1%, respectively.
Radioimmunoassay of thyroid hormones
To access the functional status of thyroid glands of study subjects, thyroid hormones (total triiodothyronine (TT3) and total thyroxine (TT4)) were assayed by solid-phase radioimmunoassay. The sensitivity of the total T4 assay (Diasorin; Saluggia, Italy) was 0.25 µg/dL. The total T4 antiserum had a cross-reactivity of 100% with
Preparation of tissue homogenate for biochemical assay
The thyroid tissues were homogenized (100 mg/mL) using a motor-driven Teflon-coated pestle whilst being kept on ice (4°C) in 0.1 mol/L Tris–hydrochloric acid (HCl) buffer (pH 7.4) and centrifuged at 3000 r/min for 10 min. The supernatant was collected and used to estimate the antioxidant enzymes.
Estimation of LPO
LPO was measured by the method described by Devasagayam and Tarachand. 9 The reaction mixture consisted of 1 mL of 0.15 mol/L Tris-HCl buffer (pH 7.4), 0.3 mL of 10 mmol/L monopotassium phosphate and 0.2 mL of tissue extract in a total volume of 2 mL. The tubes were incubated at 37°C for 20 min with constant shaking. The reaction was stopped by the addition of 1 mL of 10% trichloroacetic acid. The tubes were shaken well and 1.5 mL thiobarbituric acid was added and heated in a boiling water bath for 20 min. The colour developed was read at 532 nm, and the malondialdehyde (MDA) content of the sample was expressed as nanomoles of MDA formed per milligram protein.
Estimation of SOD
Superoxide dismutase (SOD) was estimated by the method of Marklund and Marklund. 10 Briefly, the assay mixture contained 2 mL of 0.1 mol/L Tris-HCl buffer (pH 8.2), 0.5 mL of 2 mmol/L pyrogallol, 0.75 mL of 1:10 diluted aliquot of the tissue extract and water to give a final volume of 4 mL. The rate of inhibition of pyrogallol autoxidation after the addition of tissue extract was noted. The amount of enzyme required to give 50% inhibition of pyrogallol autoxidation is considered as one unit of enzyme activity, which was expressed as units per milligram protein.
Estimation of GPx
Glutathione peroxidase (GPx) was estimated by the method of Rotruck et al. 11 The reaction mixture contained 0.5 mL 0.4 mol/L sodium phosphate buffer (pH 7.0), 0.1 mL sodium azide, 0.2 mL reduced glutathione (GSH), 0.1 mL H2O2 and 0.5 mL of 1:10 diluted aliquot of the enzyme extract, and the total volume was made up to 2 mL with water. The tubes were incubated at 37°C for 3 min, and the reaction was terminated by the addition of 0.5 mL of 10% TCA and centrifuged at 4°C for 10 min at 1500 r/min. To determine the residual glutathione content, the supernatant was removed, and to this 4 mL of 0.3 mol/L disodium hydrogen phosphate and 1 mL 5,5′-dithio bis-nitrobenzoic acid (DTNB; 0.004%) reagent were added. The colour developed was read at 412 nm against the reagent blank containing using Ellman’s reagent (19.8 mg DTNB in 100 mL 0.1% sodium nitrate). The enzyme activity was expressed as microgram of GSH utilized per minute per milligram protein.
Estimation of GSH
GSH was estimated by the method described by Boyne and Ellman. 12 Briefly, 0.5 mL of tissue extract was precipitated with 2 mL of 5% TCA. After centrifugation, 1 mL of supernatant was taken and 0.5 mL of Ellman’s reagent (19.8 mg of DTNB in 100 mL of 1% sodium citrate) and 3 mL of phosphate buffer were added. Standards were treated in a similar way, and the colour developed was read at 412 nm and expressed as nanomoles per gram tissue.
Estimation of CAT
Catalase (CAT) was assayed by the method of Sinha. 13 Briefly, the assay mixture contained 0.5 mL of 0.2 M H2O2, 1 mL of sodium phosphate buffer and 0.4 mL water. Tissue extract (0.1 mL) was added to initiate the reaction. Then, 2 mL of dichromate–acetic acid reagent (5% potassium dichromate and glacial acetic acid were mixed in 1:3 ratio) was added to arrest the reaction. To the control tube, the enzyme was added after the addition of the dichromate–acetic acid reagent. The green colour developed was read at 590 nm against the blank containing all components except the enzyme. The enzyme activity was expressed as units per milligram protein that utilizes 1 micromole of H2O2 per minute.
Statistical analysis
Results were expressed as median or mean ± SEM. Statistical difference between groups was analyzed using Kruskal–Wallis one-way analysis of variance for non-parametric samples using the statistical analysis software Prism-6 (Version 6.05), the values of p < 0.05 were considered to be significant. Pearson correlation analysis was performed using the statistical analysis software SPSS 7.5 (Students’ version) to assess the strength of association between LPO and antioxidants. Z-test was performed to calculate significant difference between r values as follows:
First, Fisher’s Z-transformation was used to transform each r value to z value


where, Z 1 and Z 2 are the Z transformations of r 1 and r 2, and n 1 and n 2 indicate the sample size in tumour and normal, respectively.
Results
The data on baseline characteristics and serum thyroid hormone profile are depicted in Table 1. Age, height, weight and body mass index did not show any appreciable difference compared to control. Serum levels of urea remained normal in malignant thyroid tumour tissues. Serum glucose levels were decreased in malignant thyroid tissues, whilst it remained normal in non-malignant thyroid tissues. Serum level of creatinine increased in adenoma tissues, whilst it decreased in HT tissues. The difference in the creatinine in malignant thyroid tumour tissues is not statistically appreciable.
Baseline characteristics and serum thyroid hormone profile.a

PTC: papillary thyroid carcinoma; FTC: follicular thyroid carcinoma; FTA: follicular thyroid adenoma; HT: Hashimoto’s thyroiditis; MNG: multi-nodular goitre; TMNG: toxic multi-nodular goitre; BMI: body mass index; TSH: thyroid-stimulating hormone; MTC: medullary thyroid carcinoma; ITC: insular thyroid carcinoma.
aData were presented as mean ± SEM.
The data on LPO, SOD, CAT, GPx and GSH obtained from different human thyroid disorders are summarized in Figures 1 to 5. As depicted in Figure 1, LPO levels were high in majority of the cases (39 of 47) analysed, whilst 7 cases did not show variation with that of the normal with PTC. FTA also exhibited a pattern similar to that of PTC, where 27 of 37 cases showed higher levels of LPO and 8 of 37 were within the normal range. All the cases of FTC, medullary thyroid carcinoma (MTC) and ITC analysed were on higher side when compared with the normal. Most of the cases analysed with HT (14 of 19) and multi-nodular goitre (MNG; 18 of 26) were within the normal range.

Levels of LPO in malignant and non-malignant human thyroid tissues. The box and whisker plot comprises three components: The horizontal lines in the box indicate the central tendency of location (median value), a box to indicate variability (standard error) that represents values from the lower to the upper quartiles (25th to 75th percentile), the line extends from the minimum (5th percentile) to the maximum (95th percentile) values, excluding ‘outside’ values, that is, values smaller than the lower quartile minus 1.5-fold the interquartile range, or larger than the upper quartile plus 1.5-fold the interquartile range. *p < 0.05; **p < 0.01; ***p < 0.001; ****p < 0.0001: Statistical significance bars are shown and represent results of Kruskal–Wallis test for the non-parametric samples. LPO: lipid peroxidation.

Levels of SOD in malignant and non-malignant human thyroid tissues. The box and whisker plot comprises three components: The horizontal lines in the box indicate the central tendency of location (median value), a box to indicate variability (standard error) that represents values from the lower to the upper quartiles (25th to 75th percentile), the line extends from the minimum (5th percentile) to the maximum (95th percentile) values, excluding ‘outside’ values, that is, values smaller than the lower quartile minus 1.5-fold the interquartile range, or larger than the upper quartile plus 1.5-fold the interquartile range. *p < 0.05; **p < 0.01; ***p < 0.001: Statistical significance bars are shown and represent results of Kruskal–Wallis test for the non-parametric samples. SOD: superoxide dismutase.

Levels of GPx in malignant and non-malignant human thyroid tissues. The box and whisker plot comprises three components: The horizontal lines in the box indicate the central tendency of location (median value), a box to indicate variability (standard error) that represents values from the lower to the upper quartiles (25th to 75th percentile), the line extends from the minimum (5th percentile) to the maximum (95th percentile) values, excluding ‘outside’ values, that is, values smaller than the lower quartile minus 1.5-fold the interquartile range, or larger than the upper quartile plus 1.5-fold the interquartile range. *p < 0.05; **p < 0.01; ***p < 0.001; ****p < 0.0001: Statistical significance bars are shown and represent results of Kruskal–Wallis test for the non-parametric samples. GPx: glutathione peroxidase.

Levels of GSH in malignant and non-malignant human thyroid tissues. The box and whisker plot comprises three components: The horizontal lines in the box indicate the central tendency of location (median value), a box to indicate variability (standard error) that represents values from the lower to the upper quartiles (25th to 75th percentile), the line extends from the minimum (5th percentile) to the maximum (95th percentile) values, excluding ‘outside’ values, that is, values smaller than the lower quartile minus 1.5-fold the interquartile range, or larger than the upper quartile plus 1.5-fold the interquartile range. *p < 0.05; **p < 0.01; ***p < 0.001; ****p < 0.0001: Statistical significance bars are shown and represent results of Kruskal–Wallis test for the non-parametric samples. GSH: reduced glutathione.

Levels of CAT in malignant and non-malignant human thyroid tissues. The box and whisker plot comprises three components: The horizontal lines in the box indicate the central tendency of location (median value), a box to indicate variability (standard error) that represents values from the lower to the upper quartiles (25th to 75th percentile), the line extends from the minimum (5th percentile) to the maximum (95th percentile) values, excluding ‘outside’ values, that is, values smaller than the lower quartile minus 1.5-fold the interquartile range, or larger than the upper quartile plus 1.5-fold the interquartile range. *p < 0.05; **p < 0.01; ****p < 0.0001: Statistical significance bars are shown and represent results of Kruskal–Wallis test for the non-parametric samples. CAT: catalase.
Figure 2 depicted the level of SOD in various disordered human thyroid tissues. SOD levels increased in many of the PTC (30 of 47) and FTA (15 of 37) samples, whilst the rest of them were within the normal range. Consistently, all the samples analysed with FTC, MTC and ITC showed increased levels when compared with the normal. Of the 19, 12 HT samples, 10 of 10 TMNG samples and 23 of 26 MNG samples remained within normal range.
Figure 3 depicted the levels of GPx in various disordered human thyroid tissues. GPx is regulated in a different way between PTC and FTA, where 30 of 47 cases analysed showed increased levels with PTC, whilst 34 of 37 analysed did not show any variation with that of normal. Similar to SOD, GPx showed a consistent increase with FTC, MTC and ITC, whilst TMNG and MNG (23 of 26) showed no change.
Figure 4 depicted the level of GSH in human thyroid tissues. Nearly 56% (26 of 47) of the cases analysed with PTC showed increase in GSH levels, whilst the rest of them (21 of 47) were within the normal range. Most of the cases analysed with FTA (36 of 37) and all the cases with HT (19 of 19), TMNG (10 of 10) and MNG (26 of 26) did not show any variation compared with normal. Three of the four cases with FTC, 2 of 2 with MTC and ITC showed a clear increase with that of normal.
Figure 5 depicted the levels of CAT in various disordered human thyroid tissues. Of the 47 cases, 45 in PTC and 36 of 37 cases with FTA showed normal levels, whilst it showed a consistent increase with FTC, MTC and ITC. Consistently all the cases analysed with HT, TMNG and MNG showed no change with that of the normal.
Relationship between LPO, CAT, GSH and SOD levels in different thyroid disorders
We postulated that the oxidant/antioxidant system in different thyroid disorders will not be the same as in normal tissues. In order to compare the oxidant/antioxidant status between them, Pearson’s correlation coefficient analysis was employed and determined the r value for each pair to evaluate the relationship between the various antioxidant enzymes and lipid peroxidation parameters studied. From Table 2, different tendencies of the r values were observed between different thyroid disorders and normal tissues. In normal tissues, non-significant associations were observed in all the pairs except in CAT and LPO pair. In contrast, in non-malignant thyroid tumour tissues and also in PTC tissues, a strong positive association was observed in all the pairs analysed except in very few. In normal thyroid tissues, the associations were moderate; however, in non-malignant and PTC tumours, the associations were stronger, and in FTC, the association was weaker. Data on thyroid tumourous tissues depicted stronger associations in toxic multi-nodular goitre tissues than any other tissues analysed in the present study. These data suggested that the balanced correlation of the oxidant/antioxidant status were disturbed during the process of tumourigenesis.
Simple Pearson correlation coefficient analysis of relationship among LPO, CAT, GSH and SOD in different thyroid disorders.a
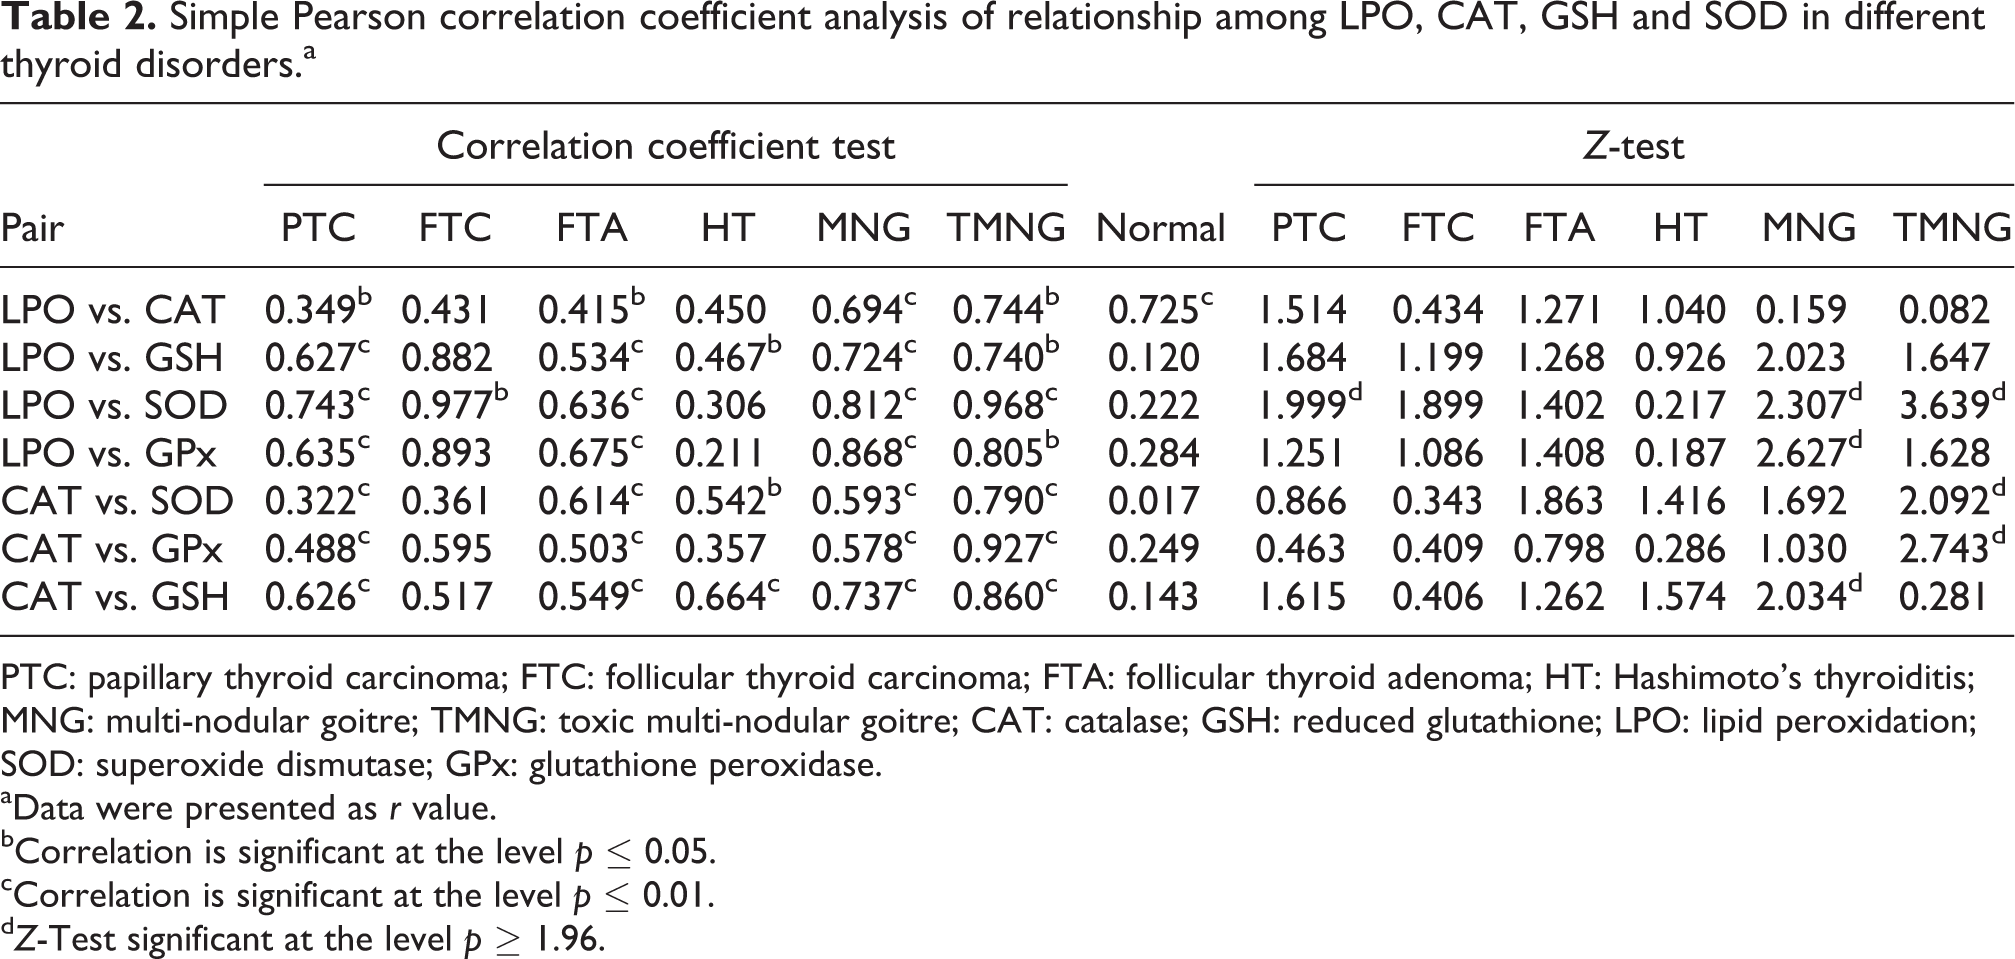
PTC: papillary thyroid carcinoma; FTC: follicular thyroid carcinoma; FTA: follicular thyroid adenoma; HT: Hashimoto’s thyroiditis; MNG: multi-nodular goitre; TMNG: toxic multi-nodular goitre; CAT: catalase; GSH: reduced glutathione; LPO: lipid peroxidation; SOD: superoxide dismutase; GPx: glutathione peroxidase.
aData were presented as r value.
bCorrelation is significant at the level p ≤ 0.05.
cCorrelation is significant at the level p ≤ 0.01.
d Z-Test significant at the level p ≥ 1.96.
Kruskal–Wallis test of difference among LPO, CAT, GSH and SOD in control and malignant/non-malignant thyroid tumour tissues.

CAT: catalase; GSH: reduced glutathione; LPO: lipid peroxidation; SOD: superoxide dismutase; GPx: glutathione peroxidase; ns: not significant.
a p ≤ 0.01: significant.
Significance of difference between r values
For comparison of the changes in oxidant/antioxidant status between benign/malignant and normal thyroid tumour tissues, we used Fisher’s z-transformation to test the significance of the r value difference. Multi-nodular goitre tissues gave significant z-score in LPO and SOD/LPO and GPx/CAT and GSH pairs. In toxic multi-nodular goitre tissues, the pairs LPO and SOD/CAT and SOD/CAT and GPx gave significant z-score, whilst the other pairs in MNG and TMNG gave non-significant z-value. PTC tissues gave a significant z-value in the LPO and SOD pair, whilst all other pairs of PTC gave non-significant z-value. In FTC, FTA and HT, non-significant z-value was observed in any of the pairs studied. The non-significant z-value change observed in FTC, FTA and HT revealed that the pairs analysed were in close association with both normal and FTC/FTA/HT tissues. The non-significant z-value change observed in the pairs LPO and CAT/LPO and GSH revealed that CAT and GSH were in close association with LPO in both normal and different thyroid tumours; however, SOD and GPx were completely different from that of LPO between toxic and multi-nodular goitre and PTC tissues. Similarly, GSH was in very close association with CAT in both normal and TMNG tissues; however, GPx was completely different from that of CAT and GSH between normal and TMNG tissues. In contrast, GPx was in close association with CAT between normal and MNG tissues, whilst the GSH is completely different from that of CAT and GSH between normal and TMNG tissues (Table 2).
Discussion
Increased OS associated with increased concentrations of free radicals has been reported in patients with thyroid disorders. 14 –19 The present study reported the elevated levels of LPO in malignant (PTC, FTC, MTC and ITC) and in FTA tissues analysed, whilst the non-malignant thyroid tissues (MNG, TMNG and HT) analysed did not show any variation with that of the control. This is consistent with the earlier reports, 18 –20 which showed elevated level of LPO in malignant thyroid tumours, whilst non-malignant thyroid tumour tissues were comparable with the normals. In the present study, the levels of GSH, SOD, GPx and CAT were found to be elevated consistently in all thyroid malignant tumour tissues, whilst did not show any variation in multi-nodular and toxic nodular goitre tissues. It is suggested that the increase in LPO may be due to the inability of the peroxide-scavenging enzymes to keep pace with the rate of peroxides being produced by the thyroid tissues and thus indicates that H2O2 and its active product, the hydroxyl radical, might be involved in neoplastic change. Senthil and Manoharan 16 and Akinci et al. 19 reported the elevation in LPO and decline in antioxidants status in blood samples of thyroid cancer patients. In fact, serum enzyme activities or MDA levels are good indicators of the systemic oxidant/antioxidant status but not necessarily indicate their real change occurring in the thyroid directly.
Lipid peroxides that are generated at the site of tissue injury could be transferred through circulation to other organs and tissues to provoke damage by propagating LPO. Mano et al. 21 reported the elevated levels of LPO and disturbed antioxidant enzymes in thyroid tumour tissues of patients with PTC. They suggested free radicals and lipid peroxide may not be completely scavenged in PTC and therefore these substances may affect the cell function. Hence, the observed increase in LPO in malignant thyroid tumour tissues in the present study may be related to overproduction of lipid peroxides in tumour tissue itself with consequent leakage into plasma. In the present study, the LPO concentration was within normal range in non-malignant thyroid tumours analysed. It was previously reported that hyperthyroidism resulted in a marked increase in intracellular antioxidant enzymes. 22 Hyperthyroidism enhances ROS generation and produces changes in antioxidant systems since thyroid hormones accelerate the basal metabolic rate and oxidative metabolism. 23 In the present study, the thyroid hormone (TT3 and TT4) levels are increased in MNG and TMNG patients.
The observed increase in LPO levels in nodular goitre may be due to increased levels of thyroid hormones. GPx, SOD and CAT are most important enzymes of cell antioxidant defence system. Both GPx and CAT are major defences against harmful side effects of ROS in the cultured thyrocytes and have a high capacity to degrade exogenous H2O2. 24 GPx catalyses the decomposition of H2O2 to H2O and reduces organic peroxide to corresponding alcohols. In the present study, GPx levels are increased in malignant thyroid tumours, whilst it remained normal in non-malignant thyroid tumour tissues. GPx activity was indeed increased in malignant thyroid tissues, suggesting that it may protect thyrocytes when H2O2 levels go up. The present study reveals that the TSH levels are low in the study group of patients bearing thyroid disorders. Higher levels of GSH was associated with TSHR stimulation. In the present study, the decreased levels of TSH might activate the feedback mechanism and hence the TSHR may be activated. The observed increase in GSH levels in malignant thyroid tissues revealed that the decreased level of TSH might be one of the factors behind the increased level of GSH through increased TSHR levels. The rise in GSH may be serving as a substitute for the enhanced GPx activities.
Akinci et al. 19 and Sugawara et al. 25 reported lower levels of SOD in goitre tissues. Lassoued et al. 26 reported the increased level of SOD in thyroid carcinoma and adenoma tissues. Sugawara et al. 25 reported normal level of SOD in PTC tissues. In the present study, the SOD levels remained normal in toxic and multi-nodular goitre tissues. In malignant thyroid tissues, SOD levels increased in many of the samples analysed. FTA and HT tissues showed increased level of SOD in many of the samples analysed. Mano et al. 21 reported decreased level of SOD in both PTC and FTA. But one has to note that they measured copper/zinc SOD, whilst we measured total SOD. Mano et al. 21 also reported the increased level of manganese SOD in PTC and FTA. Hence, the observed differences in SOD levels between malignant and non-malignant tissues might be due to the differences in the subsets of SOD. In the present study, in TMNG tissues, LPO levels were increased in many samples analysed, whilst CAT, GPx, GSH and SOD levels remained normal. Rom-Boguslavskaia et al. 27 reported the increased level of LPO in toxic goitre tissues. The present study also supports the same. The observed increase in LPO levels in TMNG might be due to the hyper functioning of thyroid, the notion supported by the elevated levels of thyroid hormone profile observed in the present study.
An important issue we addressed in this study is the change in the correlation state of the LPO/CAT/GSH/GPx/SOD. In normal thyroid tissues, many of the pairs revealed only a moderate association, in contrast to different thyroid tumours. The z-scores present strong evidence that the normal and different thyroid tumour tissues can be recognized as different populations using the different pairs of oxidant/antioxidants analysed in the present study. Of note is the remarkable r value change in the LPO and SOD pairs between normal and PTC tissues and also in many pairs with MNG/TMNG tissues. This can be utilized as a marker to differentiate/detect different malignant/non-malignant thyroid tumours. From these, it is very clear that the roles of SOD and GPx were different in terms of LPO mainly in nodular goitres and also in PTC tissues.
To summarize, the results confirm that changes in thyroid tissue oxidant–antioxidant balance have a definite role in malignant transformation. As far as non-malignant thyroid tumours were concerned, there appears to be no disturbance in the oxidant–antioxidant balance. However, the involvement of oxidant–pro-oxidants in the transformation of non-malignant thyroid tumours into malignant thyroid tumours needs to be further explored.
Footnotes
Declaration of Conflicting Interests
The author(s) declared no potential conflicts of interest with respect to the research, authorship, and/or publication of this article.
Funding
The author(s) disclosed receipt of the following financial support for the research, authorship, and/or publication of this article: This study was supported by a grant from Department of Biotechnology, Government of India (BT/PR4841/Med/12/187/2004).