
Abstract
The in utero environment is a key factor controlling the fate of the growing embryo. The deleterious effects of statins during the fetal development are still not very well understood. Data from animal studies and retrospective studies performed in pregnant women give conflicting reports. In this study, using in vitro differentiation model of embryonic stem cells, which mimic the differentiation process of the embryo, we have systematically exposed the cells to lipophilic statins, simvastatin, and atorvastatin at various doses and at critical times during differentiation. The analysis of key genes controlling the differentiation into ecto-, meso- and endodermal lineages was assessed by quantitative polymerase chain reaction. Our results show that genes of the mesodermal lineage were most sensitive to statins, leading to changes in the transcript levels of brachyury, Flk-1, Nkx2.5, and α/β-myosin heavy chain. In addition, changes to endodermal marker α-fetoprotein, along with ectodermal Nes and Neurofilament 200 kDa, imply that during early differentiation exposure to these drugs leads to altered signaling, which could translate to the congenital abnormalities seen in the heart and limbs.
Introduction
High cholesterol levels in the blood is a major predisposing factor for coronary heart disease and cardiovascular death 1 and has therefore led to the greater use of lipid-lowering medications. 1,2 For many years hyperlipidemia was said to be a natural consequence of pregnancy due to the alterations in the levels of sex hormones and hepatic and adipose metabolism prevalent in the system. Therefore, no monitoring of cholesterol or need for regulating elevated levels was considered. However, the in utero environment has great bearing on fetal health and is therefore a matter of great concern. High maternal cholesterol levels during pregnancy are now linked with increased risks of preterm delivery, gestational diabetes, and preeclampsia, as well as the later development of atherosclerosis in the offsprings. 3 – 8
“Statins” are a group of cholesterol-lowering drugs that act on the key enzyme, β-hydroxy-β-methyl glutaryl-coenzyme A (HMG-CoA) reductase, of the cholesterol biosynthetic pathway. 9 They have been used successfully in the treatment of hyperlipidemia and for reducing morbidity and mortality in coronary artery disease. When these drugs were first introduced in the late 1980s they were categorized as “X” owing to the results from animal studies where they showed developmental toxicity on the axial skeleton, viscera, and central nervous system. In addition, by lowering the cholesterol levels they also interfered with development. 10,11 Statins could exert this effect as they lead to an inhibition of a critical component, mevalonic acid, which is involved in DNA replication and is also essential for the synthesis of steroids and cell membranes in the fetus. 12 – 14 In spite of this, statins are still prescribed to pregnant mothers as physicians have to weigh the risk to benefit ratio. 9,15 – 16 The lack of data on the adverse effects of statins during pregnancy could be due to either lack of reporting 17 or the want of an in vitro model system, which recapitulates the events in fetal development. Thus, over the years, no concrete results as to the safety of statins use in pregnancy have been seen. Edison and Muenke examined case reports of statins exposure during the sensitive first trimester of development. They found that these drugs led to central nervous system and limb anomalies to the fetuses. 18 Simvastatin and atorvastatin were reported to cause fetal neurological damage and central nervous system defects as well as impaired placental implantation. 19 – 21 However, a study conducted in Canada found no evidence of an increased risk of fetal anomalies among first-trimester statins users or any discernible pattern of congenital anomalies among live births, but their conclusions were uncertain in the absence of outcome data on nonlife births. 22
Atorvastatin and simvastatin both being lipophilic in nature achieve embryo placental concentrations similar to those of maternal plasma and hence pose a greater threat to the developing fetus. However, conflicting findings and the lack of scientific data on the effect of simvastatin and atorvastatin during fetal development, with regard to the developmental toxicity risks of first trimester use of statins, prompted us to carry out this systematic study using the embryonic stem (ES) cell model system. Mouse ES cell lines have been on the forefront in research for understanding embryonic development at gene and protein level. Their differentiation mimics the changes that occur during embryogenesis in vivo, traceable according to markers of lineage specification. 23,24 In vivo, early cell division stages (blastomeres) to the morula stage are known as totipotent, for the reason that they can give rise to highly complex organism. Cells from the inner cell mass can retain the potential to generate three germ layers, the endoderm, mesoderm, and ectoderm, as well as the primordial germ cells, the founder cells of male and female gametes. 25 In vitro, mouse ES cells showed the potential to generate the different somatic and germ cell types. 26 – 29 Therefore to assess the developmental toxicity risk on the use of statins, the analysis of key marker genes for the three lineages was studied. Dose, timing, and duration of drug exposure are important factors in evaluating potential developmental toxicity of statins, and hence multiple time points were studied using two different modes for differentiation in vitro, that is, monolayer as well as embryoid body (EB). EBs are three-dimensional structures that resemble the early embryo; however, owing to varying sizes, the diffusion of various chemicals and gases permeating to the cells within the EB might vary greatly and hence the nonuniformity between the EBs will impact the results. On the other hand, the monolayer method, whereby differentiation proceeds by avoiding the formation of EBs and therefore the ease as well as the reproducibility scores over the hanging drop method. We therefore used these two methods of differentiation for comparing the effect of atorvastatin and simvastatin. Since we found a similar pattern of changes in the gene expression we therefore carried out further studies using the monolayer method of differentiation.
The results from our study suggests that statins exposure during critical times in the development process impacts the expression of key genes involved in ectodermal, mesodermal, and endodermal differentiation.
Materials and methods
Cell lines and culture conditions
The mouse ES cell line D3 was cultured at 37°C and 5% carbon dioxide (CO2) and routinely passaged three times in a week. ES cells were cultured in Dulbecco’s modified Eagle’s medium (DMEM; Invitrogen, Carlsbad, California, USA), complemented with 15% heat-inactivated fetal bovine serum (FBS; Sigma, St Louis, Missouri, USA), 2 mM glutamine (Invitrogen), 50 U/ml penicillin and 50 μg/ml streptomycin (Gibco Life Technologies), 1% nonessential amino acids (Invitrogen), 0.1 mM β-mercaptoethanol, and 1000 U/ml leukemia inhibitory factor (LIF, ESGRO, Chemicon International Inc., Temecula, California, USA).
NIH 3T3 cells were procured from National Center for Cell Sciences (Pune, Maharashtra, India). NIH 3T3 was maintained in complete medium, which was composed of DMEM (Invitrogen), supplemented with 10% FBS, 50 U penicillin/ml, and 50 µg streptomycin/ml (Gibco Life Technologies, Carlsbad, California, USA). When the cells were approximately 80–90% confluent, they were subcultured (two times a week).
Dose preparations of statins (simvastatin and atorvastatin)
Simvastatin and atorvastatin (Sigma Aldrich) were applied in concentrations of 0.003, 0.006, 0.012, 0.024, 0.048, and 0.096 µM. The rationale for choosing these concentrations for cytotoxicity analysis was based on approximate peak plasma concentration of statin reached during treatment of hypercholesterolemia, which was found to be 0.1 µM. 30 We therefore used this as the upper limit and did twofold serial dilutions to give a total of six concentrations to be analyzed. Simvastatin was dissolved in 0.1 M sodium hydroxide (NaOH), which was then further diluted with the DMEM. The final concentration of NaOH was 0.1 mM and was used as vehicle control. Atorvastatin was dissolved in dimethyl sulfoxide (DMSO; 0.25% DMSO final concentration and used as vehicle control). The control used for comparing data was the vehicle control. To study the effect on differentiation, the doses were selected based on the cytotoxicity analysis and were 0.003, 0.006, 0.012, and 0.024 µM.
Determination of the cytotoxicity of the statins on 3T3 fibroblasts and ES cells
Cytotoxicity of the statins was selected on the basis of 3-(4,5-dimethylthiazol-2yl)-2,5-diphenyl tetrazolium bromide (MTT) assay using NIH 3T3 fibroblast cells and D3 ES cells as previously described. 31 In brief, trypsinized cells were counted using a hemocytometer and seeded in each well of 96-well plates at density of 500 cells/200 µl media with the test concentrations of simvastatin and atorvastatin. The media was changed with test concentrations on days 3 and 5. Cytotoxicity was assessed using the MTT on day 10. Then, 20 μl of MTT solution (5 mg/ml in phosphate-buffered saline (PBS)) was added to each well containing the media and incubated for 4 h at 37°C. Then the media was replaced with 150 μl of DMSO and incubated for next 20 min. Absorbance of the formazan products due to viable cells was measured at a wavelength of 570 nm in an enzyme-linked immunosorbent assay reader. The half maximal inhibitory concentration (IC50) for 3T3 and D3 was analyzed from the concentration–response curves.
Differentiation of ES cells
Hanging drop method
The EB assay was selected for the differentiation experiments because EB mirrors the early step of embryogenesis in both mouse and human ES cell differentiation protocols. 26,32 Differentiation was carried out in hanging drops according to a modified method. 33 In brief, a drop of 20 μl from ES cell suspension (5 × 10⁴ cells/ml) was placed onto the inner side of the lid of a petri dish (Corning, Brooklyn, New York, USA) filled with PBS (Himedia, Mumbai, Maharashtra, India) and then incubated at 37°C with 5% CO2. After culturing for 3 days, the formed aggregates (EBs) were transferred into bacteriological petri dishes (nontreated). At day 5, EBs were plated separately into 24-well plates (Thermo Scientific, Waltham, Massachusetts, USA) for immunocytochemistry analysis and also in 60 mm-treated dishes (Thermo Scientific) for RNA isolation (Table 1).
Schematic outline of experimental steps for two different protocols.

+: dosing day.
Monolayer differentiation
The monolayer differentiation was also adopted to mimic differentiation of ES cells. 34 The cells were seeded at density of 5 × 10⁴/ml in 6-well plates (Thermo Scientific) in DMEM, complemented with 15% heat-inactivated FBS, 2 mM glutamine, 50 U/ml penicillin and 50 μg/ml streptomycin, 1% nonessential amino acids, and 0.1 mM β-mercaptoethanol without LIF.
Dose and time frame analysis of ES cells in monolayer culture
To assess changes in differentiation of ES cells exposed to statins in dose-, time-, and duration-dependent manner, ES cells were exposed to the statins at different time intervals during differentiation. The exposure of statins was started at day 0, and RNA was isolated on day 10. The experimental design for exposure time and duration to ES cells is shown in Table 2.
Schematic presentation of experimental steps.

+: dosing day; X: no dosing.
Immunocytochemistry
D3 (EBs) were obtained using hanging drop methodology, and they were transferred into gelatin-coated 24-well plate at day 5. After culture for next 5 days in 24-well plate, EBs were fixed in paraformaldehyde solution (4% in PBS for 30 min at room temperature and after a PBS wash, EBs were permeabilized with Triton X-100 (0.25% in PBS) added for 15 min and then washed with wash buffer (1% bovine serum albumin (BSA) in PBS, incubated for 60 min with 5% BSA in PBS at room temperature to block nonspecific binding and again washed with wash buffer. EBs were incubated with primary antibody of α/β- myosin heavy chain (MHC; Abcam, UK) diluted at 1:250, kept overnight at 4°C. After washing with wash buffer, cells were incubated with secondary antibody antibodies, namely, fluorescein-5-isothiocyanate (FITC)-conjugated rabbit anti-mouse (Sigma) diluted in the ratio 1:500 and again washed with wash buffer. Then, cells were treated with 2 µg/ml of Hoechst staining for next 25 min and washed three times with wash buffer. The EBs were viewed under the Nikon eclipse Ti microscope (Tokyo, Japan) at 100× magnification using the appropriate filters excitation at 530 nm for FITC staining.
RNA isolation, cDNA synthesis, and real-time Q-PCR for differentiation gene marker analysis
Gene expression was determined by real-time quantitative polymerase chain reaction (Q-PCR). The RNA was isolated with RNeasy Mini Kit (Qiagen, The Netherlands), including DNA digestion. RNA concentration and quality were measured with a Nano drop 2000 spectrophotometer (Thermo Scientific). RNA was reverse transcribed into complementary DNA (cDNA) using an oligo deoxy thymine (15) primer by Moloney Murine Leukemia Virus Reverse Transcriptase (Genetix, New Delhi, India). PCR was performed using 0.5 µg of cDNA for each sample using gene-specific primers to determine the expression for target gene. Real-time PCR was performed on CFX-96 real-time PCR (Bio-Rad Laboratories, Berkeley, California, USA) using SYBR Green real-time PCR dye (Bio-Rad Laboratories). The conditions were 95°C for 3 min for the first cycle, followed by 39 cycles of 95 C for 20 s and 72 C for 1 min. The relative quantitative expressions of lineage specific markers calculated after normalization against glyceraldehyde-3-phosphate dehydrogenase, a housekeeping gene. This study includes seven gene markers for the three lineages were selected. These included, brachyury, Flk-1, Nkx2.5, and α/β MHC associated with formation of mesodermal lineage, α-Fetoprotein (Afp) related with the development of endoderm and for studying the expression on ectodermal lineage, nestin (Nes) and Neurofilament 200 kDa were analyzed. Primers with annealing temperature details are provided in the supplementary data.
Statistical analyses
The cytotoxicity data were obtained by calculating the mean ± SEM from three individual experiments done in triplicates. The IC50 values were calculated using dose–response curves. The effects of simvastatin and atorvastatin on the expression levels of the lineage-specific markers were analyzed using the 2-ΔΔCt method. The statistical analysis was done using two-way analysis of variance, followed by a Bonferroni test using GraphPad prism software (San Diego, California, USA).
Results
Determination of the cytotoxicity of statins concentration through validated EST model
For cell viability analysis, MTT assay according to EST (Embryonic stem cell test) model was performed to study the cytotoxicity effect on ES cells and NIH-3T3, which represent embryonic tissues and adult fibroblasts, respectively. In both cell types, statins exhibited cytotoxicity in a dose-dependent manner. The sensitivity of statins toward D3 was more than NIH 3T3 cells as evidenced by the greater cell death observed. The cytotoxicity was calculated using dose–response curves. In case of simvastatin, IC50 D3 was 0.014 µM and IC50 3T3 was 0.083 µM. The IC50 D3 was 0.020 µM and IC50 3T3 was 0.079 µM upon treatment with atorvastatin (Table 3).
IC50 obtained for D3 and 3T3 cell lines after treatment with statins.
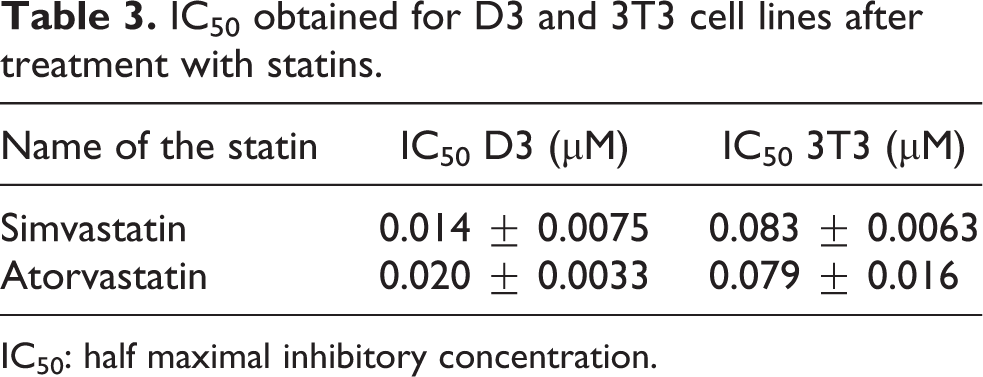
IC50: half maximal inhibitory concentration.
Statins globally altered expression of ES cell differentiation genes in monolayer as well as EB culture
To track the effect of statins on ES cells, two protocols, that is, monolayer differentiation and EB differentiation were performed. The schematic representation for the experiment is given in Table 1. Genes involved in differentiation of mesodermal, endodermal, and ectodermal mimicking embryonic tissue development were analyzed by real-time PCR. Statins-treated cells were then evaluated against the ES cells treated with vehicle control (there were no significant differences between untreated controls and respective vehicle controls). The cells were exposed to simvastatin and atorvastatin at various time periods. The rationale was to mimic exposure of the fetus to these drugs at various stages of embryonic development and study the same by using mouse ES cells undergoing differentiation. The exposure was started at the onset of experiment, taken as day 0, with media changes along with test concentration on days 3 and 5, and differentiation was continued until day 10. The RNA was isolated on day 10 to evaluate statins effect on differentiation. We observed that the continuous exposure of statins from day 0 onward has a direct bearing on differentiation, and this effect was directly proportional to dose. On comparing the results of monolayer versus EB differentiation, we found a similar pattern with respect to their effect on gene expression during critical stages of embryonic development. Keeping this in mind, the monolayer method was selected for further analysis of time, dose, and duration of exposure to statins, owing to the ease as well as the reproducibility over the hanging drop method.
Effect of statins on the mesodermal marker genes during EB differentiation
The expression levels of brachyury, Flk-1, Nkx2.5, and α/β MHC were altered in EBs treated with statins. The expression of brachyury, an early mesodermal marker, was unexpectedly increased in dose-dependent manner when exposed to simvastatin. At a concentration of 0.003 µM, the fold change in comparison with the controls was 102 (p < 0.01), and at the highest concentration, that is, 0.024 µM, there was a highly significant (p < 0.0001) alteration in the fold change expression (381-fold change). A similar pattern was observed in atorvastatin-exposed EBs, that is, brachyury was enhanced in a dose-dependent manner. Atorvastatin, as compared to simvastatin, led to greater fold changes at all doses tested, and this increased expression of brachyury was highly significant (p < 0.0001). A 145-fold at 0.003 µM was seen upon treatment with atorvastatin, which jumped to 478-fold at 0.024 µM (Figure 1(a) and (b)). The enhanced expression of Flk-1 was observed in EBs after application of simvastatin (Figure 1(c). We found that at a lower dose of simvastatin, that is, 0.003 µM, no significant change in gene expression was seen in the exposed EBs (Figure 1(c), but at a higher concentration (0.024 µM), the expression was elevated to 35-fold (p < 0.0001). As observed in Figure 1(d), the Flk-1 expression also increased upon treatment with atorvastatin, and this expression was directly proportional to the concentration. A 14-fold (p < 0.05) at 0.006 µM, 34-fold (p < 0.001) at 0.012 µM, and 73-fold (p < 0.0001) at 0.024 µM were observed as compared to the vehicle control.
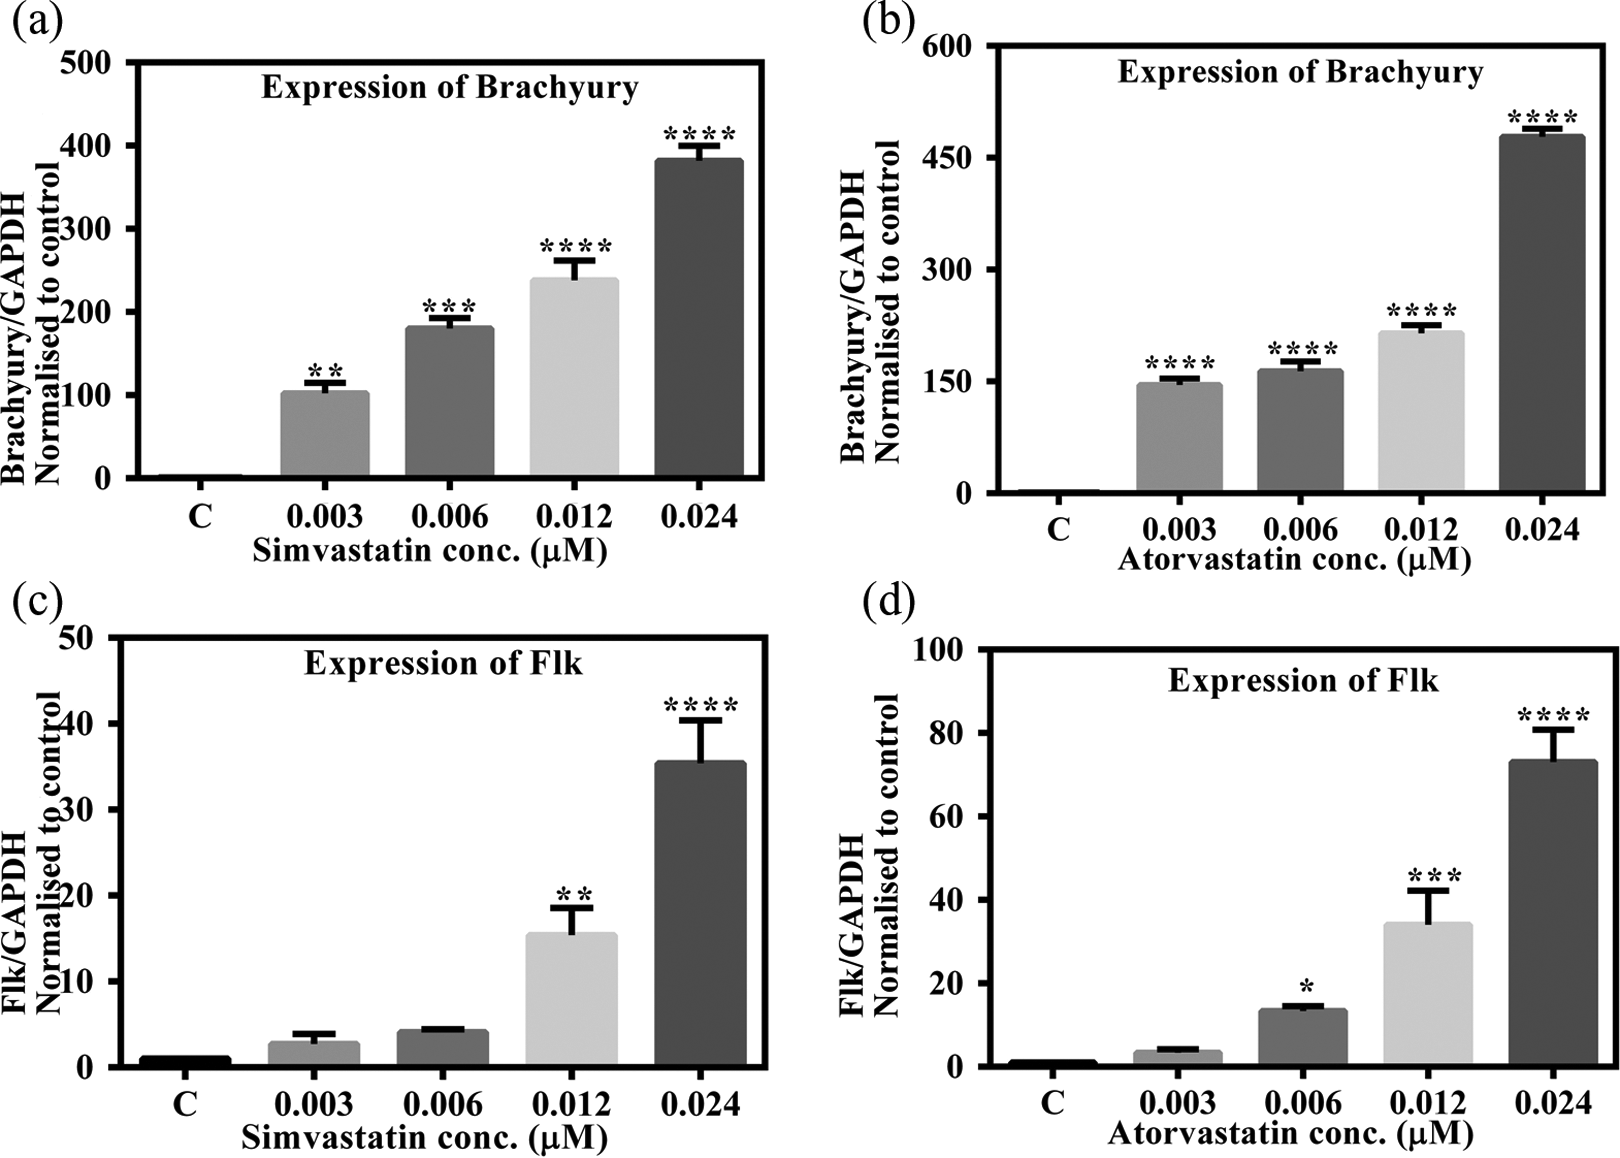
Early mesodermal marker genes brachyury and Flk-1 assessed by real-time quantitative RT-PCR in EBs treated with statins. Expression level was normalized against GAPDH. The y-axis represents fold change of expression of the studied gene compared with the vehicle control bar graphs show means ± SD (n = 3). Significant changes between exposed and vehicle control cells (*p < 0.05, **p < 0.01, ***p < 0.001, and ****p < 0.0001). RT-PCR: reverse transcription polymerase chain reaction; EB: embryoid body; GAPDH: glyceraldehyde-3-phosphate dehydrogenase.
The expression of Nkx2.5, which is an early cardiac marker, was also found to increase in dose-dependent manner when exposed to simvastatin (Figure 2(a). Similar changes induced by statins treatment to brachyury expression, atorvastatin as compared to simvastatin also enhanced the expression level of Nkx2.5 at similar doses. At 0.003 µM, the fold change by simvastatin was 5-fold as compared to 15-fold by atorvastatin (p < 0.05). Similarly the alteration by 0.024 µM simvastatin was 24-fold (p < 0.0001) in comparison with 53-fold (p < 0.0001) induced by atorvastatin (Figure 2(b). Interestingly, the expression levels of α/β MHC showed a downregulation in expression with increase in dose of both the statins (Figure 2(c) and (d)) at 0.003 µM of simvastatin, a 4-fold (p < 0.05) increase as compared to control was seen which inversely decreased upon treatment at higher concentrations. Atorvastatin was also seen to depress expression of α/β MHC in a dose-dependent manner. At 0.003 µM, the fold increase was 11 (p < 0.0001), which decreased to 0.5-fold at 0.024 µM (Figure 2(d).

Mesodermal cardiac markers gene Nkx2.5 and α/β MHC assessed by real-time quantitative RT-PCR in EBs treated with statins. Expression level was normalized against GAPDH. The y-axis represents fold change of expression of the studied gene compared with the vehicle control. Bar graphs show means ± SD (n = 3). Significant changes between exposed and vehicle control cells (*p < 0.05, **p < 0.01, ***p < 0.001, and ****p < 0.0001). MHC: myosin heavy chain; RT-PCR: reverse transcription polymerase chain reaction; EB: embryoid body; GAPDH: glyceraldehyde-3-phosphate dehydrogenase.
Effect of statins on the endodermal gene markers during EB differentiation
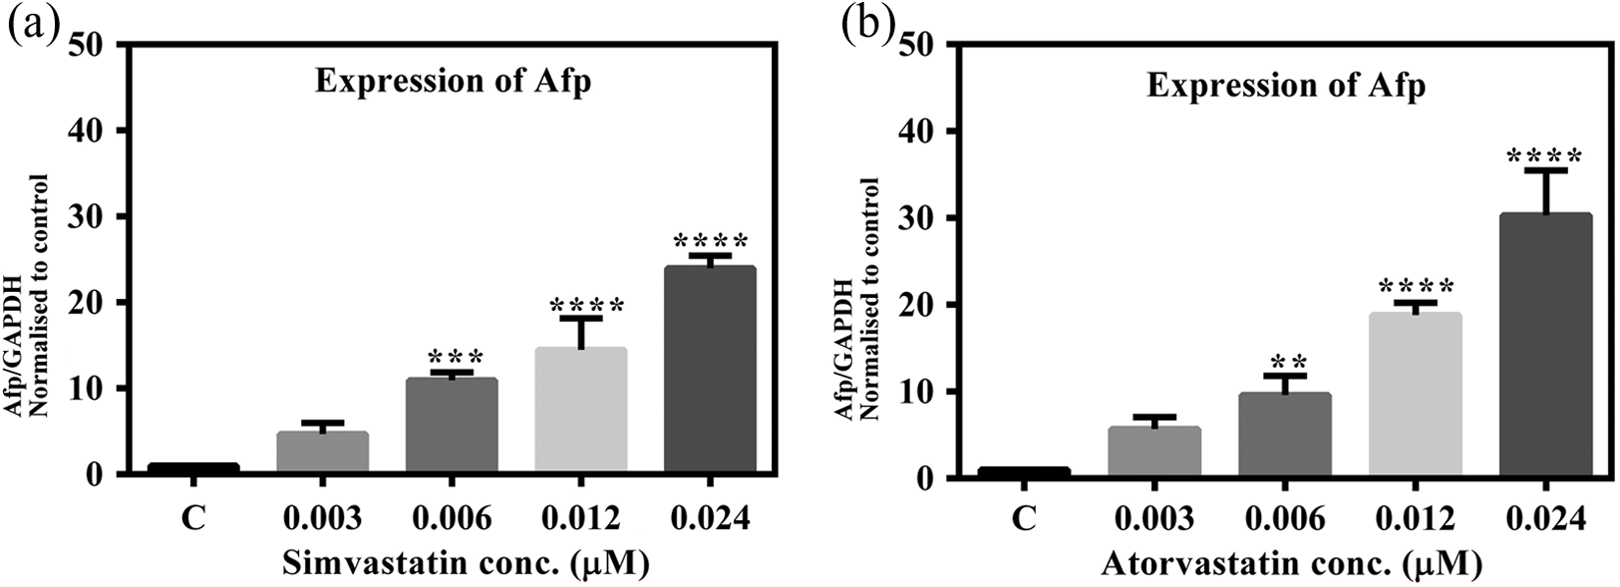
To study the effect of statins on endodermal lineage in EBs, we evaluated the effect of simvastatin and atorvastatin on the expression level of Afp gene. Expression of Afp is responsible for the differentiation of visceral endoderm. This gene, which is expressed in early embryogenesis, has also been seen to be expressed in EBs and therefore it makes for a good in vitro model system. Afp was significantly upregulated in EB differentiation during simvastatin treatment as seen in Figure 3(a). Simvastatin at 0.003 µM led to 11-fold (p < 0.05), 15-fold at 0.006 µM (p < 0.01), 46-fold at 0.012 µM (p < 0.0001), and 60-fold at 0.024 µM (p < 0.0001) increase. The expression pattern was according to the dose concentration indicating the potential of simvastatin in altering the gene expression during differentiation. A similar effect was observed upon atorvastatin treatment on the expression of Afp (Figure 3(b). There was again a dose-dependent enhancement in expression. We found with treatment at 0.003 µM of atorvastatin, a 12.7-fold (p < 0.05), 14.5-fold (p < 0.05) at 0.006 µM, 34.9-fold (p < 0.001) at 0.012µM, and 74.7-fold (p < 0.0001) at 0.024µM increase in the EBs.

Endodermal marker gene Afp assessed by real-time quantitative RT-PCR in EBs treated with statins. Expression level was normalized against GAPDH. The y-axis represents fold change of expression of the studied gene compared with the vehicle control. Bar graphs show means ± SD (n = 3). Significant changes between exposed and vehicle control cells (*p < 0.05, **p < 0.01, and ****p < 0.0001). Afp: α-fetoprotein; RT-PCR: reverse transcription polymerase chain reaction; GAPDH: glyceraldehydes-3-phosphate dehydrogenase; EB: embryoid body.
Effect of statins on the ectodermal gene markers during EB differentiation
To assess the changes in ectodermal lineage, Nes (primitive neural stem cell marker) and Neurofilament 200 kDa gene expression in EBs were analyzed. We found that the expression of both the genes was inversely proportional to the statins concentration to which the EBs were exposed. As observed in Figure 4, the expression of Nes was upregulated eightfold (p < 0.01) upon treatment with 0.003 µM simvastatin; however, treatment with a similar concentration of atorvastatin led to only 1.6-fold increase. Statins exposure at the highest concentration (0.024 µM) led to decreased expression of Nes (p < 0.05). A similar trend was observed in the expression of Neurofilament 200 kDa upon simvastatin and atorvastatin treatment (Figure 4(c) and (d)). The expression was seen to be decreasing in a dose-dependent manner.
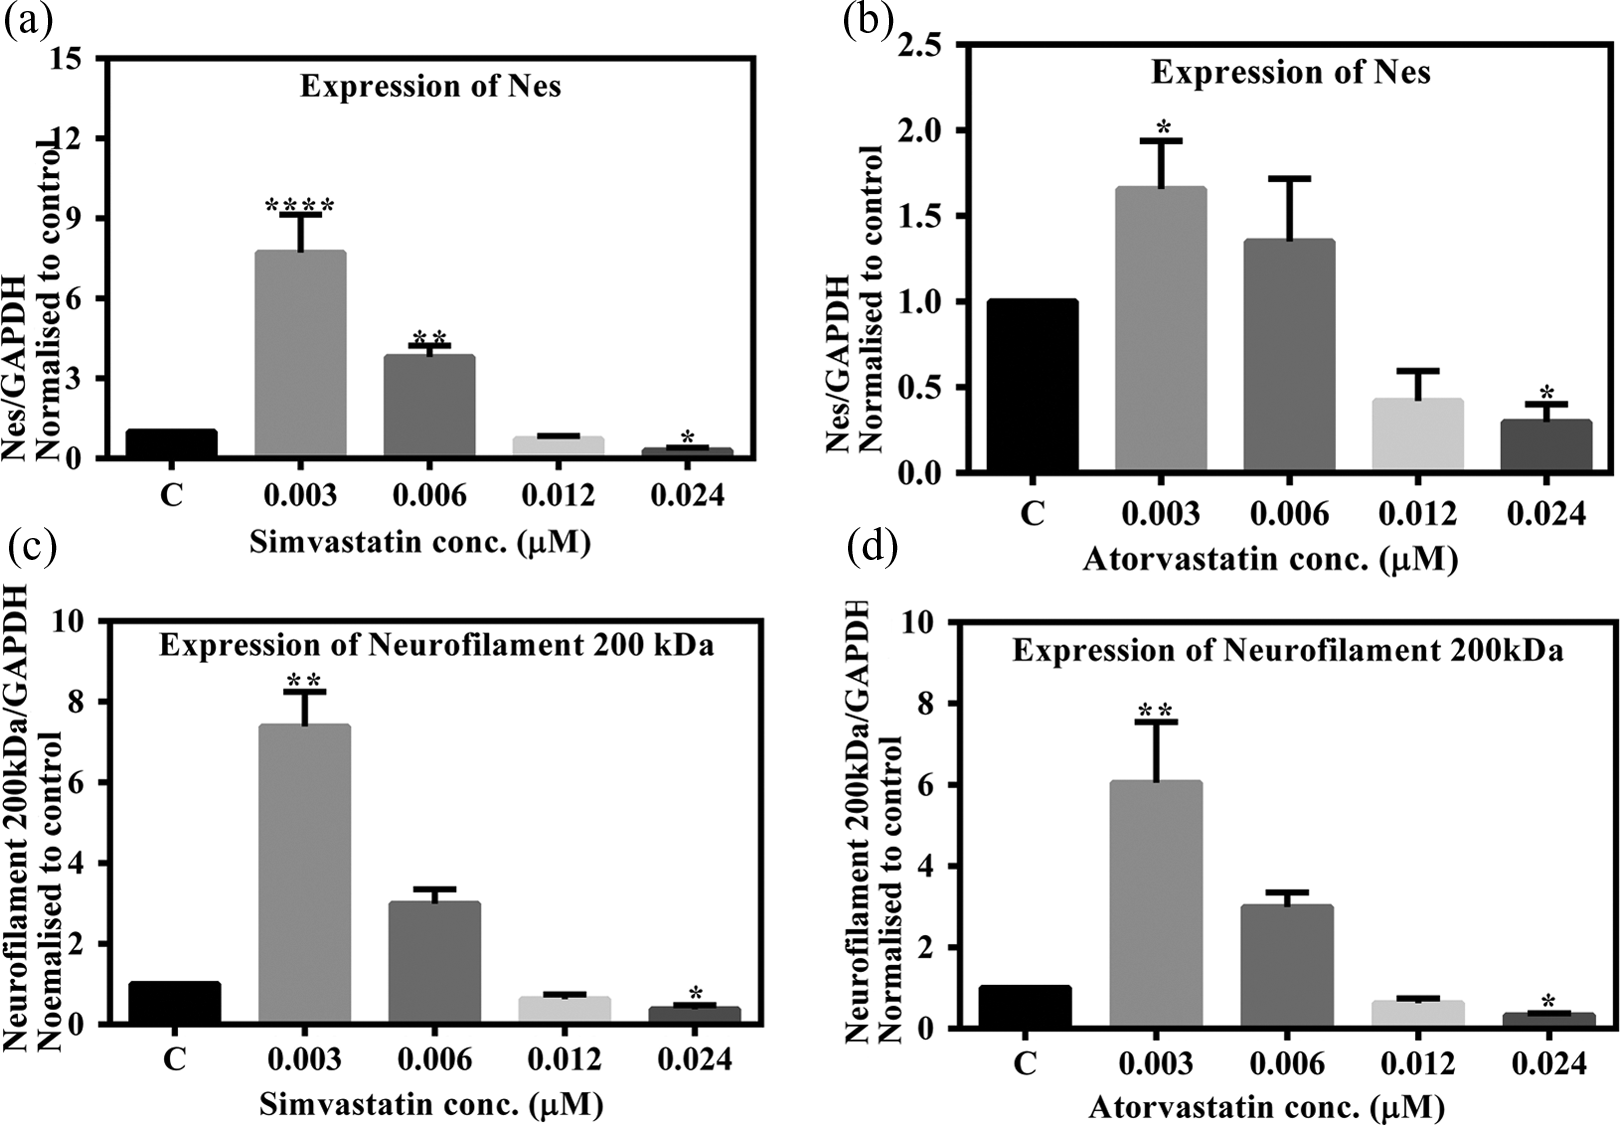
Ectodermal markers gene Nes and Neurofilament 200 kDa assessed by real-time quantitative RT-PCR in EBs treated with statins. Expression level was normalized against GAPDH. The y-axis represents fold change of expression of the studied gene compared with the vehicle control bar graphs show means ± SD (n = 3). Significant changes between exposed and vehicle control cells (*p < 0.05, **p < 0.01, and ****p < 0.0001). RT-PCR: reverse transcription polymerase chain reaction; EB: embryoid body; GAPDH: glyceraldehyde-3-phosphate dehydrogenase; Nes: nestin.
Monolayer differentiation: Mesodermal expression in the presence of statins
To study whether the model system used for differentiation had an impact on the lineage differentiation of ES cells when exposed to statins, we replicated the study in ES cells made to undergo differentiation using the monolayer method and exposed them to similar concentrations of simvastatin and atorvastatin.
The gene expression analysis of the statins-exposed monolayer cultures of ES cells, when compared with the vehicle control, revealed differentially expressed genes. The concentration-dependent responses in terms of fold change are given in Figure 5. The Q-PCR revealed that the expression of mesodermal marker brachyury, Flk-1, Nkx2.5, and α/β MHC were also disturbed during monolayer differentiation exposed to statins. Brachyury gene expression in the presence of simvastatin was enhanced in a dose-dependent manner (62-fold at 0.003 µM, p < 0.01; 87-fold 0.006 µM, p < 0.001; 208-fold 0.012 µM, p < 0.0001; and 343-fold 0.024 µM, p < 0.0001). The expression in monolayer differentiation revealed no drastic alterations in pattern of upregulation of brachyury expression (Figure 5(a) as compared to EB differentiation. Similarly, as seen in Figure 5(b), atorvastatin also showed molding in expression in monolayer cultures. The alteration in expression was significant at all the concentrations tested. Flk-1, which is the receptor for vascular endothelial growth factor (VEGF), upon treatment with atorvastatin resulted in a highly significant dose-dependent increase (0.003 µM, 5-fold; 0.006 µM, 14.4-fold, p < 0.01; 0.012 µM, 38-fold, p < 0.0001; and 0.024 µM, 62-fold, p < 0.0001), whereas simvastatin although showed a similar pattern but to a slightly lesser degree (Figure 5(c) and (d)).

Early mesodermal markers gene brachyury and Flk-1 assessed by real-time quantitative RT-PCR in monolayer culture treated with statins. Expression level was normalized against GAPDH. The y-axis represents fold change of expression of the studied gene compared with the vehicle control. Bar graphs show means ± SD (n = 3). Significant changes between exposed and vehicle control cells (*p < 0.05, **p < 0.01, ***p < 0.001, and ****p < 0.0001). RT-PCR: reverse transcription polymerase chain reaction; GAPDH: glyceraldehydes-3-phosphate dehydrogenase.
Nkx2.5 showed (Figure 6(a) upregulation in expression in monolayer cultures exposed to simvastatin (0.003 µM, 2-fold; 0.006 µM, 4-fold; 0.012 µM, 15-fold, p < 0.001; and 0.024 µM, 27-fold, p < 0.0001). Atorvastatin also regulated Nkx2.5 in a similar manner as observed in Figure 6(b). Again, this trend was similar to that observed during EB differentiation. The specific reduction in a dose-dependent manner, of α/β MHC expression (Figure 6(c) and (d)), was also observed in D3 monolayer cultures exposed to simvastatin and atorvastatin treatment. A maximum reduction of 1.5-fold at 0.024 µM and 2.4-fold (p < 0.01), respectively, was noticed, which again reflected the alterations which took place in EBs. This alteration in mesodermal marker expression in the monolayer differentiation model mimicked that of EB differentiation indicating similar interaction of statins in both differentiation protocols.

Mesodermal cardiac markers gene Nkx2.5 and α/β MHC assessed by real-time quantitative RT-PCR in monolayer culture treated with statins. Expression level was normalized against GAPDH. The y-axis represents fold change of expression of the studied gene compared with the vehicle control. Bar graphs show means ± SD (n = 3). Significant changes between exposed and vehicle control cells (*p < 0.05, **p < 0.01, ***p < 0.001, and ****p < 0.0001). MHC: myosin heavy chain; RT-PCR: reverse transcription polymerase chain reaction; GAPDH: glyceraldehyde 3-phosphate dehydrogenase.
Endodermal expression in monolayer cultures in the presence of statins
In ES cell monolayer cultures, the endodermal marker Afp was strongly expressed upon treatment with statins. The expression of Afp was upregulated in a dose-dependent manner with both simvastatin (Figure 7(a) and atorvastatin (Figure 7(b) with maximum upregulation of 30.5-fold (p < 0.0001) in the case of atorvastatin. Furthermore, on comparing endodermal expression in monolayer culture with EB culture, similar effects of statins were observed.
Endodermal marker gene Afp assessed by real-time quantitative RT-PCR in monolayer culture treated with statins. Expression level was normalized against GAPDH. The y-axis represents fold change of expression of the studied gene compared with the vehicle control. Bar graphs show means ± SD (n = 3). Significant changes between exposed and vehicle control cells (**p < 0.01, p < 0.001 and ****p < 0.0001). Afp: α-fetoprotein; RT-PCR: reverse transcription polymerase chain reaction; GAPDH: glyceraldehyde-3-phosphate dehydrogenase.
Ectodermal expression in monolayer cultures in the presence of statins
On observing Figure 8, expression of neuroectodermal genes Nes and Neurofilament 200 kDa displayed compromised differentiation upon treatment with increasing concentration in monolayer differentiation. The early ectodermal lineage marker, Nes, showed significant downregulation with increasing concentration of simvastatin, that is, 0.34-fold (p < 0.05) at 0.024 µM (Figure 8(a) compared to 1.62-fold at 0.003 µM. Neurofilament 200 kDa showed significant upregulation (i.e. 4-fold at 0.003 µM, p < 0.05, Figure 8(b), while the higher concentration resulted in downregulation, which was statistically nonsignificant. Atorvastatin showed similar although more potentiated affects at 0.003 µM in both Nes (p < 0.01) and Neurofilament 200 kDa (p < 0.0001), while no significant alteration at higher concentration was seen (Figure 8(c) and (d), respectively).

Ectodermal markers gene Nes and Neurofilament 200 kDa assessed by real-time quantitative RT-PCR in monolayer culture treated with statins. Expression level was normalized against GAPDH. The y-axis represents fold change of expression of the studied gene compared with the vehicle control. Bar graphs show means ± SD (n = 3). Significant changes between exposed and vehicle control cells (*p < 0.05, **p < 0.01, and ****p < 0.0001). RT-PCR: reverse transcription polymerase chain reaction; GAPDH: glyceraldehydes-3-phosphate dehydrogenase; Nes: nestin.
Duration and time frame analyses of statins on ES cells differentiation
In addition to the continuous dose-dependent effects, we also wanted to examine at what stage of development statins altered the gene expression. In order to carry out this objective, we analyzed the expression of lineage-specific markers in monolayer cells undergoing differentiation in specific exposure–duration windows. The experimental outline is given in Table 2, which explains the manner in which various concentrations of the statins were given at specific times, followed by RNA isolation at day 10 and have been categorized as “A” single exposure at day 0; “B” exposure at day 0 and day 3; “C” exposure at day 0 and day 5; “D” single exposure at day 3; “E” exposure at day 3 and day 5; and “F” single exposure at day 5. The rationale for this was to ascertain whether the statins were interfering at the initial stage when ES cells start to aggregate (day 0 exposure) or during the process of EB formation (day 3 exposure) or when the EBs were established and were in the process of differentiation (day 5 exposure).
Time frame analysis of statins on ES cell differentiation: Mesodermal lineage expression
The results shown in Figure 9(a) of the effect of simvastatin on the early mesodermal genes brachyury suggest that the window of influence is crucial and exposure at the time when the EBs are established and are differentiating (day 5) are most sensitive resulting in highly deranged expression. However, exposure to atorvastatin from day 3 onward leads to significant alterations in expression, thereby suggesting that differentiating ES cells are more susceptible to this form of statins (Figure 9(b). Similarly the results for Flk-1 show that simvastatin lead to dose-dependent alterations in the expression (Figure 9(c); however, atorvastatin exposure at the various concentrations did not lead to noticeable alterations but were constant with respect to fold changes, except at day 5 exposure (F) where 0.012 µM and 0.024 µM concentrations caused sudden increases in fold expression.

Temporal expression pattern of the mesodermal marker genes brachyury and Flk-1. Expression level was normalized against GAPDH. The y-axis represents fold change of expression of the studied gene compared with the vehicle control. Data are expressed as mean ± SD (n = 3). Significant changes between exposed and vehicle control cells (*p < 0.05, **p < 0.01, ***p < 0.001, and ****p < 0.0001). GAPDH: glyceraldehydes-3-phosphate dehydrogenase.
The cardiac precursor Nkx2.5 also showed an increased expression in ES cell differentiation when exposed to simvastatin at day 0 and day 5, which can be seen in Figure 10, with the least effect seen at single exposure at day 3. On the other hand, ES cells treated with atorvastatin during time frame analysis had near constant effects, resulting in upregulation at all the exposure windows (Figure 10(b). Interesting was the expression level of α/β MHC (this gene express both isomers), which was increasing at lower concentration and remained unchanged with higher concentration of simvastatin (Figure 10(c). Another point observed in this time course analysis was that this expression of α/β MHC with simvastatin increased during initial exposure, that is, with onset of experiment for differentiation and this expression was not significant during exposure at day 5. Atorvastatin showed significant result (Figure 10(d) in increasing the α/β MHC expression at lower dose only in the initial phase of differentiation. Moreover, the α/β MHC expression was less downregulated during this time course analysis as compared to continuous exposure in EB and monolayer culture. The downregulation from statins on α/β MHC was further confirmed by immunocytochemistry analysis of α/β MHC shown in Figure 11.

Temporal expression pattern of the cardiac marker genes Nkx2.5 and α/β MHC. Expression level was normalized against GAPDH. The y-axis represents fold change of expression of the studied gene compared with the vehicle control. Data are expressed as mean ± SD (n = 3). Significant changes between exposed and vehicle control cells (**p < 0.01 and ****p < 0.0001). MHC: myosin heavy chain; GAPDH: glyceraldehyde 3-phosphate dehydrogenase.

Representative images of differentiation of EBs exposed to statins stained with cardiac lineage markers α/β MHC. Magnification ×10. Scale bar represents 100 μm (a) Hoechst staining of EB culture without any treatment of statins; (b) α/β MHC-stained EB treated without treatment of statins; (c) phase-contrast image of α/β MHC-stained EB without treatment of statins; (d) Hoechst staining of EB culture treated with simvastatin at 0.015 μM concentration; (e) α/β MHC-stained EB treated with treatment simvastatin at 0.015 μM concentration; (f) phase-contrast image of α/β MHC-stained EB treatment with simvastatin at 0.015 μM concentration; (g) Hoechst staining of EB culture treated with atorvastatin at 0.020 μM concentration; (h) α/β MHC-stained EB treated with atorvastatin at 0.020 μM concentration; and (i) phase-contrast image of α/β MHC-stained EB treated with atorvastatin at 0.020 μM concentration. EB: embryoid body; MHC: myosin heavy chain.
Time frame analysis of statins on ES cell differentiation: Endodermal lineage expression
The expression of Afp (Figure 12(a) exhibited the same pattern with varying condition, that is, it was increasing in dose-dependent fashion with simvastatin, whereas the Afp expression reached maximum increase in fold change with atorvastatin when the exposure was given at days 3 and 5–10 (Figure 12(b). This expression made us conclude that during differentiation, middle phase is more influenced by atorvastatin exposure. Our time frame analysis indicates that simvastatin and atorvastatin have different sensitivities on particular stage of differentiation for endodermal lineage.

Temporal expression pattern of the endodermal marker gene Afp. Expression level was normalized against GAPDH. The y-axis represents fold change of expression of the studied gene compared with the vehicle control. Data are expressed as mean ± SD (n = 3). Significant changes between exposed and vehicle control cells (****p < 0.0001). Afp: α-fetoprotein; GAPDH: glyceraldehyde-3-phosphate dehydrogenase.
Time frame analysis of statins on ES cell differentiation: Ectodermal lineage expression
Ectodermal expression markers were regulated differently after exposure to statins during the time course analysis. Where we found extremely low expression at higher concentration of statins in EB and monolayer culture (Figure 4 and Figure 8, respectively), the expression in time course revealed enhanced expression of ectodermal maker, that is, Nes (marker of neural progenitor cells) and Neurofilament 200k Da (mature neural cell marker; Figure 13) at lower concentrations. We found that during the time course analysis, expression level of Nes with simvastatin (Figure 13(a) showed significant increase in fold expression at lower concentration when dose was given at days 3 and 5. Like simvastatin, atorvastatin produced similar effect on Nes, that is, the expression reached maximum change when exposure was given at days 3 and 5, and in this case, the expression was significant even at higher concentration of atorvastatin. The expression of Neurofilament 200k Da showed significant increase in expression when simvastatin was given on days 3 and 5 (Figure 13(c). This indicates that simvastatin has interacted more strongly with EBs formation and during their differentiation. While the expression of Neurofilament 200 kDa (Figure 13(d) with atorvastatin was significantly increasing with dose given at the onset of experiment, the expression level reached peak point at days 3 and 5 of exposure. The results from our study cover the early EBs development and their differentiation was effected by statins, which behaved differently in altering the expression of ectodermal markers.

Temporal expression pattern of the ectodermal marker gene Nes and Neurofilament 200 kDa. Expression level was normalized against GAPDH. The y-axis represents fold change of expression of the studied gene compared with the vehicle control. Data are expressed as mean ± SD (n = 3). Significant changes between exposed and vehicle control cells (*p < 0.05, **p < 0.01, ***p < 0.001, and ****p < 0.0001). Nes: nestin; GAPDH: glyceraldehyde-3-phosphate dehydrogenase.
Discussion
ES cells are undifferentiated cells that are capable of both self-renewal and differentiation. ES cells play a critical and fundamental role in the formation of different tissues and organs of fetus during embryonic development. However, it has been reported that the exposure of fetus to statins during the critical periods of embryogenesis can result in congenital abnormalities. 34 – 35 The studies contributed for exploring the relationship between statins and fetal exposures have not been elucidated completely because lack of information and the available data are contradictory. Therefore, statins use remains contraindicated in pregnancy. Information garnered from various studies has shown that other than the inhibition of HMG-CoA reductase, statins have wide-ranging actions. The major pleiotropic effects in broad way are improving endothelial function, increased expression of VEGF, and increased mobilization of stem cells (endothelial progenitor cells regulated via molecular mechanism). 36 Statins also have also been shown to affect various pathways, which play a critical role in embryogenesis such as Wnt canonical pathway, nitric oxide (NO) signaling, and PI3/AKT and notch pathway. 37 – 40 The major focus of the present work was to assess genetic association between statins and congenital defects, revealing interaction of genes in signaling pathways in cellular processes that are essential for embryonic development.
Our study used two differentiation protocols, namely, monolayer and EB differentiation. The results uncovered a set of genes involved in critical stages of embryonic development whose expression was deregulated by statins and thus expands the findings of developmental toxicity of statins. Further we tried to evaluate the dose with the time of exposure to substantiate the available information about the developmental toxic effects of statins on ES cells using monolayer differentiation protocol. Statins caused alteration in the expression of genes of mesodermal, ectodermal, and endodermal lineage differentiation. The ability of statins to alter gene expression may throw some light on developmental toxic behavior of statins during embryonic development thereby resulting in congenital deformities.
The most important finding was the altered expression level of mesodermal lineage markers. Mesodermal lineage is responsible for cardiogenesis, which is a complex biological process requiring the combination of stem cell commitment and multifarious communication from developing embryo. Various studies have revealed the involvement of key genes in controlling cardiac development. Congenital heart diseases are the major cause of neonatal morbidity and mortality in humans. 41 The genetic basis for many of the heart defects remains elusive; however, alterations in gene expression encoding core cardiac transcription factors has been shown to be a great contributor for congenital heart diseases. In this study, genes controlling cardiogenesis are seen to be regulated upon statins exposure, which might be linked to morphological and functional forms of congenital heart defects. We focused mainly on four key mesodermal genes, namely, brachyury, Flk-1, Nkx2.5, and α/β MHC. Statins stimulated a highly significant change in the expression pattern of brachyury, which is expressed during the primitive streak as well as in the developing mesoderm 42 and is necessary for normal mesoderm formation during gastrulation. In our study, brachyury expression was sharply elevated at lower concentration of statins during the 10 days of differentiation. It has been studied that mouse ES cells without brachyury expression were unable to undergo orchestrated gastrulation movements, due to the nonexpression of the key cell adhesion molecules. 43 However, till date, the significant upregulation in expression of brachyury with statins exposure has not been elucidated and linked to the developmental toxicity of drugs. Simvastatin has been seen to have effects on oesteoblastic viability and on differentiation of osteoprecursor cells. 44 It has also been reported that in the ES cells, the patterning of the mesoderm and the endoderm are due to signaling centers formed in aggregated EBs and dense monolayer cultures. 45 Studies by Ding et al. have shown that NO maybe involved in early differentiation through the regulation of β-catenin and brachyury by controlling the specification of the primitive streak. 46 Our results of derangement in the key genes modulating mesodermal differentiation could therefore explain the limb abnormalities seen in infants exposed to statins in utero.
Flk-1 (vascular endothelial growth factor receptor-2) is associated with distinct mesoderm-restricted progenitors according to a biphasic expression profile during embryogenesis in which early expression marks hematopoietic lineages and delayed expression identifies cardiovascular progenitor cell potential. 47 It has also been reported that this growth factor plays a critical role in cardiac funtions by inducing the pre-endocardial mesenchyme to become endocardial epithelium morphogenesis, although the mechanisms are not fully understood 48 (endocardial vasculogenesis). However, even a modest increase in VEGF levels during embryonic development result in abnormal signaling, which has been shown to lead to severe anomalies. 49 Flk-1 has been also implicated in endothelial cell migration leading to angiogenesis by forming a complex with vascular endothelial (VE)-cadherin. 50 It has also been reported that overexpression of VEGF receptors in mouse embryos resulted in an excess production of blood vessels and malformed hearts. 51 This upregulated Flk-1 expression upon statins treatment in our study could thus throw light on the genetic basis of congenital heart defects.
We also observed the significant upregulated expression of Nkx2.5, which is an important transcription factor that regulates various aspects of cardiac development starting with specification and proliferation of cardiac progenitor cells. 52 Nkx2.5 expression in cardiac tissues continues throughout development and into adult life, 53 but the functions regulated by its continued expression is unknown. In our study, effects of statins were detectable on this particular gene resulting in its increased expression. The homeobox gene Nkx2.5 54 is the earliest known marker of vertebrate heart development. Lyons et al. found that targeted interference of murine Nkx2.5 ended in early embryonic lethality and cardiac arrest at the linear heart tube stage prior to looping. 55 Another important finding was that the statins lead to decreased α/β MHC expression at higher concentrations (i.e. 0.012 µM and 0.024 µM concentrations), which was correlated with poor differentiation observed in the EBs upon immunocytochemistry. Our results suggest that the overall disruption by simvastain and atorvastain of the regulatory framework of early transcription factors in early embryonic cardiac development plays a vital role in the manifestation of the cardiac defects. In addition to this, in vitro embryotoxicity analysis using ES cells have revealed Nkx2.5 and α/β MHC genes as sensitive markers for predicting the teratogenicity of compounds.
Afp is considered as a marker for the visceral endoderm in both the early embryo development and in vitro EB differentiation 56,57 and has also been shown to be a very sensitive molecular end point to detect embryotoxicants. 58 In accordance with its embryotoxic nature, we found elevated expression in ES cells after treatment with statins at all concentrations and at each time window of exposure. The probable physiologic functions of Afp in the directing developmental events such as erthyropoiesis, histogenesis/organogenesis, fetal growth and differentiation, and the fetal defects associated with the symptom of elevated levels of Afp are very well explained by Mizejewski. 59 The establishment of patterning of the endoderm during development is an interplay of various signals that arise from the surrounding mesoderm-derived tissue, and it has been seen that this specification is reciprocal. Our results therefore suggest that changes in the in utero environment quickly translate to a rapid increase in Afp, which would then impact differentiation leading the defects associated with raised levels of Afp such as fetal neural tube defects—anencephaly and spina bifida. 60
Nes is expressed in cells during ectodermal development and in neural progenitor cells. 61 As neurogenesis proceeds, Nes is replaced by specific intermediate filaments (neurofilaments in neurons and glial fibrillary acidic protein in astrocytes). In our results statins affected the expression of Nes and Neurofilament 200 kDa in a dual manner, wherein the expressions were upregulated at lower concentration (i.e. 0.003 µM and 0.006 µM) but downregulated with increasing dose (i.e. 0.012 µM and 0.024 µM). The Nes expression has been shown to be enhanced by neurotoxic compounds methylmercury chloride and valproic acid, in studies reported by Hogberg et al. 62 The more specific neural marker Neurofilament 200 kDa showed downregulation expression in a dose-dependent manner. More specifically, atorvastatin had more impact on ecotodermal lineage. This upregulation of ectodermal genes driven by statins at lower doses, observed in our study, could contribute to the congenital anomalies related with exposure to statins seen in the central nervous system of the developing embryo.
Hence, we hypothesize that during differentiation, upregulation of lineage-specific genes due to statins, might stem from their pleiotropic effects. Upregulation of genes with statin exposure can be correlated to various signaling pathways such as Wnt canonical pathway, NO signaling, PI3/AKT, and notch pathway. In our study, brachyury, which is a target gene of Wnt pathway, was upregulated in our study and is expressed during primitive streak formation. It has been shown that NO-β-catenin involved in modulating primitive streak formation in ES cell via enhancing the expression of brachyury and β-catenin, which may contribute to osteogenic differentiation. 46 The role of NO in cardiogenesis during embryonic development is well known. 63,64 In a study by Mujoo et al., they found an increased expression of Nkx2.5 murine ES cells upon treatment with NO. 65 Similarly, the potent angiogenic growth factor Flk-1was also upregulated in mice models upon statins treatment. 66 Their study explained that binding of VEGF to Flk-1 directed the receptor phosphorylation upon atorvastatin exposure 67 and subsequent activation of PI3K/Akt and other downstream signaling proteins. 68 However, as reported earlier, 69 downregulation of the PI3K pathway is required for the formation of the definitive endoderm, therefore continued signaling by this pathway would result in aberrant patterning of the endoderm. It was studied that simvastatin through notch signaling pathway promotes endothelial differentiation from bone marrow stromal cells, also simvastatin enhances notch signaling activity and induces arteriogenesis. 70 If statins interacts with these signaling components during embryogenesis, the effect could result in abnormal expression in fetus. These effects are associated with dose and kind of statins taken during pregnancy.
In the past few years, ES cells have been the backbone of basic as well as advanced biomedical research, for example, drug discovery and cell-based therapy. Invaluable and limitless insights into normal and abnormal cellular changes accruing during embryogenesis have been gleaned by studying the expression of these cell lines in vitro. Our findings demonstrate that each stage of development is critical and sensitive to statins in its own way. Changing the time, concentration, and duration of statins exposure results in a varying pattern of lineage gene expressions, which could impact the developing embryo in utero.
Furthermore, since signals from one lineage impact the differentiation of the other our results suggest that statins treatment plays a pivotal role in the signaling cross talk between the endo-, ecto- and mesodermal lineages during differentiation, which regulate stem cell fate and throw light on the potential genetic basis for congenital anomalies.
An advanced knowledge of the effects of statins on ES cells will probably give insights into multiple congenital malformations occurring during pregnancy.