
Abstract
HeLa cells were exposed to formaldehyde and its metabolic derivatives, methanol, formic acid, and acetaldehyde, to investigate that the toxicity of formaldehyde is not caused by the chemical group. After 1 h of treatment with formaldehyde, mitochondrial assays showed that low concentrations (e.g. 10 μmol/L) of formaldehyde promoted growth of the HeLa cells, while higher concentrations (e.g. ≥62.5 μmol/L) inhibited cell growth; while all four chemicals at a concentration of 125 μmol/L affected cell growth, formaldehyde affected the largest. Reactive oxygen species concentration increased with the concentration of the exposure chemical. The endogenous formaldehyde content increased the most in the formaldehyde group, but in other three groups, it did not increase as the exposure concentration increased. Expression of dehydrogenase (formaldehyde dehydrogenase (FDH)) in the formaldehyde (10.40) and methanol (10.60) groups increased significantly compared with the control (1), while it was similar to the control in formic acid (0.90) and acetaldehyde (1.10) groups. Our results suggest that formaldehyde could affect cell activity and even enter cells. Exposure to formaldehyde changes the endogenous formaldehyde concentration in cells within 24 h, and this induces expression of FDH for formaldehyde degradation to maintain the formaldehyde balance. The toxicity of formaldehyde is not caused by the carbon atoms in the aldehyde, hydroxyl, or carboxyl groups. Formaldehyde is hypothesized to be an important signaling molecule in the regulation of cell growth and maintenance of the endogenous formaldehyde level.
Keywords
Introduction
Formaldehyde is a common indoor air pollutant 1 and classified as a human carcinogen by the World Health Organization. 2 In vitro experiments could be used to explore the degradation mechanism of formaldehyde, and the cytotoxicity of formaldehyde needs to be examined. Some studies have shown that exposure to low concentrations of formaldehyde increases cell growth, while high concentrations inhibit cell growth. Formaldehyde at concentrations of up to 60 μmol/L (0.0002%) did not negatively affect the viability of cell lines A431, HEK293, and primary rat fibroblasts. However, it did increase the proliferation of A431 cell lines. 3 In vitro studies on tumor and endothelial cells 4 have revealed a concentration-dependent relationship between formaldehyde and cell activity. Formaldehyde caused necrosis at 10.0 mmol/L, enhanced apoptosis and reduced mitotic activity at 1.0 mmol/L, and increased cell proliferation and reduced apoptotic activity at 0.5 and 0.1 mmol/L.
Formaldehyde can be formed by the metabolism of
Interestingly, after exposure to formaldehyde, the endogenous formaldehyde content in human blood did not change, 10 which indicates there is strict regulation of formaldehyde level in mammalian blood. The mechanism by which high concentrations of formaldehyde decrease cell activity and whether it can enter cells should be investigated. In the present study, HeLa cells were exposed to formaldehyde and its metabolic derivatives, methanol, formic acid, and acetaldehyde. The cell activity, reactive oxygen species (ROS) formation, cell formaldehyde content, and expression of FDH were used to study the changes in the endogenous formaldehyde content after exposure.
Methods
Cells and culture conditions
HeLa cells were purchased from the China Type Culture Collection (Wuhan University, China) and cultured in 1640 medium supplemented with 10% fetal calf serum and 1% penicillin and streptomycin. The cells were incubated in a humidified atmosphere of 5% carbon dioxide (CO2) at 37°C.
Equipment and reagents
The following equipment was used: CO2 incubator (Thermo Fisher Scientific, Waltham, Massachusetts, USA), Super clean bench (Su Zhou, China); Chromo4™ detector (Bio-Rad, Hercules, California, USA), Eon microplate spectrophotometer (Bio-Tek, Winooski, Vermont, USA), and an FL 800× fluorescence microplate reader (Bio-Tek).
The following analytical grade reagents were used: RPMI-1640 (Gibco, Life Technologies, Grand Island, New York; USA); fetal calf serum (Gibco); 3-(4,5-dimethylthiazol-2-yl)-2,5-diphenyltetrazolium bromide (MTT), 4-amino-3-hydrazine-5-mercapto-1,2,4-triazole (AHMT), dichlorodihydrofluorescein diacetate (DCFH-DA), methanol, formic acid, acetaldehyde, and formaldehyde (Sigma-Aldrich, St Louis, Missouri, USA); phosphate-buffered saline (PBS, pH 7.2, Sigma-Aldrich, St Louis, Missouri, USA), and SYBR® Premix ExTaq™ (Takara Bio, Otsu, Japan).
Cell exposure
Methanol, formic acid, acetaldehyde, and formaldehyde solutions in PBS were used at concentrations of 62.5, 125, 500, and 1000 μmol/L. The cells were incubated with each of the solutions at 37°C for 1 h, and PBS solution was used as the control (0 µmol/L).
Cell viability
The MTT assay 11 is used to determine the cytotoxicity of potential medicinal agents or toxic materials and is based on measurements of the cell viability.
According to an established method, 12 the cells were seeded in a 96-well microtiter plate at an initial density of 104 cells per well. After incubation for 24 h, the cells were exposed to 5, 10, 20, 40, 62.5, 125, 250, 500, and 1000 μmol/L of formaldehyde for 1 h. Then, 20 μL of MTT (5 mg/mL) was added to each well, and the plates were incubated for 4 h. Following the removal of the medium, 150 µL of dimethyl sulfoxide was added to each well, and the plates were shaken gently to allow MTT formazan to dissolve. The optical density was measured at 595 nm using an eon microplate spectrophotometer. The cells were then exposed to 125 μmol/L of methanol, formic acid, acetaldehyde, or formaldehyde for 1 h, and the changes in the cell activity were compared.
Determination of ROS formation
DCFH-DA assay detects total intracellular ROS instead of hydrogen peroxide. 13,14 A stock solution of DCFH-DA 15 was diluted 100-fold in PBS to yield a 20-μmol/L working solution. After exposure to 0, 62.5, 125, 250, 500, or 100 μmol/L of methanol, formic acid, acetaldehyde, or formaldehyde for 1 h, cells in the 96-well plates were washed twice with PBS and then incubated with 150 μL of DCFH-DA working solution at 37°C for 30 min. The fluorescence was then monitored using the FL 800× fluorescence microplate reader. The excitation and emission wavelengths were 485 and 520 nm, respectively.
AHMT determination of the formaldehyde content in HeLa cells
Under alkaline conditions, a condensation reaction will take place between AHMT and formaldehyde, and the absorbance of the mixture at 550 nm will be proportional to the formaldehyde content. A formaldehyde standard curve was constructed according to an established method 16 (Figure 1). After 1 h of exposure, the cells were washed twice with PBS and cells were disrupted with water (H2O), centrifuged at 800g for 3 min, and the supernatant was pipetted into 1 mL centrifuge tube. After addition of 1 mL of sodium hydroxide and AHMT solution, the mixture was mixed well and kept for 20 min in the dark. Then, potassium periodate solution (1 mL) was added at 37°C for 5 min, and the absorbance at 550 nm was recorded.

Formaldehyde standard curve constructed using the 4-amino-3-hydrazine-5-mercapto-1,2,4-triazole method.
FDH analysis by quantitative real-time PCR
After 1 h of exposure to 125 μmol/L of methanol, formic acid, acetaldehyde, or formaldehyde, total RNA was extracted from the cells and reverse transcribed into complementary DNA (cDNA) using the two-step method. cDNA was diluted to 50 ng/uL before performing polymerase chain reaction (PCR). Real-time PCR was performed with a Chromo4 detector using SYBR® Premix Ex Taq. 7 The housekeeping gene β-actin was used as an endogenous control. Forward and reverse primers for human FDH and β-actin 1 were custom synthesized by Genescript (Piscataway, New Jersey, USA; Table 1). Quantitative real-time PCR was conducted by adding the reagents as detailed in Table 2 to the Chromo4 detector.
Primers used for quantitative real-time PCR.

FDH: formaldehyde dehydrogenase; PCR: polymerase chain reaction.
Reaction solutions for real-time PCR.

PCR: polymerase chain reaction; dH2O: distilled water.
Statistical analysis
The experiments were repeated at least three times. Analysis of variance was applied on statistical analysis. The data were presented as the mean ± SEM. Data from the different measurements were analyzed using Origin 6.5 software (OriginLab, Berkeley, California, USA). The value of p < 0.05 was considered as significant difference, and the value of p < 0.01 was considered as extremely significant difference.
Results
Cell viability
Low concentrations of formaldehyde promote cell proliferation (Figure 2(a)), with a significant difference for the 10 μmol/L exposure group compared with the control (p < 0.05). Formaldehyde did not exhibit toxicity until its concentration reached 62.5 μmol/L (for 62.5 μmol/L, p < 0.05 compared with control group and for 125, 250, 500, and 1000 μmol/L, p < 0.01 compared with control group). The lowest concentration that produced a significant change in the cell viability was 125 μmol/L and was chosen for subsequent studies. Table 3 shows the formaldehyde contents in the cells after exposure to formaldehyde. The formaldehyde, formic acid, methanol, and acetaldehyde exposure groups showed significant differences when compared with the control group (Figure 2(b)), and all groups showed a decreasing trend.
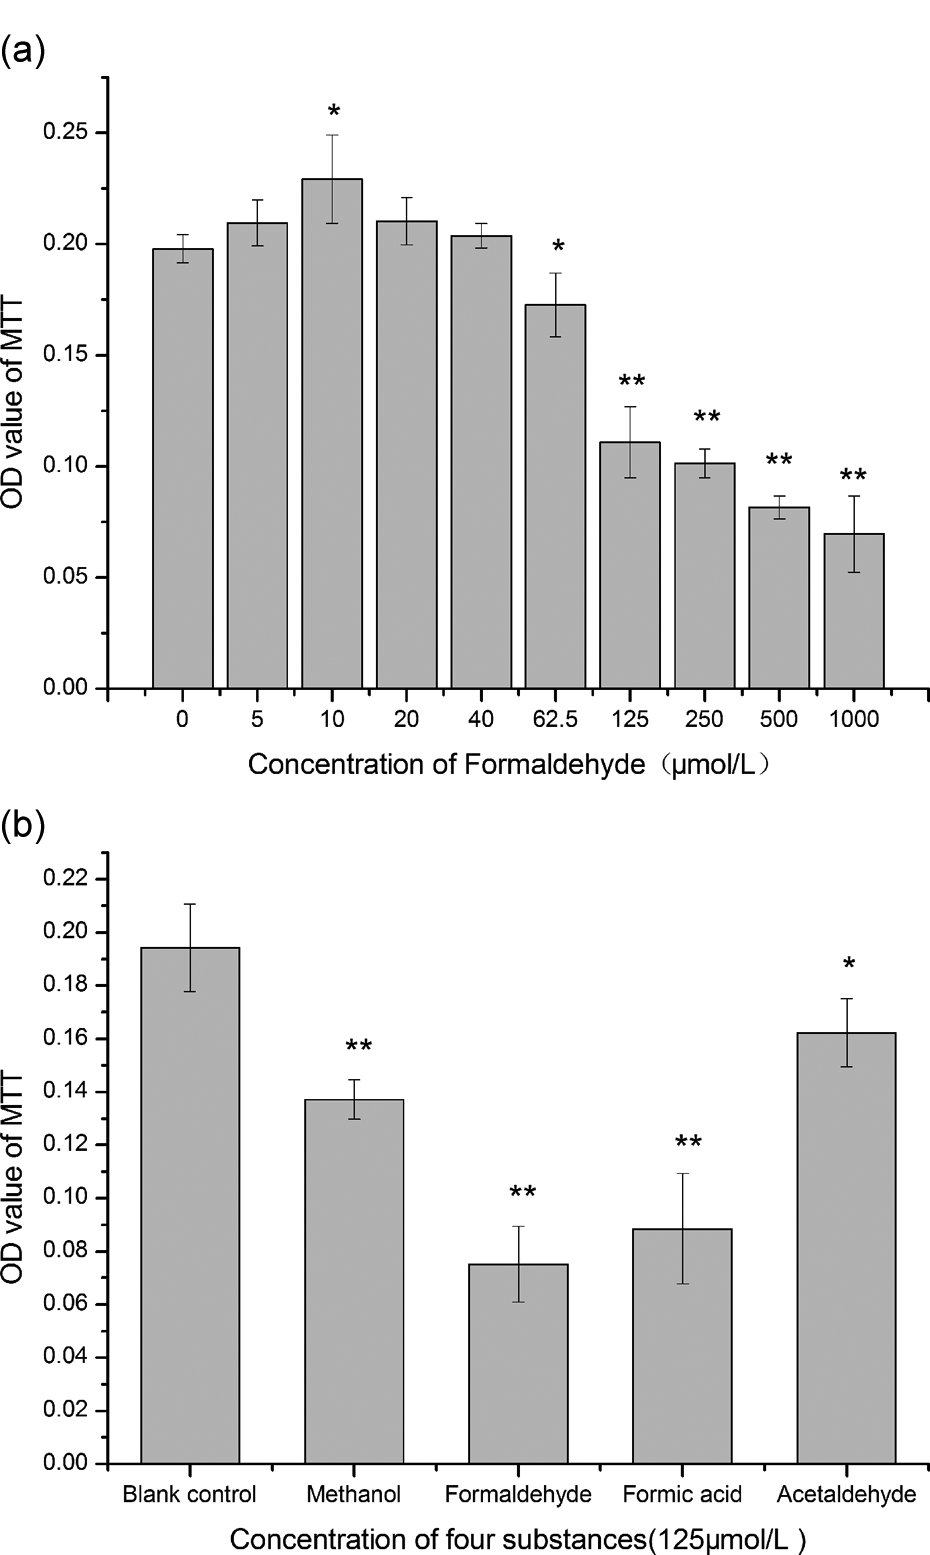
Cell viability method. (a) Different concentrations of formaldehyde. (b) 125 μmol/L of methanol, formic acid, acetaldehyde, and formaldehyde. *p < 0.05 and **p < 0.01 compared with the control group.
Formaldehyde content in cells after exposure to external formaldehyde.

Intracellular ROS level
The ROS assay 13 indicated that methanol, formic acid, acetaldehyde, and formaldehyde were significantly cytotoxic toward HeLa cells in a dose-dependent manner (Figure 3). The largest difference in the ROS content was observed with 125 µmol/L methanol, formic acid, acetaldehyde, and formaldehyde. However, if fresh medium was added for 24 h, the cells were repaired, whereas the exposure groups showed no significant differences compared with the control.

Fluorescence intensity after exposure to methanol, formic acid, acetaldehyde, or formaldehyde for 1 h (125 μmol/L of acetaldehyde, p < 0.05 compared with control group; 250, 500, and 1000 μmol/L of acetaldehyde, p < 0.01 compared with control group; 125, 250, 500, and 1000 μmol/L of methanol, formic acid, and formaldehyde, p < 0.01 compared with control group).
Formaldehyde content in the HeLa cells
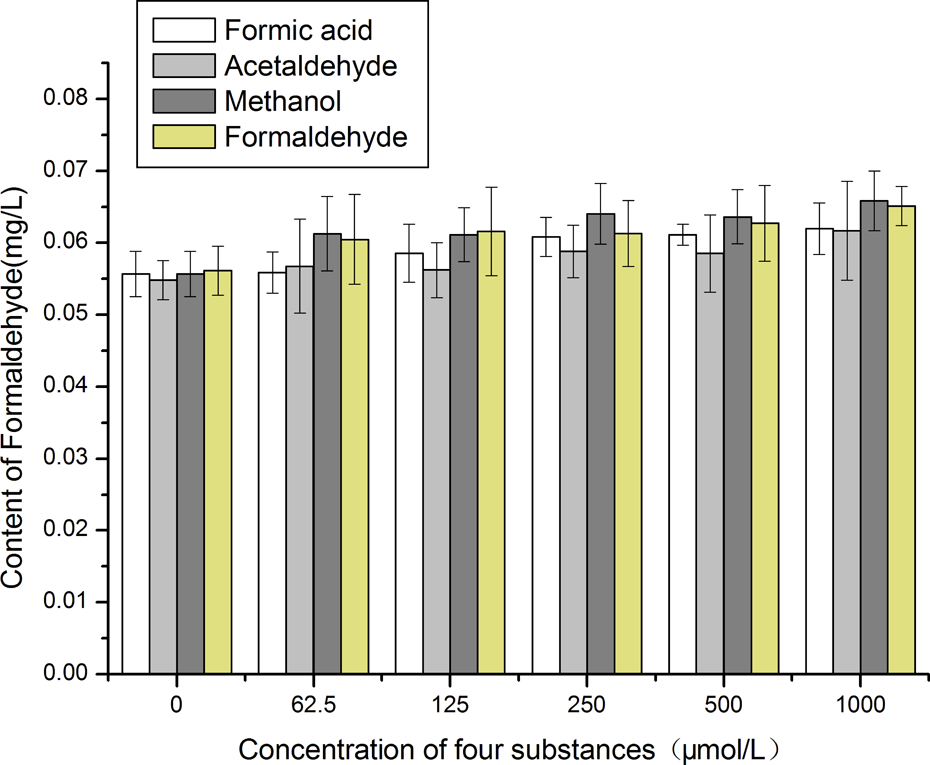
After 1 h of exposure, the endogenous formaldehyde content in all exposure groups had changed (Figure 4). The endogenous formaldehyde content increased when the cells were exposed to formaldehyde at concentrations of 125, 250, 500, and 1000 μmol/L (p < 0.01). However, in other groups, the endogenous formaldehyde content first increased and then decreased. Methanol (250, 500, and 1000 μmol/L), formic acid (62.5, 250, 500, and 1000 μmol/L), and acetaldehyde (125 and 250 μmol/L) caused significant changes (p < 0.01) in the endogenous formaldehyde content when compared with the control group.

Formaldehyde contents in HeLa cells determined by the 4-amino-3-hydrazine-5-mercapto-1,2,4-triazole assay (125, 250, 500, and 1000 μmol/L formaldehyde groups, p < 0.01 compared with control; 250, 500, and 1000 μmol/L methanol groups, p < 0.01 compared with control; 62.5, 250, 500, and 1000 μmol/L formic acid groups, p < 0.01 compared with the control; and 125 and 250 μmol/L acetaldehyde groups, p < 0.05 compared with the control).
Quantitative FDH analysis by real-time PCR
Compared with FDH expression in the control group, which was given a value of one, the FDH expression values in the formaldehyde, methanol, formic acid, and acetaldehyde groups were 10.40, 10.60, 0.9, and 1.10, respectively (Table 4).
Relative quantization using the comparative C t method.
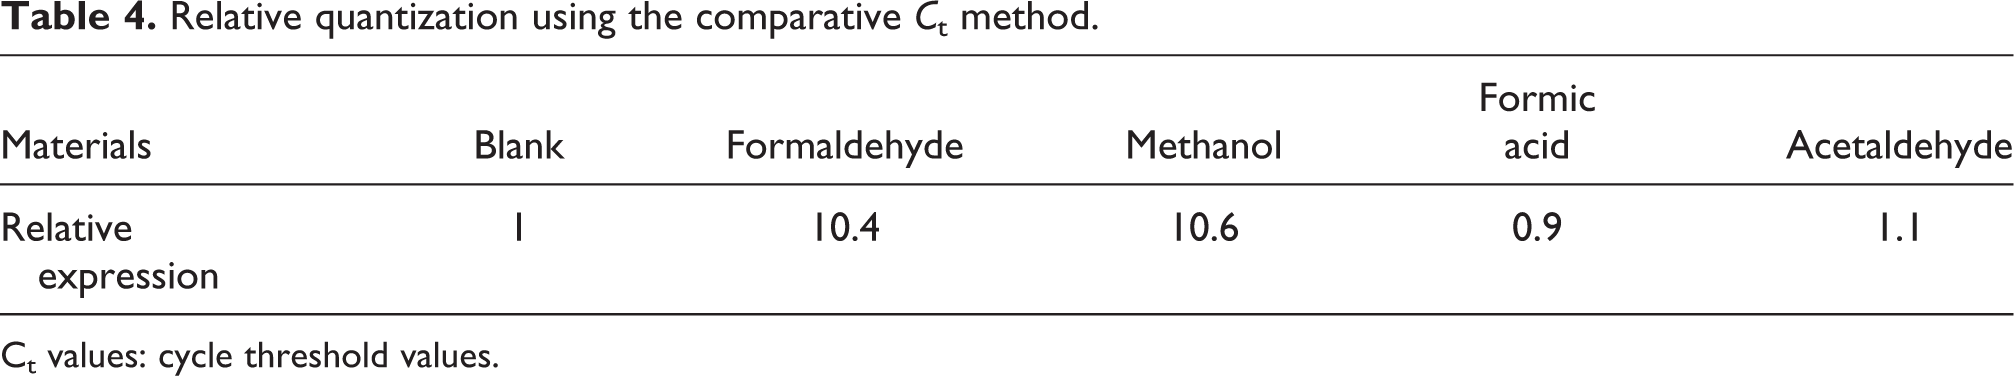
Ct values: cycle threshold values.
Discussion
Effect of exposure to formaldehyde on cell growth
The MTT assay indicated that low concentrations (e.g. 10 µmol/L) of formaldehyde promoted growth of the HeLa cells, while higher concentrations inhibited cell growth. These results indicate that the formaldehyde concentration in the ambient environment is important for cell growth. 17 Endogenous formaldehyde is both a metabolite and an indispensable for cell growth. To prove the specific effect of formaldehyde on cell growth, HeLa cells were treated with 125 μmol/L formaldehyde, methanol, formic acid, or acetaldehyde. Each of these chemicals had a different effect on the cell viability. Methanol is a potent neurotoxin that can cause severe metabolic acidosis and serious neurological disorders. 18 Small quantities of pure methanol cause blindness and death, and the minimum lethal dose is 50–100 mL. 19 Methanol and its metabolites, formaldehyde and formic acid, are associated with metabolic acidosis, visual dysfunction, and neurological symptoms. The mechanism of methanol poisoning is based on cell hypoxia and alteration of the cell structure and biological activity induced by free radicals and lactic acid. Methanol poisoning changes the balance between production of free radicals and antioxidant capacity and the protease–protease inhibitor system. 20 Acetaldehyde is an endocrine-disrupting chemical and a volatile organic compound. 21 Recently, the International Agency for Cancer Research (World Health Organization) stated that acetaldehyde from alcoholic beverages is carcinogenic to humans. 22 It also causes bronchoconstriction in a subset of asthmatics. 23 The low pH of formic acid suggests that it will be the most toxic agent among the chemicals tested, because it will alter the optimum cell pH (7.2). 24 However, the results showed that formaldehyde was more likely to inhibit cytoactivity than formic acid, methanol, or acetaldehyde. This suggests that the toxicity of formaldehyde arises from groups other than its CHO group. In addition, formaldehyde is thought to be an important signaling molecule in regulation of cell growth and maintenance of the endogenous formaldehyde level.
Cytotoxicity of formaldehyde at different concentrations
In the pioneering free radical aging theory, Harman 13 proposed that cell damage caused by the attack of free radicals on large molecules was the primary cause of senescence. This damage is also thought to sometimes induce tumor growth. 25,26 The results of the ROS assay in the present study showed a dose–effect relationship between each of the four chemicals tested and the oxidative damage. As a strong reducible agent, external formaldehyde could induce ROS generation in cells in a number of ways. Formaldehyde can be easily transformed into methanol and formic acid in cells, and the extent of oxidative damage caused by external methanol and formic acid will be similar to that of external formaldehyde. Formaldehyde and acetaldehyde induced oxidative damage to different extents because they have different metabolic pathways in the cells. Further study on cell repair ability after exposure indicated that the decrease in ROS in each group was similar to that in the control group over 24 h (Figure 5).
Formaldehyde contents in HeLa cells determined after 24 h of repairing by AHMT assay. AHMT: 4-amino-3-hydrazine-5-mercapto-1,2,4-triazole.
Cell formaldehyde content after exposure
After the cells were exposed to different concentrations of formaldehyde (125, 250, 500, and 1000 μmol/L) for 1 h, the endogenous formaldehyde contents of the cells increased significantly (p < 0.01). In the formic acid and methanol exposure groups, the formaldehyde content increased first and then decreased (Figure 6). Changes in the acetaldehyde group were not significant at 500 and 1000 μmol/L compared with the control. This suggests that acetaldehyde does not participate in the formaldehyde metabolism.

Correlation analysis between the formaldehyde content and the concentration of formaldehyde (a), methanol (b), and formic acid (c).
The formaldehyde content was higher in the methanol exposure group (R 2 = 0.9795) and formaldehyde exposure group (R 2 = 0.9474) than the formic acid group (R 2 = 0.6261) or acetaldehyde group (R 2 = 0.1572). This indicates that the formaldehyde contents in the cells increased as the concentrations of methanol and formaldehyde increased. Formaldehyde that penetrates through the cell membrane will increase the formaldehyde content in the cells. Methanol 27 in the cells will be transformed to formaldehyde, which will be further transformed to formic acid and eventually be degraded to CO2 and H2O. 28 Alcohol dehydrogenase is involved in the transformation of methanol to formaldehyde. Formic acid had little effect (R 2 = 0.6261) on the formaldehyde content in the cells. Because of the specificity of FDH, there was no correlation observed with the acetaldehyde group.
A curvilinear correlation was observed for the methanol exposure group (R 2 = 0.9678), and a linear correlation was observed for the formaldehyde exposure group (R 2 = 0.9675; Figure 7). We can conclude that excess formaldehyde in the cells has an adverse effect on cell growth, and cell damage increases with the formaldehyde concentration.
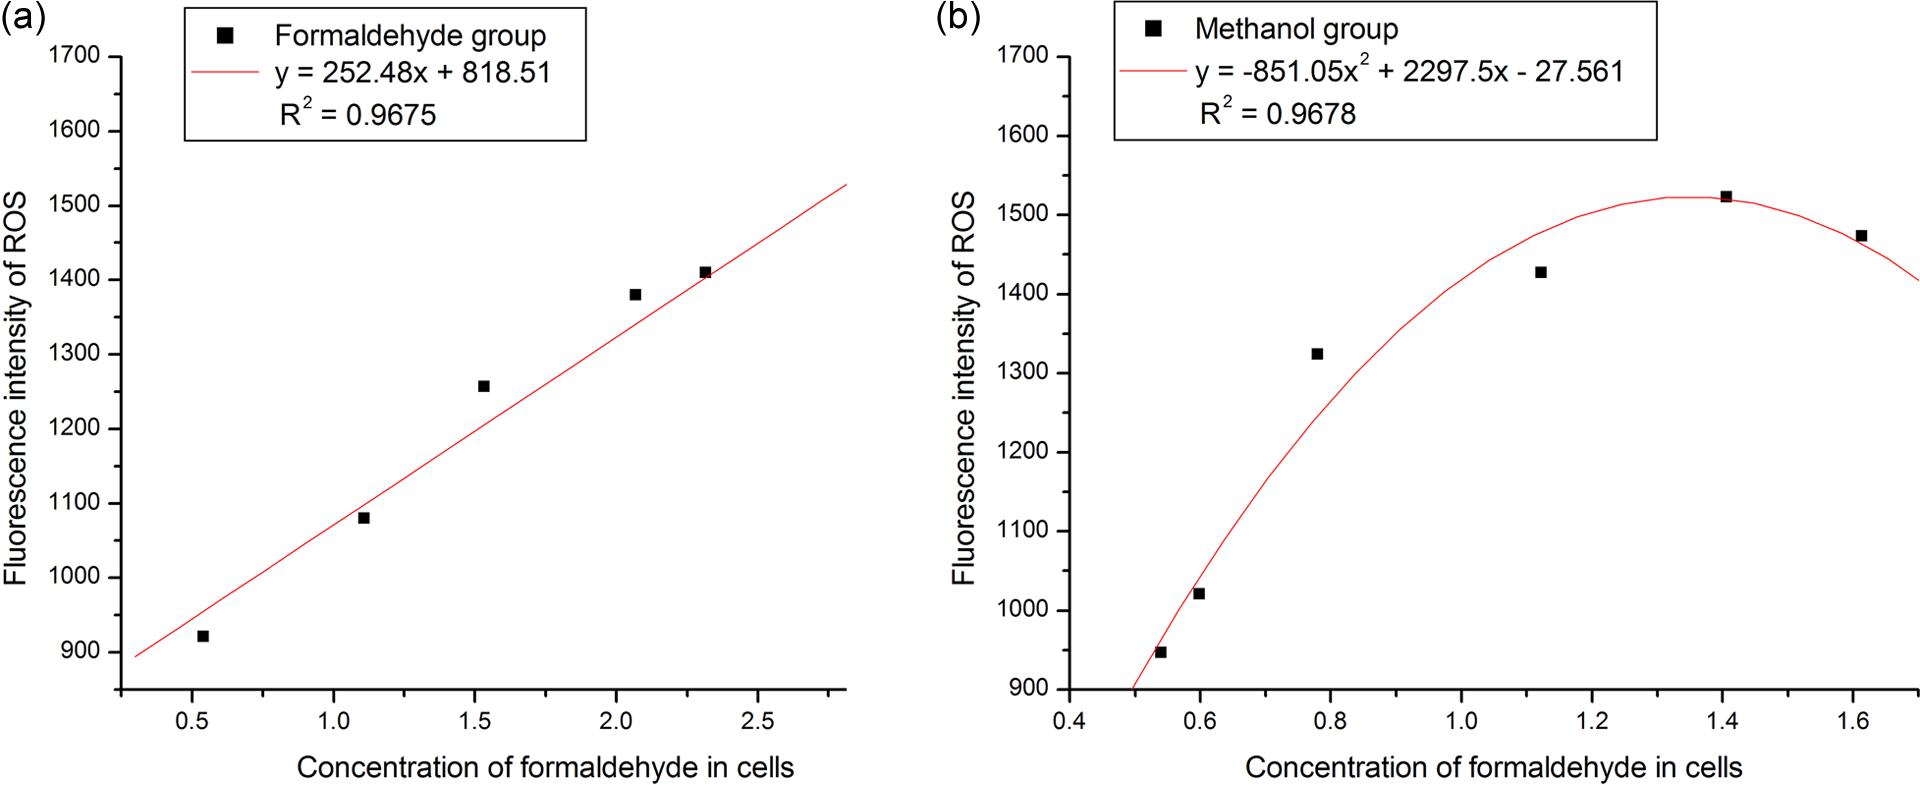
Correlation analysis between the cell formaldehyde content and ROS with formaldehyde (a) and methanol (b). ROS: reactive oxygen species.
FDH expression after exposure
Expression of FDH was higher in the methanol and formaldehyde exposure groups than in the control group, while in the acetaldehyde and formic acid exposure groups, it was similar to that in the control group (Table 3). When methanol enters the cells, it is transformed to formaldehyde, which is degraded by FDH. Similarly, when formaldehyde enters the cells, it is degraded by FDH. This explains the increase in FDH expression of methanol and formaldehyde. By contrast, acetaldehyde is degraded by other enzymes and formic acid is degraded to CO2 and H2O without FDH, and the FDH expression in these groups remains similar to that in the control group.
In general, the antagonistic effect of formaldehyde on cell growth and endogenous formaldehyde can be explained by the role of formaldehyde in signaling pathways. These pathways will be studied in detail in future research. Exposure to formaldehyde interferes with the cell’s metabolic regulation and changes gene expression. Oncogene activation could also be investigated in future.
Footnotes
Authors’ Note
The authors KYJ and QXD contributed equally to this work.
Conflict of interest
The authors declared no conflicts of interest.
Funding
This work was funded by the Key Project of National Natural Science Foundation of China (grants 21103059 and 51076079).