
Abstract
Insulin resistance, oxidative stress, and proinflammatory cytokines play a key role in pathogenesis of nonalcoholic fatty liver disease (NAFLD). The aim of our study was to investigate the dynamics of oxidative/nitrosative stress in methionine–choline-deficient (MCD) diet -induced NAFLD in mice. Male C57BL/6 mice were divided into following groups: group 1: control group on standard diet; group 2: MCD diet for 2, 4, and 6 weeks (MCD2, MCD4, and MCD6, respectively). After treatment, liver and blood samples were taken for histopathology, alanine- and aspartate aminotransferase, acute phase reactants, and oxidative/nitrosative stress parameters. Liver malondialdehyde level was higher in all MCD-fed groups versus control group (p < 0.01), while nitrites + nitrates level showed a progressive increase. The activity of total superoxide dismutase and its isoenzymes was significantly lower in all MCD-fed groups (p < 0.01). Although catalase activity was significantly lower in MCD-fed animals at all intervals (p < 0.01), the lowest activity of this enzyme was evident in MCD4 group. Liver content of glutathione was lower in MCD4 (p < 0.05) and MCD6 group (p < 0.01) versus control.
Keywords
Introduction
Nonalcoholic fatty liver disease (NAFLD) is the hepatic manifestation of metabolic syndrome that manifests as a range of pathologic states, from steatosis to nonalcoholic steatohepatitis (NASH), liver fibrosis, cirrhosis, with the possibility of progression to hepatocellular carcinoma. 1 Although the exact mechanisms involved in development of NAFLD are not fully clarified, the pathogenesis of the disease is based on a two-hit model. 2 The first hit includes insulin resistance and visceral obesity, which increases the uptake of free fatty acids in the liver, de novo lipogenesis of fatty acids, and accumulation of triacylglycerols. 3 These initial changes make the liver vulnerable to influence of oxidative stress and proinflammatory cytokines (the second hit). 2
Oxidative stress plays an important role in progression of steatosis to NASH. 4 The main sources of reactive oxygen species (ROS) within hepatocytes are mitochondrial functional abnormalities, cytochrome P450 2E1(CYP2E1), nicotinamide adenine dinucleotide phosphate oxidase, cyclooxygenase and lipooxygenase pathways, and iron overload. 4,5 Furthermore, decreased antioxidant capacity of hepatocytes contributes to ROS-induced liver injury. This is confirmed by positive correlation of copper/zinc–superoxide dismutase (Cu/Zn-SOD), catalase (CAT), glutathione-S-transferase, and reduced glutathione (GSH) level with degree of liver impairment. 6
ROS contribute to development of NAFLD in several mechanisms. They cause lipid peroxidation as well as oxidative modification of proteins and DNA in hepatocytes. 4,5 Lipid peroxidation products cause mitochondrial damage, inhibit the electron transport chain of the mitochondria leading to futher increase of ROS production. 4 ROS also initiate a cascade that leads to the activation of the nuclear transcription factor κB, with consequent increase in gene expression of various inflammatory cytokines, (tumor necrosis factor α, interleukin 1 (IL-1) 1, IL-6, IL-8, and IL-17 and growth factors (transforming growth factor β (TGF-β) and platelet-derived growth factor (PDGF). 4,5 On the other hand, ROS activates hepatic stellate cells, which results in deposition of extracellular matrix, contributing to development of liver fibrosis and cirrhosis. 5 It is known that ROS induce inducible nitric oxide synthase (iNOS) synthesis, which leads to increase in nitric oxide (NO) level. Recent evidence indicates that most of the cytotoxicity attributed to NO is due to peroxynitrite, produced from reaction between NO and the superoxide anion. 7
Although ROS and reactive nitric species (RNS) may be involved in the pathogenesis of NAFLD, changes in antioxidant capacity of hepatocytes, as well as influence of ROS/RNS on progression of steatosis to steatohepatitis are not completely clear. The precise role and time course of oxidative/nitrosative stress could have therapeutic implications to prevent progression of steatosis to the NASH by antioxidants. Therefore, the aim of our study was to investigate the dynamics of oxidative/nitrosative stress in methionine–choline-deficient (MCD) diet-induced NAFLD in mice.
Materials and methods
Animals
The experiment was performed on male mice C57BL/6 weighing 20–25 g, raised at Military Medical Academy, Belgrade, Serbia. Animals were kept under standard laboratory conditions (temperature 22 ± 2°C, relative humidity 50 ± 10%, 12-h/12-h light–dark cycle with lights turned on at 9.00 h a.m.) and had free access to tap water and appropriate food. All experimental procedures were in full compliance with Directive of European Parliament and of the Council (2010/63EU) and approved by the Ethical Committee of University of Belgrade (No. 695/2), Serbia.
Experimental design
Prior experiment, all animals (n = 28) were fed with control diet for 1 week (acclimatization period). At the age of 8 weeks, they were randomly divided into two groups. Group 1: control group (C; n = 7) fed with standard chow; group 2: MCD diet groups fed for 2, 4, or 6 weeks (MCD2, MCD4, and MCD6 groups, respectively; n = 7 per group). Standard diet contained 2 g/kg choline chloride and 3 g/kg methionine, while MCD diet had the same composition as standard chow without methionine and choline and with expense of sucrose (22.76%) (MP Biomedicals, Santa Ana, California, USA).
The animals were fasted overnight before killing. After 2, 4, and 6 weeks on diet treatment, animals were killed by exsanguination in ketamine (100 mg/kg intraperitoneally) anesthesia. Blood samples from the right side of the heart and liver samples were collected for biochemical (aminotransferase activity, acute phase reactants, and parameters of oxidative/nitrosative stress) and histopathological analysis and stored as described below.
Sample preparation
Liver samples for biochemical analysis were homogenized on ice, in cold-buffered 0.25 M sucrose medium (Serva Feinbiochemica, Heidelberg, New York, USA), 10 mM phosphate buffer (pH 7.0), and 1 mM ethylenediaminetetraacetic acid (EDTA, Sigma chemicals Ltd, St Louis, Missouri, USA). The homogenates were centrifuged at 2000g for 15 min at 4°C. Crude sediments were dissolved in a sucrose medium and centrifuged. The supernatants were transferred into the tubes and centrifuged at 3200g for 30 min at 4°C. Obtained sediments were dissolved in deionized water. After 1 hour of incubation, the samples were centrifuged at 3000g for 15 min at 4°C, and supernatants were stored at −70°C. Proteins were determined by Lowry method using bovine serum albumin as the standard. 8
Biochemical parameters
Determination of serum enzymes and acute phase proteins
Biochemical evaluation of liver injury was performed by quantifying serum activity of alanine aminotransferase (ALT) and aspartate aminotransferase (AST). Their activities were determined spectrophotometrically, using Sigma test kits (Sigma Chemicals Ltd, St Louis, Missouri, USA) on BTS-330 photometer (BioSystems, Barcelona, Spain), according to the manufacturer’s instructions.
The concentration of C-reactive protein (CRP) and ferritin was determined turbidimetrically, based on agglutination of latex particles coated with antibodies on CRP and ferritin (BioSystems, Barcelona, Spain). The concentration of serum transferrin was determined turbidimetrically, which is based on its precipitation in the reagent contains antitransferrin antibodies dissolved in imidazole buffer (1 mol/L) and sodium azide (0.95 g/L, pH 7.5). All analyses were carried out on BTS-330 photometer according to the manufacturer’s instructions.
The concentration of α1-antitrypsin and α2-macroglobulin was determined by radioimmunoassay method using a tube coated with rabbit polyclonal antibodies to α1-antitrypsin and α2-macroglobulin (Abcam, Cambridge, England), and radioactivity was measured using scintillation counter. 9,10
Determination of oxidative/nitrosative stress parameters
Lipid peroxidation in the plasma and liver homogenates was measured as malondialdehyde (MDA) production, assayed in the thiobarbituric acid reaction as described by Girotti et al. 11 The results are expressed in nanomoles per milligram proteins in liver homogenates.
The concentration of nitrites + nitrates (NO x ; nanomoles per milligram protein) as a measure of NO production was determined by Griess reagent. After reduction of the nitrates, the total nitrites were reacted with sulfanilamide and N-(1-naphthyl) ethylenediamine to produce an azo dye, which was measured spectrophotometrically at 492 nm. 12
Total SOD (EC1.15.1.1) activity in the liver was measured spectrophotometrically, as an inhibition of epinephrine auto-oxidation at 480 nm. After addition of 10 mM epinephrine (Sigma, St Louis, Missouri, USA), analysis was performed in the sodium carbonate buffer (50 mM, pH 10.2; Serva Feinbiochemica, Heidelberg, New York, USA) containing 0.1 mM EDTA (Sigma, St Louis, Missouri, USA). Samples for manganese (Mn) SOD were previously treated with 8 mM potassium cyanide (Sigma, St Louis, Missouri, USA) and then analyzed as previously described. 13 Activity of Cu/Zn-SOD was determined as difference between the activities of total SOD and Mn-SOD. All SOD enzymes activities were expressed in units per milligram protein.
CAT activity in the liver was determined spectrophotometrically based on the decrease in absorbance of hydrogen peroxide at 240 nm, and it is expressed in units of activity per milligram protein present in a given sample. 14 One unit of the enzyme activity was defined as 1.0 μmol hydrogen peroxide reduced per minute at pH 7.0 at 25°C.
GSH was determined by reaction of aliphatic thiol compounds in Tris–hydrochloric acid buffer (0.4 mol, pH 8.9) with 5,5′-dithiobis-2-nitrobenzoic acid (36.9 mg in 10 mL of methanol), thereby producing the yellow-colored p-nitrophenol anion that was measured at 412 nm. The intensity of the formed chemical compound was proportional to the GSH concentration, which is expressed in nanomoles per milligram protein. 15
Histopathological analysis
Liver tissue was sectioned and incubated in 10% formalin solution at room temperature. After fixation, the liver samples were processed using the standard method. Tissues were incorporated in paraffin, sectioned at 5 μm and then stained with hematoxylin–eosin. Then, they were prepared for light microscopy analysis. All samples were evaluated by an experienced histopathologist who was blinded to the experiment. Preparations were analyzed and photographed using a combined photobinocular light microscope (model BX51; Olympus, Tokyo, Japan) equipped with a camera (Artcore 500 Medical Imaging, Artray Co. Ltd, Tokyo, Japan).
Statistical analysis
Results are expressed as means ± SD. As the normal distribution of parameters was confirmed by Kolmogorov–Smirnov test, two-way analysis of variance with Tukey’s post hoc test was used for testing the difference among groups. The difference was considered statistically significant if the value of p < 0.05. Statistical Package for Social Sciences (version 15.0; SPSS Inc., Chicago, Illinois, USA) program was used for the statistical analysis.
Results
Effect on serum enzymes and acute phase proteins
Serum ALT and AST activity were higher in all MCD diet-fed groups in comparison with control (p < 0.01; Table 1). Concentration of CRP and ferritin was significantly higher (p < 0.01), while concentration of transferrin was significantly lower (p < 0.05) in MCD6 compared with the control group (Table 1).
Activities of ALT and AST and concentration of acute-phase proteins in serum of mice fed with MCD diet after 2, 4, and 6 weeks (MCD2, MCD4, MCD6, respectively).

ALT: alanine aminotransferase; AST: aspartate aminotransferase; CRP: C-reactive protein; ANOVA: analysis of variance; MCD: methionine–choline deficient.
a p < 0.01 versus control: statistically significant difference was estimated by multifactorial ANOVA with Tukey’s post hoc test.
b p < 0.05 vs. control: statistically significant difference was estimated by multifactorial ANOVA with Tukey’s post hoc test.
Effect on lipid peroxidation, nitrosative stress, and antioxidant enzymes in liver
Results of our study have shown that the concentration of MDA in the liver was significantly higher in all treated groups (MCD2: 364.3 ± 63.8, MCD4: 332.14 ± 32.00, and MCD6: 348.57 ± 49.98 nmol/mg proteins, respectively) compared with the control values (189.3 ± 43.9 nmol/mg protein; p < 0.01). However, no significant changes were observed in MDA concentration between treated groups (p > 0.05; Figure 1).

The effect of MCD diet on the level of MDA in the mice liver after 2, 4, and 6 weeks (MCD2, MCD4, MCD6, respectively). Statistically significant difference was estimated by two-way ANOVA with Tukey’s post hoc test (**p < 0.01 vs. control). MCD: methionine–choline deficient; MDA: malondialdehyde; ANOVA: analysis of variance.
MCD diet induced significantly higher liver NO x levels in all groups compared with the control group (19.15 ± 5.95 nmol/mg protein p < 0.01). NO x concentration was significantly higher in MCD6 (52.4 ± 11.45 nmol/mg protein) compared to MCD2 (33.03 ± 15.18 nmol/mg protein) and MCD4 group (37.98 ± 5.05 nmol/mg protein p < 0.05; Figure 2).

The effect of MCD diet on the level of NO x in the mice liver after 2, 4, and 6 weeks (MCD2, MCD4, MCD6, respectively). Statistically significant difference was estimated by two-way ANOVA with Tukey’s post hoc test (**p < 0.01 vs. control; #p < 0.05 vs. MCD2). MCD: methionine–choline deficient; NO x : nitrites + nitrates; ANOVA: analysis of variance.
Total SOD activity in the liver was significantly decreased in MCD2 (3.42 ± 0.77 U/mg protein) as compared to control values (27.5 ± 2.67 U/mg protein; p < 0.01). Over the time, the activity of this enzyme continually decreased in MCD4 (1.32 ± 0.18 U/mg protein) and MCD6 (1.68 ± 0.32 U/mg protein), so it was significantly lower in these two groups compared with MCD2 group (p < 0.01; Figure 3). Activities of Mn-SOD and Cu/Zn-SOD followed the changes of total SOD in all groups. Activities of these two isoenzymes were significantly lower in MCD4 and MCD6 groups in comparison with MCD2 (p < 0.05; Figure 3(a)).
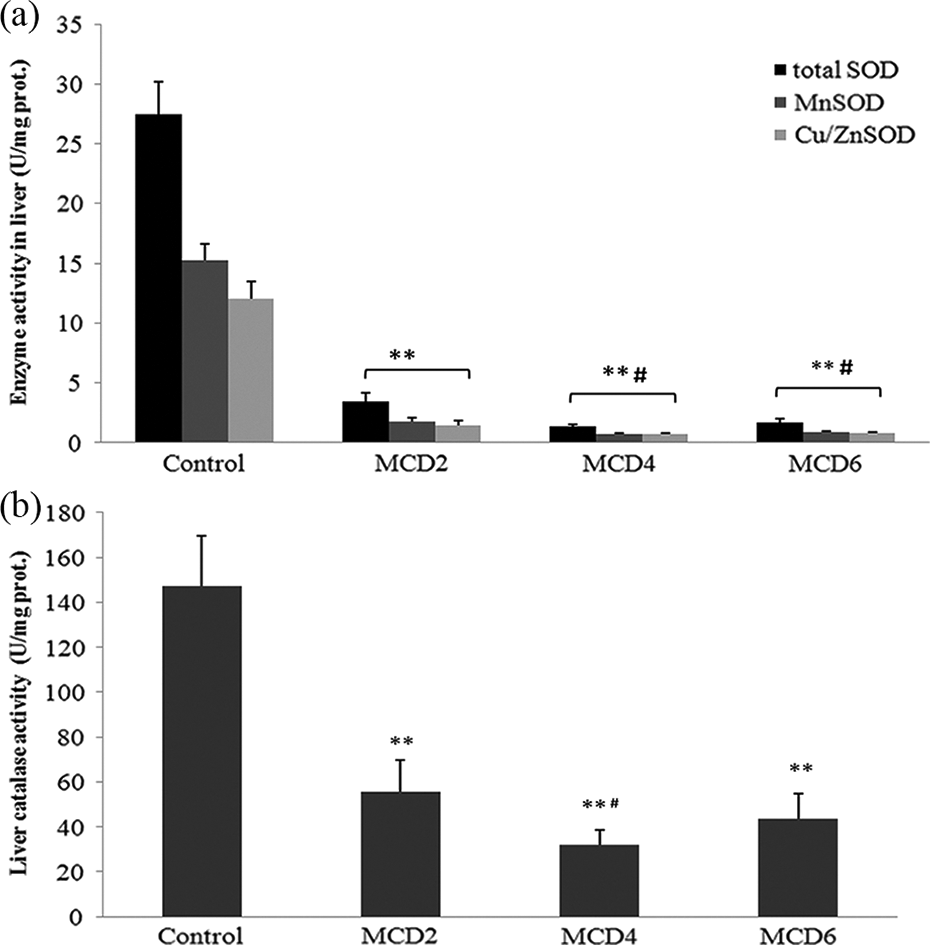
The effect of MCD diet on the activity of total SOD, Mn-SOD, and Cu/ZnSOD in the mice liver after 2, 4, and 6 weeks (MCD2, MCD4, MCD6, respectively) (a). The effect of MCD diet on the activity of CAT in the mice liver after 2, 4, and 6 weeks (MCD2, MCD4, MCD6, respectively) (b). Statistically significant difference was estimated by two-way ANOVA with Tukey’s post hoc test (**p < 0.01 vs. control; #p < 0.05 vs. MCD2). MCD: methionine–choline deficient; ANOVA: analysis of variance; SOD: superoxide dismutase; Mn-SOD: manganese superoxide dismutase; Cu/Zn SOD: copper/zinc superoxide dismutase; CAT: catalase.
Activity of CAT in the liver was significantly reduced in all groups treated with MCD diet in comparison with control (147.14 ± 22.52 U/mg protein; p < 0.01). However, the most prominent decrease in CAT activity was observed in MCD4 (31.07 ± 6.93 U/mg protein) compared with MCD2 (55.71 ± 14.00 U/mg protein; p < 0.05; Figure 3(b)).
Although the level of GSH in the liver was not significantly changed in MCD2 (113.55 ± 34.01 nmol/mg protein), the significant decrease was observed in MCD4 (95.3 ± 25.11 nmol/mg protein) as compared to control values (123.34 ± 32.12 nmol/mg protein; p < 0.05). The most prominent decrease of GSH level was detected in MCD6 (78.08 ± 28.13 nmol/mg protein) in comparison with control group (p < 0.01; Figure 4).

The effect of MCD diet on reduced GSH level in the mice liver after 2, 4, and 6 weeks (MCD2, MCD4, MCD6, respectively). Statistically significant difference was estimated by two-way ANOVA with Tukey’s post hoc test (**p < 0.01 vs. control; *p < 0.05 vs. control). GSH: glutathione; MCD: methionine–choline deficient; ANOVA: analysis of variance.
Histopathological findings
There were no pathological changes in control group (Figure 5(a)). MCD diet caused hepatic steatosis in mice, which was evident in all experimental groups. Mild hepatic steatosis with focal fatty changes was found in MCD2 group in the form of microvesicular steatosis (Figure 5(b)). Within 4 weeks, MCD diet induced moderate steatosis with diffused fatty acid changes in mice liver (Figure 5(c)). In MCD6 group, the presence of severe macrovesicular steatosis with intralobular inflammatory infiltrate indicates NASH. Ballooning degeneration of hepatocytes and cell swelling was observed as a result of fat accumulation (Figure 5(d)).

The effect of MCD diet on histopathological changes in the liver. HE-stained preparations were sectioned with blade thickness of 5 μm and analyzed and photographed using a combined photobinocular light microscope Olympus BX51. (a) Control with normal liver histology; (b) liver histology after 2 weeks of MCD diet with focal steatosis, which is mainly microvesicular and predominantly perivenular distribution; (c) liver histology after 4 weeks of MCD diet with diffused macrovesicular steatosis; (d) After 6 weeks of MCD diet portal inflammation is present with mixed infiltrate of neutrophils associated with periportal fibrosis. MCD: methionine–choline deficient; HE; hematoxylin–eosin.
Discussion
Mechanisms of genesis and progression of NAFLD in human population are very complex and still not entirely understood. Numerous animal models have been developed, based on genetic predisposition (ob/ob, db/db) or nutritive factors (MCD diet, high-fat diet, modified high-fat diet), as well as in vitro models, in order to clarify the pathogenesis of human NAFLD. 16,17 MCD model, which is used in this experiment as well, is considered convenient for examining the role of oxidative stress and inflamation in progression of NAFLD. 18 Methionine deficiency results in decrease of cysteine, the major precursor of GSH, which is the main cellular antioxidant, while choline deprivation decreases phosphatidylcholine portion in very low-density lipoprotein particles with consequential accumulation of triacilglicerol in the liver. 4,18 Oxidative stress leads to activation of hepatic stellate cells and a proinflammatory response of Kupffer cells, contributing to the inflammatory process and to fibrosis development. 4 In support of this, the treatment with antioxidants (α-lipoic acid, vitamin E, and vitamin C) enables significant improvement or even complete resolution of liver steatosis and inflammation. 19
Oxidative stress participates in hepatocytes injury in early phase of NAFLD induced by MCD diet. 18 However, our results have shown the specific time-dependent changes of oxidative stress parameters, which implies their possible influence in the progression of NAFLD. High level of ROS leads to lipid peroxidation with production of highly reactive aldehydes such as MDA. 5 In our study, level of liver MDA was raised after 2 weeks, with no further significant changes (Figure 1). It might suggest that lipid peroxidation is not the key mechanism of NAFLD progression but has obvious role in development of steatosis. 18 However, numerous in vitro and in vivo studies emphasize the role of lipid peroxidation in that process. 16,20,21 Thus, in hepatocyte cell culture, 4-hydroxynonenal, as a product of lipid peroxidation activates the signal pathway of c-Jun N-terminal kinase (JNK). The same pathway can induce hepatocyte death and was activated in NAFLD too. 20 In relation, this study also has shown that excessive expression of CYP2E1 is a mechanism of increased production of ROS in NAFLD. 20 That is the reason why in vivo studies are more reliable for examination of the role of lipid peroxidation, analyzing the complexity of oxidative stress mechanisms in NAFLD. Besides, the progressive raise of lipid peroxidation was observed in the models of Tsumura Suzuki obese diabetes mice and high-fat diet fed mice. 16,21 All these models that induce NAFLD with insulin resistance and hyperinsulinemia can contribute to the development of NASH by other mechanisms. 16 That is the reason why MCD model is more suitable for individual examination of the role of lipid peroxidation in later stages of NAFLD.
According to our results, MDA level has not changed over the time, while NO x level has progressively raised with maximal values after 6 weeks of diet (Figures 1 and 2). Possible explanation might be that NO acts as a ROS scavenger, protects cells from lipid peroxidation and consequently prevents progressive increase of MDA level. 22 Our data imply that nitrosative stress might have more significant role in progression of NAFLD than lipid peroxidation. This findings might be explained with correlation between level of RNS and degree of liver injury. 23 High concentration of NO in the presence of superoxide anion generates peroxynitrite, a strong oxidant, that interacts with lipids, DNA, and proteins via direct oxidative reactions or via indirect, radical-mediated mechanisms. 7
In our study, rise of liver NO x level is associated with increased aminotransferase activity and level of acute phase proteins in serum, as well as hepatic tissue alterations (Table 1, Figure 5). The most prominent inflammatory changes in the liver histopathology were evident 6 weeks after the treatment accompanied with increased serum CRP and ferritin level. In contrast, serum concentration of α1-antitrypsin and α2-macroglobulin remained unchanged in all experimental groups (Table 1). Increased activity of both aminotransferases was detected in all treated groups, which indicates hepatocellular injury (Table 1). MCD diet induced mild hepatic steatosis with focal fatty changes in MCD2 group (Figure 5(b)) and moderate steatosis with diffuse fatty changes in MCD4 (Figure 5(c)), while in MCD6 group severe macrovesicular steatosis, ballooning degeneration of hepatocytes and intralobular inflammatory infiltrate were observed (Figure 5(d)). Possible mechanism by which reactive nitrogen compounds aggravate NAFLD include iNOS-derived NO, that stimulates gene expression of proinflammatory cytokines and fibrogenic growth factors (TGF-β, PDGF) in hepatic stellate and Kupffer cells with consequent leukocyte infiltration of liver and transformation of hepatic stellate cells in myofibroblast-like cells. 24 It was shown that intrahepatic accumulation of nitrotyrosine is associated with the severity of histological changes in liver, which strongly suggests that nitrosative stress may play a significant role in the pathogenesis of NASH. 25
Progressive development of nitrosative stress could be explained by decrease of liver SOD activity, which had the lowest value after 4 weeks of MCD diet (Figure 3(a)). Decreased activity of SOD, especially its mitochondrial isoenzyme Mn-SOD, leads to superoxide anion accumulation, that by reaction with NO forms peroxynitrite, as already explained. 7 Similarly, MCD diet induces decrease in liver CAT activity, the most prominent after 4 weeks as well (Figure 3(b)). Our findings are in agreement with human studies that found the changes in activity of CAT, total SOD, and its isoenzymes in the liver during the progression of NAFLD. 26 One possibility for reduced antioxidant capacity could be explained by raising of CYP2E1 activity in the liver, which leads to CAT and SOD inactivation in the course of the disease. This explanation is in accordance with some in vitro studies that showed inactivation of CAT and SOD by superoxide radical, hydroxyl radical, peroxyl radical, or singlet oxygen. 27,28 Besides, additional reason for depletion of antioxidant capacity is lower protein synthesis in advanced stages of NAFLD. 28 Based on our results, the most prominent decrease of liver antioxidative capacity was observed after 4 weeks. These findings indicate that the greatest extent of liver vulnerability for oxidative injury can be noted in this period. Therefore, the application of antioxidants would be efficient in prevention of NASH but not the initial phase of NAFLD.
Our results have shown that GSH level in the liver has progressively decreased, in inverse proportion to level of NO x (Figures 2 and 4). This decline can be explained by oxidation of GSH within free radicals neutralization, as well as its lower synthesis, resulting from decreased production of cysteine as the limiting GSH precursor, due to methionine deficiency. 29 On the other hand, Marcolin et al. 18 observed that the compensatory increase of GSH level in initial phase of NAFLD, having in mind, presents the last line of defense against free radicals. The importance of low GSH in NAFLD progression is indicated by protective effect of N-acetylcysteine, a sulfhydryl donor, can lead to regression of steatosis in human liver 30 and increased mitotic activity of hepatocytes in partially hepatectomized NAFLD rats. 31 However, in our study, the initial decrease probably could be explained by insufficient GSH synthesis due to methionine deficiency (MCD diet). Therefore, our results imply that the application of sulfhydryl group donors might be useful in the inital phases of NAFLD, in order to prevent development of NASH. In contrast, Haque et al., indicated that low level of hepatic GSH attenuates steatosis progression to NASH, due to development of compensatory metabolic mechanisms, which may offer novel strategies for the NASH prevention. 32
Our study suggests that MCD diet induces a progressive rise in nitrosative stress in the liver. It also indicates that nitrosative stress might have more significant role in progression of NAFLD than lipid peroxidation. Additionally, the most prominent decrease in liver antioxidative capacity is in the fourth week, which implies that application of antioxidants would be most suitable in this period, in order to prevent NASH but not the initial phase of NAFLD.
Footnotes
Conflict of interest
The authors declared no conflicts of interest.
Funding
This work was supported by the Ministry of Education, Science and Technology Development of Republic of Serbia, Grant No 175015.