
Abstract
Benzo(a)pyrene (BaP), a typical environmental carcinogen, can induce cell death both by protein 53 or tumor protein 53 (p53)-independent and -dependent pathways. However, little is known about the molecular mechanisms of p53-independent pathways in BaP-induced cell death. In this study, cells with different genetic background (including p53-proficient human fetal lung fibroblast cell lines (MRC-5), p53-deficient human non-small-cell lung carcinoma cell lines (H1299), and p53-knockdown cell lines (MRC-5 p53−/− )) were used to establish models of BaP-induced cell death. The results showed that BaP (8, 16, 32, and 64 μM) induced necroptotic cell death in the cell lines. The necroptotic cell death and DNA damage were concurrently observed. In the three cell lines, at 24 h after treatment, BaP (8–64 μM) upregulated expressions of BAX, BCL-2, and cleaved caspase-3 proteins, but not their messenger RNA levels. The findings suggested that BaP-induced necroptosis was modulated by the p53-independent pathway, which was related to the induction of BAX, decreased expression of BCL-2, and activation of caspase-3.
Introduction
Benzo(a)pyrene (BaP) is the most toxic and best studied polycyclic aromatic hydrocarbons. It is metabolized by cytochrome P450 (CYP450) enzymes to generate active compounds that form DNA adducts and induce the production of reactive oxygen species (ROS) in cells. For instance, the directly acting carcinogen BaP-7,8-diol-9,10-epoxide (BPDE) binds covalently to DNA to perform its mutagenic and carcinogenic effects. 1 BPDE can also act in synergy with other exposures (e.g. ultraviolet light), ultimately increases the risk of DNA mutation. 2 BaP can be metabolized to active quinones that generate ROS, leading to the occurrence of oxidative DNA damage. 3,4 When BaP-induced massive DNA damage occurred, cells may be removed by programmed cell death (PCD) 5,6 to prevent cancer development in mammals. 7
Apoptosis and necrosis are two distinct mechanisms of cell death. Apoptosis is characterized by chromatin condensation and cell shrinkage in the early stage, then nuclear fragmentation, cytoplasmic blebbing, and forming membrane-bound apoptotic bodies. 8 It can be triggered by either extrinsic or intrinsic apoptotic pathways involved in the complex molecular signaling systems. 9 Necroptosis, an important cellular death mechanism, has attracted much attention recently. 10,11 It is characterized by a necroptosis morphology, presenting an early onset plasma membrane permeabilization, rupture of the plasma membrane and spilling of the intracellular content, and relatively complete nuclear envelope. 12 Accumulating evidence suggests that necroptosis is the initiation of programmed necrosis and can occur in a regulated manner. 9,12 The loss of mitochondrial membrane permeabilization and onset of mitochondrial permeability transition pore were involved in necroptosis. 12 –14 Apoptosis and necroptosis can occur concurrently and share some common pathways, which may be differentially induced by variable doses of pollutants. 15 However, the underlying molecular mechanisms still remain elusive.
The protein 53 or tumor protein 53(p53) is a key regulator of DNA damage-induced PCD. 16 –18 In response to DNA damage, the activation of p53 protein was rapidly phosphorylated by the phosphoinositide 3-kinase-related kinases. 19 Thereafter, a series of apoptosis-associated proteins including p53-upregulated modulator of apoptosis, BCL2-associated X protein (BAX), and B-cell leukemia/lymphoma 2 (BCL-2) were activated by activated p53 protein. 20,21 Additionally, evidence suggests that activation of p53 was required for necroptotic cell death. 16,22 Recent studies have indicated that p53 plays an important role in BaP-induced cell death. 23,24 Our previous studies showed that a necrotic cell death occurred in a concentration-dependent manner after exposure to BaP for 12 h in p53-deficient human non-small-cell lung carcinoma cell line (H1299 cells) 25 ; moreover, early necrosis and late apoptosis were observed in p53 null liver cell line (Hep3B) after exposure to BaP for 12 and 24 h. 24 Obviously, both p53-dependent and -independent mechanisms were involved in response to BaP-induced cell death. However, little is known about p53-independent mechanisms in BaP-induced cell death.
Both BAX and BCL-2 play different roles in regulating the mitochondrial pathway of apoptosis. 26 In response to various types of stress (such as oxidative stress and DNA damage), activated BAX translocates from the cytosol to mitochondria, and participates in the formation of pores in the outer mitochondrial membrane through the release of apoptogenic proteins, including second mitochondria-derived activator of cytochrome c, Smac/Diablo, and caspases. BCL-2 is located in the outer mitochondrial membrane. It inhibits the activity of Bax by forming heterodimers with the proapoptotic protein Bax. 27 Elevated expression of BAX is involved in p53-initiated apoptosis, while overexpression of Bcl-2 conferred resistance to apoptosis. Therefore, the Bax/Bcl-2 ratio determines the mitochondria-dependent apoptotic effects on a cell. 28,29
Caspases are cysteine proteases. They mediated mitochondria-dependent apoptosis. 30 Among them, Caspase-3, a critical effector caspase for apoptosis, was activated by the release of mitochondrial cytochrome c, 31,32 and mediated cleavage of vital cellular proteins, leading to the cell disassembly and cell death. 33,34 Obviously, expression of BAX, BCL-2, and caspase-3 proteins are involved in the regulation of p53-mediated cell death. However, little evidence is available regarding the apoptotic proteins function in p53-independent apoptosis.
Both human fetal lung fibroblast cell lines MRC-5 and H1299 cells are derived from human lung tissue, the former was p53-proficient cells and the latter was p53-deficient cells. Lin and Yang found that BaP induced necroptosis in p53-proficient HepG2 cells. 35 Our previous study showed that BaP caused necroptosis at the early stage and delayed apoptosis in p53-deficient Hep3B cells. 24 The available evidence suggested that BaP induced p53-independent cell death in these cell lines. In the present study, we investigated BaP-induced cell death via p53-independent mechanisms using cells with the differences in p53 genetic background, including MRC-5, H1299, and p53-knockdown cell lines (MRC-5 p53−/− ). Cell viability, percentages of apoptotic/necroptotic cells, and extent of DNA damage were measured. Expression of p53, BAX, BCL-2, and cleaved caspase-3 proteins were analyzed using Western blotting. As detailed in the following sections, the results suggested that BaP-induced DNA damage initiated a p53-independent necroptotic cell death involving a Bax/Bcl-2-dependent mitochondrial pathway.
Materials and methods
Cell culture
H1299 cells were kindly provided by Prof. Caicun Zhou (Shanghai Pulmonary Hospital, China) and wild-type MRC-5 cells were obtained from the Cell Bank of Type Culture Collection of Chinese Academy of Science (Shanghai, China). H1299 and MRC-5 cells were cultured with suitable media (Roswell Park Memorial Institute 1640 Medium (Gibco BRL, Gaithersburg, Maryland, USA)) for H1299 cells and Minimum Essential Medium (MEM; Thermo Fisher Scientific, Beijing, China) for MRC-5 cells supplemented with 10% fetal bovine serum (FBS). All the cells were incubated at 37°C in a humidified atmosphere containing 5% carbon dioxide.
p53 Knockdown by siRNA
To knock down the expression of p53 in MRC-5 cells, gene silencing was performed using the siPORTTM NeoFXTM Transfection Agent kit (Applied Biosystem, Foster City, California, USA) according to the manufacturer’s instructions. Briefly, a p53-targeted small interfering RNA (siRNA) sequence (siRNA ID s606) was designed and synthesized by Applied Biosystems (Foster City, California, USA). For transfection of cells with siRNA, MRC-5 cells were seeded at a density of 2 × 10⁵ cells per well in six-well plates. The adherent cells were trypsinized and diluted in the appropriate medium. siPORT NeoFX transfection agent was diluted into Opti-MEM I medium (final concentration: 5%) and incubated at room temperature for 10 min. siRNA was also diluted into Opti-MEM I medium (final concentration: 50 nM). Diluted siPORT NeoFX transfection agent and diluted siRNA were combined and incubated at room temperature for an additional 20 min. The transfection mixture was added to the six-well plates. Cell suspensions (final concentration for Silence Select siRNAs, 5 nM) were overlaid onto the transfection complexes. After 4 h of incubation, the medium was removed, and the cells were cultured in MEM-containing 10% FBS.
Chemical treatment
BaP and dimethyl sulfoxide (DMSO) were obtained from Sigma (Sigma-Aldrich Chemical Co. Inc., St Louis, Missouri, USA). BaP was dissolved in DMSO (final concentration: 128 μM/mL) as the stock solution for the further experiments. To compensate for the lack of microsomal CYP450 enzymes, the cells prior to BaP treatment were preincubated with S9 activation mixture (final concentration: 3%) for 30 min. After incubation, MRC-5, H1299, and MRC-5 p53−/− cells were treated with BaP (8, 16, 32, and 64 μM). Control cultures were treated with an equal amount of DMSO (final concentration volume:volume <1%) in the corresponding media with 3% S9 mixture.
Cytotoxic activity
The 3-(4,5-dimethylthiazol-2-yl)-2,5-diphenyltetrazolium bromide (MTT)-based assay (Sigma-Aldrich Chemical Co. Inc., St Louis, Missouri, USA) wasperformed to determine the cytotoxicity of BaP on MRC-5, H1299, and MRC-5 p53−/− cells. Briefly, cells were seeded in 96-well plates (5 × 10³cells/well). The cells were treated with various concentrations of BaP (8, 16, 32, and 64 µM) and incubated for 24 h. After incubation, the culture medium in each well was replaced with 90 μL of fresh serum-free medium and 10 μL of MTT solution (5 mg/mL in ×1 phosphate-buffered saline, PBS, pH = 7.5) and incubated at 37°C for further 4 h. The liquid in each well was carefully aspirated, then 150 μL of DMSO was added. The optical density was measured at 570 nm using Multi-Detection Microplate Readers (Synergy 2, BioTek Instruments Inc, Winooski, VT, USA). Data are mean ± SD of three independent experiments performed in six parallel wells.
Flow cytometry
MRC-5, H1299, and MRC-5 p53−/− cells were incubated with BaP to analyze the mode of cell death by Annexin-based fluorescence-activated cell sorting (FACS) analysis. Annexin V/propidium iodide (PI) staining assay was employed to classify further early apoptosis and late apoptosis stages in BaP-treated cells. Annexin V–fluorescein isothiocyanate (FITC)/PI double staining of the cells was determined using an Annexin V–FITC apoptosis detection kit (MultiSciences Biotech Co. Ltd, Hangzhou, China). Briefly, cells were seeded at a density of 5 × 10⁵ cells per well in six-well plates for 24 h. Then, the cells were incubated with the indicated concentrations of BaP or DMSO alone for 24 h. The harvested cells were trypsinized, washed twice with ice-cold PBS (pH 7.4), and resuspended cell pellet in 500 μL PBS (pH 7.4). The cells were incubated with 5 μL of Annexin V–FITC and 10 μL of PI per 100 μL PBS used in the dark for 20 min at room temperature. Finally, the samples were analyzed using a FACSort flow cytometer (BD Biosciences, Franklin Lakes, New Jersey, USA) within 1 h. The cell lines without BaP were used as negative controls and simultaneously measured. The percentage of the cells in each phase of cell cycle was calculated using the ModFit software (Verity Software House, Topsham, Maine, USA).
Comet assays
DNA damage was measured by alkaline comet assay as described previously. 36 Briefly, MRC-5, H1299, and MRC-5 p53−/− cells were cultured in 24-well plates. Then, the cells were treated without and with BaP at the indicated concentrations, trypsinized, and suspended in 100 μL of 0.7% low-melting point agarose (Sigma, St Louis, Missouri, USA) and loaded on 1% agarose-covered microscope slides. After solidification, slides were placed in 4°C lysis buffer (2.5 M sodium chloride (NaCl), 100 mM disodium ethylenediamine tetraacetate (Na2EDTA), 10 mM Tris-HCl/pH 10, 1% Triton X-100, and 10% DMSO) at 4°C for 1.5 h. Microscopic slides were then incubated in electrophoresis buffer (300 mM sodium hydroxide, 1 mM Na2-EDTA, pH > 13.5) for 20 min at 4°C, and electrophoresis was run for 30 min at 4°C (300 mA, 20 V). After neutralization (0.4 mM Tris-HCl, pH 7.5) for 15 min, slides were stained with 60 μL ethidium bromide (1 mg/mL) and covered with a coverslip for analysis within 24 h. A total of 100 cells at each concentration were analyzed by an inverse fluorescence microscope (Olympus, Tokyo, Japan). The images were captured with an image-formation system (Olympus DP121, Tokyo, Japan). The Olive tail moments (TMs) were determined using Comet Assay Software Project (http://www.casp.of.pl/). Data are expressed as the mean ± SD of three independent experiments.
Quantitative real-time PCR
Cells were cultured and treated without and with BaP at the indicated concentrations. Total RNA was isolated from all three cell lines using TRIzol reagent (Invitrogen Life Technologies, Carlsbad, California, USA) according to the manufacturer’s instructions. To assess the total RNA concentration and purity, a spectrometer (Biophotometer plus; Eppendorf, Netheler-Hinz, Hamburg, Germany) was used. The optical density ratios, OD260/OD280, of RNA samples were between 1.8 and 2.0. These RNAs were used in the subsequent experiments. A total of 5 μg total RNA was used to reverse-transcribe into complementary DNA (cDNA) using Revert Aid First Strand cDNA Synthesis kit (Fermentas, Hanover, Maryland, USA). Primers for the selected genes (listed in Table 1) were synthesized by Takara Biotechnology (Dalian) Co. Ltd (Dalian, China). The quantitative real-time polymerase chain reaction (qRT-PCR) was performed on an ABI 7900 HT (Applied Biosystem, Foster City, California, USA) using the SYBR® Green qPCR SuperMix-UDG kit (Invitrogen, Carlsbad, California, USA). The reaction mixture contained 2 μL cDNA, 0.4 μL primer mixture (2 nM each), 5 μL SYBR Green PCR Master Mix, and 2.6 μL diethylpyrocarbonate-treated water. The following program conditions were used for qRT-PCR reactions: after initial denaturation at 50°C for 2 min, samples were amplified for 45 cycles at 95°C for 30 s, followed by 60°C for 30 s. To distinguish between specific and nonspecific reaction products, a melting curve was obtained at the end of each run. β-Actin messenger RNA (mRNA) was used as an internal control to normalize the data in order to determine the relative expression of target genes. The relative quantification of gene expression was calculated using the
List of genes and primers used in real-time RT-qPCR experiments.
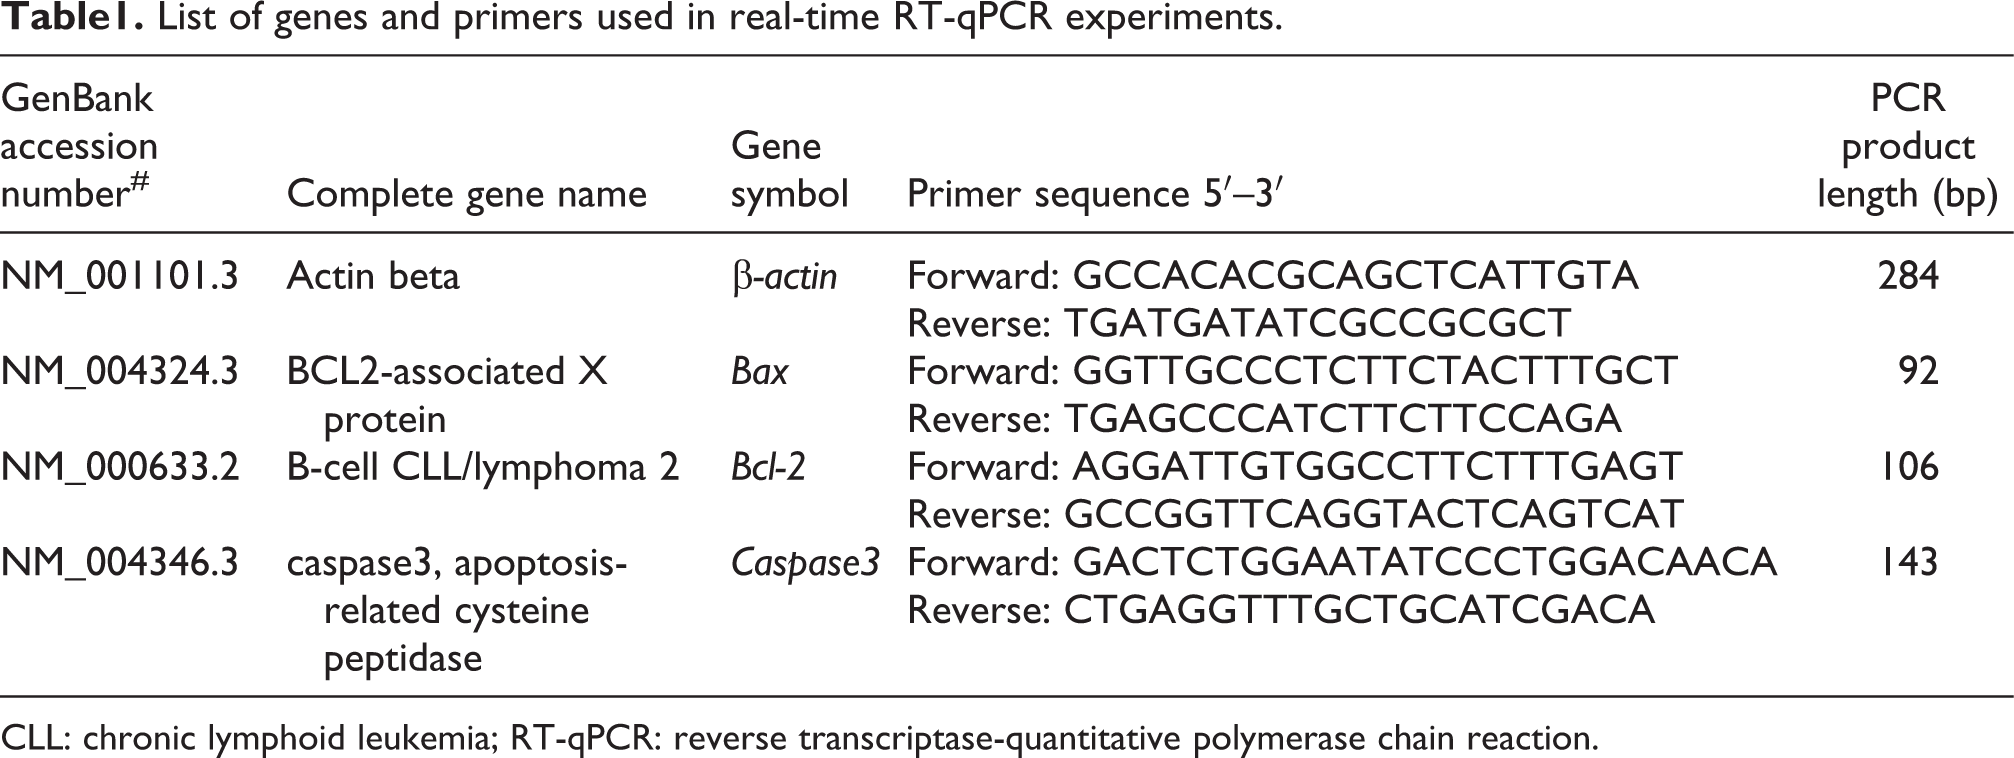
CLL: chronic lymphoid leukemia; RT-qPCR: reverse transcriptase-quantitative polymerase chain reaction.
Western blot
To explore the underlying mechanisms of BaP-induced cell death, expression of p53, BAX, BCL-2, and cleaved-caspase-3 proteins were measured using Western blotting analysis. Briefly, the cells were seeded in six-well plates at a density of 1 × 10⁶ cells per well. At 24 h after treatment, the cells treated with BaP at the indicated concentrations or DMSO alone were washed twice with ice-cold PBS (pH 7.2) and lysed in lysis buffer (250 mM Tris-HCl, pH 7.4, 1% Triton X-100, 1% sodium deoxycholate, 150 mM NaCl, 1 mM phenylmethanesulfonyl fluoride, and 10 μg/mL aprotinin). Aliquots of cell lysates (60 μg) from the treated cells were separated by 10% sodium dodecyl sulfate–polyacrylamide gel electrophoresis. After electrophoresis, the proteins were transferred onto polyvinylidene fluoride membrane (PVDF) membrane (Millipore Co., Billerica, Massachusetts, USA). The PVDF membranes were blocked with 5% milk in Tris-buffered saline (TBS)-containing 0.1% Tween-20 (TBST) for 1 h at 37°C. The membranes were washed with TBST and then incubated for 1 h at 4°C with TBST-containing the following primary antibodies: mouse monoclonal anti-GAPDH (1:1000 dilution, Santa Cruz Biotechnology, Inc., Santa Cruz, CA, USA), rabbit polyclonal anti-p53 (1:400 dilution, BS1275, Bioworld Technology Inc., Massachusetts, USA), rabbit polyclonal BAX (1:400 dilution, BS2538, Bioworld Technology Inc., Massachusetts, USA), rabbit polyclonal anti-BCL2 (1:500 dilution, sc-492, Santa Cruz, California, USA), and rabbit polyclonal anti-cleaved caspase-3 (1:400 dilution, BS7004, Bioworld Technology Inc., Massachusetts, USA). After washes with TBST, membranes were incubated with blocking buffer-containing secondary antibodies including goat anti-rabbit immunoglobulin G (IgG; BS13278, 1:5000 ditution, Bioworld Technology Inc., Massachusetts, USA) and goat anti-mouse IgG (BS12478, 1:5000 dilution, Bioworld Technology Inc., Massachusetts, USA) at 37°C for 1 h, respectively. The immunocomplexes were then detected using an enhanced chemiluminescence Western blotting detection kit (Pierce Biotechnology Inc., Rockford, Illinois, USA). The image capture and analysis were carried out using a GeneGnome imaging system (Syngene Inc., Frederick, Maryland, USA). The relative densities of protein bands on Western blot images were measured using the Gene tool software (Syngene Inc., Frederick, Maryland, USA). Data were represented in relative arbitrary units.
Statistical analysis
All results are expressed as mean ± SD. All statistical analyses were performed using SPSS, version 12.0 for Windows (SPSS Inc., Chicago, Illinois, USA). A p < 0.05 was considered statistically significant.
Results
siRNA transfection
To confirm the transfection efficiency, qRT-PCR was performed. Briefly, at 12, 24, 36, 48, 60, and 72 h after siRNA transfection, p53 gene expression was assayed. As shown in Figure 1(a), p53 mRNA expression was still detectable at 12 and 24 h after incubation. However, after an incubation of 36 h or more, no expression of p53 was detected, demonstrating that p53 was efficiently knocked down. Thus, further analysis was performed at 36 h posttransfection unless otherwise indicated.

(a) siRNA silencing of p53 gene in MRC-5 cells. MRC-5, H1299, and MRC-5 p53 −/− cells were treated with BaP at the indicated concentrations for 24 h. (b) Cell viability was determined using the MTT assay. Data are expressed as mean ± standard error of six replicates in each group. *p < 0.05, # p < 0.01, compared with solvent control group. siRNA: small interfering RNA; p53: protein 53 or tumor protein 53; MRC-5: human fetal lung fibroblast cell line; H1299: human non-small-cell lung carcinoma cell line; MRC-5 p53−/− : p53-knockdown cell lines. BaP: benzo(a)pyrene; MTT: 3-(4,5-dimethylthiazol-2-yl)-2,5-diphenyltetrazolium bromide.
Cell viability assays
The cytotoxic effects of BaP (0, 8, 16, 32, and 64 μM) on MRC-5, H1299. and MRC-5 p53 −/− cells were assessed using MTT assay at 24 h post-treatment. As shown in Figure 1(b), BaP reduced viability of the three cell lines in a concentration-dependent manner (p < 0.05).
Apoptosis and necrosis analysis
To determine the mode of cell death in BaP-treated MRC-5, H1299, and MRC-5 p53 −/− cells at 24 h posttreatment, the percentages of apoptotic, necroptotic, and necrotic cells were determined using FACS analysis of Annexin V/PI double staining. The cells negative for both PI and Annexin V staining are viable cells (in the lower left quadrant, Q3), the PI-negative Annexin V-positive staining cells are apoptotic cells (in the lower right quadrant, Q4), the PI-positive Annexin V-positive staining cells are primarily necroptotic cells (in the upper right quadrant, Q2), and the PI-positive Annexin V-negative staining cells are necrotic cells (in the upper left quadrant, Q1). The higher percentages of necroptotic cells were detected in each BaP-treated group in all three cell lines (Figure 2(a) for MRC-5 cells, Figure 2(b) for H1299 cells, and Figure 2(c) for MRC-5 p53 −/− cells). As compared with the corresponding control groups, no increase in the percentages of apoptotic cells was observed (p > 0.05, Figure 2(d)), but increases in the percentages of necroptotic cells was found in each BaP-treated group in all three cell lines (p < 0.01, Figure 2(e)). The results indicated that the main form of cell death was necroptosis in all three cell lines treated with BaP.

MRC-5, H1299, and MRC-5 p53 −/− cells were treated with BaP at the indicated concentrations indicated for 24 h. Cell death mode was analyzed using a dual-parameter flow cytometry utilizing Annexin V–FITC and PI. (a) Representative dot plot of MRC-5 cells from three independent experiments. (b) Representative dot plot of H1299 cells from three independent experiments. (c) Representative dot plot of MRC-5 p53 −/− cells from three independent experiments. The percentages of apoptotic (d) and necroptotic (e) cells were pooled and averaged values are shown graphically. Data are expressed as mean ± SD of three independent experiments. *p < 0.05, # p < 0.01, compared with solvent control group. p53: protein 53 or tumor protein 53; MRC-5: human fetal lung fibroblast cell line; H1299: human non-small-cell lung carcinoma cell lines; MRC-5 p53−/− : p53-knockdown cell lines. BaP: benzo(a)pyrene; PI: propidium iodide; FITC: fluorescein isothiocyanate.
Comet assays
The extent of BaP-induced DNA damage was determined using comet assay. As shown in Figure 3, in the three cell lines, the average Olive TM values were significantly increased in all BaP-treated cells compared with the control cells (p < 0.05 for all). The peak values of the mean Olive TM were 14.70 in 64 μM BaP-treated MRC-5 cells, 3.79 in 64 μM BaP-treated H1299 cells, and 6.90 in 32 μM BaP-treated MRC-5 p53 −/− cells, respectively. A concentration-dependent DNA damage response was observed in BaP-treated H1299 cells. DNA damage in MRC-5 cells seems to be stronger than H1299 and MRC-5p53−/− cells.

MRC-5, H1299, and MRC-5 p53 −/− cells were treated with BaP at the indicated concentrations for 24 h. The effect of BaP treatment on DNA migration (Olive TM) was examined using comet assay. Data are expressed as mean ± SD of three independent experiments. *p < 0.05, # p < 0.01, compared with solvent control group. p53: protein 53 or tumor protein 53; MRC-5: human fetal lung fibroblast cell line; H1299: human non-small-cell lung carcinoma cell lines; MRC-5 p53−/− : p53-knockdown cell lines; BaP: benzo(a)pyrene; PI: propidium iodide.TM: tail moment.
Transcriptional expression of the apoptosis-related genes
To determine the changes in expression of BAX, BCL-2, and cleaved caspase-3 transcriptional levels, expression of Bax, Bcl-2, and caspase-3 at mRNA level were examined using qRT-PCR. As shown in Figure 4, at 24 h after treatment BaP upregulated the transcriptional levels of Bax, Bcl-2, and caspase-3 genes in the MRC-5 (Figure 4(a)), H1299 (Figure 4(b)), and MRC-5 p53−/− (Figure 4(c)) cells, no significances in the increased transcriptional levels were found in the three cell lines compared with the corresponding control groups (p > 0.05), although the transcription levels of these genes increased from 0.17- to 1.32-fold relative to β-actin gene. The results indicated that in response to BaP-induced DNA damage, the inductions of BAX, BCL-2, and cleaved caspase-3 occurred at the posttranslational level in these cell lines.

MRC-5, H1299, and MRC-5
p53
−/− cells were treated with BaP at the indicated concentrations for 24 h. (a) The effect of of BaP on gene mRNA expression in MRC-5 cells, (b) H1299 cells, and (c) MRC-5
p53
−/− cells were examined using qRT-PCR. Relative changes in gene expression were calculated by the
Expression of the apoptosis-related proteins
To determine whether mitochondria-dependent signaling pathways involve in BaP-induced necroptotic cell death, mitochondria-associated proteins including p53, BAX, BCL-2, and cleaved caspase-3 were measured. As shown in Figures 5(a), 6(a), and 7(a), at 24 h after BaP-treated MRC-5, H1299, and MRC-5 p53 −/− cells, the induction of p53 protein was detected only in 64 μM BaP-treated MRC-5 cells. Similar results were obtained for the expression of BAX, BCL-2, and cleaved caspase-3 proteins in all three cell lines: BAX, BCL-2, and cleaved caspase-3 proteins were significantly upregulated in all BaP-treated groups compared with the control groups (Figures 5(b), 6(b), and 7(b); p < 0.05), and the increased ratios of BAX/BCL-2 were found in all BaP-treated groups (Figures 5(b), 6(c), and 7(c); p < 0.01), indicating that BaP-induced DNA damage could affect mitochondria functions in all three cell lines.

MRC-5 cells were treated with BaP at the indicated concentrations for 24 h. (a) Effects of BaP on the protein levels of p53, BAX, BCL-2, and cleaved caspase-3 were examined by Western blotting analysis using the corresponding antibodies. (b) Bands corresponding to the proteins were standardized by GAPDH, and densitometry data of three independent experiments were presented. (c) The ratios of BAX/BCL-2 were calculated. Data are expressed as mean ± SD of three independent experiments. *p < 0.05, # p < 0.01, compared with solvent control group. BaP: benzo(a)pyrene; GADPH: glyceraldehydes 3-phosphate dehydrogenase; p53: protein 53 or tumor protein 53; BCL-2: B-cell leukemia/lymphoma 2; BAX: BCL2-associated X protein.
Discussion
Few studies reported BaP induced cell death via the activation of p53-dependent and/or p53-independent pathways as well. 23 –25 In the present study, BaP reduced cell viability in all treatment groups of MRC-5, H1299, and MRC-5 p53 −/− cells at 24 h post-treatment. The observations were further confirmed by flow cytometry analysis, indicating BaP-induced necroptosis in each treatment group in all three cell lines.
Evidence indicated that cells have evolved DNA damage response (DDR) cascades. 5 Balance between DNA damage and repair affects cell fate. It is well known that DDR shelters the occurrence of cell cycle arrest through activating DNA damage sensors, transducers, mediators, and effectors, which drives cells execute DNA repair processes. 37,38 If DNA repair process was efficient, whereafter the resumption of normal cell functions were triggered. On the contrary, if repairing damaged DNA process did not trigger, chronic DDR signaling pathways were evoked, thereby led to the patterns of any type of cell death, including apoptosis, necroptosis, and mitotic catastrophe. 39,40 Nevertheless, p53 plays pivotal roles in DNA damage and repair processes. 41 In the present study, dose-dependent effects of DNA damage were obvious in all three cell lines treated with BaP (8–64 μM) for 24 h, but BaP-induced expression of p53 protein was seen only in 64 μM BaP-treated group of the p53 proficient MRC-5 cells. The results shown above indicated that DNA damage induced by BaP contributed to the necroptotic cell death, which is regardless of p53 status under the experimental conditions. A study reported that in mouse embryonic fibroblasts, p53 was required to the induction of necroptosis in response to etoposide-induced DNA damage. 16 These results implied that igniting and executing process of necroptosis depends on the cell types and certain types of stress.
BAX and BCL-2 have pro- or anti-apoptotic activities, respectively. They regulated mitochondrial apoptosis or/and necroptosis pathways through controlling the permeabilization of the outer mitochondrial membrane, 24,27 while p53 plays pivotal roles in connecting DDR to mitochondria-dependent apoptosis by modulating BAX and BCL-2 at the transcriptional level. 42 Besides p53, cytosolic interactions of other proteins with BAX and BCL-2 at the protein level were observed, for instance, the pro-apoptotic function of BAX can be abolished by protein kinase PI3K/Akt through phosphorylation at serine 184, and interestingly, PP2A, a phosphatase can directly dephosphorylate BAX, after the dephosphorylation, heterodimer complex of BAX/BCL-2 can be disrupted and BAX can be liberated to execute its pro-apoptotic functions; in addition, this phosphorylation and dephosphorylation reside in BCL-2 proteins in the cytosol, but the detailed mechanisms were unknown. 43 –46 In the present study, at 24 h after treatment, BaP (8–64 μM) upregulated expression BAX and BCL-2 proteins in all three cell lines, but not at mRNA level, indicating that the effects of BaP on BAX and BCL-2 were at the posttranslational level (Figures 5 to 7). The increased ratios of BAX/BCL-2 in all three cell lines suggested that, in addition to the p53-medated pathway, the other upstream signaling pathways may be responsible for the activations of BAX and BCL-2 at a posttranslational level in the experimental models. Gomez-Lazaro et al. also found that p53 was not essential for BAX-dependent cell death in response to 6-hydroxydopamine-induced DNA damage. 47 These results combined with previous studies indicated that the regulatory mechanisms of p53-dependent and p53-independent could contribute to the simultaneous activations of BAX/BCL-2, which may be associated with cell-type specificity and DNA damage extent or type specificity in vitro.

H1299 cells were treated with BaP at the indicated concentrations for 24 h.(a) Effects of BaP on the protein levels of p53, BAX, BCL-2, and cleaved caspase-3 were examined using Western blotting analysis using the corresponding antibodies. (b) Bands corresponding to the proteins were standardized by GAPDH, and densitometry data of three independent experiments were presented. (c) The ratios of BAX/BCL-2 were calculated. Data are expressed as mean ± SD of three independent experiments. *p < 0.05, # p < 0.01, compared with solvent control group. GADPH: glyceraldehyde 3-phosphate dehydrogenase; p53: protein 53 or tumor protein 53; H1299: human non-small-cell lung carcinoma cell lines; BaP: benzo(a)pyrene; BCL-2: B-cell leukemia/lymphoma 2; BAX: BCL2-associated X protein.

MRC-5 p53− /− cells were treated with BaP at the indicated concentrations for 24 h. (a) Effects of BaP on the protein levels of p53, BAX, BCL-2, and cleaved caspase-3 were examined by Western blotting analysis using the corresponding antibodies. (b) Bands corresponding to the proteins were standardized by GAPDH, and densitometry data of three independent experiments were presented. (c) The ratios of BAX/BCL-2 were calculated. Data are expressed as mean ± SD of three independent experiments. *p < 0.05, # p < 0.01, compared with solvent control group. p53: protein 53 or tumor protein 53; MRC-5: human fetal lung fibroblast cell line; GADPH: glyceraldehyde 3-phosphate dehydrogenase; BaP: benzo(a)pyrene; BCL-2: B-cell leukemia/lymphoma 2; BAX: BCL2-associated X protein.
Among the caspases, caspase-3 stands out because it is the main executioner of apoptosis and is activated in both intrinsic and extrinsic pathways of apoptosis. The cleavage of caspase-3 is a typical hallmark of apoptosis. 48 Its substrates were the proteins involved in maintenance of proper cellular function and DNA repair. 49,50 Multiple lines of evidence suggest that execution of necroptosis is a caspase-independent cell death, 51 –53 while in the three cell lines, expression of cleaved caspase-3 protein was upregulated, rather than mRNA levels in all BaP-treated groups, indicating that caspase-3 activation is not absolutely necessary for the execution of necroptosis.
In conclusion, our results revealed that in MRC-5, H1299, and MRC-5 p53−/− cells, BaP resulted in the accumulation of unrepairable DNA damage and upregulated the Bax to Bcl-2 ratio and activation of caspase-3, thus evoked the necroptosis through the mitochondria-mediated pathway. But this mechanism was largely independent of p53 modifications. Further studies need to be conducted to characterize p53-independent signaling pathways and identify the roles of necroptotic effectors (such as Fas and tumor necrosis factor) in response to BaP-induced necroptosis.
Footnotes
Authors’ Note
The authors YJ and XC contributed equally to this work.
Conflict of interest
The authors declared no conflicts of interest.
Funding
This work was supported by funding from the National Natural Science Foundation of China (NNSFC, grant no. 30671735) and the National Basic Research Program of China (grant no. 2011CB512102).