
Abstract
Photodynamic therapy (PDT) is a novel cancer treatment based on the tumor-specific accumulation of a photosensitizer followed by irradiation with visible light, which induces selective tumor cell death via production of reactive oxygen species. To elucidate the underlying mechanisms, microarray analysis was used to analyze the changes in gene expression patterns during PDT induced by various photosensitizers. Cancer cells were subjected to four different photosensitizer-mediated PDT and the resulting gene expression profiles were compared. We identified many differentially expressed genes reported previously as well as new genes for which the functionfunctions in PDT are still unclear. Our current results not only advance the general understanding of PDT but also suggest that distinct molecular mechanisms are involved in different photosensitizer-mediated PDT. Elucidating the signaling mechanisms in PDT will provide information to modulate the antitumor effectiveness of PDT using various photosensitizers.
Introduction
Photodynamic therapy (PDT) is a novel medical procedure that holds considerable promise for the treatment of a variety of tumors. 1 PDT is based on the light activation of photosensitizers that are selectively retained by proliferating tissues such as tumor cells in forming a concentration gradient against normal adjacent tissues. 2 Photosensitizers when activated by light can produce reactive oxygen species (ROS) including singlet oxygen, superoxide anion, and hydroxyl radical. ROS can subsequently induce phototoxicity reaction in cancer cells. Following the onset of phototoxicity, the downstream cellular responses include inflammatory reaction, vascular damage, the formation of cytotoxic products, and, ultimately, apoptosis. 3
Most photosensitizers are fluorescent so their subcellular localization after entering the cell can be determined using fluorescence microscopy. 4 The intracellular localization of these photosensitizers has been reported previously 5,6 (Table 1). Photosensitizers are taken up into cells by different pathways according to their individual molecular structure, charge, and solubility (Table 1). 5-Aminolevulinic acid (5-ALA)-induced endogenous photosensitization is a novel approach to both PDT and tumor detection that utilizes the heme biosynthetic pathway to produce endogenous porphyrins, particularly protoporphyrin IX, an effective photosensitizer. Excess exogenous 5-ALA can produce porphyrins that, when photoactivated, generate the photosensitizing effect for PDT. 7 Porphyrins are first formed in the mitochondria and then rapidly diffuse to other intracellular membrane sites. Foscan is a promising second-generation photosensitizer. It appears to be among the most effective photosensitizers in PDT, requiring only very low drug doses (as little as 0.1 mg/kg) and light doses (as low as10 J/cm2) for satisfactory efficacy. 3 Previous publications reported that Foscan mainly localizes in the endoplasmic reticulum and mitochondria of human colon adenocarcinoma HT29 cells, 8 while preferentially confines to the mitochondria and the perinuclear region of murine myeloid leukemia cells. 9 Meso-tetraphenylporphyrin disulfonate (TPPS2a) differs only in side groups on the phenyl rings from the lipophilic photofrin, a widely used photosensitizer. TPPS2a is taken up initially into lysosomes via endocytosis 5 and induces apoptosis. 10 Disulfonated aluminium phthalocyanine (AlPcS2a) is localized in vesicles suggestive of lysosomes, 11 exhibiting additional advantages of being easily synthesized, inexpensive, commercially available, and composed of a single molecular species.
Structures and subcellular localization of photosensitizers.
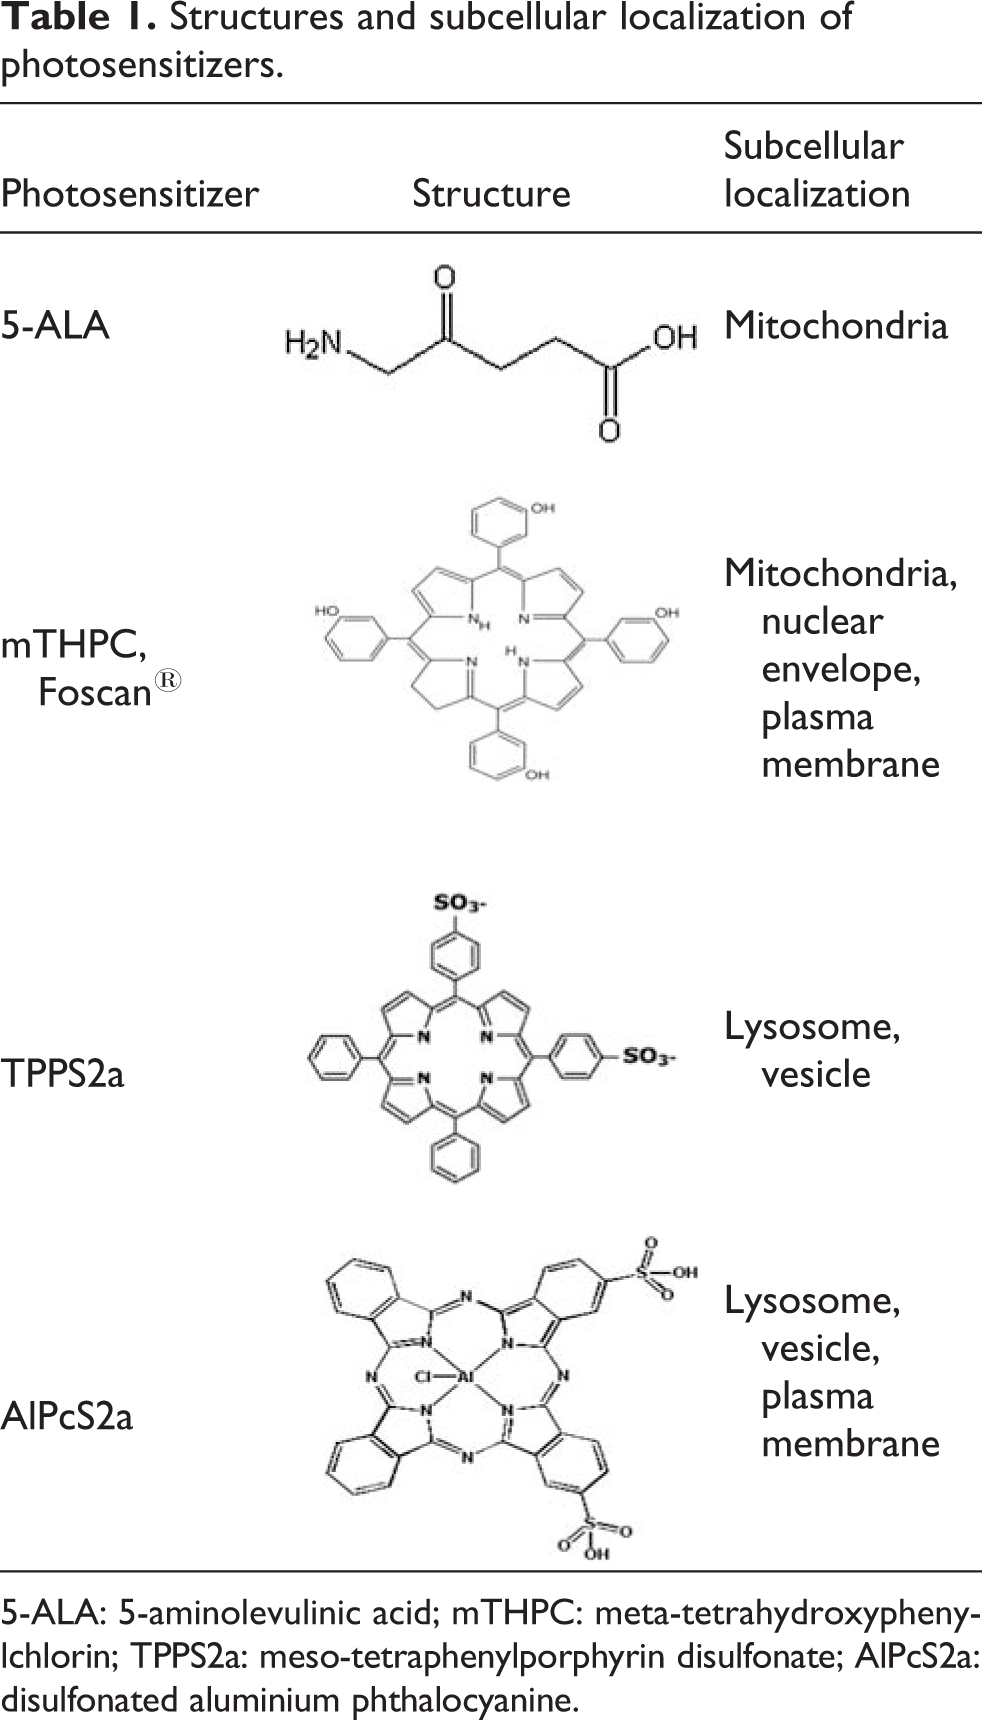
5-ALA: 5-aminolevulinic acid; mTHPC: meta-tetrahydroxypheny-lchlorin; TPPS2a: meso-tetraphenylporphyrin disulfonate; AlPcS2a: disulfonated aluminium phthalocyanine.
Due to the differences in subcellular localization and the molecular mechanisms involved, the efficacy of photosynthesizers varies greatly with drug doses and light doses (Table 2). Differences in cell types, photosensitizers used, and incubation and illumination conditions can all significantly alter the outcome of PDT. For example, as mentioned above, Foscan is the most effective sensitizer in PDT studied so far. In vitro, Foscan is about 20-fold more effective in terms of drug dose than porphyrin derivatives in the treatment of HT29 colon adenocarcinoma cells, possibly because of the difference in drug uptake pathways as well as the presence of other inactive component/components in porphyrin derivatives. 12 Thus, no consistent model has emerged on the action of PDT-inducing photosynthesizers in view of the very fragmented data from previous independent studies. In this study, we attempted to elucidate a consistent molecular model of PDT using an identical cell line to study the gene expression profiles of the four above-mentioned PDT-inducing photosynthesizers.
Drug treatment and photoirradiation of photosensitizers.a
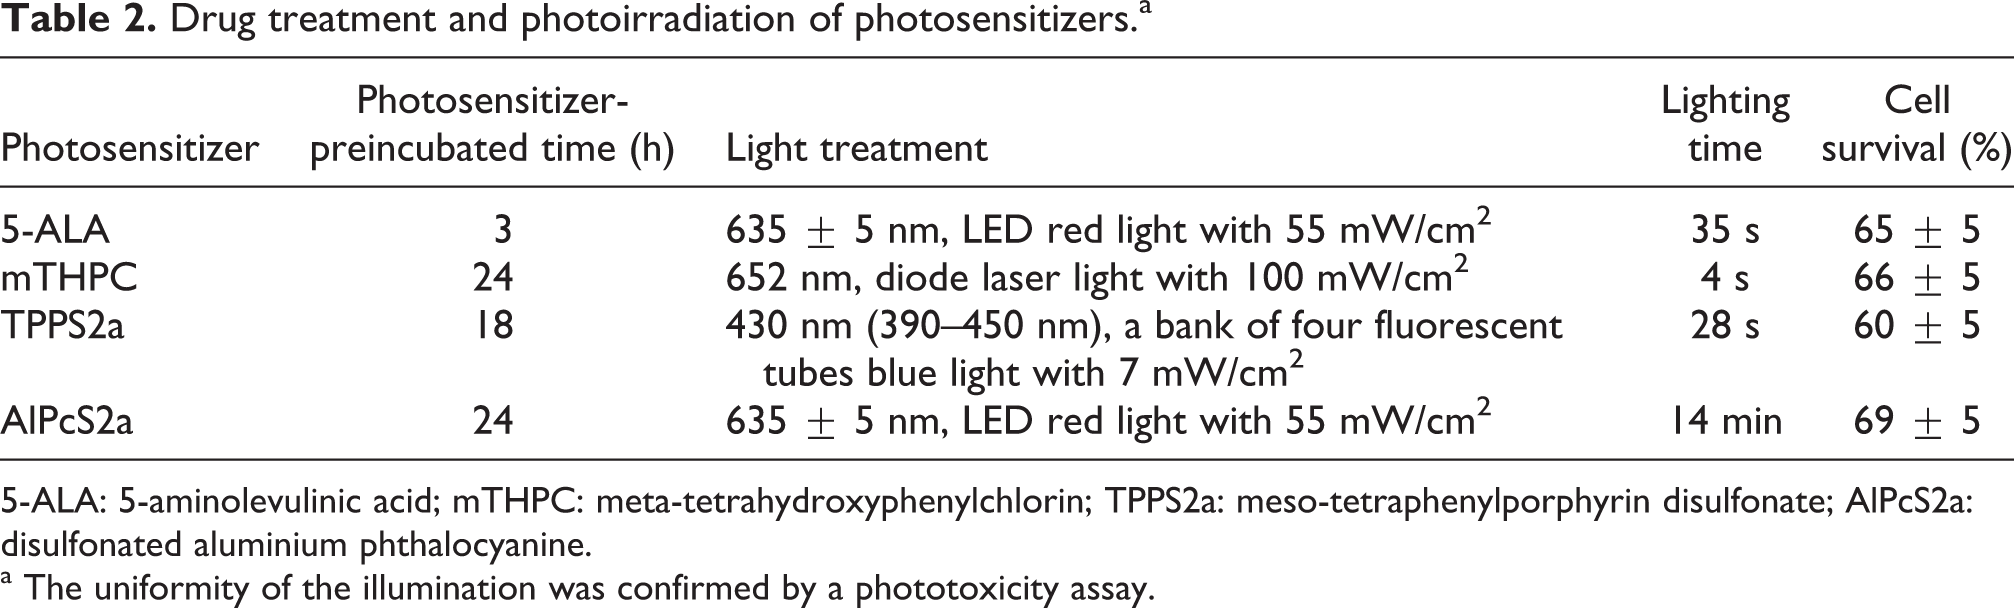
5-ALA: 5-aminolevulinic acid; mTHPC: meta-tetrahydroxyphenylchlorin; TPPS2a: meso-tetraphenylporphyrin disulfonate; AlPcS2a: disulfonated aluminium phthalocyanine.
a The uniformity of the illumination was confirmed by a phototoxicity assay.
Due to its capacity to affect a wide range of downstream cellular events, PDT appears to stimulate many different signaling pathways that may have either agnostic or antagonistic effects. For the apoptotic process, it has been shown that some of the pathways that contribute to the demise process are activated as well as others that antagonize cell death, so the ultimate survival of a given cell is determined by the combined action and/or interaction of these different pathways. 13,14 To better understand, in a global view, the molecular mechanism/mechanisms involved in the response of tumor cells to PDT, microarray analysis was used to help identify genes that may contribute to the PDT response. Oligonucleotides-based microarrays have been shown to be a rapid and effective experimental instrument to monitor differential gene expressions. 15 Over the last decade, array technologies have developed high-throughput means to identify molecular targets associated with biological and clinical phenotypes by comparing samples representative of distinct pathophysiological states. Gene expression profiling provided by microarray has been employed to define, at the molecular level, the clinical and histopathological phenotypes of given tumors. 16 Expression profiling and pattern identification using various available microarray platforms are becoming novel tools for functional classification of genes and pathway discovery. 16
To elucidate the signal transduction pathways in different photosensitizer-mediated PDT, we analyzed differential gene expression between untreated cultured Ca9-22 human gingival carcinoma cells and PDT-treated Ca9-22 cells with the use of oligonucleotides-based microarray technology. In this study, we focused on the similarities and differences in gene expression patterns generated after the treatment of four different photosensitizers and the changes in expression of the selected genes in time courses. To our knowledge, this study is the first report in conducting a large-scale survey of the variations in gene expression patterns in different photosensitizer-mediated PDT-treated cancer cells with a time course.
Materials and methods
Cell culture
Human gingival cancer (oral squamous cell carcinoma) cell line Ca9-22 was obtained from Japanese Collection of Research Bioresources cell bank. Stock culture of Ca9-22 cells was grown in Dulbecco’s modified Eagle’s medium (DMEM) supplemented with 2 mM
Photodynamic treatment
The PDT groups of cells were preincubated for 3 h with 1 mM of 5-ALA (Sigma, St. Louis, MO, USA), 18 h with 0.2 μg/ml of TPPS2a(PCI Biotech, Lysaker, Norway), 24 h with 20 μg/ml of AlPcS2a (Industrial Technology Research Institute, Chutung, Hsinchu, Taiwan), or 24 h with 0.2 μg/ml of meta-tetrahydroxyphenylchlorin (mTHPC, Foscan®; Biolitec Pharmaceuticals Ltd, Dublin, Ireland) in a culture medium containing 10% FCS (except for the 5-ALA group) in strictly subdued light conditions (1 μW/cm2), respectively (Table 2). The cells were then irradiated separately in photosensitizer-free and phenol red-free medium. The light sources and treatment parameters are summarized in Table 2. After PDT treatment, the culture media was refreshed with complete media, and the cells were harvested after 30 min, 3 h, and 24 h for RNA extraction. The survival rates of the cells were about 65
Assessment of photosensitizer-induced cytotoxicity on Ca9-22 Cells
Ca9-22 cells were grown on 96-well plates at a density of 6000 cells/well overnight. The culture medium was removed and replaced with phenol red-free DMEM medium (150 μl/well) containing specific concentrations of photosensitizers as described above. The cells were incubated for a specific period with different photosensitizers with strictly subdued light conditions and then irradiated as mentioned above (Table 2). After light irradiation, the medium was replaced with DMEM containing 10% FCS. After 24 h, cell survival was measured using 3(4,5-dimethyl-thiazoyl-2-yl) 2,5 diphenyl-tetrazolium bromide assay. Each individual phototoxic experiment was repeated three times.
RNA extraction
Total cellular RNA was isolated from untreated and PDT-treated Ca9-22 cells using the RNeasy mini kit (Qiagen, Venlo, Netherlands), according to manufacturer’s instructions. The purity and integrity of RNA were assayed using GeneQuant™ pro RNA/DNA Calculator (Amersham Pharmacia Biotech, Amersham, UK) and Agilent 2100 Bioanalyzer (Agilent, Santa Clara, California, USA). The absorbance ratio, A260/280, of 1.7–2.1 indicates that the quality of RNA is adequate to be applied in the array experiments.
Microarray procedures
Total RNA of 2.5 μg from cells per time point and three controls from each of the four drug-treated samples were used in the microarray experiments. RNA samples were labeled using the Agilent’s Low RNA Input Fluorescent Linear Amplification kit (Agilent). Amplified RNA of 10 μg was used for each duplicate. Hybridization was carried out on Phalanx Human OneArray™ (HOA) microarray (version 1.0; Phalanx Biotech; http://www.phalanx.com.tw) at 50°C overnight. Following hybridization, the slides were washed for 15 min with 2× saline sodium citrate (SSC), 0.2% sodium dodecyl sulfate (SDS) at 42°C, 15 min at 42°C with 2× SSC, and 15 min at room temperature with 0.2× SSC consecutively. Duplicate chips were used for each RNA sample. Each array was scanned using the GenePix® 4000B microarray scanner (Axon Instruments Inc., Union City, California, USA) and analysis was carried out using GeneSpring software (Agilent, Santa Clara, California, USA).
Statistical analysis
Data are presented as mean ± SE. Levels of significance were calculated using analysis of variance (ANOVA) followed by Bonferroni’s test for multiple comparisons. A p value of <0.005 was considered significant.
Real-timePCR evaluation
Reverse transcription (RT) was carried out using the SuperScript First-Strand Synthesis System (Invitrogen, Carlsbad, CA, USA) for RT-PCR following the manufacturer’s protocol. The real-time PCR was performed according to the suggested protocol. The reaction was carried out using complementary DNA (cDNA) equivalent to 1 ng of cDNA (4 ng for 5-ALA–PDT group), 300 nM each of forward and reverse primers, SYBR Green PCR master mix and RT-PCR (Applied Biosystems Inc., Foster City, California, USA) according to the manufacturer’s protocol in the ABI Prism 7000 Sequence Detection System (Applied Biosystems Inc.). The reactions were performed at 50°C for 2 min and 95°C for 10 min followed by 45 cycles of denaturation at 95°C for 15 s, annealing at 60°C for 30 s, extension at 72°C for 30 s, and 1 cycle of extension at 72°C for 10 min. The comparative threshold cycle (C T) method was used to analyze relative changes in gene expression.
Results
Variations in differential gene expression profiles associated with different photosensitizer-mediated PDT and temporal variations in the gene expression patterns of PDT-treated cells
To conduct a systematic characterization of gene expression in PDT, we adopted microarrays to systematically identify genes with altered expression in PDT-treated cells by comparing patterns of mRNA expression from untreated control cells and PDT-treated cells. We performed PDT using four different photosensitizers and Phalanx HOA version 1 microarrays (over 20,000 human probes at the size of 60-mer per chip, one probe per transcript) were used to conduct a large-scale analysis of gene expression. Our study here yielded hundreds of differentially expressed genes that provided a vast amount of nformation at the molecular level. At 30 min, 3 h, or 24 h after PDT treatment, genes with at least 2.0- fold change in expression level compared with the mean from control groups were identified using ANOVA. Genes with significantly altered expression in each photosensitizer-mediated PDT were found according to the signal strength screening criteria established. Our study was validated by the identification of genes that had been reported previously as been involved in PDT.
Putative photosensitizer-specific PDT pathways
From hundreds of genes with significantly altered expression in each photosensitizer-mediated PDT, we showed that although PDT-induced significant changes in the expression level of many genes, there were only three genes that had significant changes in all photosensitizer-PDTs included in this study. Figure 1 shows the temporal expression patterns of these three common genes. Matrix metalloproteinase 10 (MMP10) is known to degrade various components of the extracellular matrix. Ras homolog enriched in brain like 1 (RHEBL1) was presumed to participate in cell communication based on GoMiner molecular function annotation, but the role of RHEBL1 in PDT is still unknown. In addition, our data suggest that low-density lipoprotein receptor (LDLR) may play a general role in PDT sensitivity. These genes will give clues to general pathways and mechanisms that are involved in PDT.
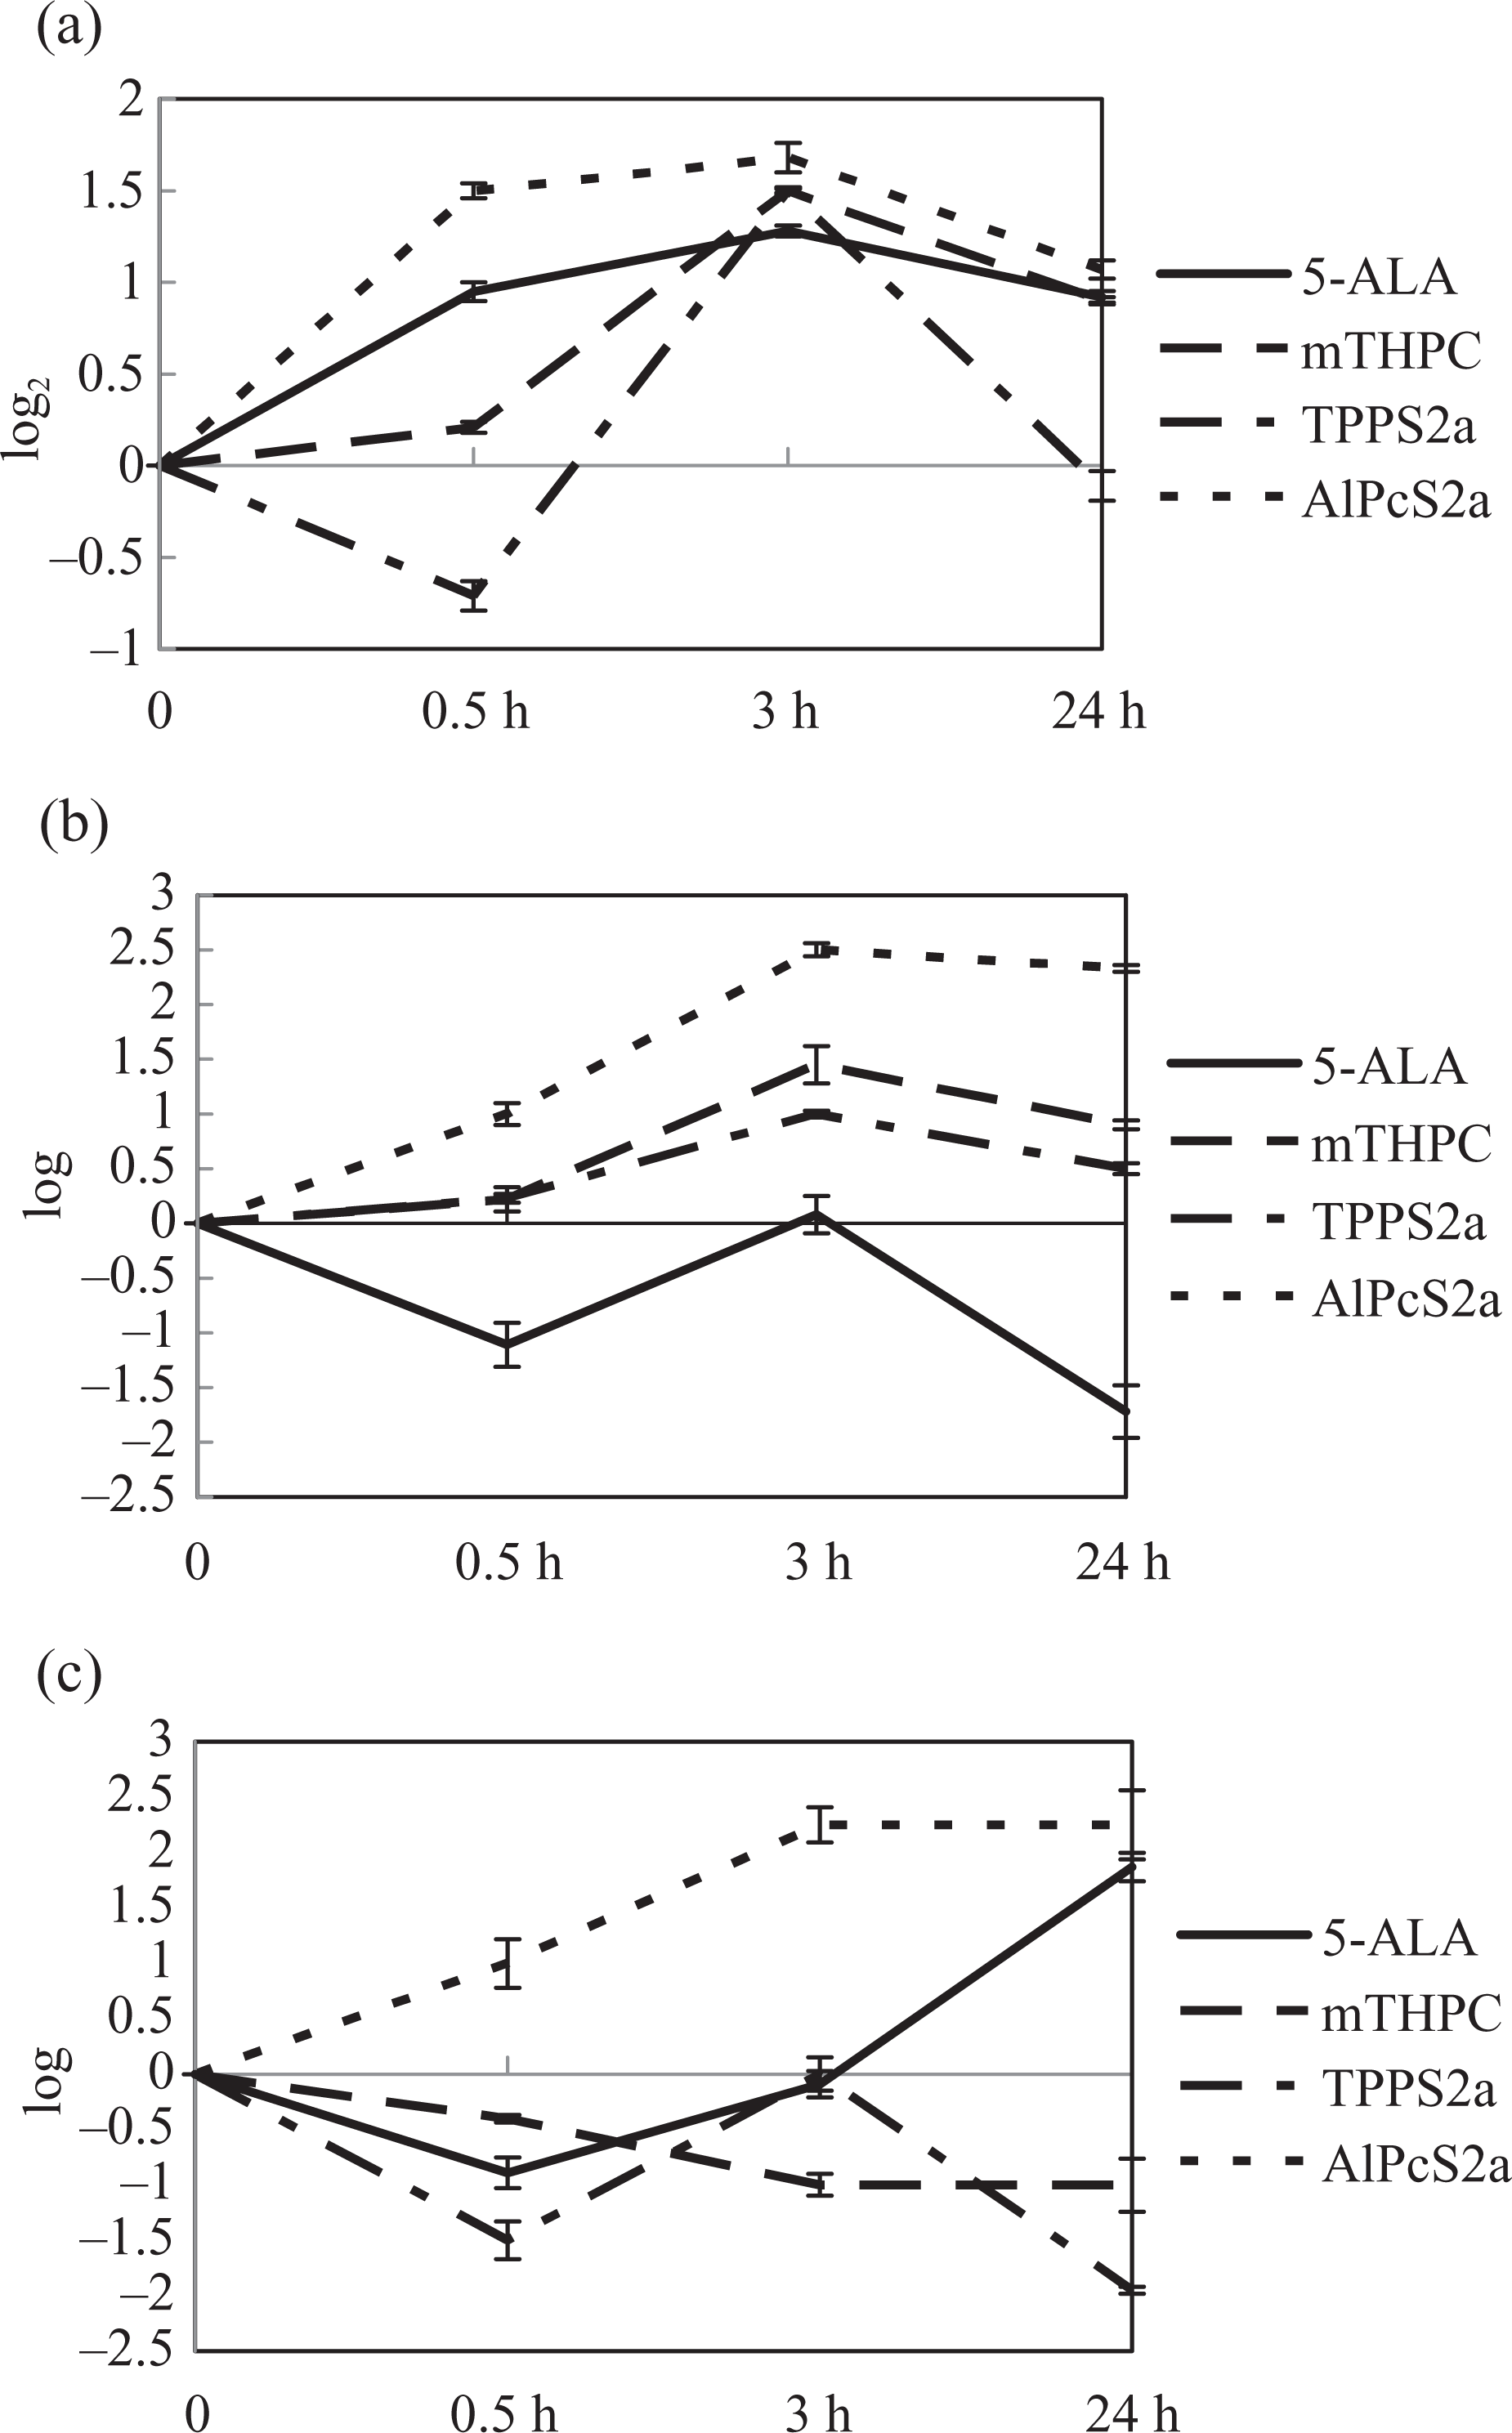
The expression patterns of genes changed significantly in four photosensitizer-mediated PDT treatments. (a) LDLR, (b) MMP10, and (c) RHEBL1. Data are presented as mean ± SD of three determinations (each in triplicate). PDT: photodynamic therapy; LDLR: low-density lipoprotein receptor; MMP10: Matrix metalloproteinase 10; RHEBL1: Ras homolog enriched in brain like 1.
As an initial study, we also looked for an optimal set of differentially expressed genes between untreated and PDT-treated Ca9-22 cells in each case and assessed the variability in gene expression profiles. According to previous studies, photosensitizers when activated by light can produce ROS including singlet oxygen, superoxide anion, and hydroxyl radical. ROS can subsequently induce phototoxicity reaction in cancer cells. Following the onset of phototoxicity, the downstream cellular responses include inflammatory reaction, vascular damage, the formation of cytotoxic products, and, ultimately, apoptosis. 3 We presumed that a specific set of genes would be affected in each photosensitizer-mediated PDT treatment (Figure 2).

Gene expressed differentially at different time points after PDT treatment. The blue and orange colors indicate relative extent of gene overexpression and basal-level expression, respectively, with darker colors indicating larger differences. (a) 5-ALA, (b) mTHPC, (c) TPPS2a, and (d) AlPcS2a, one of the duplicate experiment results is shown. PDT: photodynamic therapy; 5-ALA: 5-aminolevulinic acid; TPPS2a: meso-tetraphenylporphyrin disulfonate; AlPcS2a: disulfonated aluminium phthalocyanine.
Target validation using Q-PCR
Because some particular genes may play more significant roles in specific photosensitizer-mediated PDT than others, a selected group of genes were confirmed using quantitative PCR (Q-PCR; Figure 3) in each case. In 5-ALA-PDT group, dual-specificity phosphatase 6 (DUSP6), FOS, FBJ murine osteosarcoma viral oncogene homolog B (FOSB), interleukin 8 (IL8), and prostate differentiation factor (PLAB) genes were selected. In mTHPC-PDT group, ephrin-B2 (EFNB2) IL8, retinoic acid induced 3 (RAI3), and SERPINB2 genes were selected. In TPPS2a-PDT group, prostaglandin-endoperoxide synthase 2 (PTGS2) was selected. In AlPcS2a-PDT group, we selected apoptotic protease activating factor 1 (APAF1) and caspase 4 (CASP4). The results of Q-PCR are similar in the trends of changes in gene expression to the data obtained from microarray.
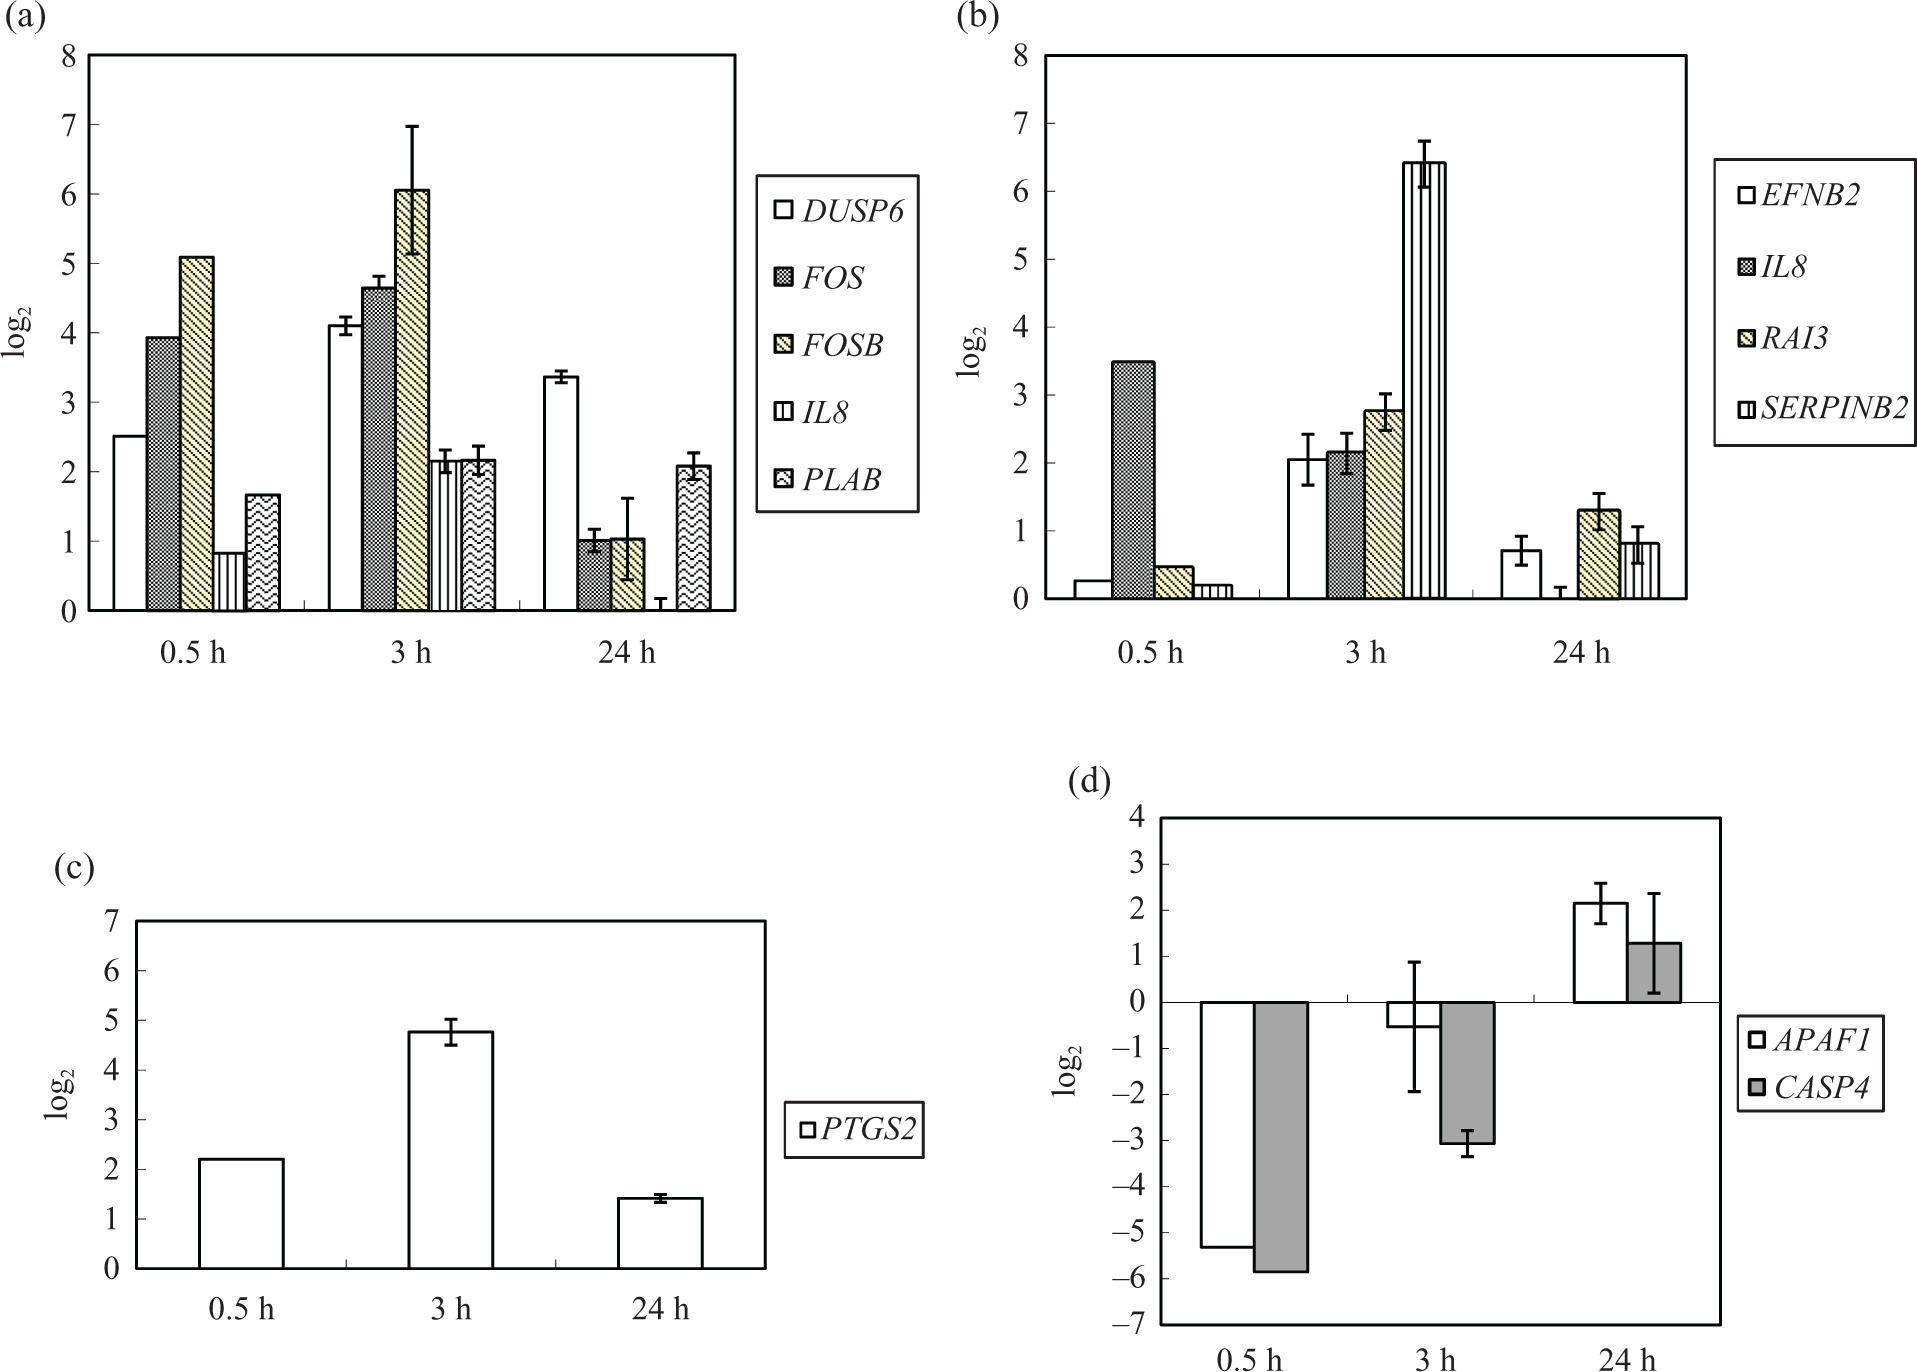
Real-time PCR analysis of photosensitizer-PDT. (a) 5-ALA, (b) mTHPC, (c) TPPS2a, and (d) AlPcS2a. Values are means ± SD of three replicates. PCR: polymerase chain reaction; PDT: photodynamic therapy; 5-ALA: 5-aminolevulinic acid; TPPS2a: meso-tetraphenylporphyrin disulfonate; AlPcS2a: disulfonated aluminium phthalocyanine; mTHPC: meta-tetrahydroxyphenylchlorin.
Discussion
PDT is a novel cancer treatment based on the tumor-specific accumulation of a photosensitizer followed by irradiation with visible light, which induces selective tumor cell death via production of ROS. Thus, there was no consistent model to analyze the molecular mechanisms of PDT-inducing photosynthesizers. To elucidate the underlying mechanisms, we employed microarray analysis to analyze the changes in gene expression patterns during PDT induced by various photosensitizers. It is known that PDT acts through at least three principal mechanisms: (1) direct cell killing by lethal oxidative damage to tumor cells, (2) indirect cell killing due to photodynamic damage to, or shutdown of the vasculature with loss of oxygen and nutrients to the tumor, and (3) additional antitumor contributions from the inflammatory and immune responses of the host. 3 Cell death in PDT may occur due to apoptosis or necrosis, depending on the photosensitizer, the PDT dose, and the cell genotype. 17 Understanding the molecular events that contribute to PDT-induced apoptosis or necrosis, and how cancer cells can evade programmed cell death, enables a more rational approach. In our case, we found many genes that were previously shown to participate in apoptosis induced by PDT via an acute stress response involving mitochondrial damage, cytochrome c release, and formation of an apotosome involving caspase (e.g. serine (or cysteine) proteinase inhibitor, clade B, member 2 (SERPINB2), CASP4, caspase 6 (CASP6), and APAF1). Some genes may antagonize cell death and exhibited alterations in mRNA levels after treatment (e.g. serum and glucocorticoid inducible protein kinase (SGK)). A subset of the genes found, such as inflammation-related genes like FOS, has also been reported previously in other independent studies of PDT. 18
Our study showed that PDT induced significant changes in the mRNA expression level of many genes, but there were three genes that had significant changes in all photosensitizer-PDTs included in this study. The genes MMP10, RHEBL1, and LDLR will give clues to general pathways and mechanisms that are involved in PDT. In previous studies, overexpression of MMP10 was shown to promote tumor development. 19 The increase in MMP10 mRNA level observed after PDTs may be a cellular self-defense response to resist the PDT damage. In addition, our data suggest that LDLR may play a general role in PDT sensitivity, probably by modulating photosensitizer uptake and/or subcellular localization. 20 Further analysis is necessary to confirm the function of these genes in different photosensitizer-mediated PDT. Since our data showed consistent changes in gene expression of these three genes in all four photosensitizer-mediated PDT treatments, we infer that these genes may be involved in common signal pathways in photosensitizer-mediated PDT. To our knowledge, no such potential common pathways in PDT have been identified previously.
Since the intracellular localizations are unique for 5-ALA, TPPS2a, AlPcS2a, and mTHPC, the potential targets for direct phototoxicity could be elucidated for each specific photosensitizer. As an initial study, we looked for an optimal set of differentially expressed genes between untreated and PDT-treated Ca9-22 cells in each case and assessed the variability in gene expression profiles. In 5-ALA-PDT group, FOS, IL8, and tumor necrosis factor-alpha-induced protein 3 (TNFAIP3) may participate in the inflammatory response induced by 5-ALA-PDT. In addition, cell cycle changes could occur in 5-ALA-PDT since FOS, FOSB, cyclin D1 (CCND1), and PLAB may be involved. In mTHPC-PDT group, the genes that participate in inflammatory responses after 5-ALA-PDT also occurred, but there are other genes that are involved in other pathways. For example, RAI3 may function as a cell growth promoter. 21 SERPINB2 is an apoptosis-related gene, while EFNB2 is a member of the pathway of oncogenesis. In TPPS2a-PDT group, the significantly changed genes that are involved in the inflammatory responses are different. In this case, interleukin enhancer binding factor 3 (ILF3), lymphotoxin beta receptor (LTBR), and PGR1 (T-cell activation protein) were identified. In addition, PTGS2, a member of the COX2 signaling pathway that processes carcinogenesis property, also showed significant expression alteration as well as tumor suppressing subtransferable candidate 4 (TSSC4) which may suppress tumor growth. In AlPcS2a-PDT group, cell death may occur by apoptosis. CASP4, CASP6, and APAF1 are the major functional genes involved in cell death process. On the other hand, mitogen-activated protein kinase kinase kinase 4 (MAP3K4) and mutL homolog 1 (MLH1) may participate in the anticarcinogenesis process.
Although microarray could provide a large-scale analysis of gene expression, microarray data are not very precise in the expression pattern of every gene involved in the microarray chip. Q-PCR analysis is necessary to confirm the changes in gene expression patterns obtained in different treatments. Our results from the Q-PCR data of the selected genes indicate that the results after PDT treatment at different time courses are similar to the trends of changes in gene expression pattern obtained using microarray data.
In summary, our data provide functional predictions of the specific gene subsets that changed significantly in four different photosensitizer-mediated PDTs. Elucidating the signaling mechanisms in PDT and finding specific genes as biomarkers in different photosensitizer-mediated PDTs may provide means to modulate the PDT effects at the molecular level and to further potentate its antitumor effectiveness. Our studies will advance the general understanding concerning photosensitizer-mediated PDT in cancer treatment.
Footnotes
Acknowledgments
We thank Dr Charles Ma for critical review of this manuscript.
Funding
This work was supported by the ITRI grant E341AE6300.