
Abstract
The increased inhaled application of titanium dioxide nanoparticles (TiO2 NPs) increases the potential pulmonary health risks. The present investigations were carried out to study the TiO2 NPs-induced apoptosis, oxidative stress and genotoxicity in the human lung cancer cell line, A549, a widely used cell system for pulmonary toxicity studies. Tetrazolium bromide salt and lactate dehydrogenase release assays were used to study the cytotoxicity. The genotoxicity studies were carried out using cytokinesis block micronucleus assay. Apoptosis was confirmed by the formation of apoptotic bodies and altered expression (messenger RNA (mRNA) and protein) of markers such as P53, P21, Bax, Bcl2 and cleaved caspase-3. Cells exposed to TiO2 NPs (10 and 50 μg/ml) for 6–24 h shows significant induction in oxidative stress, that is, the production of reactive oxygen species and malondialdehyde and decrease in the activity of catalase and glutathione. TiO2 NPs exposure also induces the formation of apoptotic bodies and micronucleus as marker of genotoxicity. A significant up-regulation in the expression of apoptosis markers such as P53, P21 and cleaved caspase-3 was observed, while the levels were down-regulated for Bcl2 at both mRNA and protein levels. TiO2 NPs exposure could not pose significant effects on Bax expression. Data indicate that nano-TiO2 induces oxidative stress, genotoxicity and apoptosis in human lung cancer cell line, A549. Our result also identifies the mechanisms involved in TiO2 NP-induced changes in A549 cells. Perhaps, reporting for the first time, the association of TiO2 NPs-induced genotoxicity and apoptosis at transcriptional and translational level in the human lung cancer cell line, A549 cells.
Introduction
Nanotization of particles may enhance adverse toxic responses upon the biological interactions. 1 Release of such nanoparticles (NPs) in the environment is known to induce damaging effect in the respiratory tract 2 and lungs. 3 Among the possible exposure routes, inhalation and dermal exposure are considered as most important for NPs. Exposure of NPs through inhalation and translocation from lung to other organs has been documented. 4,5 In general, interaction of NPs with cell membrane is known to generate reactive oxygen species (ROS) and lipid peroxidation (LPO), which subsequently leads the DNA lesion, cellular damages, apoptosis and finally cell death. 6 –10 Agglomeration/aggregation state of NPs also affects the kinetics of cellular binding/uptake and the ability to induce cytotoxic responses. 11 Physicochemical characterization is a critical factor for correlating the NPs characteristics with any measured biological/toxicological outcome. 12,13 It is demonstrated recently that the physicochemical properties (such as size, shape, surface area, phase and composition) of titanium dioxide (TiO2) and zinc oxide NPs play a crucial role in their toxicity. 14 Although these unique physiochemical properties of TiO2 NPs make them to extensively use in cosmetic products, paint industries, dusting powder, varnishes, enamels, lacquers and paper coatings, their exposure at occupation setups and consumers end is well reported. 15 TiO2 NPs were also found to induce oxidative stress and apoptosis under both in vivo 16,17 and in vitro 18,19 conditions in cells of human and animal origin. This may leads to sequential events of signal transduction that can induce the accumulation of P53, a tumor suppressor protein, which block the cellular proliferation by inducing cell cycle arrest and apoptosis in response to cellular stress such as ROS. Hussain et al. 20 investigated the molecular pathway of apoptosis induced by carbon black and TiO2 NPs in bronchial epithelial cells by biochemical estimation and immunofluorescence staining of apoptosis marker proteins. However, the altered expression (messenger RNA (mRNA) and protein level) of markers of genotoxicity and apoptosis at transcriptional (mRNA) and translational (protein) levels in cells of respiratory system, lung exposed to TiO2 NPs has not been explored so far. Thus, the present investigations were carried out to study TiO2 NPs-induced alterations in the expression (mRNA and protein) of selected markers of apoptosis and their association with oxidative stress and genotoxicity in human lung cancer cells, A549, a widely used cell line for inhalation/pulmonary toxicity studies.
Methods
Reagents and consumables
All the specified chemicals, reagents and diagnostic kits were purchased from Sigma Chemical Company Pvt. Ltd (St. Louis, Missouri, USA) unless otherwise stated.
Cell culture, particle characterization and exposure
Human lung cancer cell line, A549, used in the study was originally procured from National Centre for Cell Sciences (Pune, India) and since then it has been maintained at In Vitro Toxicology Laboratory, Indian Institute of Toxicology Research (Lucknow, India) following the standard protocol. 21 Prior to using in the experiments, cells were assessed for viability and batches showing more than 95% viability were only used in the study. TiO2 NPs (d < 25 nm, specific surface area 200–220 m2/g) without any coating were purchased from Sigma Aldrich (St. Louis, Missouri, USA, Cat no. 637254). Sterilization of the NPs were carried out by heating at 120°C for 2 h and then suspended in complete DMEM-F12 medium. 21 Stock solution of TiO2 NPs (1 mg/ml) was prepared in complete DMEM-F12 medium containing 10% serum and then sonicated intermittently for 5 min with each stretch of 1 min at 100 Hz. The experimental concentrations were prepared by diluting the stock solution in the same medium. Size distribution and zeta potential (ζ) of TiO2 were determined using dynamic light scattering and phase analysis light scattering in a Zetasizer Nano-ZS, Model ZEN3600 equipped with 4.0 mW, 633 nm laser (Malvern instruments Ltd., Worcestershire, UK). The well-adhered monolayer of cells was exposed to TiO2 NPs (1–100 μg/ml) for 6–48 h as per the demand of the experiments.
Cytotoxicity assessment
MTT assay
Percentage cell viability was assessed using the 3-(4, 5-dimethylthiazol-2-yl)-2, 5-diphenyl tetrazolium bromide (MTT) assay as described earlier. 22 Briefly, cells (1 × 10⁴) were allowed to adhere for 24 h under high humid environment in 5% CO2 at 37°C in 96-well culture plates. After the respective exposure, MTT (5 mg/ml of stock in phosphate buffered saline (PBS)) was added (10 μl/well in 100 μl of cell suspension), and plates were incubated for 4 h. At the end of incubation period, the reaction mixture was carefully taken out and 200 μl of dimethyl sulfoxide was added to each well by pippeting up and down several times until the contents were mixed well. The plates were kept on rocker shaker for 10 min at room temperature and then read at 550 nm using multiwell microplate Reader (Synergy HT, Bio-Tek, USA). Untreated sets were run under identical conditions and served as basal control. To study the effect of TiO2 NPs with color absorbance, with this assay another set with medium containing only TiO2 NPs were also run in similar condition.
Lactate dehydrogenase (LDH) release assay
LDH release is a method to measure the membrane integrity as a function of the amount of cytoplasmic LDH released from damaged cells to the medium. LDH assay was carried out using the readymade commercially available kit for in vitro cytotoxicity evaluation (LDH Assay Kit, BioVision, California, USA). In brief, following the exposure, plates were incubated as per the experimental schedule in CO2 incubator and centrifuged at 250×g for 4 min. Then supernatant of each well was transferred to a fresh flat bottom 96-well culture plate and further processed for enzymatic analysis as per the instructions given in the kit. Significant, though limited, cytotoxic doses of TiO2 NPs from these studies were used in further experimentations.
Transmission electron microscopy (TEM)
The ultra structural characterization including texture, size and internalization was done by Prof. Margareta Lantow, at Institute of Biological Sciences, University of Rostock, Germany. Monolayer of A549 cells were exposed to TiO2 NPs (1, 10 and 50 μg/ml) for 6–48 h. The cells were then fixed in 4% glutaraldehyde for minimum 10 min and processed further following the protocol of Rahman et al. 21 Following ultrathin sectioning using LKB-ultratom III (LKB Instrument, Rockville, Maryland, USA), cells were visualized with TEM (EM 902A; Zeiss, Oberkochen, Germany).
Oxidative stress studies
ROS generation
TiO2 NPs-induced ROS generation was assessed in A549 cells using 2′,7′-diclorodihydrofluorescein di-acetate (DCFH-DA, Sigma Aldrich, Missouri, USA) dye as fluorescence agent. ROS generation was studied by two methods as described earlier. 21 First was the fluoremetric analysis and second was the microscopic fluorescence imaging. For fluoremetric analysis, cells (1 × 10⁴ per well) were seeded in 96-well black bottom culture plates and allowed to adhere them for 24 h in CO2 incubator at 37°C. The medium was then aspirated and cells were exposed to TiO2 NPs (1–50 µg/ml) for 6, 12 and 24 h. On the completion of respective exposure periods, cells were incubated with DCFH-DA (10 µM) for 30 min at 37°C. The reaction mixture was then aspirated and replaced by 200 µl of PBS in each well. The plates were kept on rocker shaker for 10 min at room temperature in the dark. Fluorescence intensity was measured using multiwell microplate reader (Synergy HT, Bio-Tek, USA) on excitation wavelength at 485 nm and emission wavelength at 528 nm. Parallel set of cells (5 × 10⁴ per well of tissue culture slide flasks) were analyzed for intracellular fluorescence using upright fluorescence microscope equipped with CCD cool camera (Nikon Eclipse 80i equipped with Nikon DS-Ri1 12.7 megapixel camera). The data were expressed as percentage of the unexposed control. Hydrogen peroxide (H2O2, 500 µM) was used as a positive control 1 h prior to completion of exposure time.
Glutathione (GSH) levels
GSH) levels were assessed using commercially available kit (ApoGSH Glutathione Colorimetric Assay Kit, Catalog No#K261-100, BioVision, California, USA). In brief, the deproteinated samples were transferred to 96-well plates (50 µl/well), mixed with 150 µl freshly prepared assay cocktail and read at 405 nm using Multiwell microplate Reader at 5 min intervals up to 30 min. Standard curve was plotted using the GSH standard supplied in the kit and was used to calculate the experimental values.
LPO
Following the exposure of TiO2 NPs (1–50 µg/ml) for 6, 12 and 24 h, cells were harvested by centrifugation at 1000 r/min for 10 min and processed for the estimation of LPO using commercially available kit (Lipid Peroxidation Assay Kit, catalog no. 705002; Cayman Chemicals, USA) as per the manufacturer’s protocol.
Catalase (CAT) levels
The experimental setup for CAT activity was similar to the LPO. Activity was measured using commercially available kit for CAT activity (Catalog no. 707002; Cayman Chemicals, USA) following the protocol provided by manufacturer.
Genotoxicity studies
Cytokinesis block micronucleus assay
The micronucleus (MN) assay performed as described earlier. 21 In brief, the cells were exposed to TiO2 NPs (1–50 µg/ml) for 24 h. Medium was aspirated and cells were re-incubated for 22 h in medium supplemented with cytochalasin B (3 mg/ml, Sigma Aldrich, Missouri, USA) to accomplish the nuclear division (doubling time for A549 cell line is 22 h). Cells were processed further to prepare the slide for microscopic examination of MN induction. Ethyl methanesulfonate (6 mM; CasNo.62-50-0) was used as a positive control. Minimum of 1000 bi-nucleated cells with well-defined cytoplasm were scored for MN detection.
Apoptosis studies
Bis-benzimide staining
The number of apoptotic body formation and nuclear condensation was observed in A549 cells receiving exposure of TiO2 NPs (1–50 μg/ml) for 24 and 48 h. Hochest dye No. 33342 was used for the purpose as per the standard protocol. 23
Transcriptional changes in the apoptosis markers
The unexposed control and cells exposed to TiO2 NPs (1–50 µg/ml) for 6, 12 and 24 h were processed for total RNA isolation using Trizol reagent (Invitrogen, USA). The high capacity superscripts complementary DNA (cDNA) synthesis Kit (Applied Biosystem, USA) was used to reverse-transcribe the mRNA (2 µg) into cDNA. Random hexamer primers were used to convert total RNA into cDNA. The primer sequences used for amplification were: p53: forward 5′-gaagacccaggtccagatga-3′, reverse 5′-ctccgtcatgtgctgtgact-3; p 21 : forward 5′-ggaaggaaggctggaag-3′, reverse 5′-aaccacagtgacggtacaaa-3′; Bax: forward 5′-aaagctagcgagtgtctcaagcgc-3′, reverse 5′-cccgccacaaagatggtcacg-3′; Bcl2: forward 5′-cgacgacttctcccgccgctaccgc-3′, reverse 5′-ccgcatgctggggccgtacagttcc-3′; Caspase-3: forward 5′-tttgtttgtgtgcttctgagcc-3′; reverse 5′-attctgttgccacctttcgg-3′ and glyceraldehyde 3-phosphate dehydrogenase (GAPDH): forward 5′-catgaccacagtccatgccatcact-3′, reverse 5′-tgaggtccaccaccctgttgctgta-3′. PCR was carried out using the Bio-Rad thermal cycler machine following the thermal cycling steps: 94°C for 5 min in the first step, 94°C for 30s, 59.1°C for 30s and 72°C for 30s for 37 times in the second step and final extension at 72°C for 5 min in the third step (conditions for p53 gene). These thermal cycling conditions were similar for all the genes except for annealing temperature, which was 54.4°C for p 21 , 60.7°C for Bax, 69.2°C for Bcl2, 60°C for caspase-3 and 57°C for GAPDH. PCR products were run on 2% agarose gels. The semi-quantitative analysis for up- or down-regulation in the expression was done using Gel Documentation System (Alpha Innotech, USA) with the help of AlphaEaseTM FC StandAlone V.4.0 software.
Translational changes in apoptosis markers
Western immunoblotting was done to assess the TiO2 NPs-induced translational changes in the expression of selected markers associated with apoptosis such as P53, P 21 , Bax, BCL2 and activated cleaved caspase-3. Following exposure of TiO2 NPs (1–50 µg/ml) for 12, 24 and 48 h, cells were pelleted and lysed using CelLyticTM M Cell Lysis Reagent (Cat No# C2978, Sigma Aldrich, Missouri, USA) in the presence of protein inhibitor cocktail (Cat No# P8340-5ML, Sigma Aldrich, Missouri, USA). Protein estimation was done using BCA Protein Assay Kit (Catalogue # G1002, Lamda Biotech, Inc., St. Louis, Missouri, USA). Then denatured proteins (50 µg/well) were loaded and electrophoresed using 10% Tricine-SDS gel. Proteins were transferred on Immobilon-P membrane (Millipore Cat No. IPVH00010, USA) at 180 mA current for 3 h. Nonspecific binding was blocked with 5% nonfat dry milk powder in TBST (20 mM Tris-HCl (pH 7.4), 137 mM NaCl and 0.1% Tween 20) for 2 h at 37°C. After blocking the membranes were incubated overnight at 4°C with anti-protein primary antibodies specific for P53 (1:1000, Chemicon, USA), P 21 (1:1000, Chemicon, USA), BCL2 (1:1000, CST, USA), Bax (1:500, Santa Cruz, USA), cleaved caspase-3 (1:1000, CST, USA) and GAPDH (1:1000, Chemicon, USA) in blocking buffer (pH 7.5). The membrane was then incubated for 2 h at room temperature with secondary anti-primary antibody conjugated with horseradish peroxidase (Calbiochem, USA). Then the blots were developed using (3-3′-5-5′ tetramethyl benzidine) TMB-H2O2 (Sigma Aldrich, Missouri, USA) and densitometry for protein specific bands was done in Gel Documentation System (Alpha Innotech, USA) with the help of AlphaEaseTM FC StandAlone V.4.0 software.
Statistical analysis
Results were expressed as mean ± standard error of mean (SEM) for the values obtained from at least three independent experiments. Statistical analysis was performed by one-way analysis of variance (ANOVA) and post hoc Dunnett test to compare the control versus treated group by SPSS Version 12. In all the cases, p < 0.01 was considered as significant
Results
Characterization studies
The mean hydrodynamic diameter and zeta potential (ζ) of the TiO2 NPs suspension in complete medium as determined by dynamic light scattering (DLS) measurement was 434.1 nm and −7.83 mV, respectively (Figure 1(a) and (b)). The internalization of TiO2 NPs in A549 cells through TEM analysis was found to be dose dependent. The particles adhered on the cell surface when incubated for 30 min and subsequently internalized in small vacuoles at cortical cytoplasm in extending incubations and reached to deep cell center near the mitochondria and Golgi apparatus in larger vacuoles over 48 h of exposure (Figure 1(c)).

Characterization of TiO2 NPs. (a) Size distribution and (b) zeta potential of TiO2 NPs was determined using dynamic light scattering and PALS in a Zetasizer Nano-ZS, Model ZEN3600. (c) Representative TEM microphotographs of cell showing internalization of TiO2 NPs. Arrow indicates the internalization of TiO2 NPs in cytoplasm and reached to deep cell center near the mitochondria of A549 cells. PALS: phase analysis light scattering; TEM: transmission electron microscopy; TiO2 NPs: titanium dioxide nanoparticles.
Cytotoxicity
The results of cytotoxicity assays (MTT and LDH) are summarized in Figure 2(a) and (b). In general, concentration and time-dependent decrease in percentage cell viability was observed following 6–48 h exposure of TiO2 NPs. MTT assay demonstrated significant (p < 0.01) reduction in percentage cell viability after 24 h exposure of TiO2 NPs at concentrations 10, 50 and 100 μg/ml (92.19 ± 1.25%, 87.07 ± 0.55% and 84.34 ± 0.44%, respectively, Figure 2(a)). The effect became more intense during the 48 h exposure period (88.72 ± 1.39%, 82.34 ± 0.44% and 78.89 ± 0.55%, respectively, for TiO2 NPs at concentrations 10, 50 and 100 μg/ml). The results of LDH assay were similar to MTT assay (Figure 2(b)). Exposure for 6 h was found to be effective only at higher concentration in LDH assay. There was no major interaction between colors of dyes and NPs as in cell-free system (data not shown).

Identification of cell viability of TiO2 NPs in human lung epithelial cells (A549) assessed by standard endpoints such as (a) MTT assay and (b) LDH release assay. Data are represented as mean ± SE of triplicate. *p < 0.01 indicates significance. LDH: lactate dehydrogenase; MTT: 3-(4, 5-dimethylthiazol-2-yl)-2, 5-diphenyl tetrazolium bromide; TiO2 NPs: titanium dioxide nanoparticles.
Oxidative stress markers
ROS generation
The results of TiO2 NPs-induced ROS generation are summarized in Figure 3(a) and (b). Cells show significant (p < 0.01) responsiveness against TiO2 NPs (10 and 50 μg/ml) at each time point: at 6 h (140.05 ± 3.87% and 170.61 ± 4.45%, respectively), at 12 h (140.27 ± 3.65% and 172.57 ± 1.30%, respectively) and at 24 h (142.45 ± 2.17% and 154.68 ± 3.35%, respectively). However, TiO2 NPs at 5 μg/ml concentration was found to have significant effect only at 12 h (117.37 ± 1.77%) and 24 h (118.38 ± 1.32%) of exposure. Highest concentration (50 μg/ml) of TiO2 NPs induced maximum ROS generation at all the time points (Figure 3(b)). Microphotographs in Figure 3(a) are representative showing the ROS generation in the cells following 12 h of TiO2 NPS exposure. It is well known that the free radicals are generally short-lived species due to their high reactivity so that we did observe ROS percentage at 48 h as it was already low in 24 h compared with 6 and 12 h.

(a) Representative microphotographs showing TiO2 NPs-induced ROS generation in A549 cells. ROS generation was studied using 2,7-DCFH-DA dye. Images were snapped in Nikon phase contrast cum fluorescence microscope (model 80i). (I): Control, (II): 1.0 μg/ml, (III): 5.0 μg/ml, (IV): 10.0 μg/ml, (V): 50.0 μg/ml and (VI): positive control 500 µM H2O2 for 1 h. (b) Percentage change in ROS generation following 6, 12 and 24 h exposure to various concentrations of TiO2 NPs in A549 cells assessed by micro plate reader. The positive control group comprised A549 cells treated with 500 μM of H2O2 (1 h). *p < 0.01 considered as significant. DCFH-DA: dichlorofluorescin diacetate; H2O2: hydrogen peroxide; ROS: reactive oxygen species; TiO2 NPs: titanium dioxide nanoparticles.
Reduced GSH levels
Cell exposed to TiO2 NPs (10 and 50 μg/ml) was found to deplete the levels of GSH significantly at all the time points: 6 h (85.18 ± 2.29% and 79.27 ± 5.25%, respectively), 12 h (86.18 ± 0.81% and 78.62 ± 1.01%, respectively) and 24 h (79.38 ± 4.28% and 74.06 ± 1.89%, respectively) compared with control (Figure 4(a)). However, lower concentration of TiO2 NPs used (1.0 μg/ml) could not pose such severe effects.

(a) Change in levels of GSH, (b) lipid peroxidation and (c) change in catalase activity in A549 cells following the exposure of TiO2 NPs for various time periods (6–24 h) assessed by micro plate reader. Data represented are mean ± SE of three identical experiments made in three replicates. *p < 0.01 considered as significant. GSH: glutathione; TiO2 NPs: titanium dioxide nanoparticles.
LPO
TiO2 NPs at concentrations 10 and 50 μg/ml significantly induced LPO at an exposure time of 6 h (116.79 ± 2.74% and 139.23±4.31%, respectively), 12 h (127.26 ± 2.39% and 132.65 ± 4.41%, respectively) and 24 h (138.25 ± 4.23% and 154.76 ± 5.64%, respectively) compared with control (Figure 4(b)). The induction of LPO was also concentration and time dependent.
CAT activity
Significant reduction in the activity of CAT was observed at 10 and 50 μg/ml, which was maximum at 24 h (46.83 ± 2.11% and 34.50 ± 4.15%, respectively) followed by 6 h (87.39 ± 3.29% and 84.59 ± 6.18%, respectively) and 12 h (89.88 ± 3.23% and 82.14 ± 3.12, respectively) in the TiO2 NPs exposed cells (Figure 4(c)).
Genotoxicity study
MN assay
Result of MN assay is shown in Figure 5(a) and (b). The significant (p < 0.01) increase in MN frequencies with TiO2 NPs at concentrations 10 and 50 μg/ml for three independent experiments were 12.66 ± 0.33 and 17.33 ± 0.33, respectively, compared with control (5.33 ± 0.33) per 1000 binucleated cells. However, lower concentration was ineffective to significantly increase MN at 24 h.
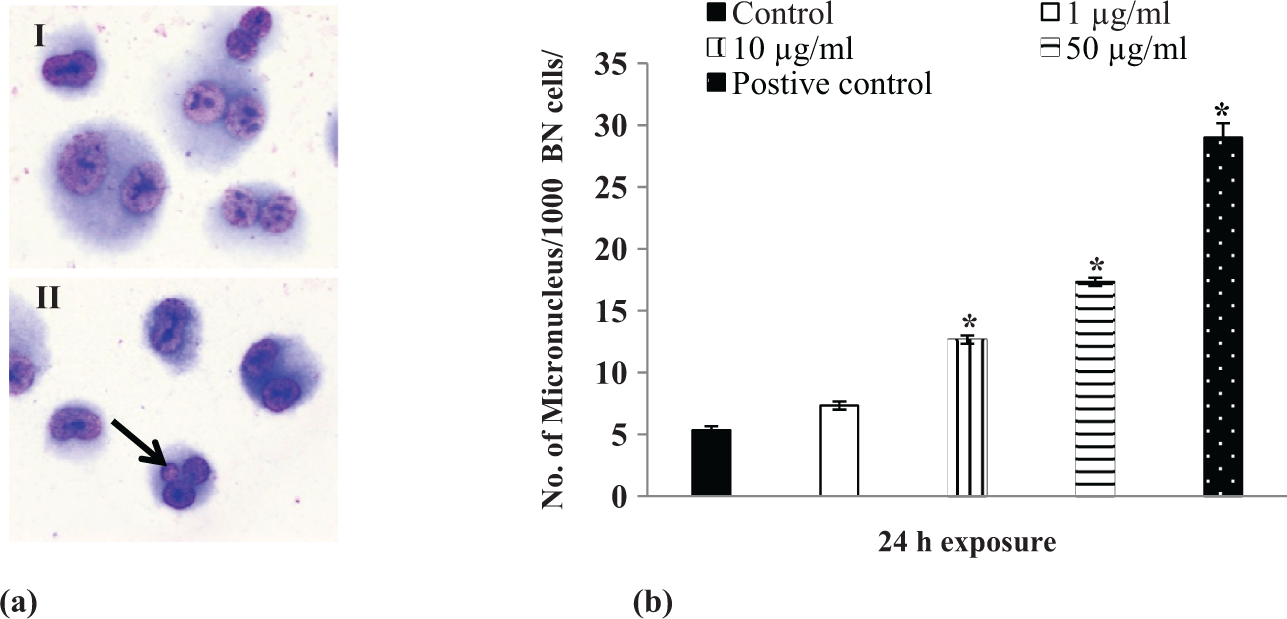
(a) Representative photograph of micronucleus (I) Control and (II) 50 μg/ml treated TiO2 NPs after 24 h. Arrow indicates the binucleated A549 cells (I, a) and binucleated cells with micronucleus (II, a) and (b) number of micronucleus/1000 binucleated cells after the exposure of various concentrations of TiO2 NPs for 24 h. *p < 0.01 considered as significant. TiO2 NPs: titanium dioxide nanoparticles.
Apoptosis studies
Bis-benzimide staining
Following 48 h of TiO2 NPs exposure to cells, a concentration-dependent increase in the apoptotic bodies was observed, which was statistically significant (p < 0.01) at 10 μg/ml (13.66 ± 0.66) and 50 μg/ml (16.66 ± 0.88); however, 50 μg/ml concentration was found to be significantly effective only at 24 h (10.33 ± 0.33) of exposure (Figure 6(a) and (b)).

(a) Representative microphotographs of apoptotic bodies assessed by bis-bezimide (Hochest-33342) staining in A549 cells exposed to various concentrations of TiO2 NPs for 48 h. (I) Control, (II) 1.0 μg/ml, (III) 10.0 μg/ml and (IV) 50.0 μg/ml. Arrow indicates the apoptotic nuclei. (b) Number of apoptotic nuclei/1000 cells after the exposure of various concentrations of TiO2 NPs for 24 and 48 h. The positive control group comprised A549 cells pretreated (2 h) with 300 μM of t-BHP. *p < 0.01 considered as significant. t-BHP: tert-butylhydroperoxide; TiO2 NPs: titanium dioxide nanoparticles.
Transcriptional changes
TiO2 NPs (10 and 50 μg/ml) induces significant up-regulation of mRNA expression of p53 (1.12 ±0.11 and 1.39±0.26, respectively), p 21 (4.93 ± 0.36 and 6.14 ± 0.23, respectively) and cleaved caspase-3 (1.42 ± 0.28 and 1.96 ± 0.28, respectively) and down-regulation of Bcl2 (0.667 ± 0.04 and 0.513±0.12, respectively) compared with control at 12 h exposure (Figure 7(a) and (b)). While Bax was not affected, no such correlation could be established for the same genes at 6 and 24 h exposure (data not shown).
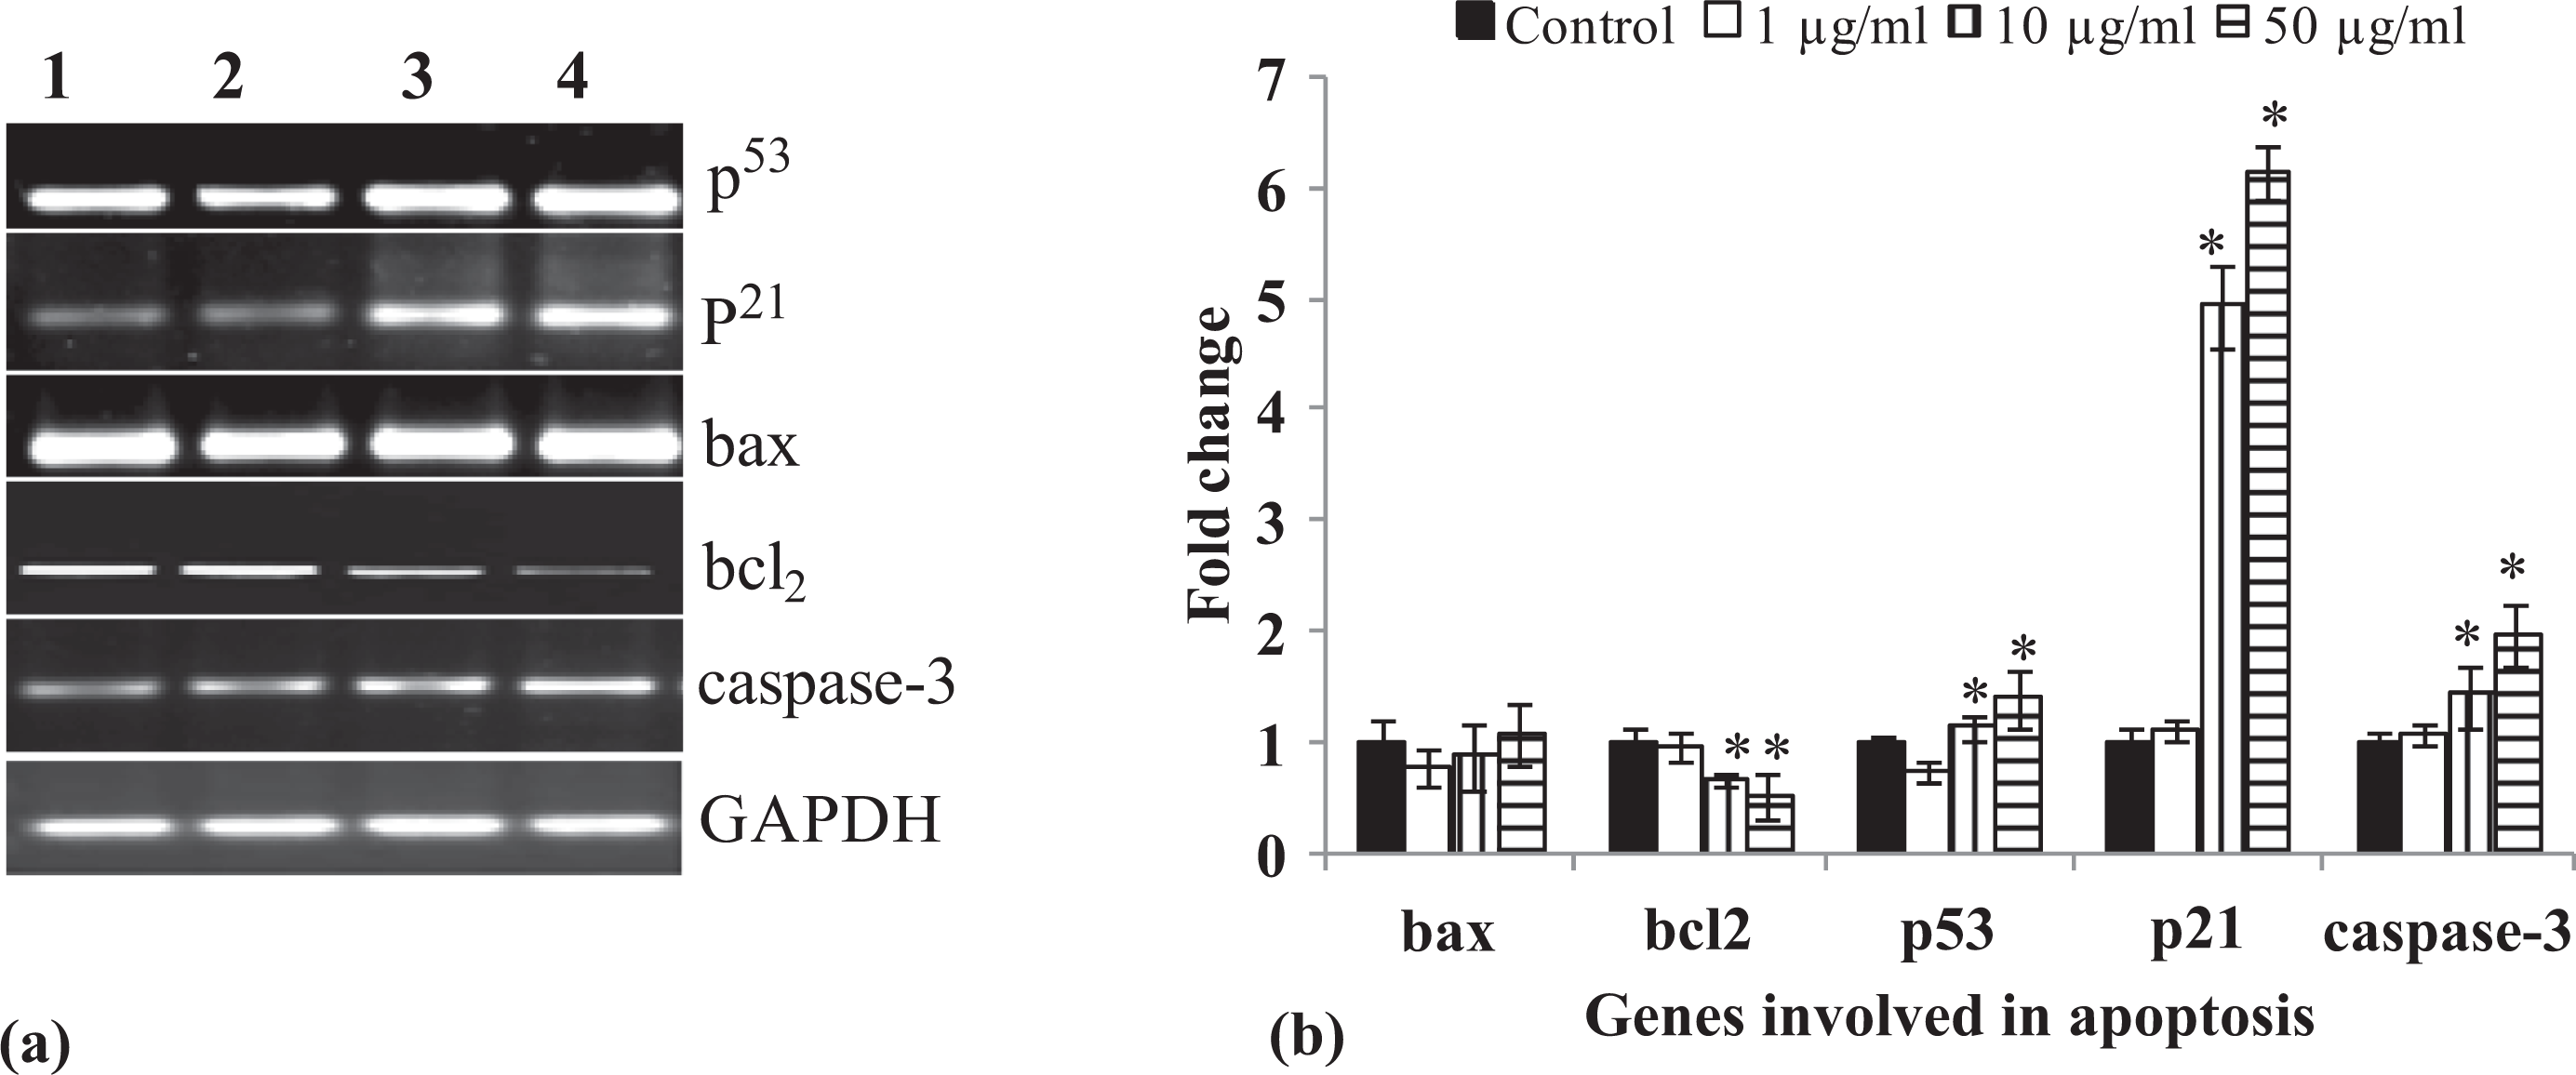
(a) TiO2 NPs-induced alterations in the mRNA expression of marker genes associated with apoptosis in A549 cells exposed to various concentrations of TiO2 NPs for 12 h. Semi-quantitative PCR (RT-PCR) was performed in triplicate. GAPDH was used as internal control to normalize the data and TiO2 NPs-induced alterations in mRNA expression are expressed in fold change. Lane 1: Control; lane 2: 1.0 μg/ml; lane 3: 10.0 μg/ml; lane 4: 50.0 μg/ml, except GAPDH. (b) Relative quantification of alterations in the expression of genes involved in the induction of apoptosis in A549 cells exposed to various concentrations of TiO2 NPs for 12 h. GAPDH was used as internal control to normalize the data. Quantification was done in Gel Documentation System. *p < 0.01 considered as significant. GAPDH: glyceraldehyde 3-phosphate dehydrogenase; mRNA: messenger RNA; RT-PCR: real-time polymerase chain reaction; TiO2 NPs: titanium dioxide nanoparticles.
Translational changes
Results of the Western blot analysis showed significant up-regulation of gene protein of P53 (4.91 ± 0.51, 6.29 ± 0.32 and 4.86 ± 0.68), P 21 (3.76 ± 0.20, 4.21 ± 0.41 and 3.13 ± 0.25) and cleaved caspase-3 (1.39 ± 0.62, 4.86 ± 0.37 and 3.08 ± 0.5) and down-regulation of BCL2 (0.973 ± 0.09, 0.369 ± 0.25 and 0.215 ± 0.14) following TiO2 NPs exposure at concentrations 1, 10 and 50 μg/ml for 24 h, respectively (Figure 8(a) and (b)). The trend of cellular response at protein level was similar to transcriptional changes. No specific correlation could be established between the exposure and effect following the exposure of 6 and 12 h (data not shown).

(a) Alterations in the expression of proteins involved in the induction of apoptosis were studied in A549 cells exposed to various concentrations of TiO2 NPs for 24 h. GAPDH was used as internal control to normalize the data. Lane (1) untreated control, lane (2) 1.0 μg/ml, lane (3) 10.0 μg/ml and lane (4) 50.0 μg/ml of TiO2 NPs. (b) Relative quantification of alterations in the expression of proteins involved in the induction of apoptosis in A549 cells exposed to various concentrations of TiO2 NPs for 24 h. GAPDH was used as internal control to normalize the data. Quantification was done in Gel Documentation System (Alpha Innotech, USA) with the help of AlphaEaseTM FC StandAlone V.4.0 software. *p < 0.01 considered as significant. GAPDH: glyceraldehyde 3-phosphate dehydrogenase; TiO2 NPs: titanium dioxide nanoparticles.
Discussion
Internalization and toxic responses of NPs are suggested to be associated with their size, composition, surface charge, agglomeration roughness and surface coatings. 24,25 In the present study, the hydrodynamic size and zeta potential of TiO2 NPs particles were measured at 434.1 nm and −7.83 mV, respectively. Size was many fold higher than that claimed (25 nm) by the manufacturer (Sigma Aldrich, Missouri, USA). This difference was not unusual, since such NPs are known to have the tendency of agglomerate in aqueous suspensions and provided clustered size rather than individual particles. 26 Our results show a negative zeta potential for the TiO2 NP (−7.83 mV), which is an indirect parameter for surface charge. In cell culture medium, the surface charge on the NPs measured by zeta potential was less negative due to the presence of inorganic cations in the physiological media. 27 These cations are attracted to the negative charged surface of NPs. A less negative zeta potential favors the particle agglomeration more rapidly and that is why we observed enhanced agglomeration. Negative surface charge causes more cytotoxicity and can cross the blood–brain barrier. 28 Zeta potential gives the degree of repulsion force between particles, which can be used to predict the long-term stability of the particle in a particular medium. However, it does not give any information about the element present on the surface of the particles. 29 We and others have confirmed such solvent-induced agglomeration by DLS/TEM studies using other commercially available NPs. 30
Our cytotoxicity data reveal that the retention period and concentration of TiO2 NPs are directly proportional to induce the detrimental responses in A549 cells. Cytotoxic effects were detectable only at higher concentrations of TiO2 NPs. This might be due to the agglomeration of the particles in cytoplasm, which leads the physiological unrest by vacuole formation hypertrophy of other cell organelles. Since, the tendency of agglomeration of NPs was also seen in neural stem cells under similar experimental setup. 31 The similar trend for cytotoxic responses was also observed with other cells such as human lymphoblastoid 32 and mouse epidermal (JB6) cell line 33 exposed to TiO2 NPs. Recent study conducted by Lankoff et al. examined how the agglomeration/aggregation state of silver (20 nm and 200 nm) and TiO2 (21 nm) NPs may affect the kinetics of cellular binding/uptake and ability to induce cytotoxic responses in THP1, HepG2 and A549 cells and observed that A549 cells were most sensitive to these particles in relation to cellular binding/uptake. 11 NPs can hinder with various colored dyes and their intermediates used in colorimetric and fluorometric-based assays. This may result to false impression of data. 34 In the present study, this was obviated by a parallel set of experiments conducted to check the interaction of NPs with MTT and DCF-DA dyes. Our data reveal that TiO2 NPs do not interrelate with these dyes used for cytotoxicity assessment as well as for ROS measurement.
ROS-mediated oxidative stress is a generalized phenomenon in most of the NP-induced damages. 35 Thus, the release of oxy radicals and LPO is essential to assess the role of oxidative injury. Our data demonstrate significant oxidative stress in the cells as the levels of ROS and LPO were found increased and levels of GSH and CAT were reduced. Decreased GSH and CAT activity only at higher concentration at all the exposure time might be either due to the inability of A549 cells to eliminate overwhelming quantity of H2O2 and its metabolites, produced by the exposure to TiO2 NPs, or due to the enzyme inactivation caused by excess ROS production. 36 Increased H2O2 levels in the cells are known to form hydroxyl radicals, a potent activator of LPO 37 and we have also reported the elevated levels of LPO in A549 cells exposed to multiwalled carbon nanotubes. 30 The lower intracellular concentrations of H2O2 result in subtle signaling events by enzymatic removal of H2O2, while high concentrations are known to affect cellular homeostasis, which ultimately lead to apoptotic/ necrotic cell death. 38 H2O2 also mediate the apoptosis by the activation of transcription factor NF-κB-dependent signaling, which is linked to cellular glutathiolation levels. 39,40 Therefore, such oxidative stress–mediated metabolic instability in the cells possibly triggers the apoptosis cascade, as we observed the positive correlation between oxidative stress and expression change in genes involved in apoptosis. Besides, the above mechanism described, there is a direct relationship between the surface area and the ROS-generating capability in the lungs. 41 TiO2 NPs used in the present investigations were in anatase phase and were having comparatively larger surface area of about 200–220 m2/g, which might be the partial reason of higher ROS production. The data of cytotoxicity clearly indicate that the higher concentration of TiO2 NPs (50 μg/ml) induces adverse effects in the cells when exposed for 24 h. Therefore, this might be one among the reasons being decreased response of ROS generation at this concentration at 24 h when compared with 12 h exposure. Significant MN induction in the present investigation suggests the genotoxic potential of TiO2 NPs in A549 cells. It could be well correlated with the increased expression of P53, biomarker of genetic toxicity. 9 Our findings are parallel to the studies conducted in Syrian hamster embryo fibroblast cells using ultrafine particles of TiO2. 22 Association of MN induction and p53 expression is well established with the ROS generation. 42 Thus, the genotoxic responses of TiO2 NPs in A549 cells may be suggested as a part of whole cascade, finally leading to the apoptosis.
We observed more number of apoptotic bodies in extended exposure (48 h) of TiO2 NPs than shorter exposure (24 h) and no significant numbers in early hours of exposure (6 and 12 h). Such delayed phenotypic responses in the cells could be correlated with the expressional changes at both mRNA and protein level for the studied apoptosis markers. The transcriptional changes were most significant at 12 h, while this time point shifted to 24 h for translational changes. Therefore, the alterations at phenotypic expression and physiological functionality were quite anticipated few hours later, which was required to complete the post-translational processing and subsequent downstream realization. 30 These time- and concentration-based sequence of events also advocates the possible relationship between ROS generation and LPO-mediated apoptosis in A549 cells. Similar kind of observations has also been reported with other NPs in primary cultures. 43 On the event of oxidative stress and DNA damage, p53 is one among the important triggering molecules responsible to regulate the intracellular redox status and induction of apoptosis by activation of downstream targets such as p 21 , Bax and caspase-344 and subsequent blocking of cell cycle. 45 We observed the up-regulation of P53 and its downstream effectors, that is, P 21 and caspase-3 in A549 cells. Such kind of modulation in apoptosis implicating protein P53 and its downstream effectors has also been reported in human peripheral blood lymphocyte. 46 The cell cycle arrest is an important signal for apoptosis process and the probable function of p 21 is the inhibition of cycline-dependent protein kinase and causes growth arrest in G1/S subphase of cell cycle. 45 Decrease in the expression of anti-apoptotic protein Bcl2 might be suggested as an important finding to facilitate the formation of permeability transition pore in mitochondria and the release of cytochrome c. 44 Cytochrome c leads to the activation of the caspase cascade such as caspase-3. Caspase-3 plays an important role in the catabolic phase of cell death by cleaving the various intracellular substrates and also found to activate and amplify caspase cascade. 44 ROS-induced activation of caspase-3 in cell system is well documented. 18,44 This also supports our observation of up-regulation of caspase-3 (mRNA and protein) expression at time points of TiO2 NPs exposure, where ROS generation was most significant. Furthermore, reports show that caspase-3-mediated chromosomal condensation and DNA fragmentation induced apoptosis of cells, 47 thus supporting the findings of the present investigation. The possible schematic mechanism of TiO2 NPs-induced cellular and molecular toxicity in human lung cancer cells (A549) under in vitro condition is illustrated in Figure 9.
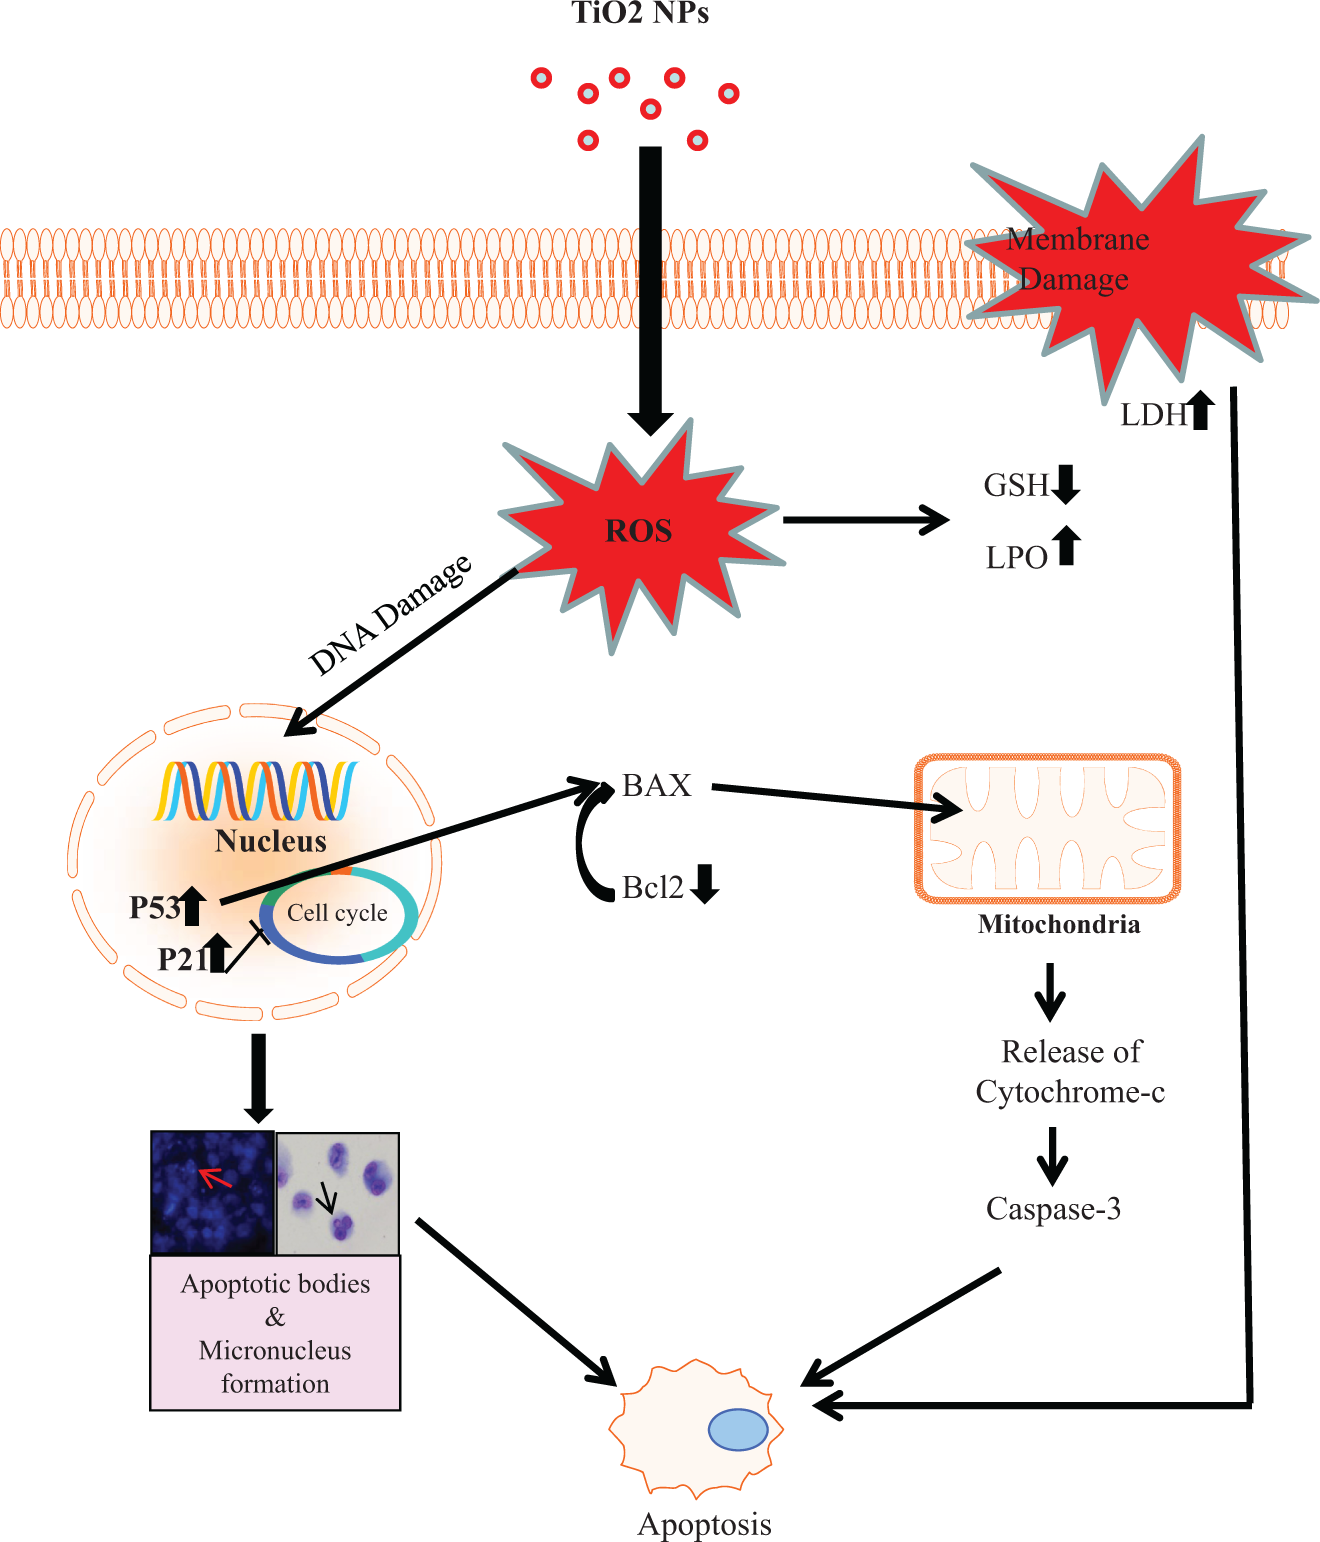
A schematic diagram showing the possible mechanism of nano-titanium dioxide-induced apoptosis pathway (cell death) in human lung cancer cell line (A549).
Conclusion
Experimental exposure of TiO2 NPs (10 and 50 μg/ml) was found to induce oxidative stress, genotoxicity and apoptosis in human lung cancer cell line, A549. Expressional changes in apoptosis markers were having good correlation with endpoints of oxidative stress and phenotypic presentation of apoptotic/genotoxic events. Data reveal the toxicological consequences of A549 cells against experimental exposure of TiO2 NPs by inducing oxidative stress, MN induction and apoptosis. The data enhance our understanding on cellular and molecular behavior of human lung cancer cells against TiO2 NPs exposure and may be helpful to suggest the biosafety/toxicity of other nanomaterials. These results highlight the need for caution during manufacturing/use of nanomaterials as well as further investigation on signaling cascade of TiO2 NPs-induced toxicity mechanism.
Footnotes
Acknowledgement
Authors are grateful to the Director, Indian Institute of Toxicology Research, Lucknow, India, for his keen interest in the study.
Conflict of interest
The authors declared no conflicts of interest.
Funding
Financial support by the Council of Scientific & Industrial Research, New Delhi, India (SIP-08) is acknowledged.