
Abstract
Thioacetamide (TAA) is widely used as a model of hepatic encephalopathy (HE). The aim of our study was to investigate the effects of TAA on electroencephalographic (EEG) changes in rats and to compare them with human HE. Male Wistar rats were divided into groups: (1) saline-treated group and (2) TAA-treated groups: TAA300 (300 mg/kg), TAA600 (600 mg/kg), and TAA900 (900 mg/kg). Daily dose of TAA (300 mg/kg) was administered intraperitoneally once (TAA300), twice (TAA600), or thrice (TAA900) in subsequent days. EEG changes were recorded about 24 h after the last dose of TAA. Absolute and relative power density in alpha bands were significantly higher in TAA300 versus control group. In TAA300, absolute beta power density was higher and relative beta power density was lower versus control group. Absolute alpha, theta, delta, and relative theta power were significantly lower, while relative power in delta band was significantly higher in TAA900 versus control group (p < 0.01). In conclusion, decrease in EEG voltage with an increase in delta relative power, which correspond to the EEG manifestations of severe HE in humans, was observed in TAA900 group. Electrical activity in TAA300 group correlates with mild HE in humans.
Introduction
Hepatic encephalopathy (HE) represents a neuropsychiatric syndrome that appears as a result of acute or chronic liver failure. 1 The pathogenesis of HE is not completely understood. Hyperammonemia has a central role in the pathogenetic mechanisms of HE, while the astrocytes are the principal target of ammonia neurotoxicity. 2 –4 Acute hyperammonemia induces astrocyte swelling, cytotoxic brain edema, and an increase in intracranial pressure. 5,6 In addition, acute increase in ammonia level induces mitochondrial permeability transition, an increase in glutamatergic transmission with excitotoxicity, 4 oxidative stress, increased production of nitric oxide, and central inflammatory process, which were also postulated to contribute to the pathogenesis of acute HE. 7,8
On the other hand, in chronic HE, the dominant morphologic brain lesion is Alzheimer’s type II astrocytosis. 6 Several mechanisms have been proposed to mediate neurotoxic effects of ammonia in chronic HE, including changes in neurotransmission with predominance of gamma-aminobutyric acid (GABA)ergic transmission, 9 increased synthesis of neurosteroids 10 and changes in cellular energetics. Immune dysregulation has also been proposed to contribute to the pathogenesis of HE. 11
Thioacetamide (TAA), a sulfur-containing substance used in metallurgy, rubber and paper industries, and also as a pesticide, is frequently used for induction of acute or chronic liver failure. 12 –14 It exerts hepatotoxic, carcinogenic, and neurotoxic effects. 12,15,16
Currently, there is no ideal experimental model of HE. One of the criteria an ideal model should fulfill is the correlation between electroencephalographic (EEG) changes in the model and in humans. 17 Electroencephalography represents a key method in the evaluation of HE. 18 It can complement neurological findings to provide evidence of HE in patients with preserved consciousness or to exclude some other conditions that may disturb the consciousness. In addition, electroencephalograph is useful for the follow-up of the course of HE as well as of therapeutical procedures. 19 Various methods of electrophysiological analysis in HE were proposed in previous studies. These analyses include visual EEG assessment, 20 –22 spectral analysis, 21 –23 artificial neural networks approach, 18 and evoked potentials. 19,24,25 Spectral analysis of electroencephalogram was confirmed to increase the interobserver repeatability of the findings in comparison with visual assessment of the electroencephalogram. Although artificial neural networks showed promising results, spectral analysis of the electroencephalogram remains a reliable method for EEG analysis in HE. 18
Although behavioral manifestations of TAA intoxication were studied in previous investigations, 12,17 the effects of TAA on EEG activity were not extensively studied. We hypothesized that TAA may induce EEG abnormalities similar to human HE, thus confirming that this model may be suitable for further investigation of the pathogenesis of HE and possible therapeutical procedures in human HE. Based on this background, the aim of our study was to investigate the effects of TAA on EEG findings in rats, determined by spectral analysis.
Material and methods
Animals
Experiments were performed on adult male Wistar rats, weighting 170–200 g, that were raised on Military Medical Academy in Belgrade. Animals were kept in individual cages (55 × 35 × 30 cm) under standard laboratory conditions (ambient temperature 22 ± 1°C, relative humidity 50%, 12/12 h dark/light cycle with lights turned on at 9:00 a.m.) with free access to pelleted food and tap water. All experimental procedures were in full compliance with Directive of the European Parliament and of the Council (2010/63/EU) and approved by The Ethical Committee of the University of Belgrade (Permission No 298/5-2).
All animals were divided into following groups: (1) Control: saline-treated group (n = 8); (2) TAA-treated groups: TAA300 (300 mg/kg; n = 8), TAA600 (600 mg/kg; n = 10), and TAA900 (900 mg/kg; n = 18). Daily dose of TAA (300 mg/kg) was administered intraperitoneally (i.p.) once (TAA300), twice (TAA600), or thrice (TAA900) in subsequent days. The total duration of the treatment was 1 (TAA300), 2 (TAA600), or 3 days (TAA900). Before administration, TAA was dissolved in saline in to a concentration of 100 mg/mL. EEG changes were followed a day after administration of the last dose of TAA (22.5–23.5 h).
Animals were killed 24 h after treatment, and blood and liver samples for pathohistologic analysis were collected. Liver was removed from rats immediately after killing, fixed in 4% buffered formalin, and embedded in paraffin. Sections of 5-µm-thick were stained with Masson’s trichrome staining protocol, and observed under light microscopy (Olympus BX41). Blood ammonia concentration, as a useful marker of liver failure, was determined by enzymatic test (BioMerieux Laboratory, France) in the samples collected from the right side of the heart.
EEG studies
For EEG recordings, rats were anesthetized with ketamine (100 mg/kg i.p.) and three gold-plated electrodes were implanted over frontal, parietal, and occipital cortices by stereotaxic method. Treatment with TAA started 7 days after the implantation of electrodes in order to escape the interference between effects of surgery and TAA on EEG activity. An 8-channel EEG apparatus (RIZ, Zagreb, Croatia) was used. The signals were digitized using a SCB-68 data acquisition card (National Instruments Co., Austin, Texas, USA). A sampling frequency of 512 Hz/channel and 16-bit analogous to digital (A/D) conversion were used for the EEG signals. The cutoff frequencies for EEG recordings were set at 0.3 and 100 Hz for the high-pass and low-pass filters, respectively. Ambient noise was eliminated using a 50-Hz notch filter. Data acquisition and signal processing were performed with LabVIEW platform software developed in the Laboratory NeuroSciLaBG. 26 , 27 Electroencephalogram was analyzed every 30 min in the period 22.5–23.5 h after the administration of the last dose of TAA. This period was chosen, since our pilot study has shown that behavioral changes are most prominent about 24 h after TAA treatment (data not published). According to the modified method of Amodio et al., 18 for each time interval when electroencephalogram was analyzed, artifact-free recording was divided into eight epochs each lasting 12 s. The absolute and relative power spectral densities were calculated using the software for fast Fourier transformation method and the integrated energy signals were expressed as μV2/Hz. Upon completion of the recording sessions, the animal would be removed from the recording chamber and returned to its home cage.
Statistical analysis
Blood ammonia concentration and absolute and relative power spectral densities were expressed as means ± SEM. Statistical significance of the difference in ammonia concentration was estimated by one-way analysis of variance (ANOVA), while significance of the difference in power spectral density was estimated by two-way ANOVA with Tuckey’s post hoc test. The value p < 0.05 was considered statistically significant. For statistical analysis computer software Statistica 7.0 was used.
Results
All animals survived after TAA treatment in a dose of 300 mg/kg. Lethality of animals in TAA600 group 24 h after treatment was 10% (1 of 10), while in TAA900 group lethality was 44.4% (8 of 18). Blood ammonia concentration was significantly higher in all TAA-treated groups versus control group. Its concentration was also significantly higher in TAA600 (81.5 ± 5.9 µmol/L) and TAA900 groups (78.3 ± 6.5 µmol/L) in comparison with TAA300 group (51.4 ± 4.7 µmol/L; p < 0.01; Figure 1).

The effect of TAA on plasma ammonia concentration. Daily dose of TAA (300 mg/kg) was administered once (TAA300), twice (TAA600), or thrice (TAA900) in subsequent days. Blood samples for ammonia determination were collected from the right side of the heart 24 h after treatment. Significance of the difference in plasma ammonia concentration was estimated by one-way ANOVA with Fisher’s post hoc test (*p < 0.05 and **p < 0.01 vs. control, #p < 0.01 vs. TAA300 group). TAA: thioacetamide; ANOVA: analysis of variance
Histological analysis
Alterations in the hepatic tissue can be noticed 24 h after treatment in TAA300 group. Acute hyperemia is followed by necrosis in the central vein area, which is confluent to form bridging (central-to-central) necrosis. Apoptotic hepatocytes can, also, be noticed. Portal areas are with normal, preserved structure (Figure 2(b)). In TAA600 group, liver sections revealed severe acute bridging necrosis 24 h after administration of the last dose of TAA. Apoptotic cells cannot be seen. Portal areas are still preserved (Figure 2(c)). All sections of liver tissue in TAA900 group showed severe bridging necrosis revealing inflammatory infiltrate and hemorrhage 24 h after the last administration of TAA (Figure 2(d)).
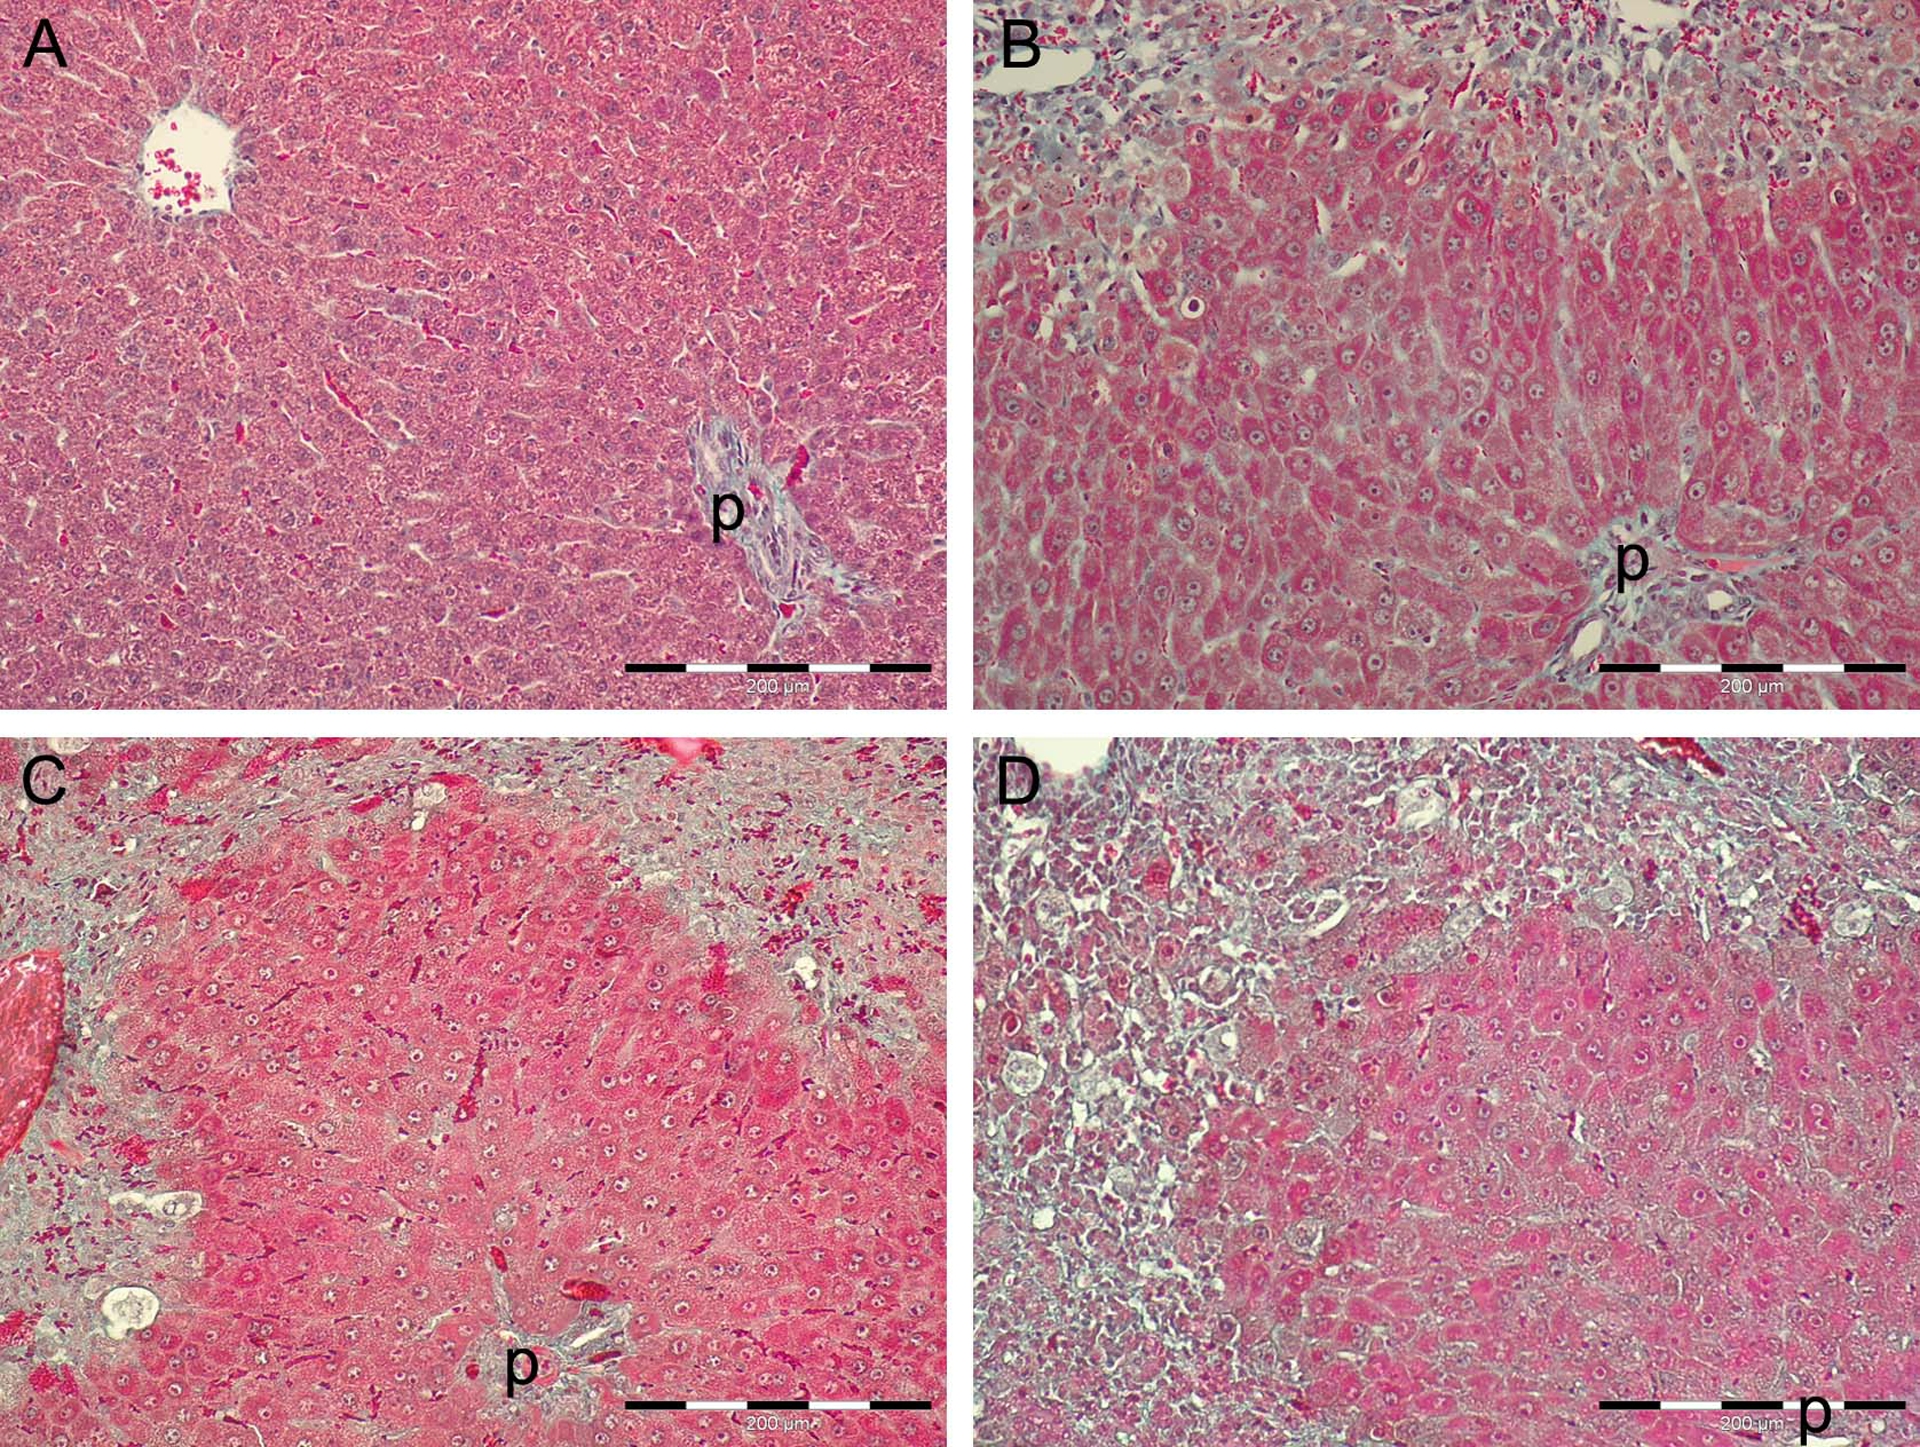
Histopathological changes in the liver after intraperitoneal TAA administration on sections stained with Masson’s trichrome staining. (a) Liver section from control, saline-treated group with preserved structure of parenchyma. (b) Liver section from TAA300 group 24 h after TAA administration with acute bridging necrosis, prominent cells with karyorrhexis, karyolysis, or in apoptosis, and preservation of periportal zone. (c) Liver section from TAA600 group 24 h after second TAA administration with bridging necrosis and preservation of periportal zone. (d) Liver section from TAA900 group 24 h after third TAA administration with bridging necrosis and preservation of periportal zone. Masson’s trichrome staining. p: portal area; TAA: thioacetamide.
EEG findings
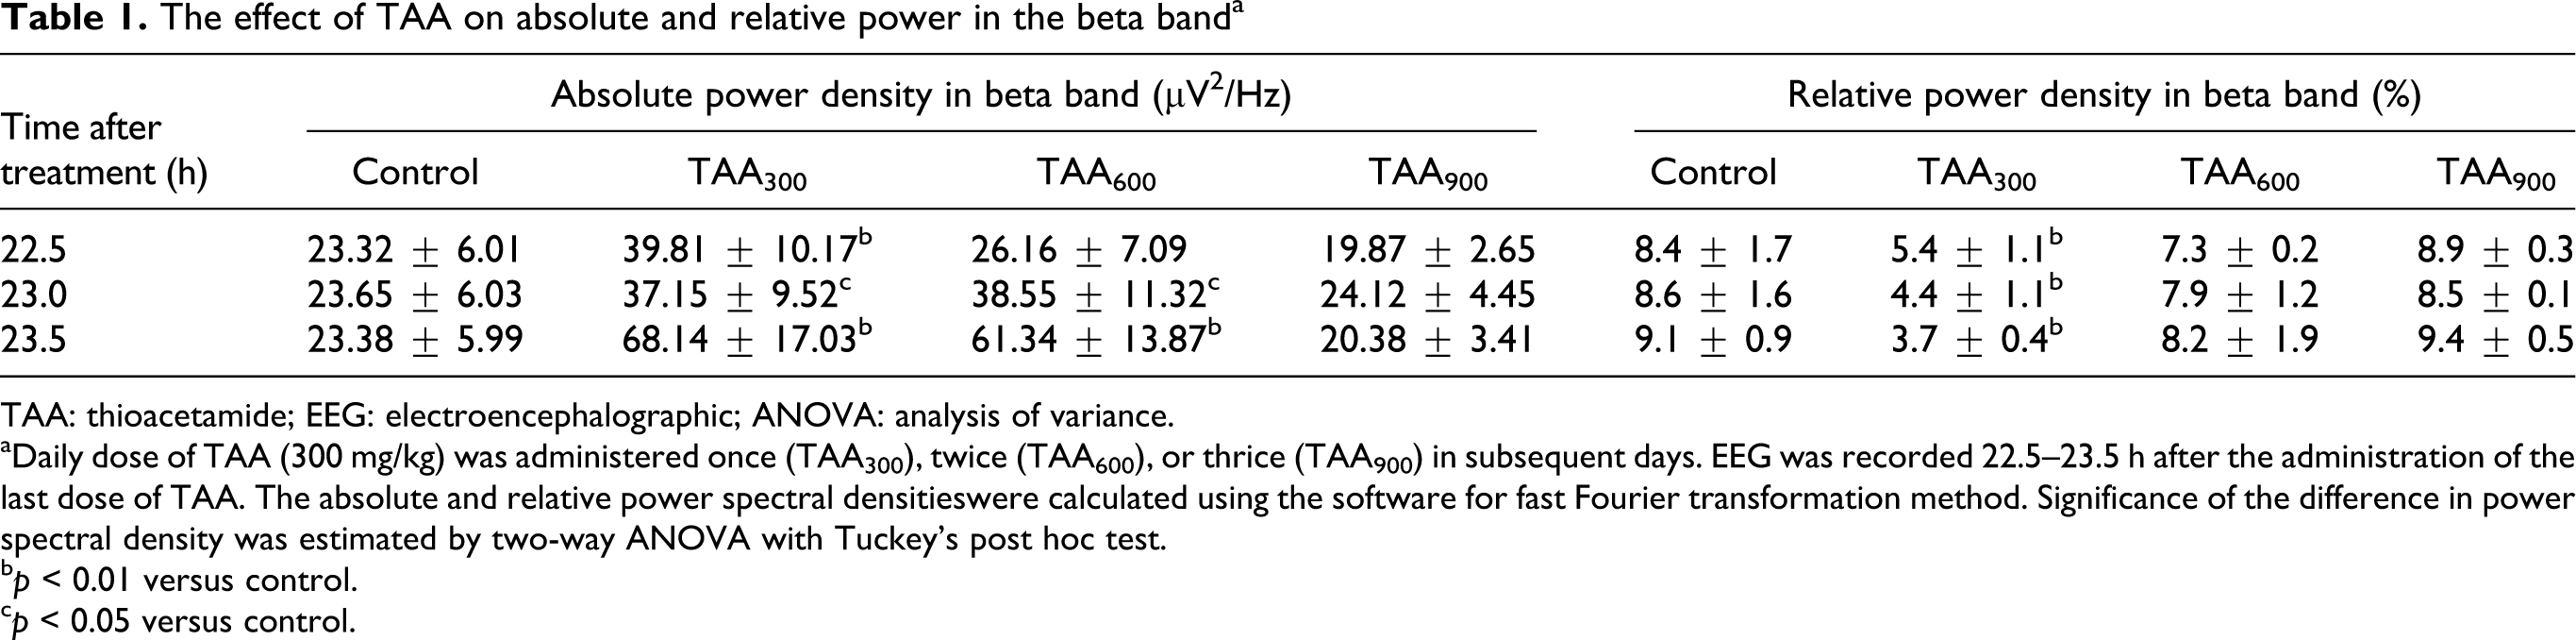
Results of our study showed that absolute beta power spectral density was significantly higher in TAA300 versus control group at all time intervals. The most pronounced increase was evident 23.5 h after treatment. While absolute beta power was significantly higher in TAA600 group in comparison with control group only 23 h (p < 0.05) and 23.5 h (p < 0.01) after the administration of the last dose, no significant change in absolute beta power was evident in TAA900 group at all time intervals (Table 1). In contrast to absolute beta power, relative beta power spectral density was significantly lower in TAA300 group in comparison with control group at all time intervals (p < 0.01). No significant changes in this parameter were evident in TAA600 and TAA900 groups versus control (Table 1).
The effect of TAA on absolute and relative power in the beta banda
TAA: thioacetamide; EEG: electroencephalographic; ANOVA: analysis of variance.
aDaily dose of TAA (300 mg/kg) was administered once (TAA300), twice (TAA600), or thrice (TAA900) in subsequent days. EEG was recorded 22.5–23.5 h after the administration of the last dose of TAA. The absolute and relative power spectral densitieswere calculated using the software for fast Fourier transformation method. Significance of the difference in power spectral density was estimated by two-way ANOVA with Tuckey’s post hoc test.
b p < 0.01 versus control.
c p < 0.05 versus control.
When compared with control, the absolute alpha power spectral density was significantly changed in the following manner: higher in TAA300 and lower in TAA900 group at all time intervals (p < 0.01) and higher in TAA600 only 23.5 h after treatment (277.5 ± 59.9 μV2/Hz vs. 79.9 ± 22.8 μV2/Hz; p < 0.01; Table 2). The relative alpha power spectral density was significantly higher in TAA300 versus control group at all time intervals and in TAA600 versus control 23.5 h after treatment. On the other hand, in TAA900 group, no significant change in relative alpha power was evident when compared with control group (Table 2).
The effect of TAA on absolute and relative power in the alpha banda

TAA: thioacetamide; ANOVA: analysis of variance.
aSignificance of the difference in power spectral density was estimated by two-way ANOVA with Tuckey’s post hoc test (for further information see Table 1).
b p < 0.01 versus control.
c p < 0.05 versus control.
Spectral analysis revealed that the absolute theta power spectral density was significantly higher in TAA300 and TAA600 groups versus control 23.5 h after treatment (p < 0.01). In TAA900 group, absolute theta power was significantly lower at all time intervals in comparison with control group (p < 0.01; Table 3). We observed that the relative theta power spectral density in experimental groups in comparison with control group showed: no change in TAA300, a significant increase in TAA600, 22.5 h after treatment (p < 0.01), and a significant decrease in TAA900 group (p < 0.01; Table 3).
The effect of TAA on absolute and relative power in the theta banda

TAA: thioacetamide; ANOVA: analysis of variance.
aSignificance of the difference in power spectral density was estimated by two-way ANOVA with Tuckey’s post hoc test (for further information see Table 1).
b p < 0.01 versus control.
While no significant difference in the absolute delta power spectral density was evident between TAA300 and control group (p > 0.05), absolute delta power was significantly higher in TAA600 group versus control group at all time intervals. In contrast, a significant fall in absolute delta power was evident in TAA900 group in comparison with control group at the same time (p < 0.01; Table 4). The relative delta power spectral density was significantly lower in TAA300 and TAA600 groups versus control 22.5 h after treatment (p < 0.01). This decrease remains evident in TAA300 group 23 and 23.5 h after TAA administration. At the same time, relative delta power was not significantly different in TAA600 group versus control (p > 0.05). In contrast to TAA300 and TAA600 groups, relative delta power was significantly higher in TAA900 group in comparison with control group at all time intervals (p < 0.01; Table 4).
The effect of TAA on absolute and relative power in the delta banda

TAA: thioacetamide; ANOVA: analysis of variance.
aSignificance of the difference in power spectral density was estimated by two-way ANOVA with Tuckey’s post hoc test (for further information see Table 1).
b p < 0.01 versus control.
Discussion
According to blood ammonia concentration, TAA induced liver failure irrespective of its dose (Figure 1). Histological analysis of the liver confirms hepatotoxic effects of TAA (Figure 2), thus indicating that liver injury may be, at least partly, responsible for TAA-induced EEG changes found in our study. Direct neurotoxic effects of TAA were also postulated: cytochrome P450-dependent monooxygenase, an enzyme involved in TAA metabolism in the liver, is present in the brain. This enzyme is suggested to be involved in the production of toxic metabolites (e.g. thioacetamide-S-S oxide). 28 –30 The formation of these metabolites were confirmed in the rat brain after intraperitoneal TAA administration, 31 but was insignificant after the ingestion of TAA in the drinking water. 32 Since TAA ingestion in the water induced neurological changes, it may be suggested that liver failure contributes to the majority of neurotoxic effects seen in TAA intoxication. 32
In previous studies, different classification scales were used to describe EEG alterations in HE. One of the earliest classifications was according to the qualitative visual assessment of electroencephalograph. 20 Based on this classification, the patients with alpha rhythm disturbed by random theta waves over both hemispheres or with diffuse background activity in the theta range with random appearance of high waves in the delta range were at increased risk of death at 1-year period. The worst prognosis corresponded to the severe disorganization of EEG activity with diffuse asynchronous theta and delta rhythm. 18 Our results are in accordance with these findings, since the highest mortality in our study was associated with a relative increase in delta band in TAA900 group (Table 4). However, this classification scale carries a risk of subjective interpretation with subsequent low interobserver repeatability. 18
In order to improve the repeatability of the method, spectral analysis-based classification was introduced by Van der Rijt et al. 23 Apart from repeatability, spectral analysis was shown to provide indexes that correlate with both clinical findings and prognosis of HE. 33 This scale classifies EEG manifestations, according to the mean dominant frequency and relative power in theta and delta bands. The highest grade (the most severe HE) according to this classification corresponds to mean dominant frequency ≤7.3 Hz and delta relative power ≥45%. 21 –23 According to Van der Rijt et al., although classification of EEG changes may be useful in human population, 18 it cannot be used for the evaluation of TAA-induced EEG changes in rats, since all TAA-treated groups in our study had delta relative power ≥45%.
However, spectral analysis remains a reliable method for EEG analysis in TAA-induced encephalopathy, since our study has shown that TAA induces EEG changes in a dose-dependent manner. EEG findings in TAA300 group (Tables 1 and 2) have shown a correlation with EEG manifestations of mild HE in humans, which is associated with initial increase in EEG wave voltage. 19 However, other studies showed controversial results related to the initial changes in relative representation of various EEG waves in human HE. Some studies found a frontal predominance of the alpha rhythm, 34,35 while others, similar to the present study, described an increase in beta waves in mild HE. 18,36 On the other hand, low-power beta activity was also described in the initial stages of HE in humans. 36 These initial EEG changes may be explained by increased GABAergic and glutamatergic activities, 19 which are increased in acute HE. 13,37
In contrast to 300 mg/kg, TAA in a dose of 600 mg/kg induced an increase in the delta wave voltage as the earliest EEG change in the developed encephalopathy. An increase in beta, alpha, and theta voltage were evident only 23.5 h after treatment (Tables 1 to 3 and Figure 3). An increase in voltage of delta waves was associated with comatose state and lethality (10%) in this group. Although relative representations of delta and theta waves were significantly changed 22.5 h after treatment (Tables 3 and 4), these parameters have no prognostic value, since later these changes were inconsistent, although coma was clearly evident. Based on the present study, the first sign of moderate to severe TAA-induced encephalopathy is increase in voltage of delta waves and not the relative representation of EEG waves.

Representative EEG tracings in TAA300 (a), TAA600 (b), and TAA900 groups (c). Daily dose of TAA (300 mg/kg) was administered once (TAA300), twice (TAA600), or thrice (TAA900) in subsequent days. EEG was recorded 22.5–23.5 h after the administration of the last dose of TAA. TAA: thioacetamide; EEG: electroencephalograph.
Models of HE, induced by high doses of galactosamine and by ligation of hepatic artery after previous portocaval shunt in rats, have shown an increase in low-frequency EEG activity. 38 TAA in a dose of 900 mg/kg induced similar changes in our study (Tables 2 to 4) and they correspond to the EEG changes in severe HE in humans. 19 Hepatic coma is associated with various EEG abnormalities, from alpha rhythm admixed with theta slowing in early stages to theta–delta slowing over both hemispheres in late phases of coma. Triphasic waves may be present, but are not always evident. 39 Late stage of coma is associated with flattening of the electroencephalogram followed by a predominance of delta waves. 40 Similar findings were obtained from studies of fulminant liver failure performed in hepatectomized swines. 41 Findings of our study indicate that TAA in a dose of 900 mg/kg provokes EEG manifestations of deep coma, which are further followed by high mortality (44.4%).
Quantitative EEG analysis has shown an increase in relative theta power in the posterior derivations in 15–30% of cirrhotic patients. 33 Our findings (Table 3) do not precisely correlate with findings in human studies, probably because TAA induced acute liver failure and not cirrhosis in our study and because of possible additional toxic effects of TAA on the brain irrespective of liver injury-induced encephalopathy.
Apart from dose dependency of EEG changes in TAA-induced encephalopathy, another confirmation of reliability of spectral EEG analysis in this type of encephalopathy is the prognostic value of this method. Based on EEG manifestations and mortality found in the present study, it can be suggested that an increase in relative power of the delta band with simultaneous decrease in the theta band (Tables 3 and 4), along with a decline in EEG voltage may be a bad prognostic sign in TAA-induced encephalopathy.
The usefulness of the study is to define model of TAA-induced HE in a more precise manner by electroencephalography. Based on these results, it can be concluded that TAA in a dose of 300 mg/kg induces EEG manifestations that correlate with mild HE in humans. The first sign of increased severity of TAA-induced encephalopathy is an increase in voltage in the delta band, which is evident in TAA600 group. However, a dose of 900 mg/kg TAA induced an encephalopathy that correlates with severe HE in humans, associated with the worst prognosis. Severe TAA-induced encephalopathy, accompanied by coma and relatively high mortality, was associated with an increase in delta band and a decrease in theta band representation together with a decrease in EEG voltage.
According to EEG manifestations, TAA in a dose of 900 mg/kg may be used as a suitable model for the investigation of pathogenetic mechanisms and possible therapeutical procedures in severe stages of HE.
Footnotes
Conflict of interest
The authors declared no conflicts of interest.
Funding
This work was supported by the Ministry of Education and Science of Serbia, grant no. 175032.