
Abstract
Lipopolysaccharide (LPS) may influence hepatic macrophages and autophagy. We evaluated the potential participation of macrophages and autophagosomes in thioacetamide (TAA)-induced rat liver injury under pretreatment of a low dose LPS (0.1 mg/kg BW, intraperitoneally; nonhepatotoxic dose). F344 rats were pretreated with LPS (LPS + TAA) or saline (TAA alone) at 24 hours before TAA injection (100 mg/kg BW, intraperitoneally); rats were examined on Days 0 (controls), 1, 2, and 3 after TAA injection. Data were compared between TAA alone and LPS + TAA rats. LPS pretreatment significantly reduced TAA-induced hepatic lesion (centrilobular necrosis with inflammation) on Days 1 and 2, being reflected by declined hepatic enzyme values and decreased number of apoptotic cells. LC3B-immunoreacting autophagosomes (as cytoplasmic fine granules) were significantly increased on Days 1 and 2 in hepatocytes of LPS + TAA rats. In LPS + TAA rats, hepatic macrophages reacting to CD68, CD163, and MHC class II mainly on Day 2 and mRNA levels of macrophage-related factors (MCP-1, IL-1β, and IL-4) on Day 1 were significantly decreased. Collectively, the low-dose LPS pretreatment might act as cytoprotection against TAA-induced hepatotoxicity through increased autophagosomes and decreased hepatic macrophages, although the dose/time-dependent cytoprotection of LPS should be further investigated at molecular levels.
Introduction
Lipopolysaccharide (LPS), known as endotoxin, is a constituent of the gram-negative bacterial cell wall. Exposure to a large amount of LPS (close to lethal dose), which may be caused by food poisoning such as colibacillosis, leads to extensive damage to the liver. 1 However, the liver may be routinely exposed to small amounts of LPS, mainly from gut microbiota through the portal venous blood. 1 The exposure of LPS may influence the degree of chemically induced hepatotoxicity.2-4 The detailed roles of LPS on hepatotoxicity remain to be investigated.
Macrophages participate in the pathology of chemically induced liver lesions; generally, M1-type macrophages act as tissue injury, whereas M2-type macrophages contribute to tissue remodeling.5-9 Hepatic macrophages in rats can be identified by immunohistochemistry with CD68 (for M1), CD163 (for M2), and MHC class II (for M1) antibodies. Functional properties of macrophages may be influenced by LPS, and thereafter, they may act as an influencer to hepatotoxicity. In addition, autophagy is a catabolic lysosomal degradation process.10-13 The autophagy in hepatocytes maintains cellular homeostasis and suppresses cell death by sequestering and degrading damaged proteins and organelles.14,15 Autophagy is characterized pathologically by the formation of double-membrane vesicles termed autophagosomes, demonstrable with LC3B (microtubule-associated protein 1 light chain 3 beta) immunohistochemistry.16,17 Activated autophagy may contribute to the development of liver diseases.18-20
A low dose of LPS may influence hepatic macrophages and autophagy in rat livers, resulting in the modulation of liver injury. Thioacetamide (TAA) is widely used as a hepatotoxicant which induces centrilobular coagulation necrosis of the liver 8 ; TAA is bio-activated in the liver by cytochrome P450 (CYP450) and flavin-containing mono-oxygenase systems to sulfine (sufoxide) and sulfene (sulfone) metabolites21,22; the metabolite interferes with the motion of RNA from the nucleus to the cytoplasm, resulting in cellular structural and functional deformation leading to membrane injury. In this study, we analyzed the appearance of hepatic macrophages and autophagosomes in TAA-induced acute liver injury under the pretreatment with a low-dose LPS (0.1 mg/kg body weight [BW]). The LPS pretreatment showed cytoprotection against the liver injury presumably through the decreased hepatic macrophages and increased autophagosomes, resulting in the reduction of hepatic injury caused by TAA.
Materials and Methods
Animals and Experimental Procedures
Thirty-two 5-week-old male F344 rats were obtained from Charles River (Hino, Shiga, Japan). Rats were maintained in a room under a controlled environment at 21 ± 3°C with a 12 hour light-dark cycle; they were fed a standard rodent chow (DC-8, CLEA Japan, Tokyo, Japan) and supplied with tap water ad libitum. After 1 week of acclimatization, rats were randomly divided into 2 groups: LPS-pretreated rats (as in the LPS + TAA, 16 rats) and saline-treated rats (as in the saline + TAA, 16 rats). In the LPS + TAA rats, LPS (Escherichia coli 055: B5; Sigma-Aldrich, St Louis, MO, USA) was injected intraperitoneally at a dose of 0.1 mg/kg BW; 24 hours after LPS injection, 16 rats were injected intraperitoneally once with TAA dissolved in saline (100 mg/kg BW; Wako Pure Chemicals, Osaka, Japan). In the saline + TAA rats, 16 rats received physiological saline instead of LPS and 24 hours later injected TAA. Four rats in each group were sacrificed on Day 0 (control; that is, saline injection for the saline + TAA rats, and LPS injection for the LPS + TAA rats; these control rats were sacrificed 30 minutes to 1 h after these injections), 1, 2, and 3 after TAA injection under deep isoflurane anesthesia. Blood samples were collected from the abdominal aorta and separated sera were subjected to biochemical assays for aspartate transaminase (AST), alanine transaminase (ALT), alkaline phosphatase (ALP), and total bilirubin (T. Bil) by SRL Inc. (Tokyo, Japan).
The dose of LPS and timing of TAA injection of 24 hours after LPS injection were determined based on preliminary experiments; rats injected with 0.1 mg/kg BW of LPS did not show any significant changes for 24 hours in serum hepatic enzymes such as AST and ALT or histopathological findings. Rats were pretreated with 0.1 mg/kg BW of LPS and then injected with TAA (100 mg/kg BW) at 2, 6, 12, and 24 hours after LPS injection; the results showed time-dependent reduction (particularly, at 12 and 24 hours) of hepatic lesions at 1 day after TAA injection, in comparison with hepatic lesions induced by TAA alone without LPS pretreatment.
The animal experiments were conducted under the institutional guidelines approved by the ethical committee of Osaka Prefecture University for the Care and Use of Experimental Animals (Nos. 25-85, 27-103, and 19-51).
Histopathology and Immunohistochemistry
Liver tissues were fixed in 10% neutral buffered formalin (NBF) and periodate-lysine-paraformaldehyde (PLP) solution processed by PLP-AMeX (acetone, methyl benzoate, and xylene) method. 23 Neutral buffered formalin-fixed tissues were dehydrated and embedded in paraffin and sectioned at 3 to 4 µm in thickness. The deparaffinized sections were stained with hematoxylin and eosin (HE) for histopathological examination. The area of centrilobular necrosis induced by TAA was measured by Image J software. Five randomly selected areas with centrilobular necrosis were analyzed in each animal; the methods have been used in our previous studies.6-8
Tissue sections fixed in PLP were used in immunohistochemistry with mouse monoclonal antibodies specific for CD68 (clone ED1, 1:500, AbD Serotec, Oxford, UK), CD163 (clone ED2, 1:300, AbD Serotec, Oxford, UK), MHC class II (clone OX6, 1:1,000, AbD Serotec, Oxford, UK), and rabbit polyclonal antibody specific for LC3B (1:2,000, Sigma-Aldrich Co., MO, USA). After deparaffinization, for antigen retrieval, sections were pretreated by microwaving for 20 min in citrate buffer (pH 6.0) for CD68, MHC class II, and LC3B; sections for CD163 were pretreated by proteinase K (100 µg/mL) for 10 min at room temperature. Then, the tissue sections were stained by Histostainer (Histofine, Nichirei Bioscience Inc., Tokyo, Japan). Briefly, sections were incubated with 5% skimmed milk for 10 min, followed by a 1-hour incubation with primary antibodies. After treatment with 3% H2O2 for 15 min, horseradish peroxidase-conjugated secondary antibody (Histofine simple stain MAX PO®; Nichirei Bioscience Inc.) was applied for 30 min. Then, they were incubated with 3, 3’-diaminobenzidine (DAB) (Nichirei Bioscience Inc.) for 5 min. Sections were counterstained with hematoxylin for 1 min. For negative controls, tissue sections were treated with mouse or rabbit nonimmunized IgG instead of the primary antibody. Cells expressing CD163, CD68, and MHC class II were counted per 40 × field in randomly selected 5 perivenular areas. Cytoplasmic LC3B-positive granules within hepatocytes were counted more than 100 hepatocytes in randomly selected 5 perivenular areas of the liver.
Terminal Deoxyribonucleotide Transferase (TdT)-Mediated Deoxyuridine Triphosphate Nick End Labeling (TUNEL)
A standard in situ TUNEL method (Appop Tag® Peroxidase In situ Apoptosis Detection Kit, Millipore, Bedford, USA) was used for detection of DNA fragmentation in the apoptotic cells according to manufacturer’s instructions. Neutral buffered formalin-fixed and deparaffinized tissue sections were treated with proteinase K (100 µg/ml) for 20 min, and then, with 3% H2O2 for 20 min to inactivate endogenous peroxidases. Afterward, the sections were incubated with TdT enzyme and digoxigenin DNA labeling mixture in TdT reaction buffer for 60 min at 37°C. Then, the sections were treated with horseradish peroxidase-conjugated anti-digoxigenin for 60 min at room temperature. The sections were visualized with DAB (Nichirei Bioscience Inc.). Negative control sections were incubated with distilled water instead of the TdT enzyme. The number of TUNEL-positive cells was counted per 40 × field and compared with the total number of hepatocytes.
Reverse Transcriptase Polymerase Chain Reaction (RT-PCR)
Total RNA was extracted from the liver tissues using an SV total RNA isolation system (Promega, Madison, WI, USA) according to the manufacturer’s instructions. Two and a half micrograms of total RNA were reverse-transcribed with Superscript VILO reverse transcriptase (Life Technologies, CA, USA). Real-time PCR was performed using TaqMan gene expression assays (Life Technologies, Carlsbad, CA, USA) in a PikoReal Real-Time 96 PCR System (Thermo Scientific, CA, Massachusetts, USA). The TaqMan probes used are listed in Table 1. The mRNA expression was normalized to that of 18s rRNA. The data were analyzed using the comparative Ct method (ΔΔCt method).
Primers used in the real-time PCR.
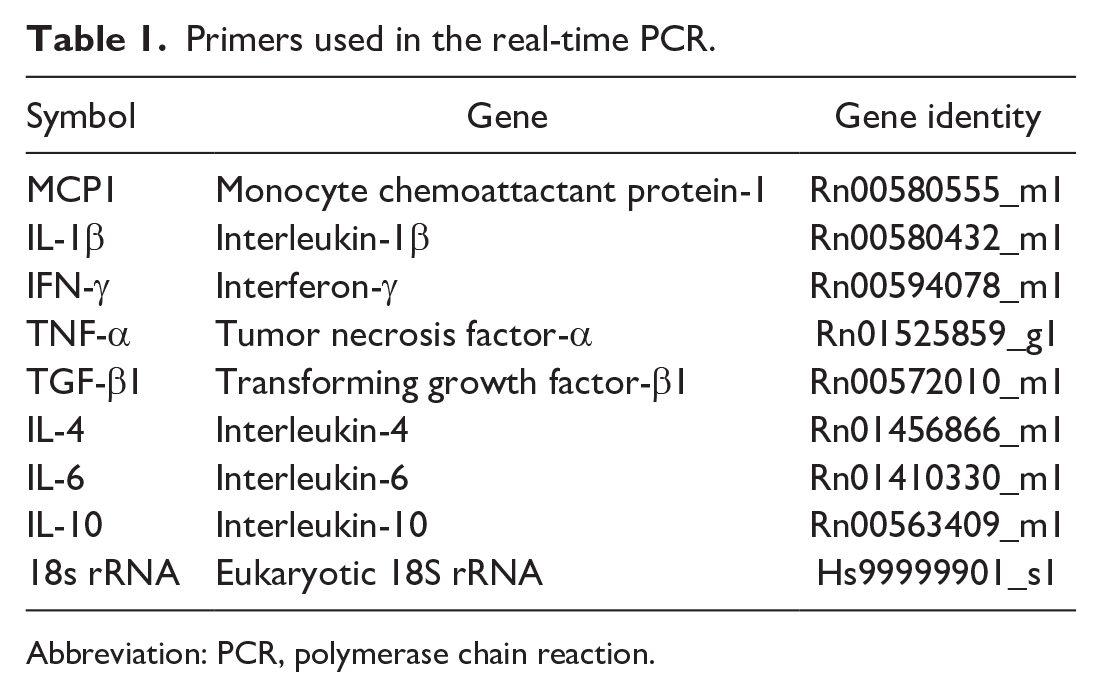
Abbreviation: PCR, polymerase chain reaction.
Statistical Evaluation
Data obtained were expressed as mean ± standard deviation (SD). Statistical analysis was performed using the Tukey-Kramer test. Significance was considered at P < .05.
Results
Reduction of Hepatic Lesions Induced by TAA Under LPS Pretreatment
In HE-stained sections, no histopathological lesions were seen in livers on day 0 in the saline + TAA and LPS + TAA rats (Figures 1A and B); and, there were no differences in controls between the saline + TAA and LPS + TAA rats, although the LPS + TAA rats were pretreated with LPS. Liver lesions were seen on Day 1 after TAA injection (Figures 1C and D); in the saline + TAA rats, TAA-induced hepatic lesions were characterized by extensive coagulation necrosis of hepatocytes and inflammatory cell infiltrate mainly in the centrilobular regions (Figure 1C); interestingly, the centrilobular lesions were significantly smaller in size in the LPS + TAA rats than in the saline + TAA rats (Figure 1D, I). Inflammatory cells in the centrilobular lesions in both groups were mainly macrophages, as demonstrated below by immunohistochemistry and mentioned in our previous studies6,8, although a few lymphocytes may be seen in the lesions. On Day 2, the histological changes became more intensive in the saline + TAA rats (Figure 1E), whereas such lesions were much less in the LPS + TAA rats (Figure 1F, I). In the saline + TAA rats, on Day 3, the hepatic lesions started to recover, being replaced by regenerating hepatocytes (Figure 1G), whereas the centrilobular lesions completely disappeared in the LPS + TAA rats (Figure 1H, I). Collectively, the centrilobular lesions on Days 1 and 2 induced by TAA were statistically smaller in the LPS + TAA rats than in the saline + TAA rats (Figure 1I).
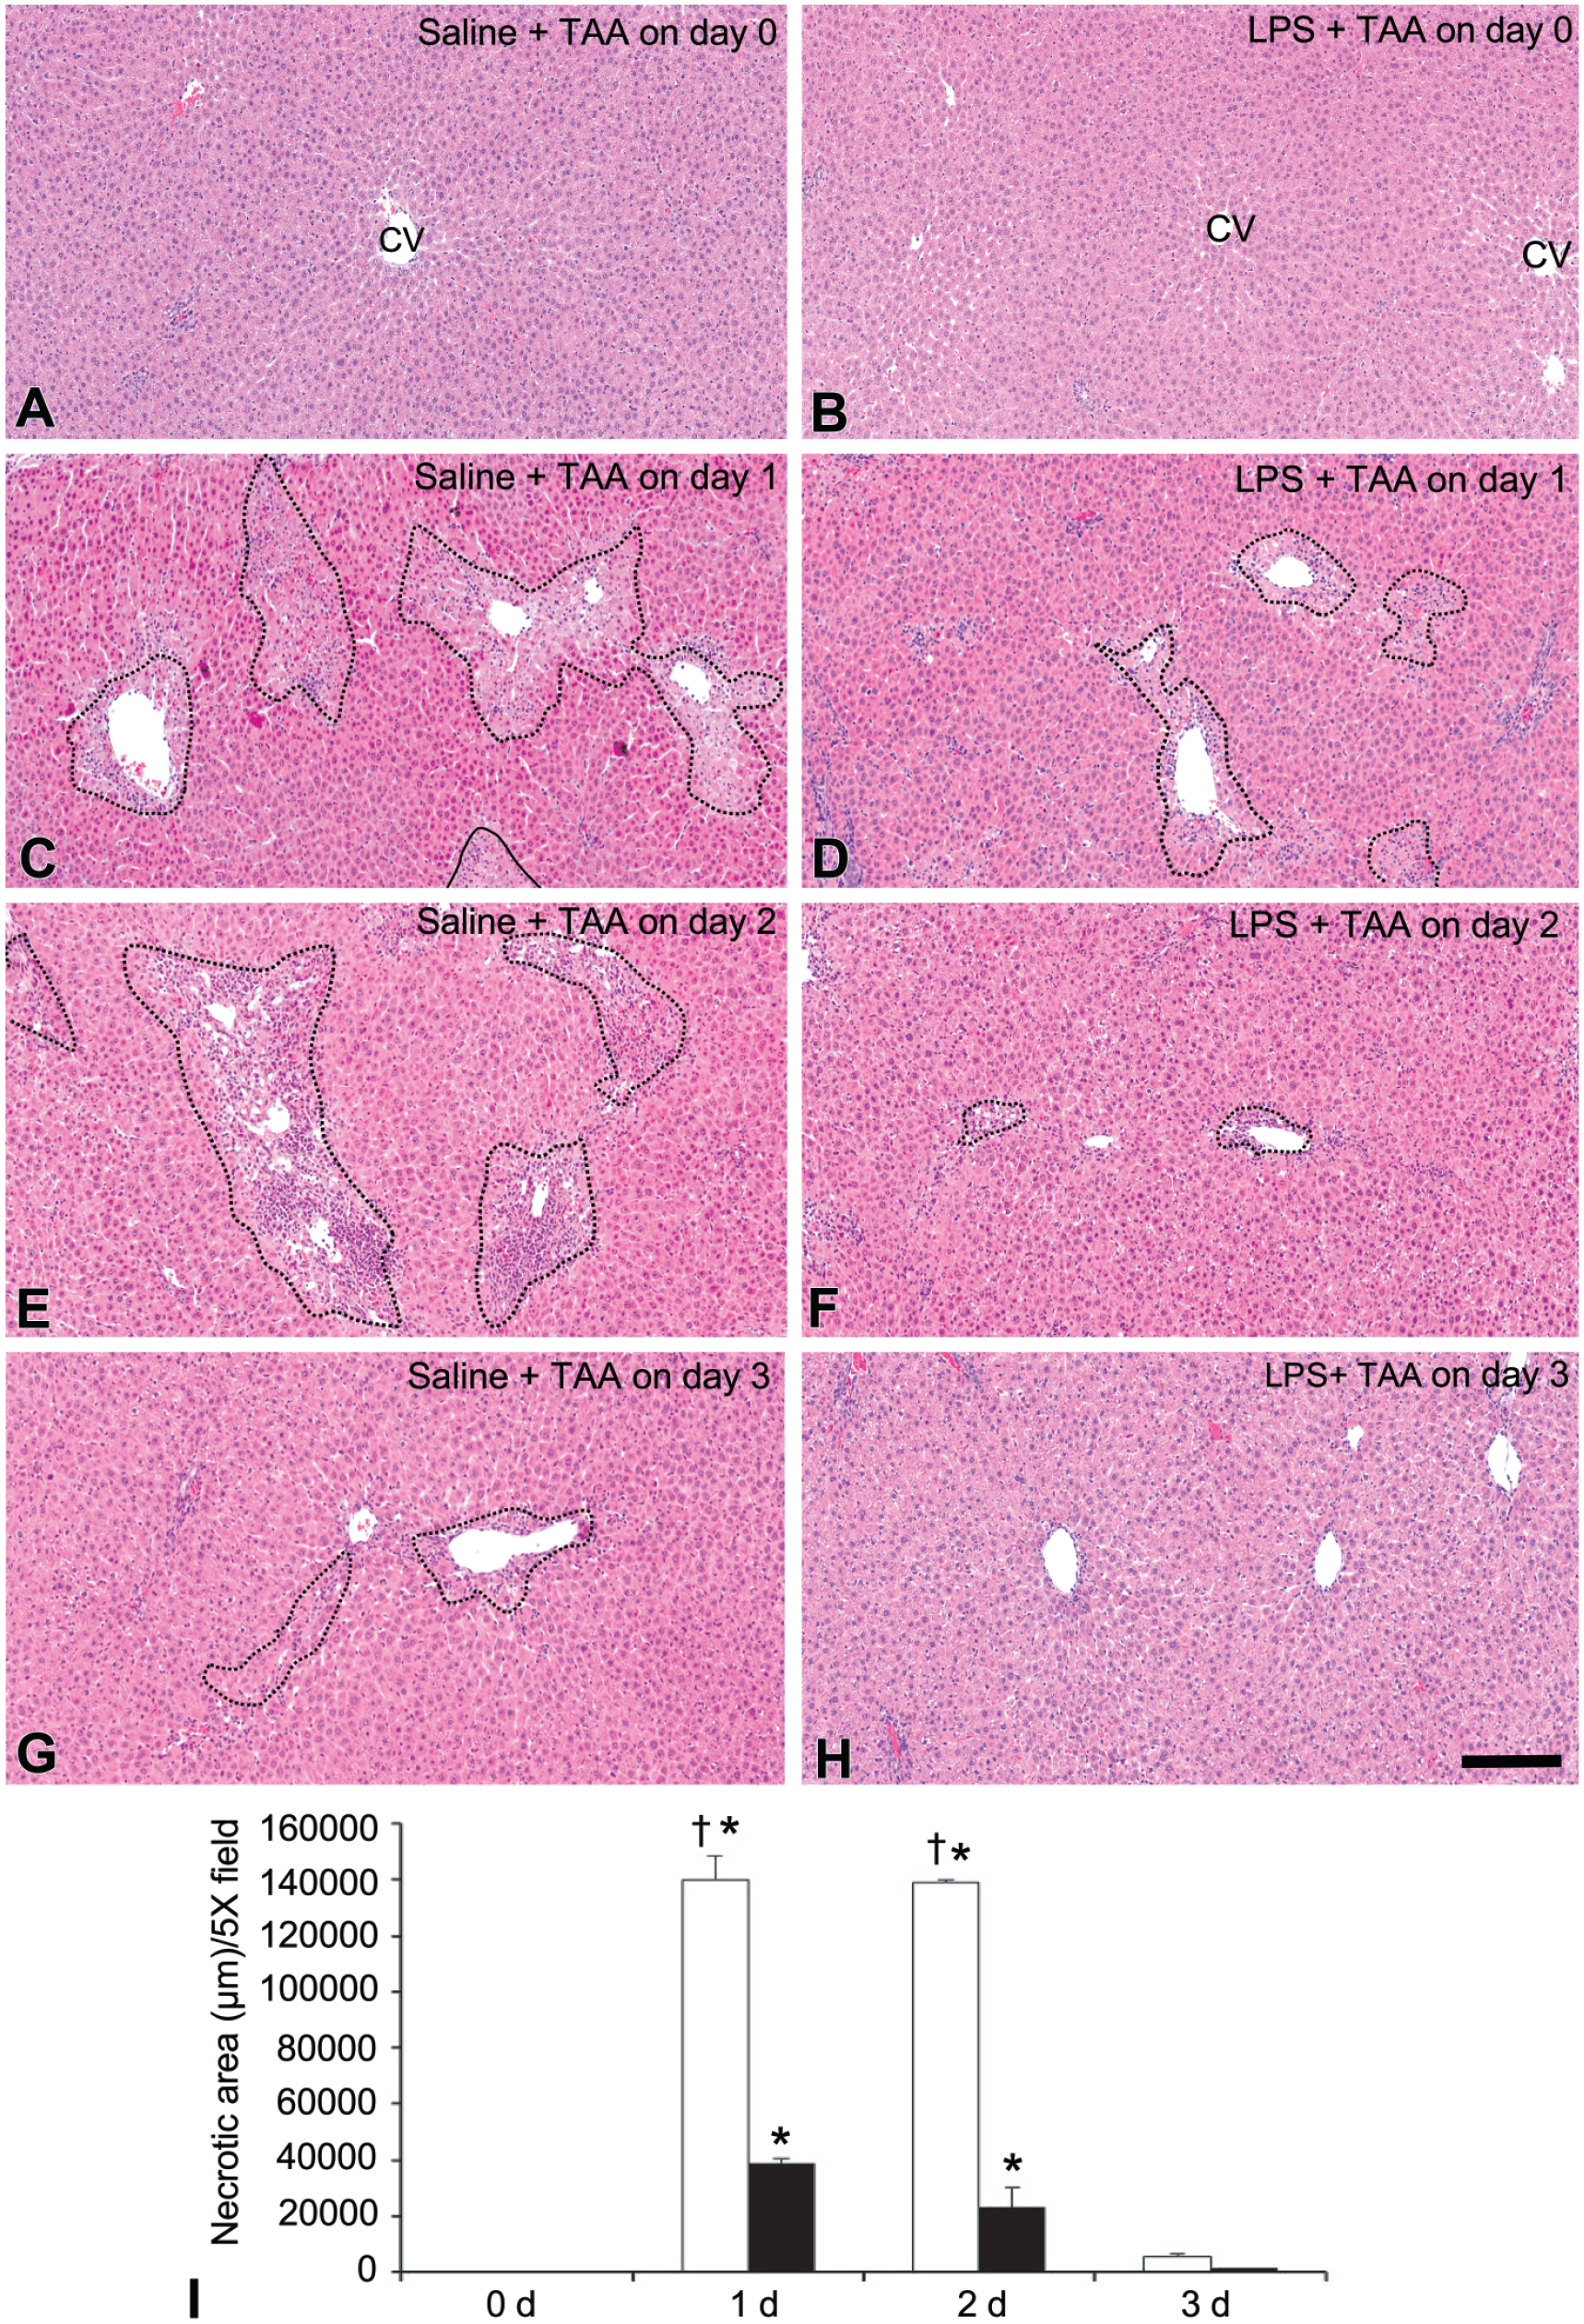
A-H: Histopathology of livers in the saline + thioacetamide (TAA) and lipopolysaccharide (LPS) + TAA rats. The hepatic architecture on Day 0 is normal in the saline + TAA (A) and LPS + TAA (B) rats. On Days 1 and 2, coagulation necrosis with inflammation is seen in the centrilobular area in the saline + TAA rats (C, E) and LPS + TAA rats (D, F), and the affected area is reduced in the LPS + TAA rats (D, F). The lesions are recovered or disappeared on Day 3 in the saline + TAA (G) and LPS + TAA rats (H), respectively. I: the quantitative analysis of the affected centrilobular area in the saline + TAA (□) and LPS + TAA (■) rats.
In controls between the saline + TAA and LPS + TAA rats, there were no significant changes in hepatic enzymes measured (Figure 2), although the LPS + TAA rats were pretreated with LPS. The values of AST, ALT, and ALP showed a significant increase on Day 1 after TAA injection both in the saline + TAA and LPS + TAA rats (Figure 2A-C), indicating that TAA induced hepatic lesions on Day 1. In comparison between the saline + TAA and LPS + TAA rats on Day 1; however, the values of AST, ALT, and ALP were significantly decreased in the LPS + TAA rats (Figure 2A-C). T. Bil value was increased significantly both in the saline + TAA and LPS + TAA rats on Day 1, and the value in the saline + TAA rats remained increased up to Day 2, indicating the prolonged liver injury in the saline + TAA rats (Figure 2D). However, the value of T. Bil on Days 1 and 2 was significantly decreased in the LPS + TAA rats, in contrast to that in the saline + TAA rats (Figure 2D).
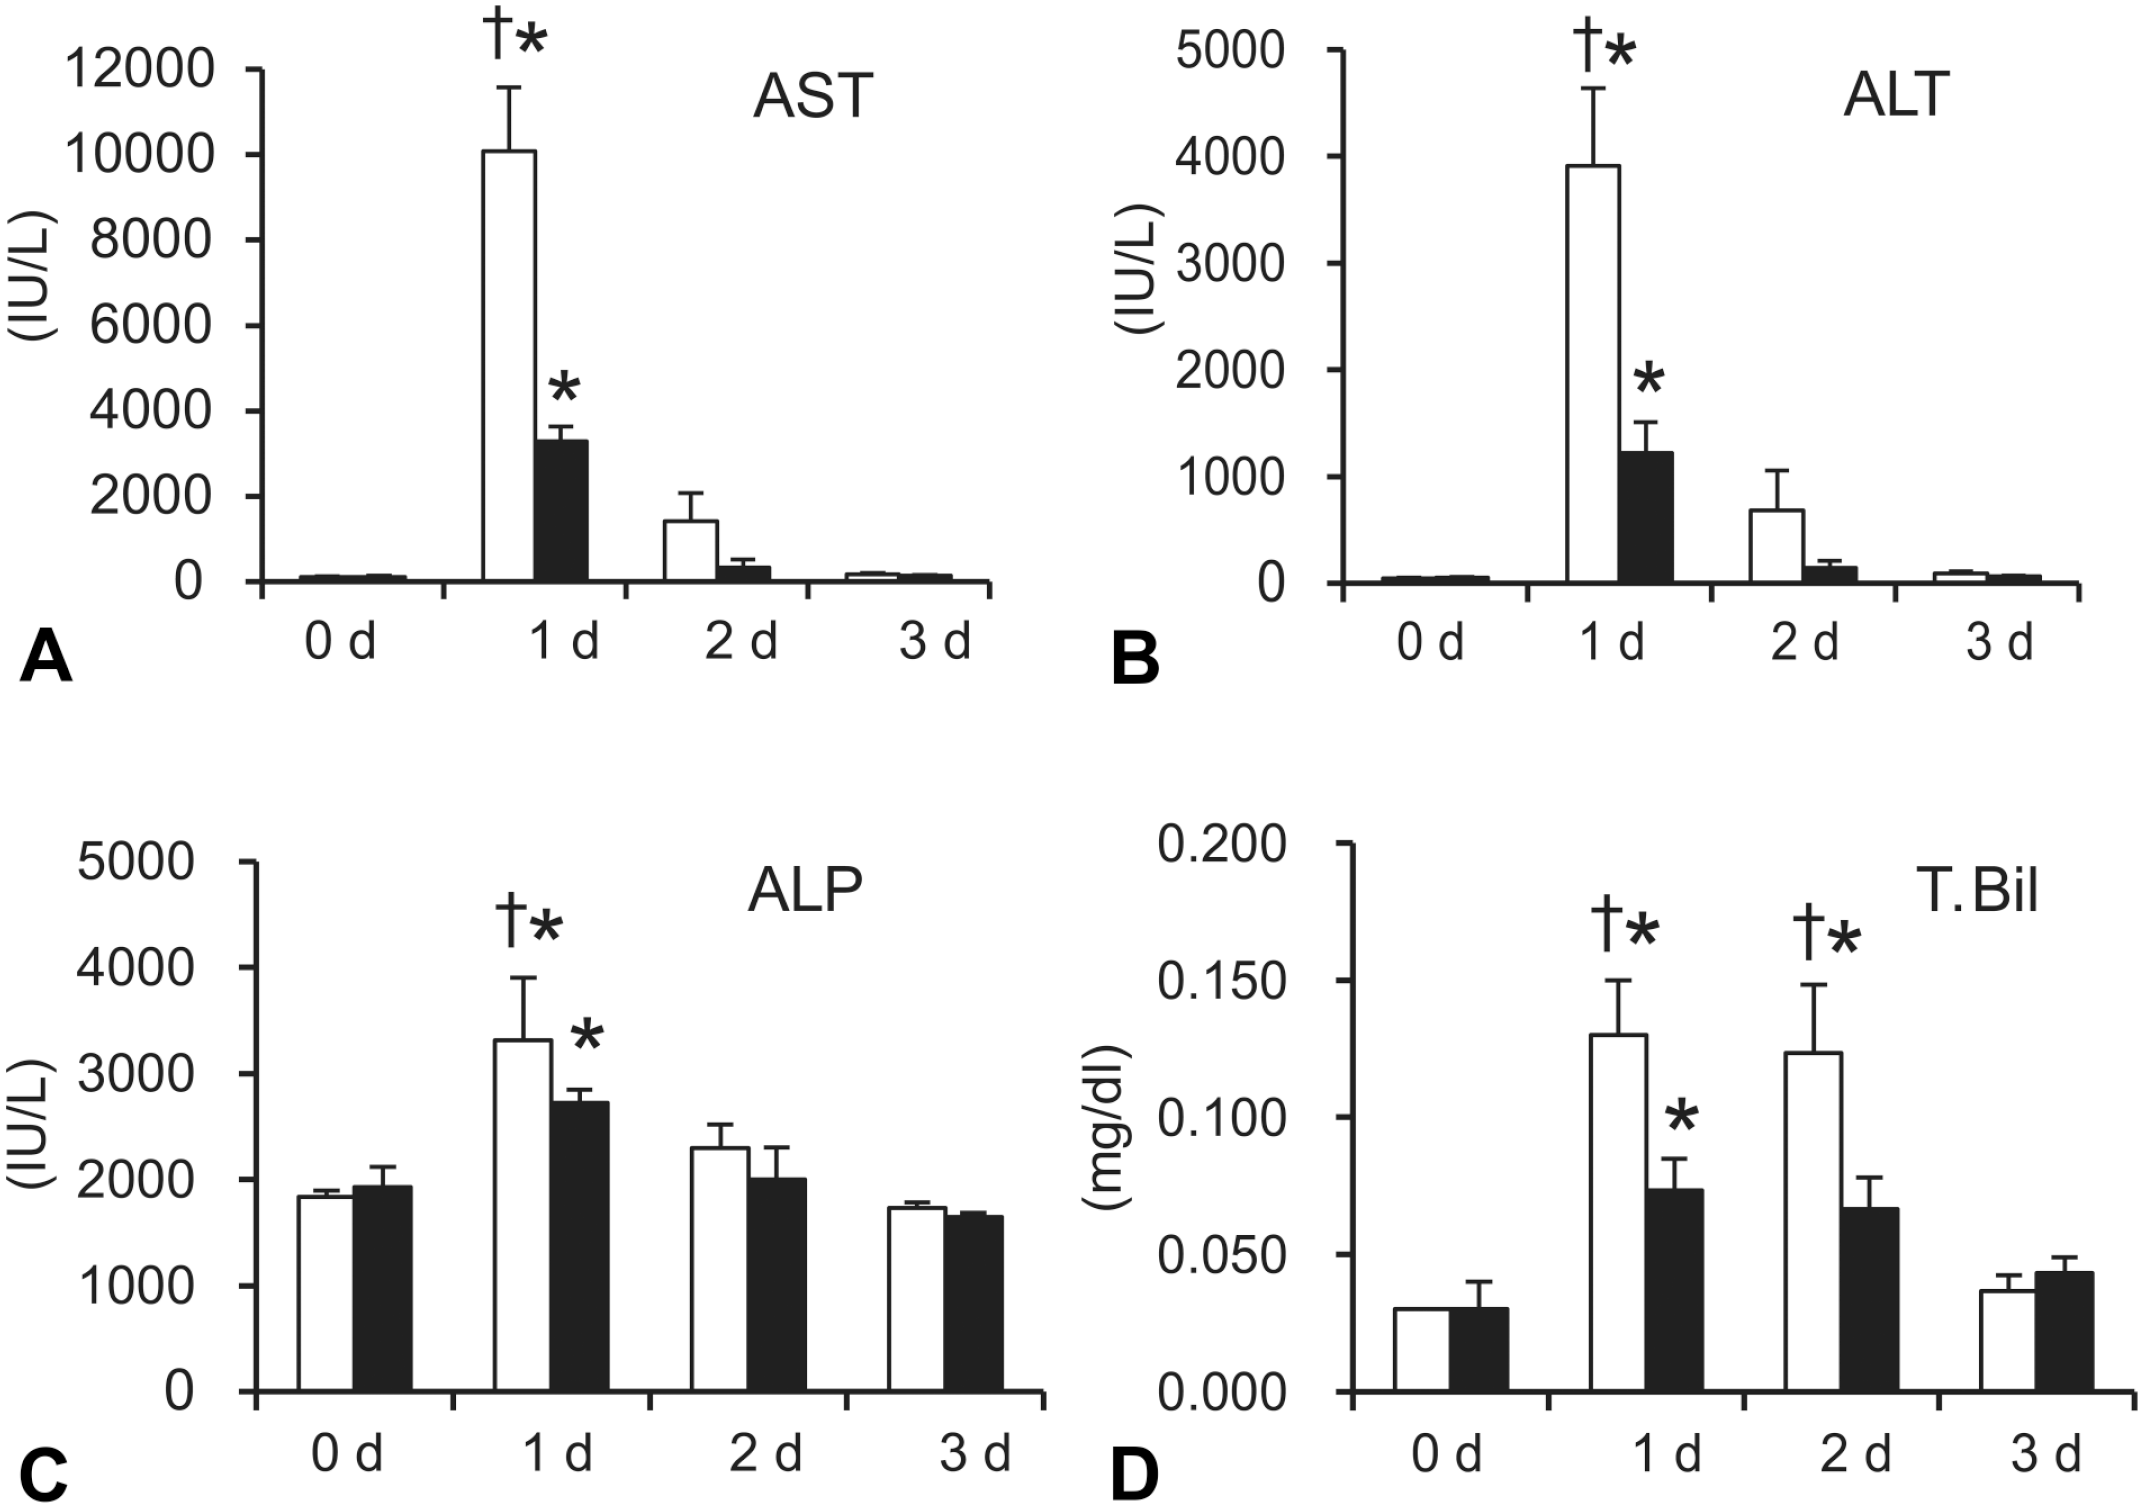
A-D: Blood biochemical analyses in the saline + TAA and LPS + TAA rats. The values of aspartate transaminase (AST) (A), alanine transaminase (ALT) (B), alkaline phosphatase (ALP) (C), and total bilirubin (T. Bil) (D) are shown.
Collectively, the values of hepatic enzymes showing a significant decrease in the LPS + TAA rats reflected histopathological findings in that the centrilobular lesions on Days 1 and 2 induced by TAA were significantly smaller in the LPS + TAA rats than those in the saline + TAA rats.
Activation of Autophagy in LPS-Pretreated TAA-Induced Liver Injury
LC3B-positive cytoplasmic granules in hepatocytes were seen at the basal level on Day 0 in the saline + TAA rats (Figure 3A). The number of cytoplasmic granules in hepatocytes on Day 0 was greater in the LPS + TAA rats than in the saline + TAA rats, showing a significant difference (Figure 3A, B and I); that is, the LPS pretreatment quickly increased cytoplasmic autophagosomes in hepatocytes in the LPS + TAA rats (sacrificed at 30 min to 1 h after LPS injection). Following TAA injection, on Days 1 to 3, the granular expressions to LC3B in hepatocytes were increased both in the saline + TAA and LPS + TAA rats (Figure 3C-H), which were localized mainly within and around the centrilobular necrotic areas. However, such cytoplasmic granules were significantly increased on Days 1 and 2 in the LPS + TAA rats as compared with those in the saline + TAA rats (Figure 3I). Interestingly, on Days 2 and 3, the areas of hepatocytes with LC3B-labeled cytoplasmic granules were much smaller in the LPS + TAA rats than in the saline + TAA rats (Figure 3F, H) because injured regions were less in the LPS + TAA rats (Figure 1I).
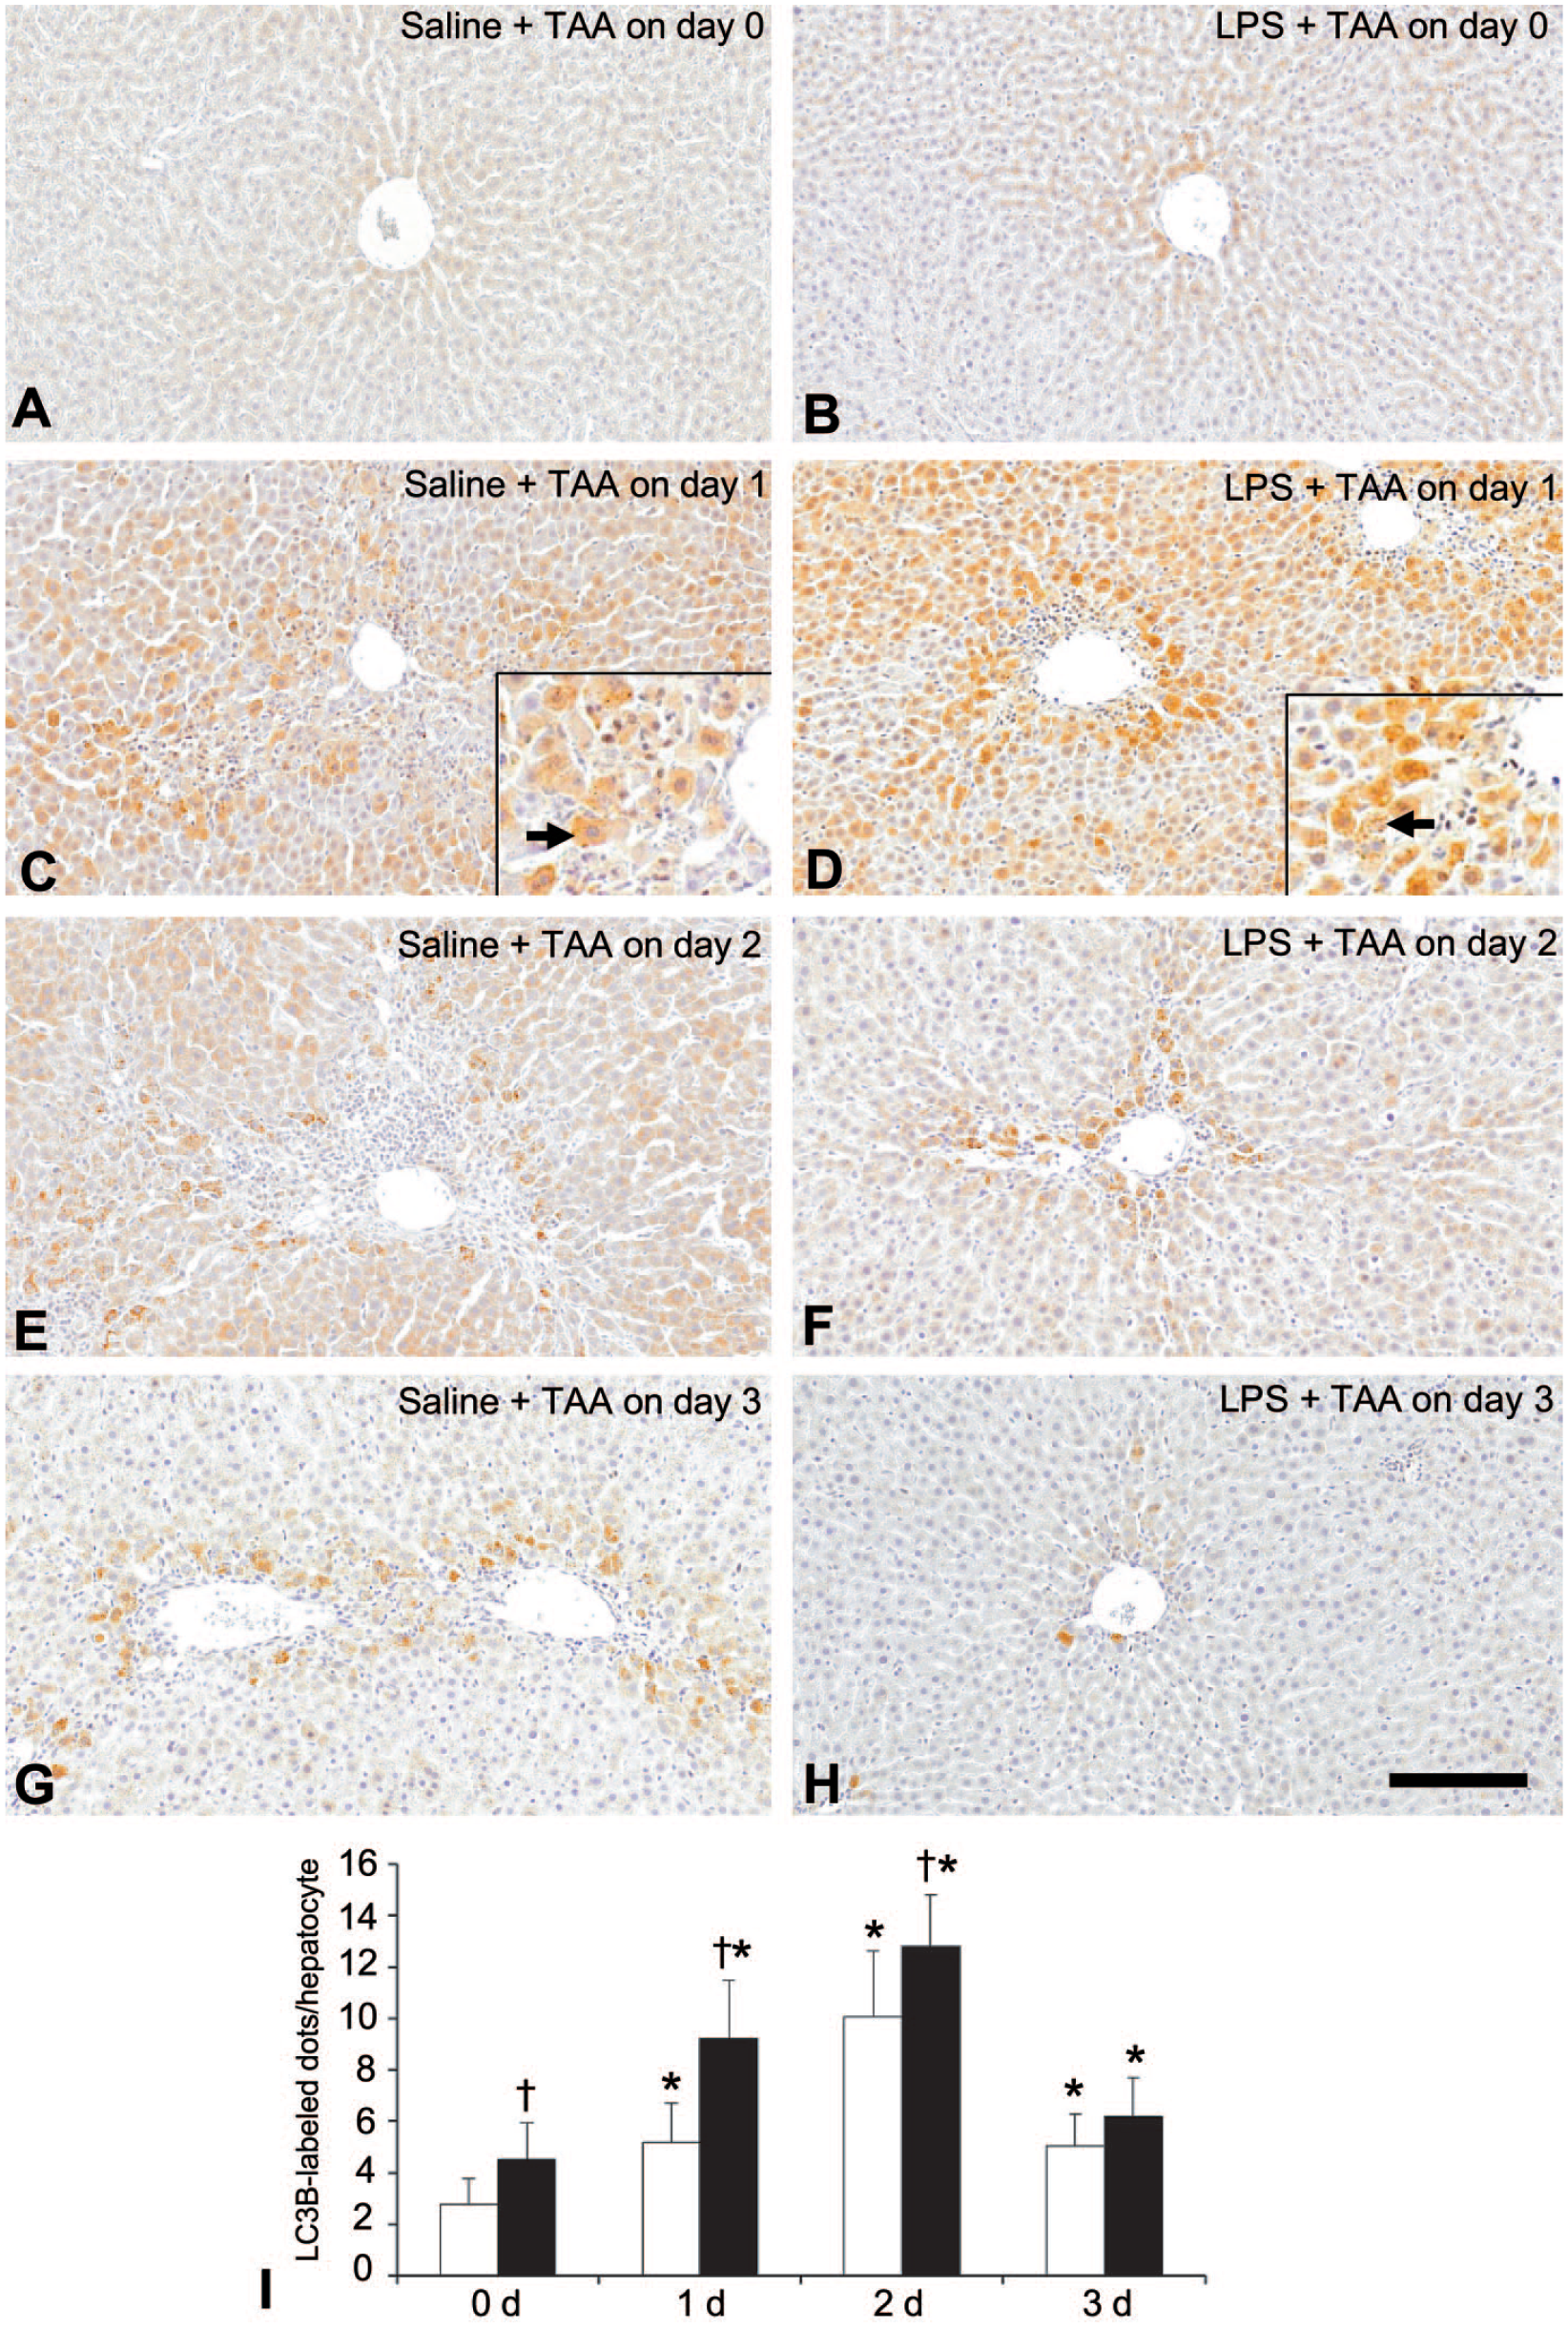
A-H: LC3B immunohistochemistry of livers in the saline + TAA and LPS + TAA rats. The basal level of LC3B expression as fine granules is seen particularly in hepatocytes of the centrilobular area; interestingly, the immunoreactivity is significantly increased in the LPS + TAA rats (B) to contrast to the saline + TAA rats (A) on Day 0 (I). On Days 1 and 2 (I), the granular expression of LC3B is increased in the saline + TAA (C, E) and the expression level is more prominent in the LPS + TAA rats (D, F); insets in C and D show LC3B-positive cells with fine granules (arrow) at the higher magnification. The expression level as LC3B-reacting fine granules on Day 3 is declined according to the reduction of the affected area in the saline + TAA (G) and LPS + TAA (H) rats. I: Quantitative analysis of LC3B-labeled fine granules in hepatocytes in the saline + TAA (□) and LPS + TAA (■) rats.
Reduction of Apoptosis in LPS-Pretreated TAA-Induced Liver Injury
Apoptotic cells, demonstrable with the TUNEL method, were absent in livers on Day 0 in the saline + TAA and LPS + TAA rats (Figure 4A, B); that is, the LPS pretreatment did not induce cell death. In the saline + TAA rats, a number of apoptotic hepatocytes were seen within or around the centrilobular necrotic areas on Days 1 (with the greatest number) and 2 (Figure 4C, E), showing a significant increase to controls (Figure 4G). In the LPS + TAA rats, although the apoptotic cells were significantly increased on Day 1 (Figure 4D, I) in contrast to controls, the number was significantly decreased as compared with that in the saline + TAA rats on Day 1 (Figure 4I). The reduction of TAA-induced hepatic lesions by the pretreatment with LPS was reflected by the decreased number of apoptotic hepatocytes, in particular on Day 1.
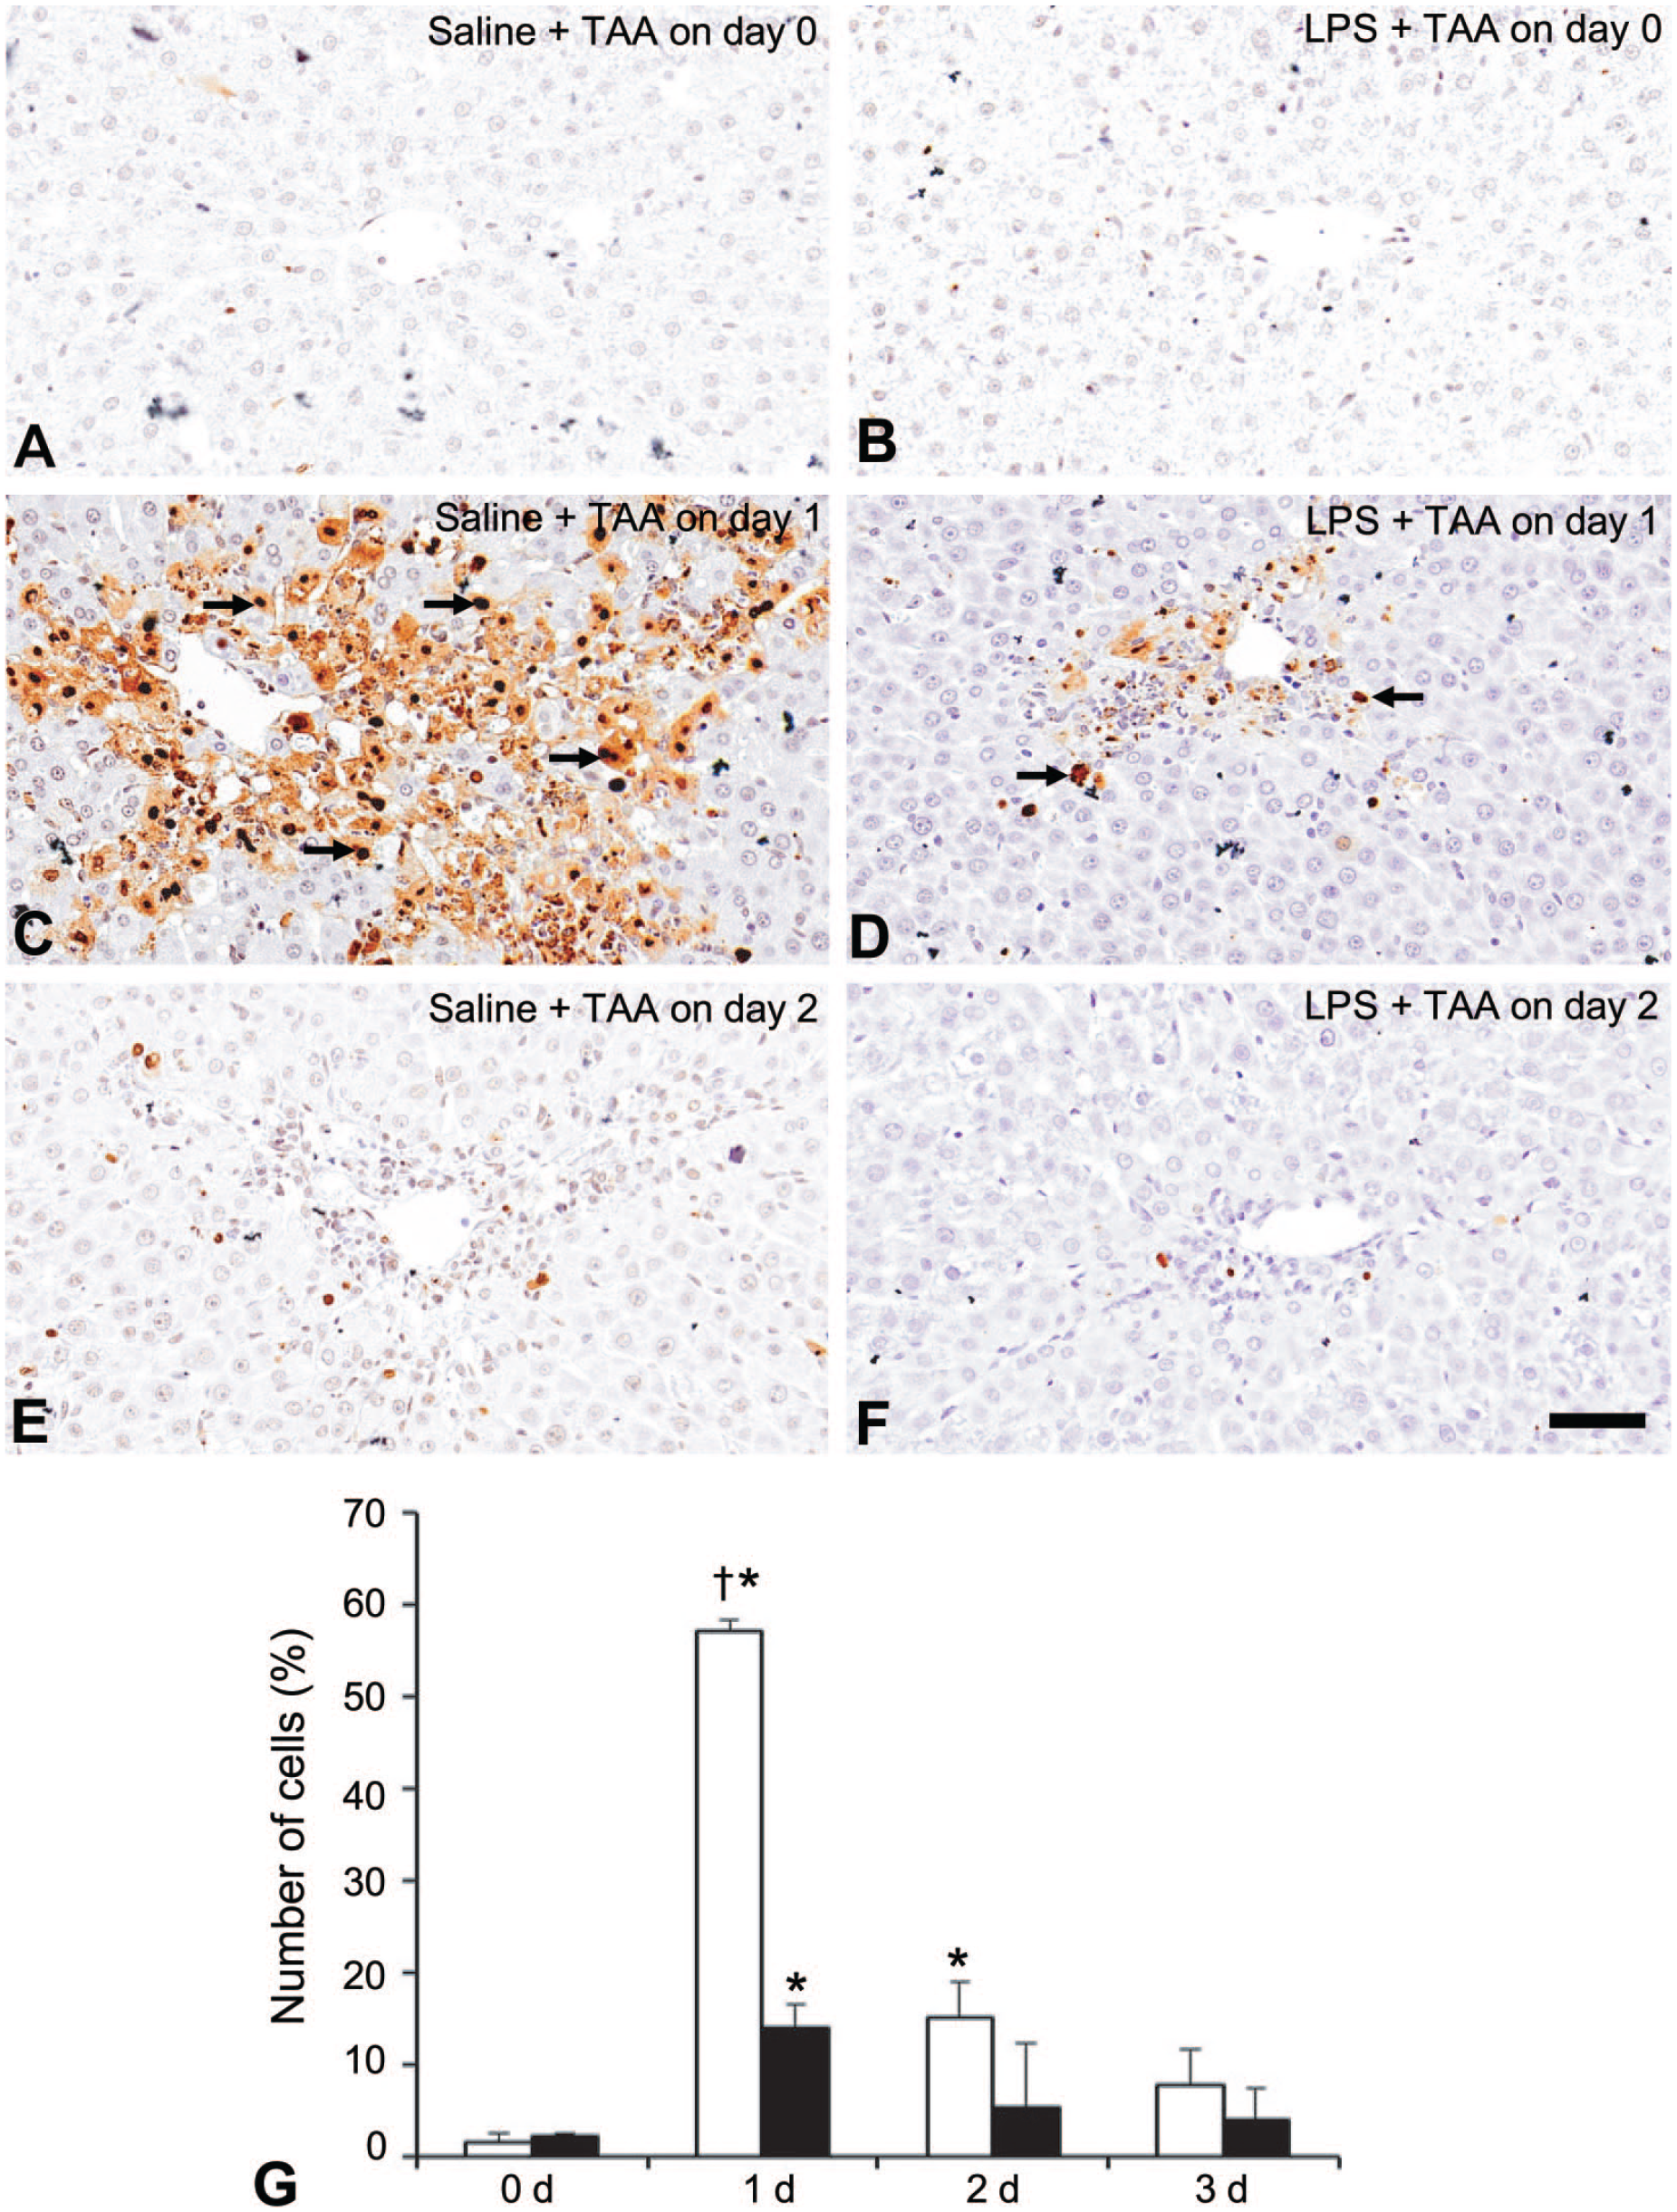
A-F: The TUNEL staining (for apoptosis) of livers in the saline + TAA (A, C, E) and LPS + TAA (B, D, F) rats. On day 1, a number of apoptotic cells are seen within or around the centrilobular affected areas in the saline + TAA rats (C) and the appearance is less in numbers in the LPS + TAA rats (D). G: Quantitative analysis of numbers of apoptotic cells in the saline + TAA (□) and LPS + TAA (■) rats.
Hepatic Macrophages in LPS-Pretreated TAA-Induced Liver Injury
Macrophages reacting to CD68, CD163, and MHC class II were seen in the control liver of the saline + TAA rats at the basal levels (Figure 5A-C). Following TAA-injection, the numbers of CD68+, CD163+, and MHC class II+ macrophages were significantly increased on Days 1 to 3 in the LPS + TAA and saline + TAA rats (Figure 5A-C). The appearance of macrophages has been reported in hepatic lesions induced by TAA.6,8 Interestingly, in the LPS + TAA rats, CD68+, CD163+, and MHC class II+ macrophages were significantly decreased on Day 2 as compared with those in the saline + TAA rats, and MHC class II+ macrophages were also decreased significantly on day 1 (Figure 5A-C). Macrophages reacting to CD68 (Figure 6A-F), CD163 (Figure 6G-L), and MHC class II (Figure 6M-R) in the affected centrilobular areas on Days 1, 2, and 3 in the saline + TAA and LPS + TAA rats were shown in Figure 6. CD68+ cells (Figure 6A-F) were mainly small round in shape, whereas cells reacting to CD163 (Figure 6G-L) and MHC class (Figure 6M-R) showed spindle-shaped and polygonal morphology.
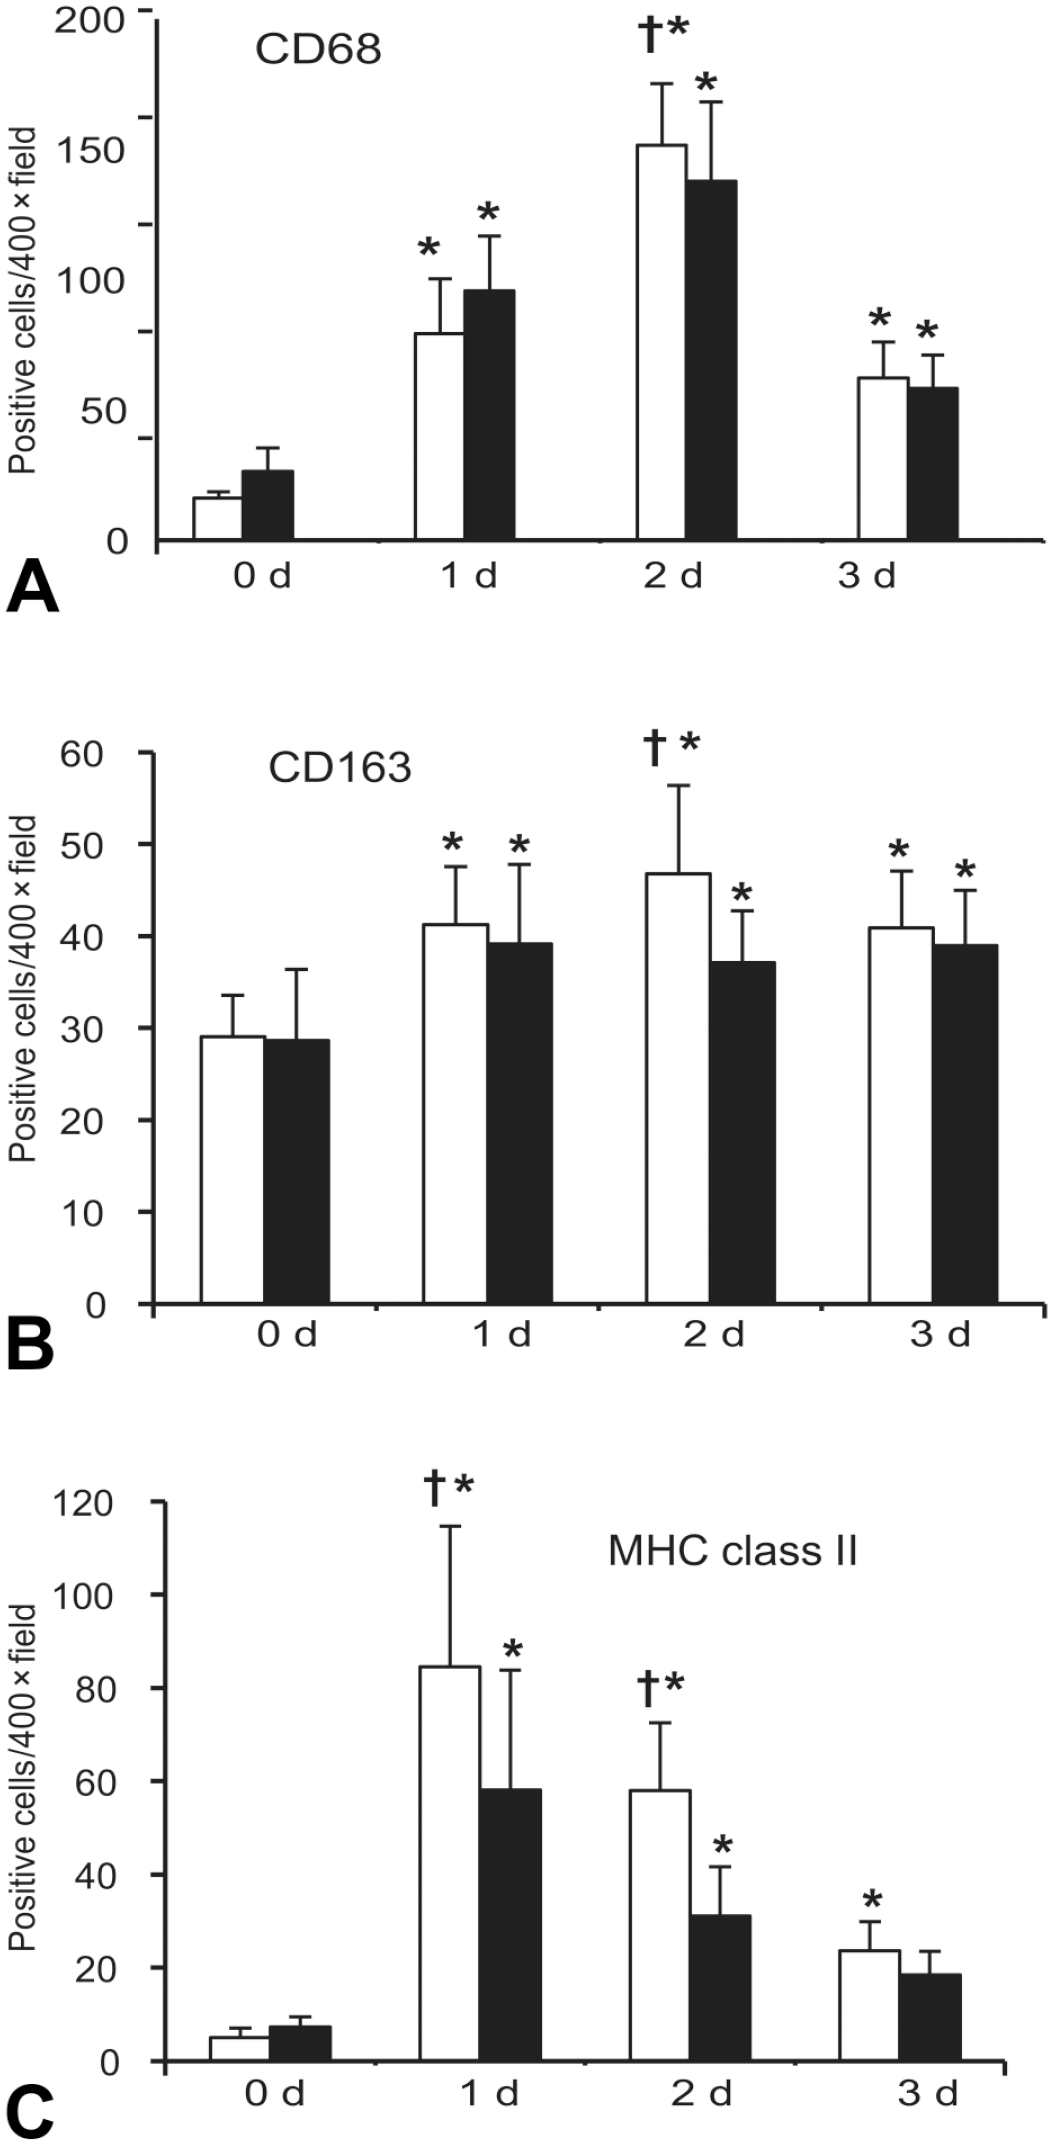
The kinetics of hepatic macrophages reacting to CD68 (A), CD163 (B), and MHC class II (C) in the saline + TAA (□) and LPS + TAA (■) rats.
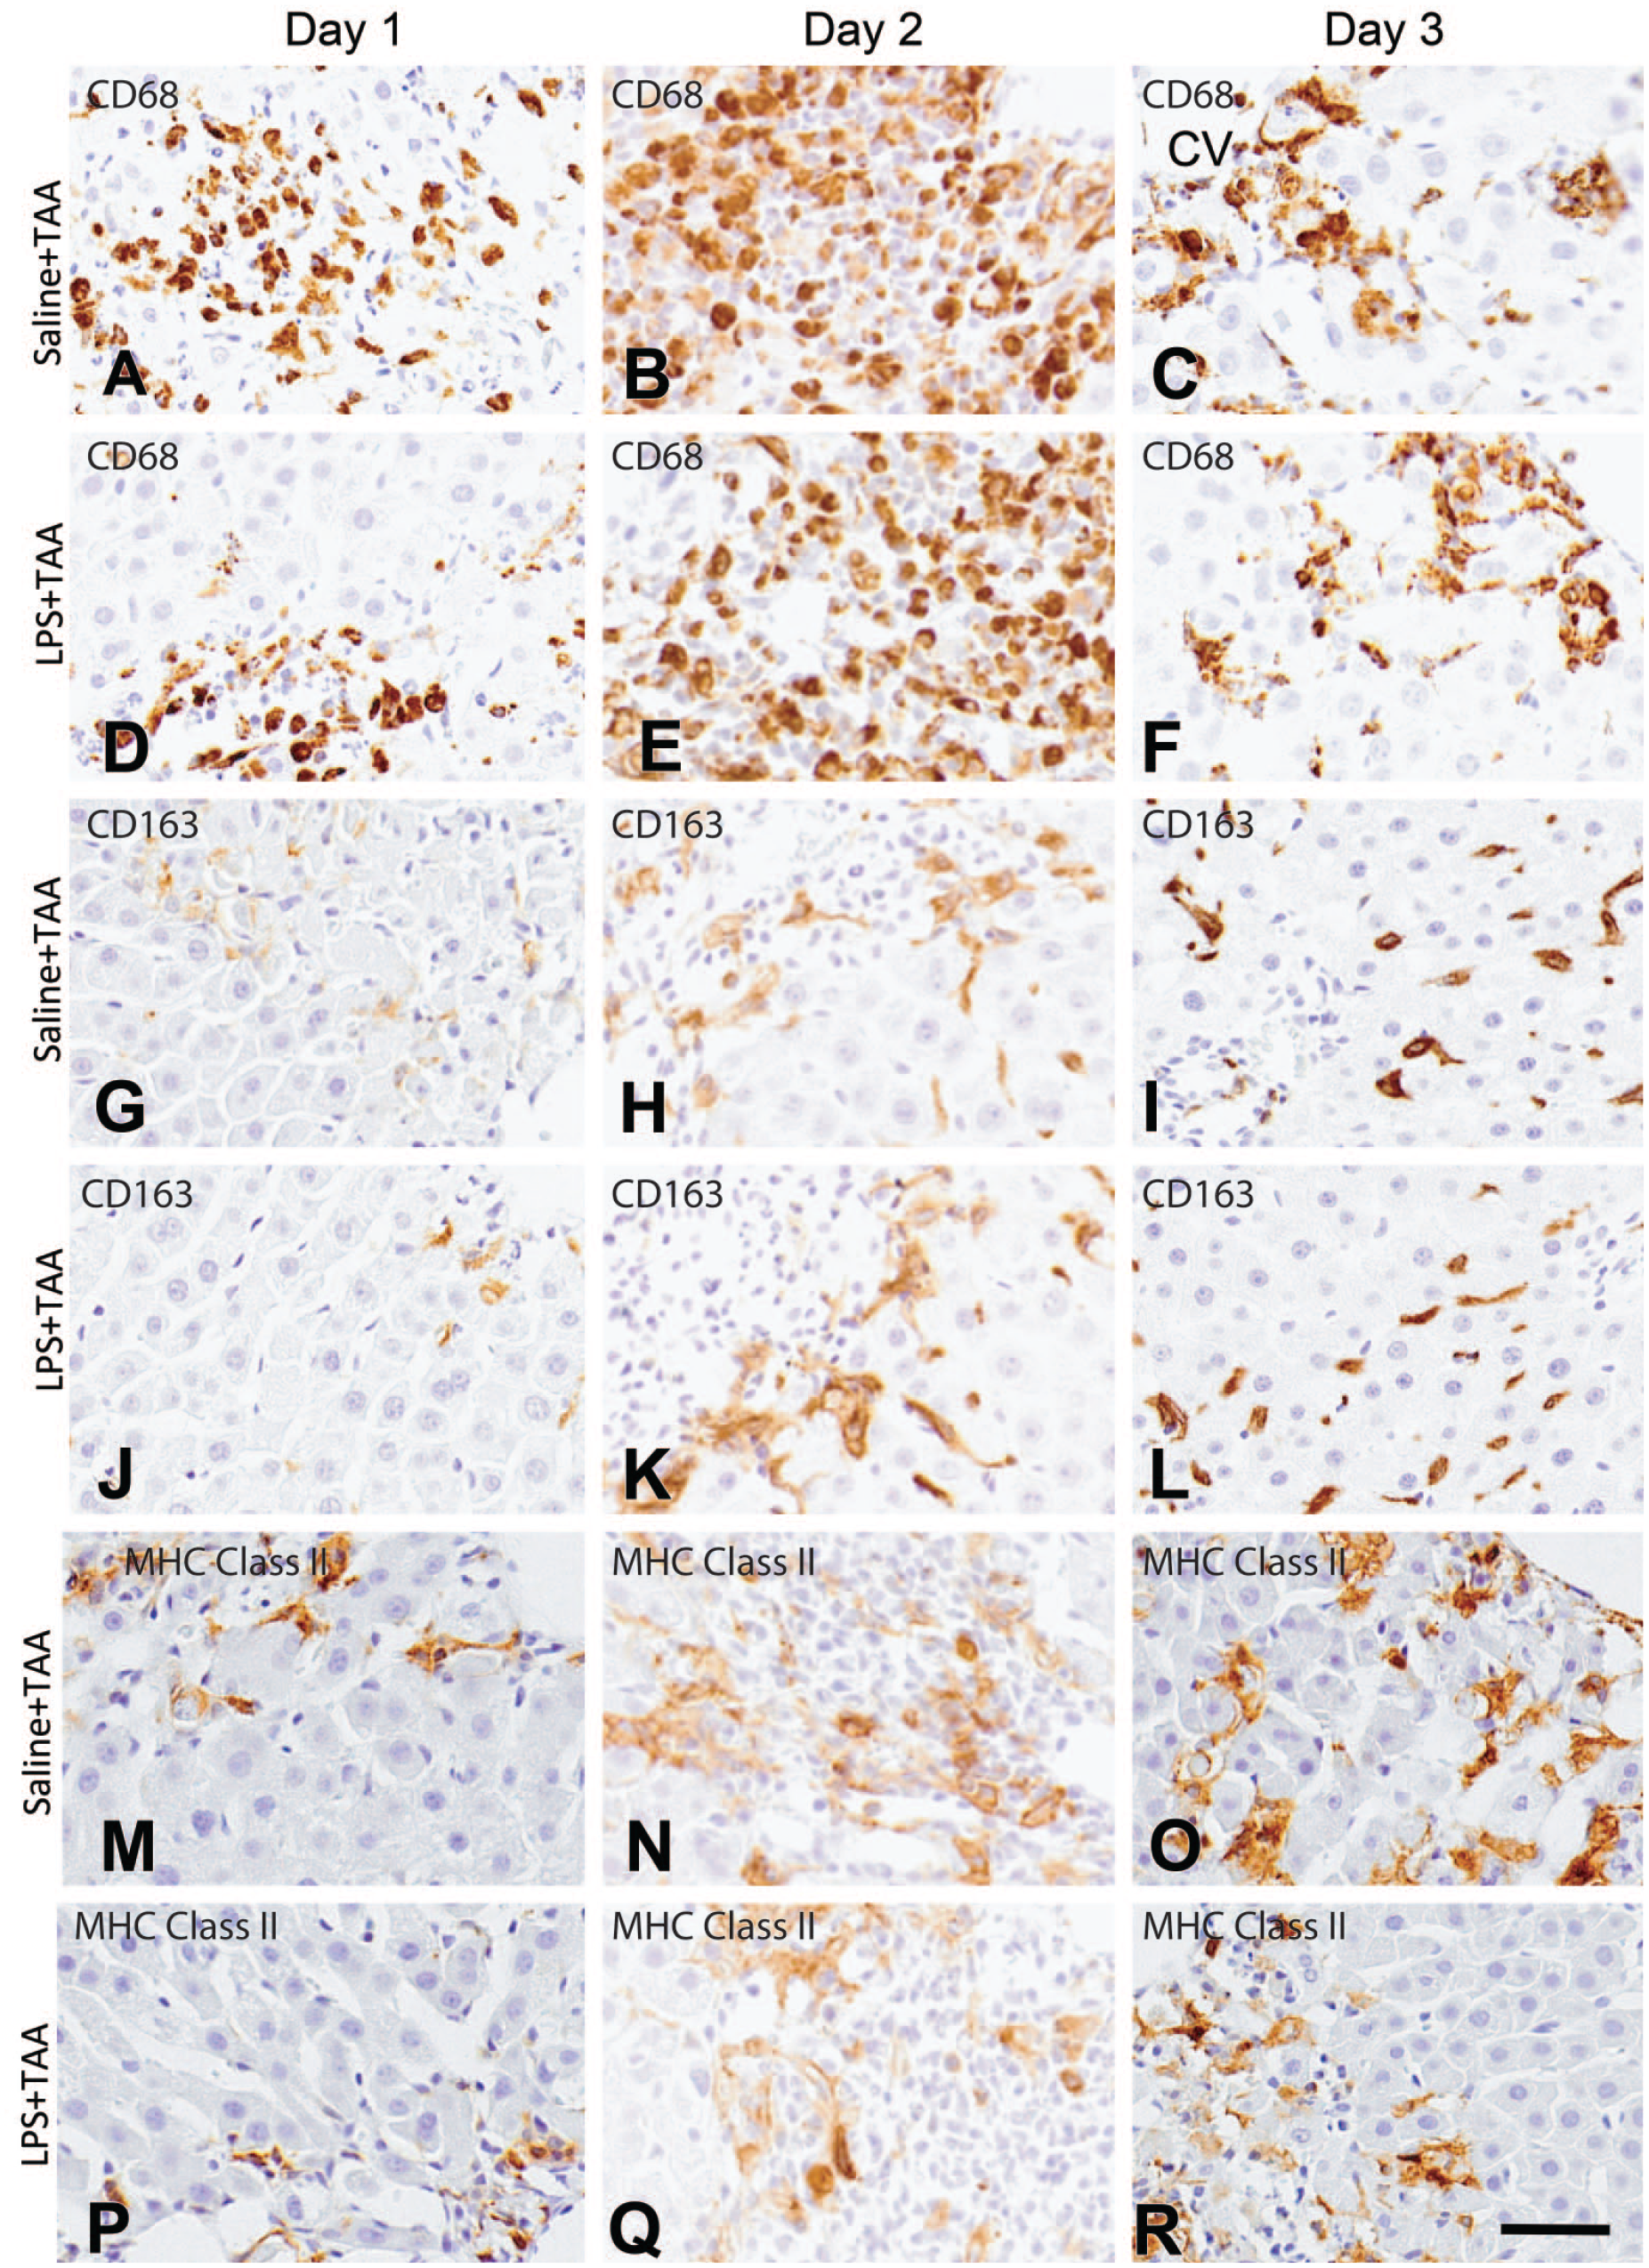
A-F: Immunohistochemistry for hepatic macrophages with antibodies to CD68 (A-F), CD163 (G-L), and MHC class II (M-R) in the liver of saline + LPS and TAA + LPS rats on Days 1, 2, and 3.
Down Regulation of Macrophage-Related Inflammatory Factors in LPS-Pretreated TAA-Induced Liver Injury
M1 macrophages induce tissue injury by producing inflammatory factors such as MCP-1, IL-1β, IFN-γ, IL-6, and TNF-α, whereas M2 macrophages work as tissue healing/remodeling by releasing anti-inflammatory factors including IL-4, IL-10, and ΤGF-β1.8,24-26 Along with the tissue injury by TAA, the expressions of these M1- and M2-related factors in both saline + TAA and LPS + TAA rats on Day 1 were significantly increased or showed a tendency to increase, as compared with those in controls (Figures 7 and 8); these findings indicated hepatocyte injury by TAA. However, the expressions of MCP-1 (Figure 7A), IL-1β (Figure 7B), and IL-4 (Figure 8A) were significantly lower in the LPS + TAA rats than those in the saline + TAA rats. A similar tendency to decrease in the LPS + TAA rats on Day 1 in contrast to the saline + TAA rats was seen in other factors (Figures 7, 8).
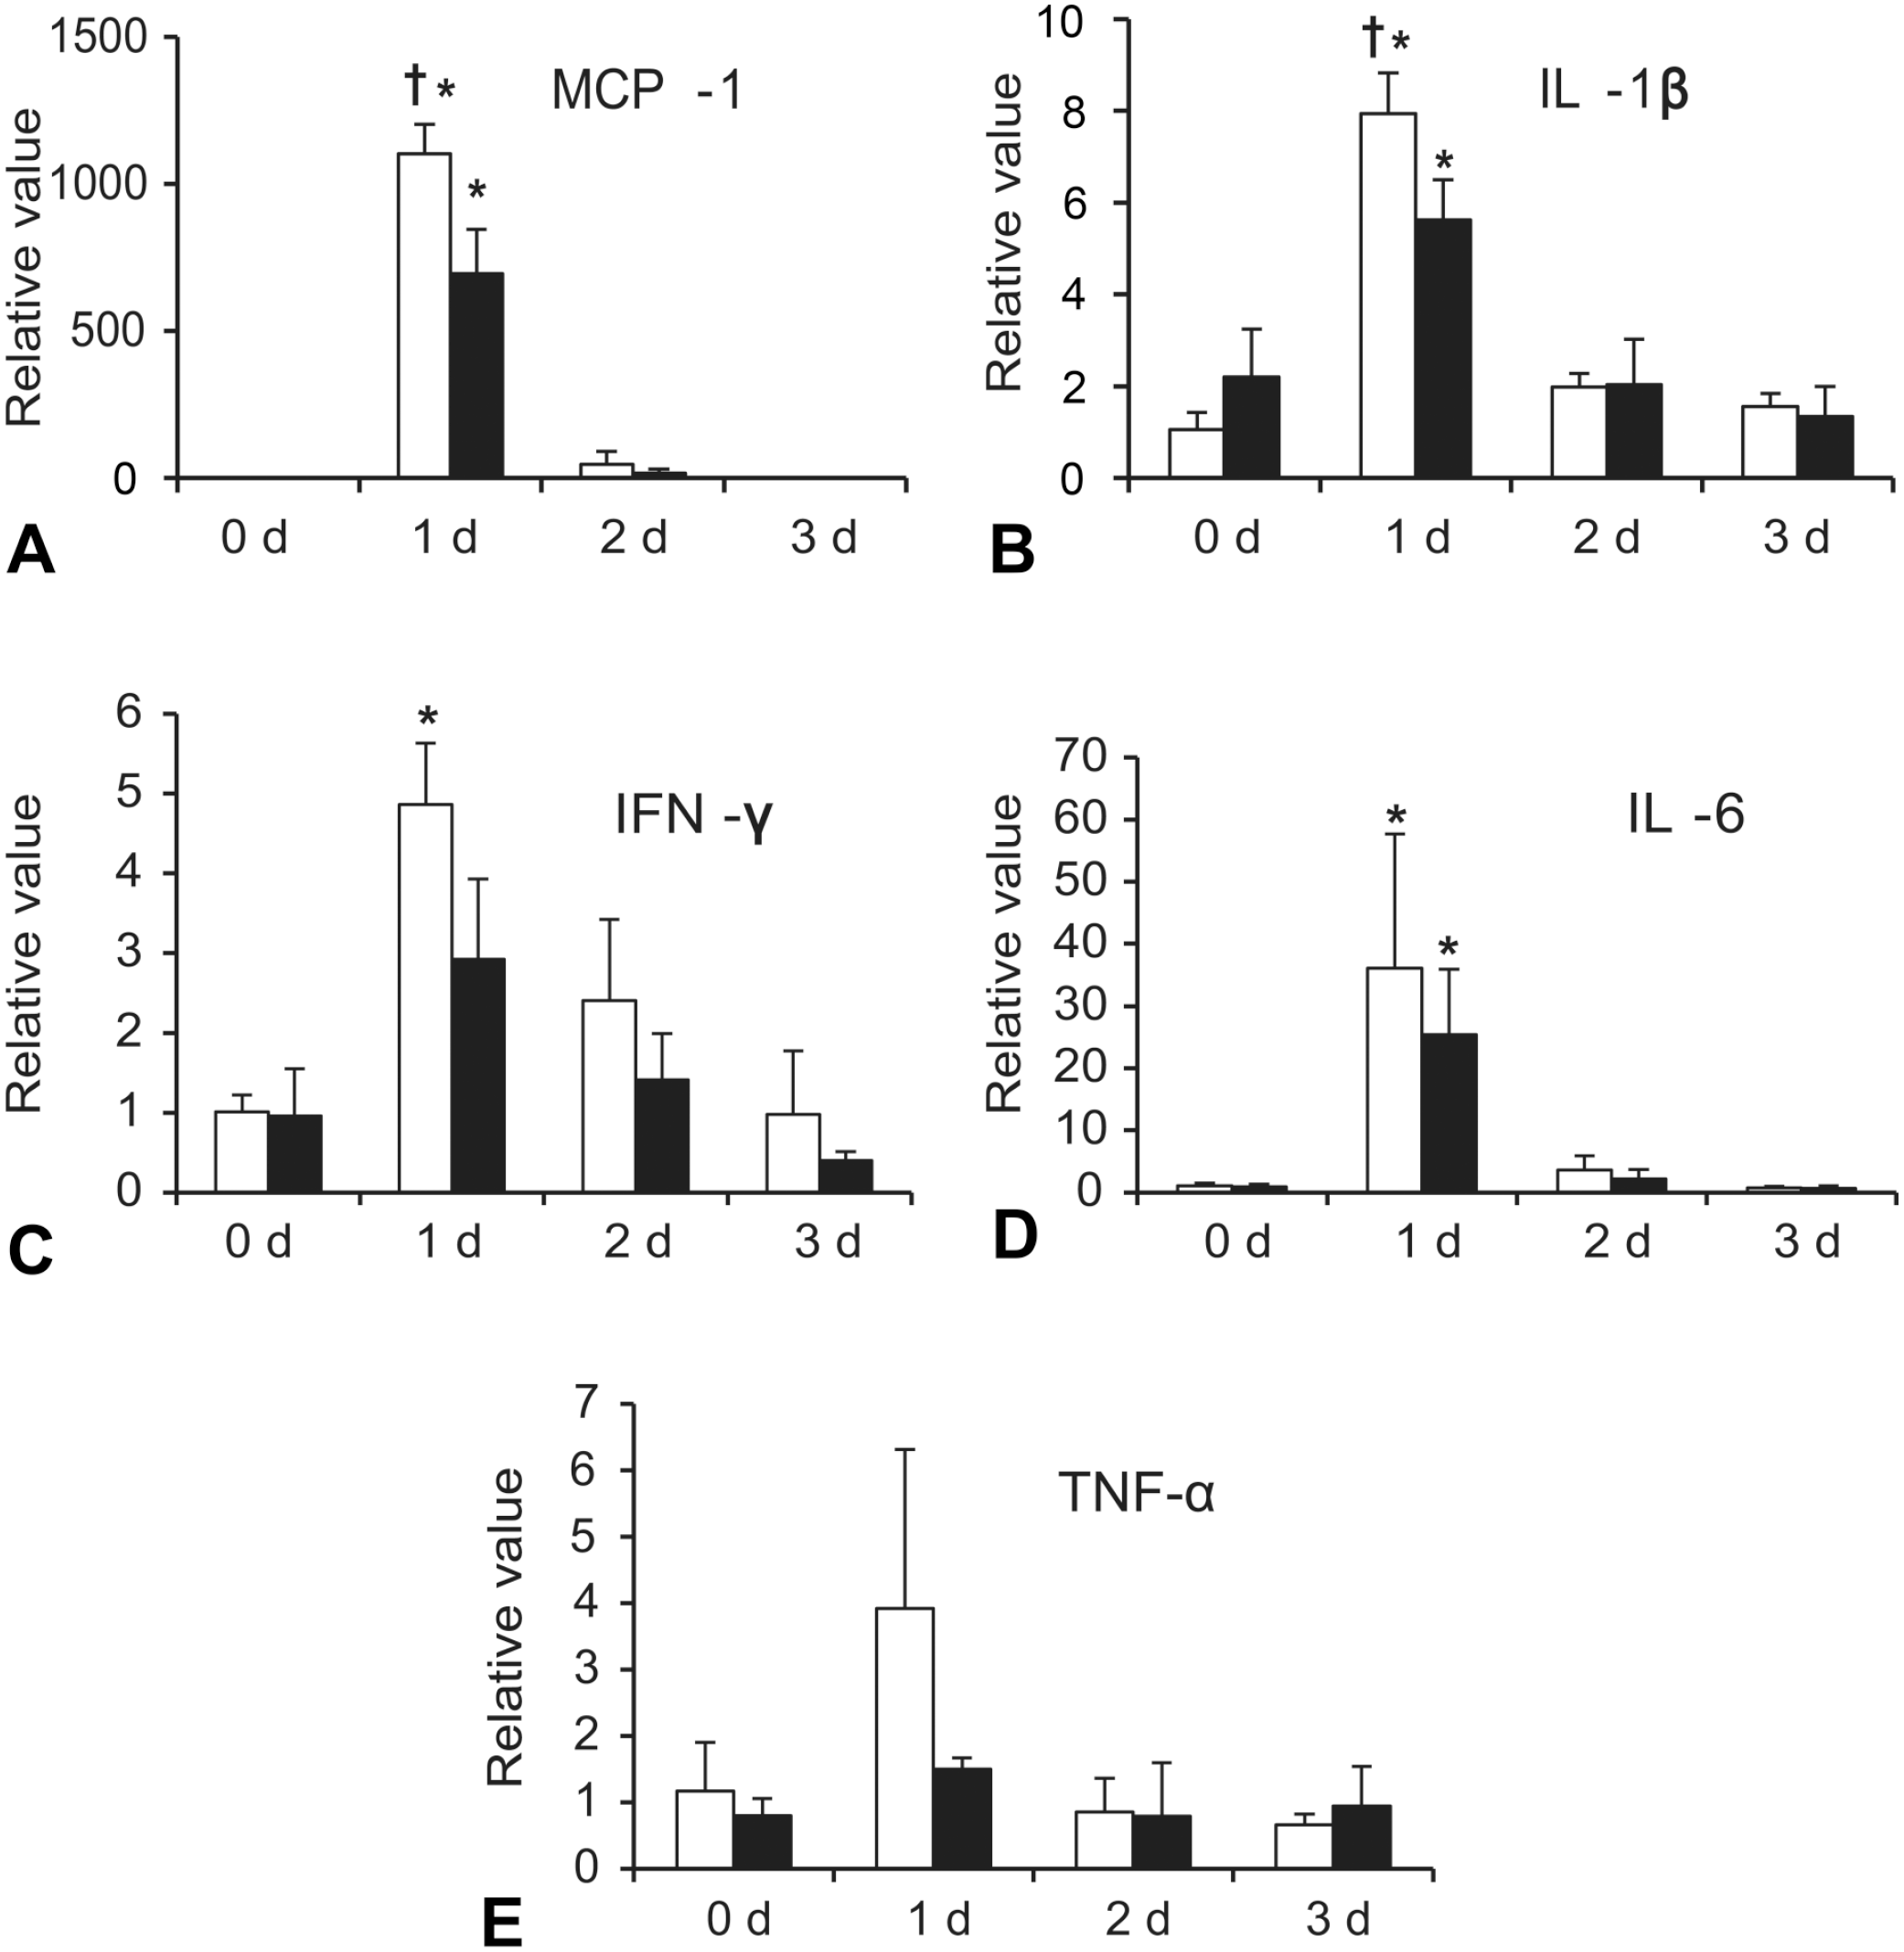
mRNA expressions for M1 macrophage-related factors: MCP-1 (A), IL-β1 (B), IFN-γ (C), IL-6 (D), and TNF-α (E) in the liver tissues of the saline + TAA (□) and LPS + TAA (■) rats. Expression levels were normalized to 18s rRNA level.
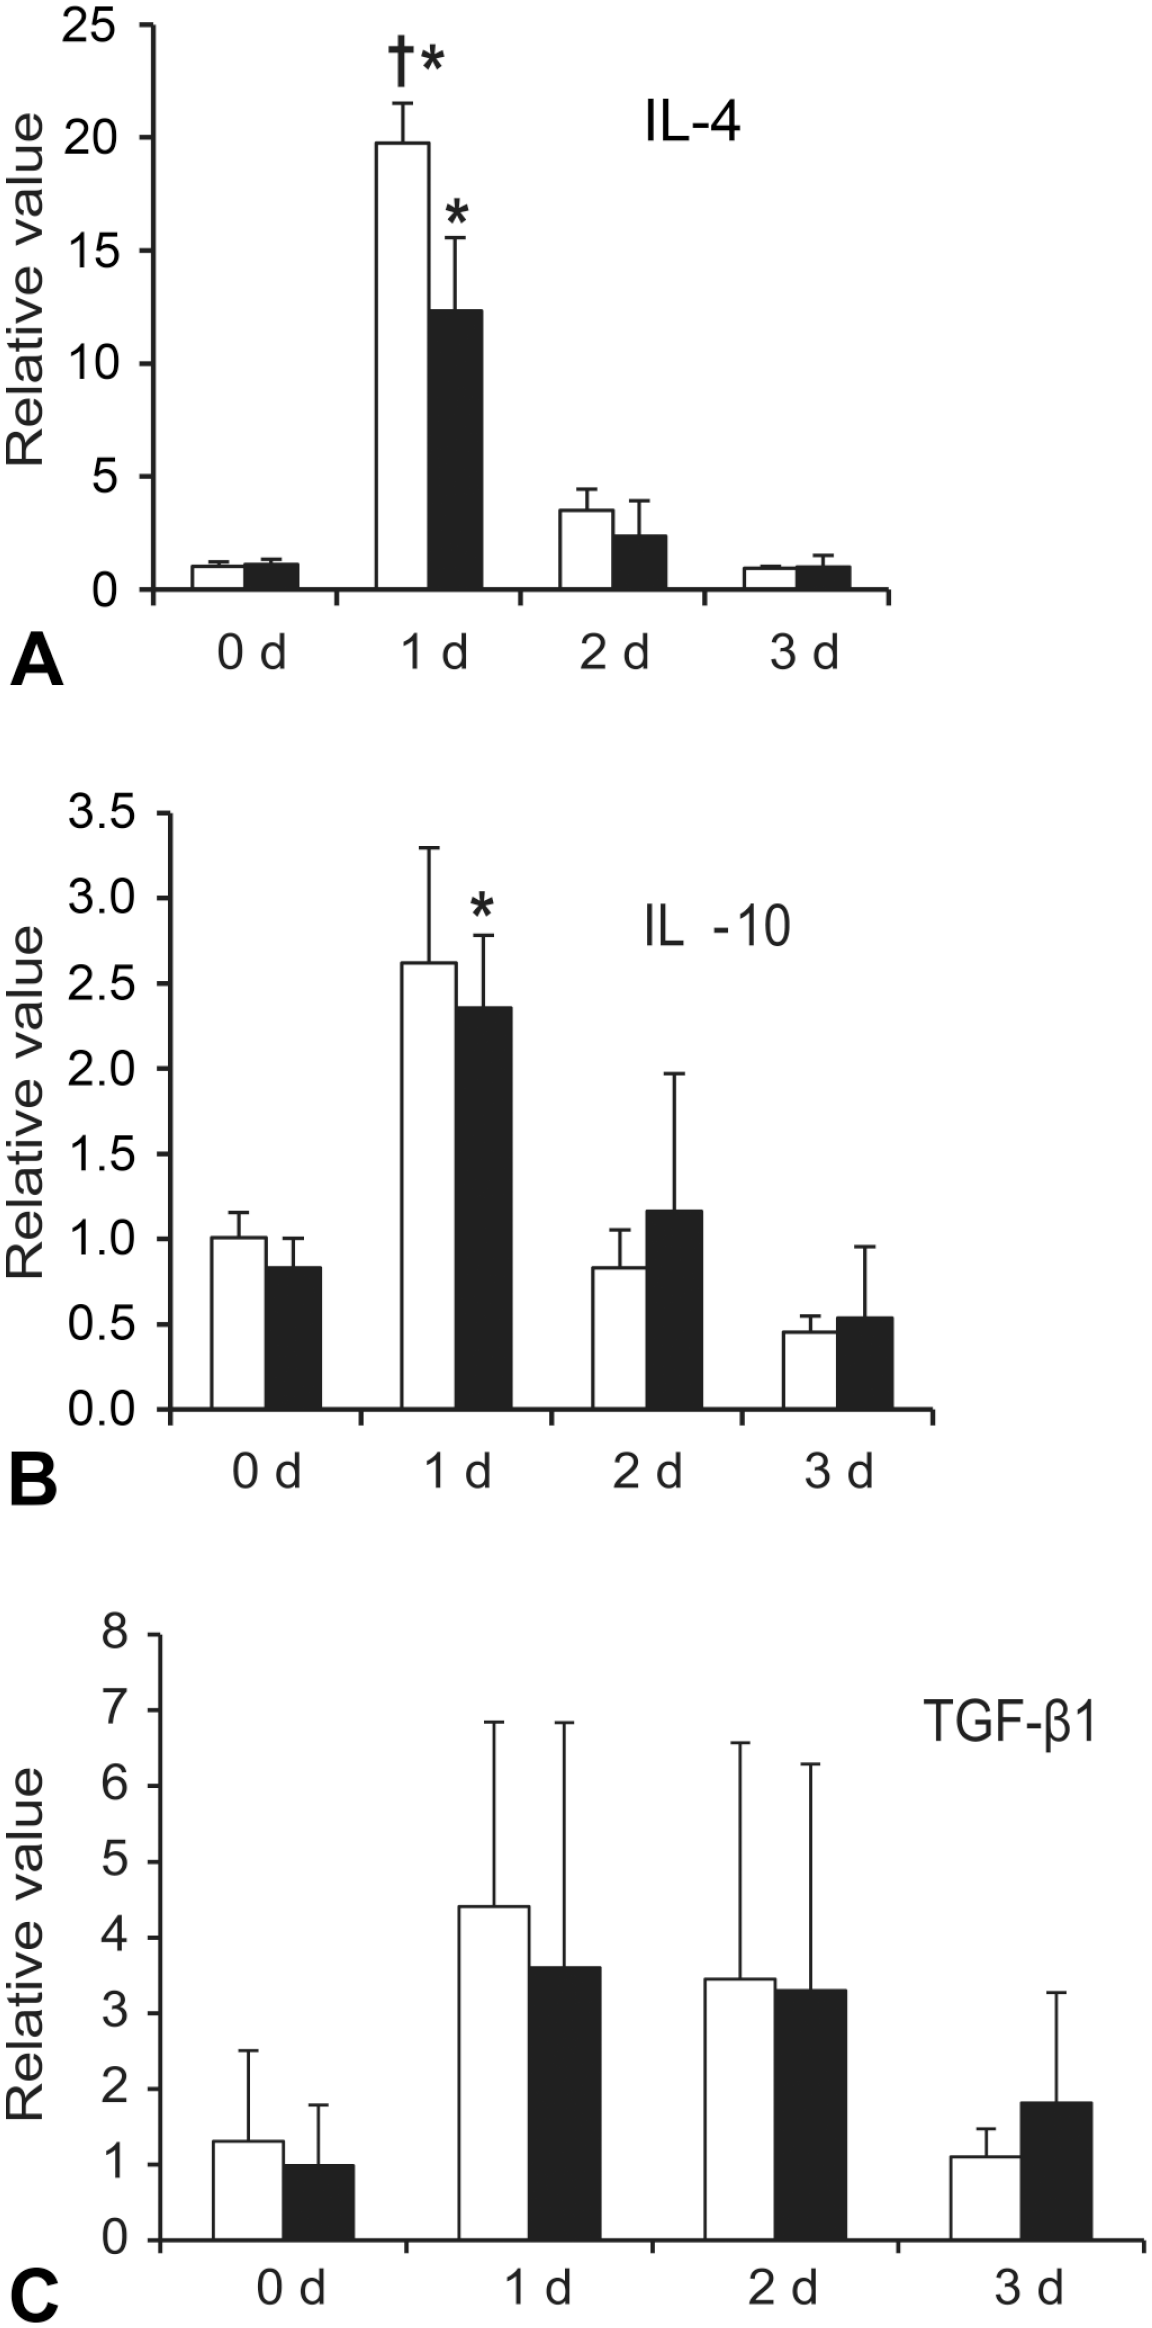
mRNA expressions for M2 macrophage-related factors: IL-4 (A), IL-10 (B), and TGF-β1 (C) in the liver tissues of the saline + TAA (□) and LPS + TAA (■) rats. Expression levels were normalized to 18s rRNA level.
Discussion
A small amount of gut-derived LPS may be taken up into the liver through the portal venous system. 27 Therefore, LPS should be regarded as a possible factor for influence on hepatotoxicity. The dose of LPS (0.1 mg/kg BW) used in this study did not affect rat livers in terms of the levels of hepatic enzymes and histological findings, as well as macrophage appearance when data in controls (on Day 0) were compared between the saline + TAA and LPS + TAA rats. However, cytoplasmic autophagosomes reacting to LC3B in hepatocytes were significantly increased on Day 0 (controls) in the LPS + TAA rats (discussed below).
Amelioration of TAA-Induced Hepatic Lesions by LPS Pretreatment
Liver lesions induced in rats by TAA (100 mg/kg BW) were characterized by centrilobular coagulation necrosis on Day 1 and macrophage reaction in the affected areas on Days 1 and 2; thereafter, the lesions were recovered on Day 3. The TAA-induced hepatic lesions were similar to those reported previously.6,8 Interestingly, the LPS pretreatment at 24 hours before TAA injection significantly reduced the liver lesions on Days 1, 2, and 3 in the LPS + TAA rats, as compared with those in the saline + TAA rats. Furthermore, the reduced hepatic lesions were reflected by significantly decreased levels of AST, ALT, and ALP on Day 1, as well as T. Bil on Days 1 and 2 in the LPS + TAA rats. Apoptosis is related partly to cell death induced by chemicals. 28 In this study, the number of apoptotic cells, demonstrable with the TUNEL method (although it is not always a definitive method for apoptosis), was significantly decreased on Day 1 in the LPS + TAA rats; thus, the hepatic lesions were reduced by LPS pretreatment which was also confirmed by the analysis of apoptotic cells. Based on these findings, it was found that the pretreatment with a low dose of LPS used at 0.1 mg/kg BW could alleviate liver injury in rats induced by TAA. It is reported that LPS pretreatment also showed hepatoprotective roles against acetaminophen and carbon tetrachloride toxicity, 3 although the detailed mechanisms remained to be investigated.
Possible Mechanisms of Hepatoprotection in TAA-Induced Hepatic Lesions by LPS Pretreatment
Generally, macrophages are classified as classically activated macrophages (M1) and alternatively activated macrophages (M2).6,8,26 In pathological lesions, the M1-type induces inflammatory reactions with tissue injury, while the M2 types work in inflammatory resolution. 26 The M1 type reacts to CD68, whereas the M2 type shows immunoreaction to CD163; macrophages reacting to MHC class II tend to be polarized toward M1 type. 26 In TAA-induced hepatic lesions, M1 and M2 types almost appear simultaneously in the early stages after the injection. 26 In this study, the numbers of macrophages reacting to CD68 (for M1), CD163 (for M2), and MHC class II (for M1) were significantly increased on Days 1, 2, or 3 after TAA injection, of which these findings were corresponding to that reported previously.8,26 Interestingly, as compared with the saline + TAA rats, the numbers of macrophages reacting to CD68 and CD163 on Day 2, as well as macrophages to MHC class II on Days 1 and 2 were significantly decreased in the LPS + TAA rats. Furthermore, the expressions of the M1-related factors (MCP-1, IL-1β, IFN-γ, IL-6, and TNF-α), and M2-related factors (IL-4, IL-10, and TGF-β1) in both saline + TAA and LPS + TAA rats on Day 1 were significantly increased or showed a tendency to increase, reflecting liver injury by TAA; however, out of them, the expressions of MCP-1, IL-1β; and IL-4 were significantly decreased in the LPS + TAA rats in contrast to those in the saline + TAA rats. The appearance of macrophages might be related simply to liver lesion development by TAA injection in the saline + TAA and LPS + TAA rats (the latter rats had reduced lesions). However, it is reported that the decreased numbers of macrophages, which were induced by pretreatment with gadolinium chloride, improved hepatic lesions induced in rats by TAA. 21 Lipopolysaccharide-mediated cytoprotection of the present TAA-induced hepatic lesions might be guided by lower production of macrophage-related cytokines such as MCP-1, IL-1β, and IL-4. Based on these findings, the significantly decreased numbers of macrophages (reacting to CD68, CD163, and MHC class II) in the LPS + TAA rats might have contributed in part to the improvement of liver lesions in this study.
Lipopolysaccharide can also stimulate autophagy in hepatocytes, suggesting that there may be a possible relationship between autophagy and liver diseases.19,29 However, the effect of autophagy on TAA-induced liver injury remains unknown. The present controls pretreated with a low dose LPS in the LPS + TAA rats showed an increased number of autophagosomes (LC3B-labeled fine granules) in the cytoplasm of hepatocytes in the centrilobular areas, indicating that LPS could quickly induce the formation of autophagosomes. Furthermore, the LC3B-positive fine granules significantly increased on Days 1 and 2 in the LPS+TAA rats, as compared with those in the saline + TAA rats; hepatocytes with LC3B-labeled fine granules were localized around the centrilobular necrotic areas. It is reported that autophagy in hepatocytes maintains cellular homeostasis by degrading damaged proteins and organelles and may have roles in cytoprotection through suppressing cell death.14,15,19 Autophagy also exerts an anti-apoptotic effect on hepatocytes and contributes to liver regeneration. 30 Enhanced autophagy may be generally cytoprotective against drug-induced injury; particularly, the activated autophagy protects against acetaminophen-induced liver necrosis 31 ; and rapamycin or ethanol-induced autophagy may have a protective mechanism during liver injury.18,32-34 Presumably, autophagosomes activated by LPS in this study might have participated in cytoprotection against TAA-induced hepatic lesions. Pretreatment of antioxidants reduced carbon tetrachloride-induced mouse liver injury by decreasing hepatic content of cytochrome P-450, 35 and the cytochrome P450 system may influence the autophagy in primary cultured rat hepatocytes. 36 Future studies are needed to elucidate the detailed mechanism in terms of the functions of macrophages and autophagy which may be influenced by cytochrome P450 system.
In conclusion, this study showed that LPS pretreatment (0.1 mg/kg BW) at 24 hours before TAA (100 mg/kg BW) injection could reduce the TAA-induced hepatotoxicity. These findings were supported by decreased values of hepatic enzymes and decreased the number of apoptotic cells. As macrophages reacting to CD68 (for M1), CD163 (for M2), and MHC class II (for M1) were significantly decreased by the LPS pretreatment in TAA-induced lesions, macrophages might be attributable in part to the reduction of hepatic lesions. Furthermore, cytoplasmic autophagosomes (reacting to LC3B as fine granules) were formed already after LPS injection, and following TAA injection the numbers were significantly increased in rats pretreated with LPS. Autophagy might also contribute to the reduction of TAA-induced hepatotoxicity. Based on these findings obtained by the present analyses, the low-dose LPS used at 0.1 mg/kg BW might have acted as cytoprotection against hepatotoxicity. However, it is reported that autophagy may play important roles in the induction of liver diseases via abnormal/excessive formation of autophagosomes; 19 and, hepatic macrophages depleted markedly and consistently by liposomal clodronate aggravated hepatotoxicity. 6 LPS influences both functions of autophagy and macrophages. 37 Importantly, macrophages and autophagy may have biphasic functions depending on microenvironmental conditions. The dose/time-dependent effects (low or high dose) of LPS on the functions of macrophages and autophagy should be investigated at the molecular levels, in addition to the relation of autophagy with macrophages.
Footnotes
Declaration of Conflicting Interests
The author(s) declared no potential conflicts of interest with respect to the research, authorship, and/or publication of this article.
Funding
The author(s) disclosed receipt of the following financial support for the research, authorship, and/or publication of this article: this work was supported partly by JSPS KAKENHI (grant no. 19H03130 to J.Y.), by the Platform Project for Supporting Drug Discovery and Life Science Research (Basis for Supporting Innovative Drug Discovery and Life Science Research [BINDS]) from AMED (grant no. JP20am0101123 to J.Y.) and by the Bangladesh Ministry of Education, Grant for Advanced Research in Education (GARE), BANBEIS, grant no. LS2018773 (to M.R.K.).