
Abstract
In the present study, we sought to investigate the long-term effects of nonylphenol (NP) on insulin signaling and glucose metabolism in liver. Furthermore, reactive oxygen species (ROS) in liver was evaluated as it is known to induce insulin resistance. Rats were administered NP by oral gavage at the doses of 15, 150 and 1500 μg/ kg body weight per day for 45 days. Hydrogen peroxide (H2O2) generation and lipid peroxidation were increased, and the activities of antioxidant enzymes were decreased in the liver of NP-treated rats. NP increased the plasma glucose and insulin levels and altered the enzymes of carbohydrate metabolism. Decrease in the protein levels of insulin signaling molecules insulin receptor (IR), IR substrate (IRS)-1, IRS-2 and phosphatidylinositol-3-kinase were observed with parallel increase in H2O2 levels in the liver of NP-treated rats. These results suggest that NP downregulates insulin signaling in liver, which could be due to ROS production and oxidative damage.
Introduction
Nonylphenol (NP) is the final degradation product of alkylphenol polyethoxylates, which are widely used in the preparation of lubricating oil additives, resins, plasticizers, surface-active agents, detergents, paints, cosmetics and other formulated products. NP is also found in polyvinyl chloride used in the food processing and packaging industry. Humans are exposed to NP through contaminated water and food products. 1 NP is shown to possess estrogenic property and the lipophilic nature of NP leads to its accumulation in animal tissues. 2 NP has been widely reported to affect male reproduction. 3 Recently, a few studies have shown that NP induces insulin secretion in pancreatic β-cells via intracellular estrogen receptors which suggests a possible role of NP in inducing a state of hyperinsulinimea and insulin resistance. 4
Liver, an insulin sensitive organ, plays a key role in the regulation of whole body glucose homeostasis. 5 Actions of insulin on liver are initiated when insulin binds to a high-affinity heterotetrameric transmembrane insulin receptor (IR) present in liver cells. 6 This is followed by activation of second messengers (also called docking proteins) such as the IR substrates-1 (IRS-1), IRS-2, IRS-3 and IRS-4 via a series of phosphorylation–dephosphorylation reactions which in turn leads to the activation of phosphatidylinositol-3-kinase (PI-3-kinase), resulting in the stimulation of glucose metabolism. Defects in one or more protein molecules involved in insulin signaling have been reported to cause insulin resistance. Among the various IRSs, IRS-1 and IRS-2 has been shown to play an important role in glucose metabolism. 7,8 Reactive oxygen species (ROS)-induced oxidative stress has been reported to induce acute insulin resistance in liver. It has been demonstrated that ROS induces the loss of IRS-1 and IRS-2 and promotes insulin resistance in rat skeletal muscle. 9 Studies have demonstrated that oxidative stress disrupts subcellular localization of IRS-1 and PI-3-kinase and induce insulin resistance in cultured adipocytes. 10 It is well established that exposure to NP elevates ROS and induce oxidative stress in various tissues like liver, brain and testis. 11–13 Recently, we have demonstrated that short-term exposure to NP induces hypoglycemia, hyperinsulinemia and oxidative stress in the pancreas of adult rats. 14 However, the long-term effects of NP on glucose metabolism in liver as not been studied yet. Therefore in the present study, we sought to investigate the long-term effects of NP on insulin signaling and glucose metabolism. Furthermore, oxidative stress in liver was evaluated as it is known to induce insulin resistance.
Materials and methods
Reagents
NP, glucose-6-phosphate dehydrogenase, fructose-6-phosphate, aldolase, glycerophosphate dehydrogenase, triose-P isomerase were obtained from Sigma Chemical Company (St. Louis, MO, USA). Rabbit polyclonal antibodies against IRS-1 (sc-560), IRS-2 (sc-8299), IR-β (sc-711), and PI-3-kinase p85α (sc-1637) mouse monoclonal antibody was purchased from Santa Cruz Biotechnology (Santa Cruz, CA, USA). Horseradish peroxidase-conjugate goat anti-rabbit IgG was obtained from Bangalore Genei (Bangalore, India). All other chemicals used for various assays were of analytical grade and were obtained from local commercial source.
Experimental design
Adult male rats of Wistar strain (80–90 days old) were procured from an authorized vendor (M/S Raghavendra Enterprises, Bangalore, India) and were housed at the Animal Facility of the Pondicherry University. The animals were fed standard rat chow (Sai Durga Feeds and Foods, Bangalore, India) and water ad libitum and were maintained at 22–25°C under a well-regulated light and dark (12 h:12 h) schedule. Reported NOEAL of NP for rats is 15 mg/kg body weight (World Health Organization). 15 Doses selected in the present study are below the reported NOEAL of NP for rats. Animals were divided into four groups of six rats in each group. Group I was treated orally with 0.5 ml of olive oil alone and served as control (0 μg). Groups II, III and IV were treated orally with NP dissolved in 0.5 ml of olive oil at 15, 150 and 1500 μg/ kg body weight per day, respectively for 45 days. Weights of the animals were monitored regularly until the end of the treatment. After 24 h of the last treatment and overnight fasting, animals were killed by cervical dislocation and blood was collected in heparinized tube for separation of plasma. Liver was dissected out and homogenized to obtain 10% homogenate in phosphate buffer (0.1 M, pH 7.4) and the homogenates were centrifuged at 9000g at 4°C for 20 min. The supernatants were used for biochemical analyses. The experiments were carried out in accordance with the guidelines of the Committee for the Purpose of Control and Supervision on Experiments on Animals (CPCSEA), Government of India 16 and were approved by the Institutional Animal Ethics Committee of Pondicherry University, Pondicherry.
Plasma glucose estimation
Plasma glucose concentration was estimated by glucose oxidase/ peroxidase method of Trinder. 17
Plasma insulin assay
Plasma insulin concentration was measured with rat enzyme-linked immunosorbent assay (ELISA) kit (Mercadia AB, Uppsala, Sweden).
Hexokinase activity in liver
The activity of hexokinase was assayed by the method of Bergmeyer et al. 18
Glucose-6-phosphatase activity in liver
The activity of glucose-6-phosphatase was assayed by the method of Swanson. 19 The inorganic phosphorus liberated in the supernatant was estimated by the method of Fiske and Subbarow. 20
Glycogen phosphorylase activity in liver
The activity of glycogen phosphorylase was assayed by the method Niemeyer et al. 21 The inorganic phosphorus liberated in the supernatant was estimated by the method of Fiske and Subbarow. 20
H2O2 generation
Hydrogen peroxide (H2O2) generation was assayed by the method of Pick and Keisari. 22
Lipid peroxidation
A breakdown product of lipid peroxidation, thiobarbituric acid reactive substance (TBARS), was measured by the method of Ohkawa et al. 23
Superoxide dismutase
The activity of superoxide dismutase was assayed by the method of Marklund and Marklund. 24
Catalase
The activity of catalase was assayed by the method of Claiborne. 25
Immunoblot analyses of insulin signaling molecules IR, IRS-1, IRS-2 and PI-3-kinase
A 20% liver lysates were prepared in lysis buffer (50 mM Tris, pH 7.4 containing 0.15 M NaCl, 10% glycerol (v/v), 1% NP-40 (v/v), 1mM sodium fluoride, 1mM sodium orthovanadate, 1 mM phenylmethylsulfonyl fluoride, 1mM EDTA, 150 µM bestatin, 1µM leupeptin and 1µM aprotinin). After homogenization, the samples were centrifuged at 10,000g for 30 min. The supernatants were collected and used for analysis. The protein concentration was determined by Lowry’s method 26 and equal quantities of protein were loaded per lane and subjected to 7% or 10% sodium dodecyl sulphate-polyacrylamide gel electrophoresis (Mini Protean II System, Bio-Rad) as described by Laemmli. 27 The resolved proteins were transferred onto a nitrocellulose membrane (NYTRAN, Keene, NH, USA) and the blots were incubated in a blocking buffer (phosphate-buffered saline containing 0.1% [v/v] Tween 20 and 5% (w/v) nonfat dry milk powder) for 5 h at room temperature. The blots were then incubated with rabbit polyclonal antibodies against IRS-1 or IRS-2 (1:200 dilution) or IR-β or mouse monoclonal antibodies against PI-3-kinase p85α overnight at 4°C, followed by incubation with horseradish peroxidase conjugated anti-rabbit IgG (1:1000 dilution) or anti-mouse IgG for 1 h at room temperature. The immunospecific proteins were detected using tetramethylbenzidine/H2O2 (Bangalore Genei, Bangalore, India) as substrate and resulting bands were quantified by densitometry.
Statistical analysis
The data were expressed as mean ± SD for six animals per group. Statistical analyses were performed by one-way analysis of variance followed by Tukey’s post-test using SPSS (student version 7.5, SPSS Inc., Surrey, UK). p < 0.05 was taken as statistically significant. Densitometric scanning was performed using Gene tool (version 3.05, Synoptics Ltd., Cambridge, UK).
Results
Effect of various doses of NP on plasma glucose and insulin concentration
Glucose and insulin levels in plasma were increased significantly in the animals treated with NP at the dose of 15, 150 and 1500 μg/kg body weight when compared to control animals (Table 1).
Effect of various doses of nonylphenol on the plasma glucose and insulin concentrationa

a Data are expressed as mean ± SD for six animals. *p < .05 against the control group.
Effect of various doses of NP on enzymes of carbohydrate metabolism in liver
To assess the effect of NP on glycolysis, glycogenolysis and gluconeogenesis in liver, activities of hexokinase, glycogen phosphorylase and glucose-6-phosphatase, the key enzymes involved in these pathways were assayed. The activities of hexokinase in liver showed a significant decrease while the activities of glycogen phosphorylase and glucose-6-phosphatase showed significant increase in the animals treated with NP at the dose of 15, 150 and 1500 μg / kg body weight in a dose-dependent manner when compared to control animals (Table 2).
Effect of various doses of nonylphenol on the carbohydrate metabolism enzymes in livera

a Data are expressed as mean ± SD for six animals. *p < .05 against the control group.
b nmol NADP reduced/min/mg protein.
c μmol of Pi liberated/min/mg protein.
d nmol of Pi liberated/min/mg protein.
Effect of various doses of NP on induction of oxidative damage in liver
To assess the effect of NP on free radical generation and oxidative status in liver, levels of H2O2 and TBARS, and activities of antioxidant enzymes catalase and SOD were assayed. Administration of NP at the dose of 15, 150 and 1500 μg/kg body weight resulted in a dose-dependent increase in the levels of H2O2 and TBARS in the liver of adult rats when compared to control animals (Table 3). The activities of superoxide dismutase and catalase in liver showed significant decrease in a dose-dependent manner in the animals treated with NP at the dose of 15, 150 and 1500 μg/kg body weight when compared to control animals (Table 3).
Effect of various doses of nonylphenol on the antioxidant enzymes, H2O2 generation and lipid peroxidation in livera

a NP at dose levels of 15, 150 and 1500 μg significantly decreased the activities of superoxide dismutase and catalase with parallel increases in levels of H2O2 and lipid peroxidation. Data are expressed as mean ± S.D. for six animals. *p < .05 against the control group.
b μmol H2O2 generated/min/mg protein.
c nmol malondialdehyde produced/min/mg protein.
d nmol pyrogallol oxidized/min/mg protein.
e μmol H2O2 consumed/min/mg protein.
Plasma glucose levels positively correlated with hepatic H2O2 levels (r = 0.92; n = 24; p < 0.0001; Figure 1A) and hepatic TBARS concentration (r = 0.90; n = 24; p < 0.0001; Figure 1B). A negative correlation was found between plasma glucose levels and hepatic catalase activity (r = −0.82; n = 24; p < 0.0001; Figure 1C). Furthermore, hepatic H2O2 level negatively correlated with hepatic hexokinase activity (r = −0.87; n = 24; p < 0.0001; Figure 1D).
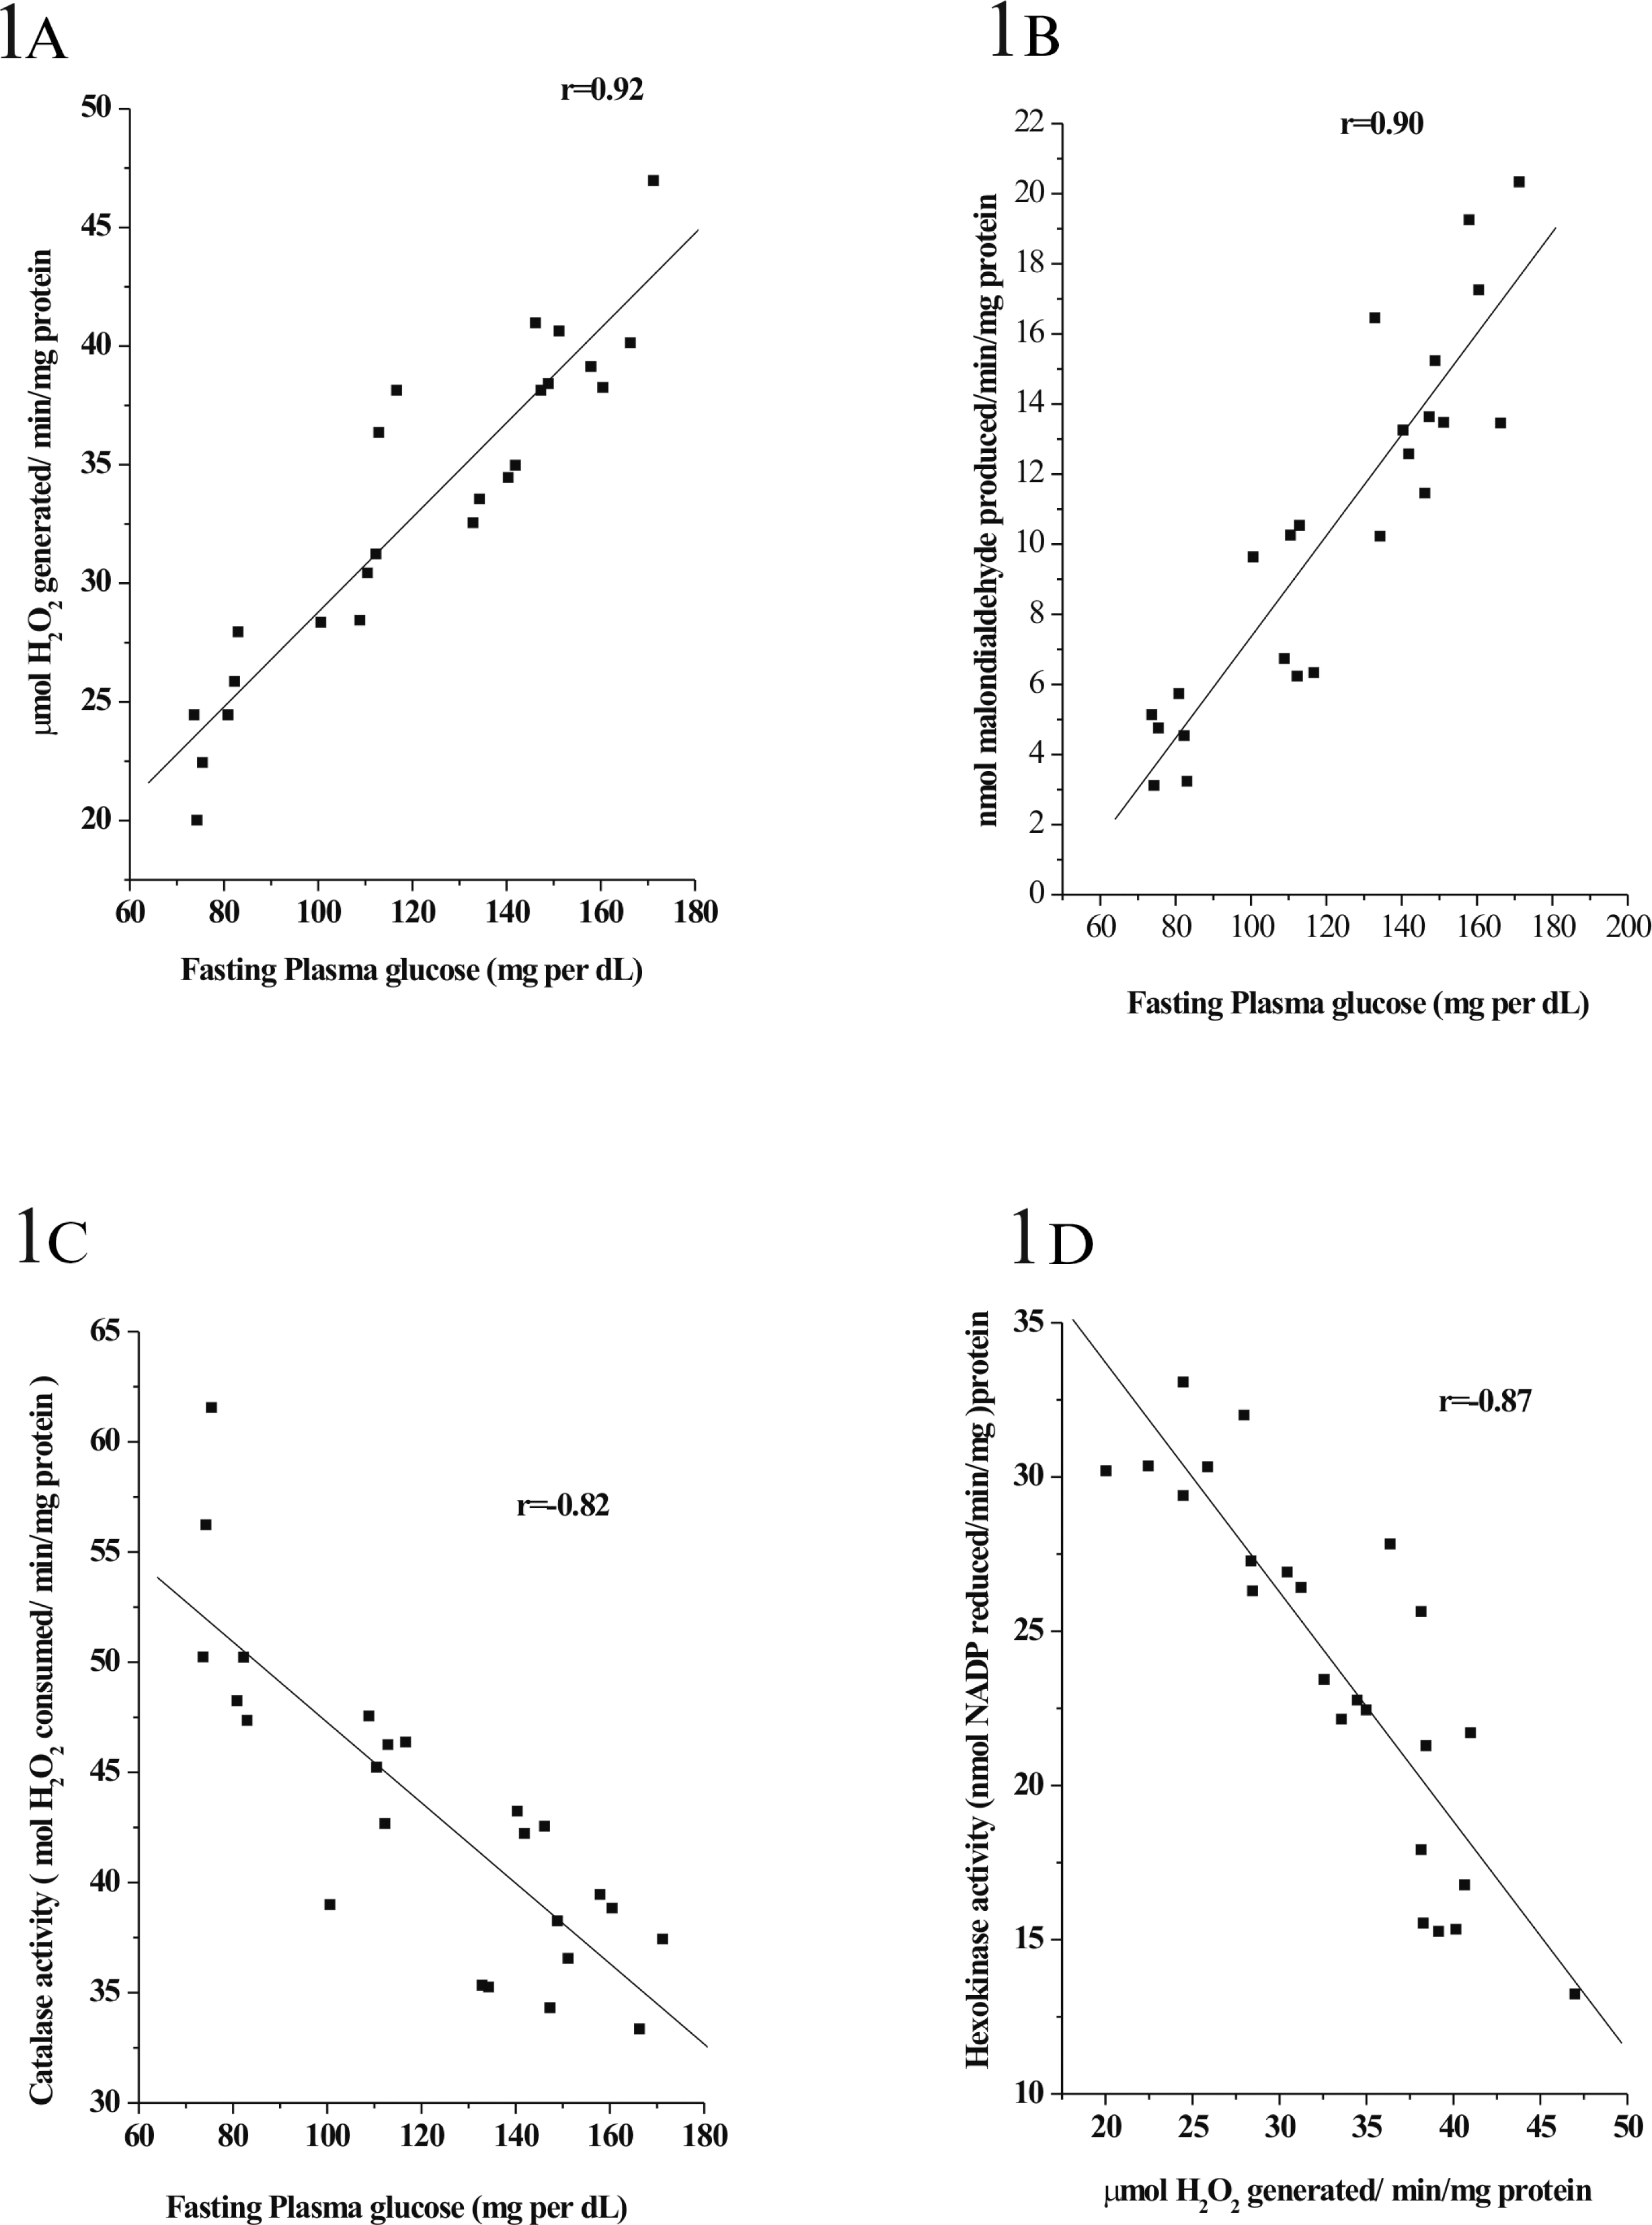
Correlation among the plasma glucose levels, lipid peroxidation, levels of H2O2, catalase activity and hexokinase activity in liver. (A) Plasma glucose levels positively correlated with hepatic H2O2 levels (r = 0.92; n = 24; p < 0.0001) and (B) hepatic TBARS concentration (r = 0.90; n = 24; p < 0.0001). (C) A negative correlation was found between plasma glucose levels and hepatic catalase activity (r = −0.82; n = 24; p < 0.0001). Furthermore, (D) hepatic H2O2 level negatively correlated with hepatic hexokinase activity (r = −0.87; n = 24; p < 0.0001).
Effect of various doses of NP on the protein levels of insulin-signaling molecules in liver
To assess the impact of NP on insulin signaling, some of the major protein molecules involved in this pathway were evaluated. Administration of NP resulted in a significant decrease in the protein levels of IR, IRS-1, IRS-2 and PI-3-kinase at the dose of 15, 150 and 1500 μg /kg body weight when compared to the control. The blots were probed with actin to show equal protein loading. The depicted blot is representative of six experiments (Figures 2–5).

Changes in the levels of insulin receptor (IR) in the liver of nonylphenol (NP)-treated rats. (A) Immunoblots showing significant decrease at the dose of 15, 150 and 1500 μg/kg body weight of NP. (B) Graph representing densitometrically scanned results corresponding to the blots depicted in (A). Each data point represents the average value from six independent experiments normalized against the control. The control was arbitrarily set at 1. Asterisk indicates statistically significant at p < 0.05.

Changes in the levels of insulin receptor substrate (IRS)-1 in the liver of nonylphenol (NP)-treated rats. (A) Immunoblots showing significant decrease at the dose of 15, 150 and 1500 μg/kg body weight of NP. (B) Graph representing densitometrically scanned results corresponding to the blots depicted in (A). Each data point represents the average value from six independent experiments normalized against the control. The control was arbitrarily set at 1. Asterisk indicates statistically significant at p < 0.05.
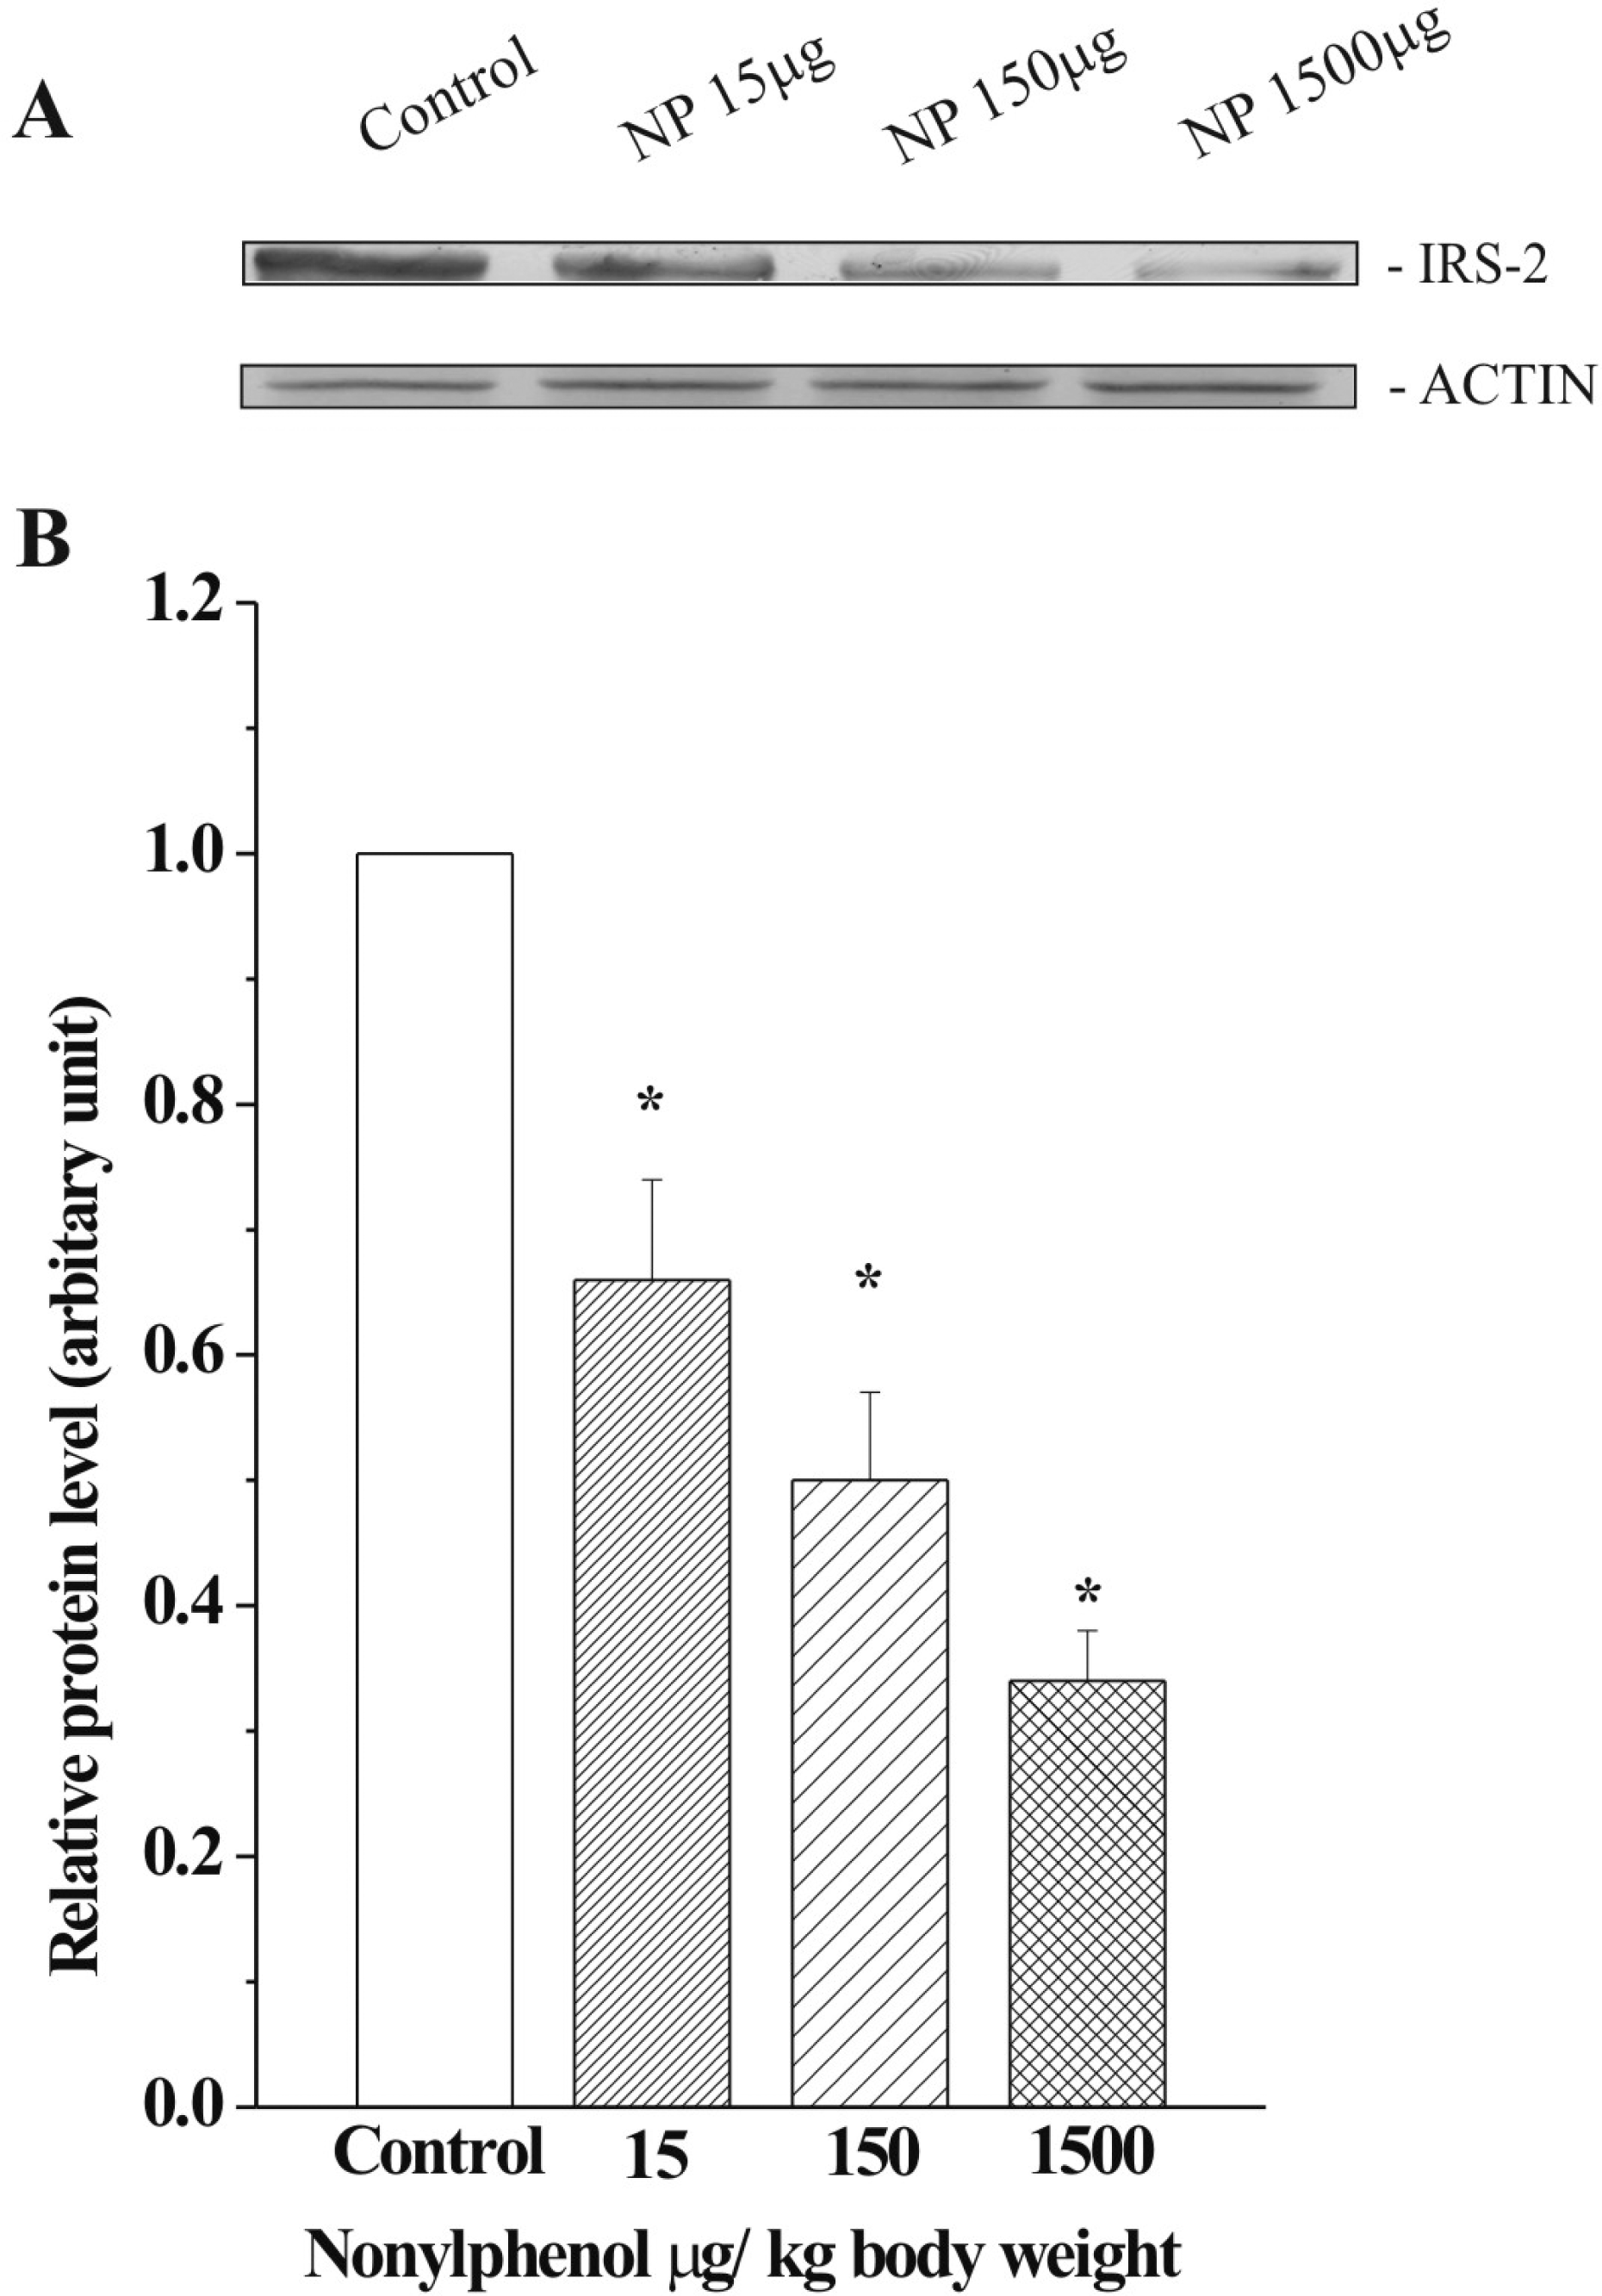
Changes in the levels of insulin receptor substrate (IRS)-2 in the liver of nonylphenol (NP)-treated rats. (A) Immunoblots showing significant decrease at the dose of 15, 150 and 1500 μg/kg body weight of NP. (B) Graph representing densitometrically scanned results corresponding to the blots depicted in (A). Each data point represents the average value from six independent experiments normalized against the control. The control was arbitrarily set at 1. Asterisk indicates statistically significant at p < 0.05.

Changes in the levels of phosphatidylinositol-3-kinase (PI-3-kinase) in the liver of nonylphenol (NP)-treated rats. (A) Immunoblots showing significant decrease at the dose of 15, 150 and 1500 μg/kg body weight of NP. (B) Graph representing densitometrically scanned results corresponding to the blots depicted in (A). Each data point represents the average value from six independent experiments normalized against the control. The control was arbitrarily set at 1. Asterisk indicates statistically significant at p < 0.05.
Discussion
The present study investigates the effects of NP on insulin signaling and glucose metabolism in liver. Our results showed that oral administration of NP for 45 days induced significant elevation in fasting plasma glucose and insulin levels. Previous studies have reported that when adult mice were exposed to 100 μg/kg of bisphenol A or 17β-estradiol for 4 days, hyperglycemia and hyperinsulinemia develops, leading to insulin resistance condition. 28 Although short-term administration of NP induced hypoglycemic state, 14 long-term administration of NP changed the picture toward a state of hyperglycemia and hyperinsulinemia. Hence, we speculate that long-term administration of NP could induce insulin resistance state in rats. In our study, we have observed decreased activities of hexokinase and increased activities of glycogen phosphorylase and glucose-6-phosphatase in the liver following NP administration. These results imply the inhibition of glycolysis and activation of glycogenolysis and gluconeogenesis, which could be responsible for the development of hyperglycemia in NP-treated rats.
ROS is considered to be one of the important agents of toxic insult and reported to cause insulin resistance in liver. H2O2 mediate toxic effects through the formation of hydroxyl radicals, a potent activator of lipid peroxidation. 29 A major cellular defense against ROS is provided by SOD and catalase which together convert superoxide radicals into H2O2 and then to water and molecular oxygen. 30 NP has been shown to inhibit the activities of cytochrome P450-1A in rat liver, which leads to stimulation of ROS generation. 31 NP has been shown to generate ROS and induce oxidative damage in various tissues like brain, testis and pancreas. 11,12,14 It was reported that NP induces ROS in the liver of rats at the dose of 25 mg/kg body weight when treated three times a week for 50 days. 13 . Moreover hyperglycemia and hyperinsulinemia has been reported to generate ROS generation and induce lipid peroxidation. 32 In the present study, we have observed significant increase in the levels of H2O2 and TBARS and significant decrease in the activities of superoxide dismutase and catalase in the liver of rats treated with NP daily for 45 days at all the doses. Plasma glucose levels positively correlated with hepatic H2O2 levels and TBARS concentration in liver. A negative correlation was found between plasma glucose levels and hepatic catalase activity. Furthermore hepatic H2O2 level negatively correlated with hepatic hexokinase activity. Reduction in the activities of SOD and catalase may reflect the inability of liver to eliminate H2O2 production, which could be due to inactivation of antioxidant enzymes through excess ROS production. These results imply that NP directly or NP through hyperglycemia induces ROS production in liver.
ROS has been shown to modulate insulin signaling and participate in diabetogenesis and its complication. 30,33 Reports on mice with a targeted disruption of the IRS-1 gene have been shown to develop growth retardation and insulin resistance, and deletion in IRS-2 gene shown to induce insulin resistance in liver. 34,35 Studies have reported that cultured adipocyte exposed to H2O2 resulted in the disruption of IRS-1 and PI-3-kinase levels in cellular compartment and thereby induced insulin resistance in adipocytes. 9 ROS production stimulate threonine phosphorylation of JNK and impairs tyrosine phosphorylation of IRS-2 leading to the downregulation of insulin signaling in hepatocytes. 31 ROS downregulate the protein levels of IRS-1 and IRS-2 and affect insulin signaling. H2O2 bring out disruption of IRS-1 and PI-3-kinase levels in cellular compartment and affects insulin signaling. 32,33 Insulin resistance with loss of IRS-1 and IRS-2 were reported when skeletal muscles were treated with H2O2 in vitro. 10 The impact of NP treatment on insulin signaling molecules like IR-β, IRS-1, IRS-2 and PI-3-kinase has been examined. In the present study protein levels of IR-β, IRS-1, IRS-2 and PI-3-kinase are decreased with parallel increase in H2O2 levels in the liver of NP-treated groups. It is possible that H2O2 degraded IRS-1 and IRS-2 proteins, thereby impairing the downstream insulin signaling mechanism. In conclusion, we speculate that persistent exposure to NP affects insulin signaling in liver and could develop insulin resistance condition.
Footnotes
Acknowledgements
R. Jubendradass acknowledges Department of Science and Technology, New Delhi for an Inspire fellowship. Shereen Cynthia D’Cruz acknowledges the Indian Council of Medical Research, New Delhi, India, for a senior research fellowship. The authors also thank the staff of the Centre for Bioinformatics, Pondicherry University, Pondicherry, for providing various facilities.
Funding
P. P. Mathur received a financial support from the University Grants Commission, New Delhi (F. No. 32-600/2006), Department of Science and Technology, Government of India under the projects (SP/SO/B-65/99) and DST-FIST.
Declaration of Conflicting Interests
The authors declared no conflicts of interest.