
Abstract
An anomalous sand unit preserved within an outcrop section at the south-west margin of the Montrose Basin (north-east Scotland) is investigated using a multi-proxy approach comprising lithostratigraphic analysis, particle size analysis, loss on ignition, geochemistry, and experimental modelling. This enables detailed reconstruction of the flow and depositional regime of the 8.15 ka yr BP Storegga Submarine Landslide Tsunami. The sand deposit (micaceous silty sand) is bounded by uplifted Carse Clay (sandy silt) and contrasts with this estuarine sediment due to its sharp contacts, inverse-normal and ungraded sequences, shell fragments, and soft-sediment deformation structures (SSDS). These include antiforms: flame structures (FS) and asymmetric flame structures (AFS); and synforms: simple load casts (SLC), pendulous load casts (PLC), and detached pseudonodules (DP), which are occasionally described in tsunami deposits. Particle size data suggests deposition occurred during the inundation wave phase. SSDS at the lower boundary formed through load deformation, with the development of antiforms aided by buoyancy-induced diapirism. AFS identified at this boundary indicate high basal shear stress orientated in the direction of palaeoflow during inundation. These structures result from both ductile and load deformation during flow and deposition. Experimental modelling supports the syn-sedimentary origin of AFS and the formation of FS, SLC, and PLC under high shear stress and subsequent sediment loading. Post-depositional processes, particularly seismic-induced liquefaction, likely contributed to the formation of upper boundary SSDS. The lower structures may have been influenced by uneven loading or downslope movement of sediment post-deposition. The structures, especially AFS in the direction of palaeoflow, enhance understanding of tsunami dynamics and expand the proxy toolkit for identifying palaeotsunami deposits.
Keywords
Introduction
The Storegga Tsunami (8.15 ka yr BP) was triggered by the largest known Holocene submarine landslide that occurred on the Norwegian Continental Shelf (Bryn et al., 2005; Haflidason et al., 2005). Sedimentary deposits associated with this tsunami event are found across the North Sea and North Atlantic coastlines, including Norway (Bondevik et al., 1997, 2003, 2005a, 2012), Northeast England (Boomer et al., 2007; Sharrocks and Hill, 2024), the Faroe Islands (Grauert et al., 2001), Denmark (Fruergaard et al., 2015) and eastern Greenland (Wagner et al., 2007). Deposits are well documented across the coasts of Scotland (Bondevik et al., 2005b; Dawson et al., 1988; Earland et al., 2024; Long et al., 2016; Shi, 1995; Smith et al., 1992, 2004; Woodroffe et al., 2023; Figure 1a). The deposits are locally traced in sediment cores and, more rarely, in sections, ranging in thicknesses between 2 and 156 cm depending on the sedimentological setting (Long et al., 2016; Smith et al., 1992). Recognised sedimentary structures within the deposit are usually limited to sediment grading, where normal grading is evident in the Ythan Valley, Montrose, Lochhouses, and Sutherland (Figure 1a) (Bateman et al., 2021; Dawson and Smith, 1997, 2000; Shi, 1995; Smith et al., 2004, 2007). Some sites also show inverse grading (e.g. Moniack, Creich, and the Ythan Valley; Figure 1a) (Hill et al., 2023; Shi, 1995). A range of additional sedimentary features often seen in tsunami deposits, such as antidunes, parallel laminations, and soft-sediment deformation structures (SSDS) (Bahlburg and Spiske, 2012; Choowong et al., 2008; Matsumoto et al., 2008; Minoura and Nakata, 1994; Riou et al., 2020), have rarely been observed within the Storegga deposits in Scotland.
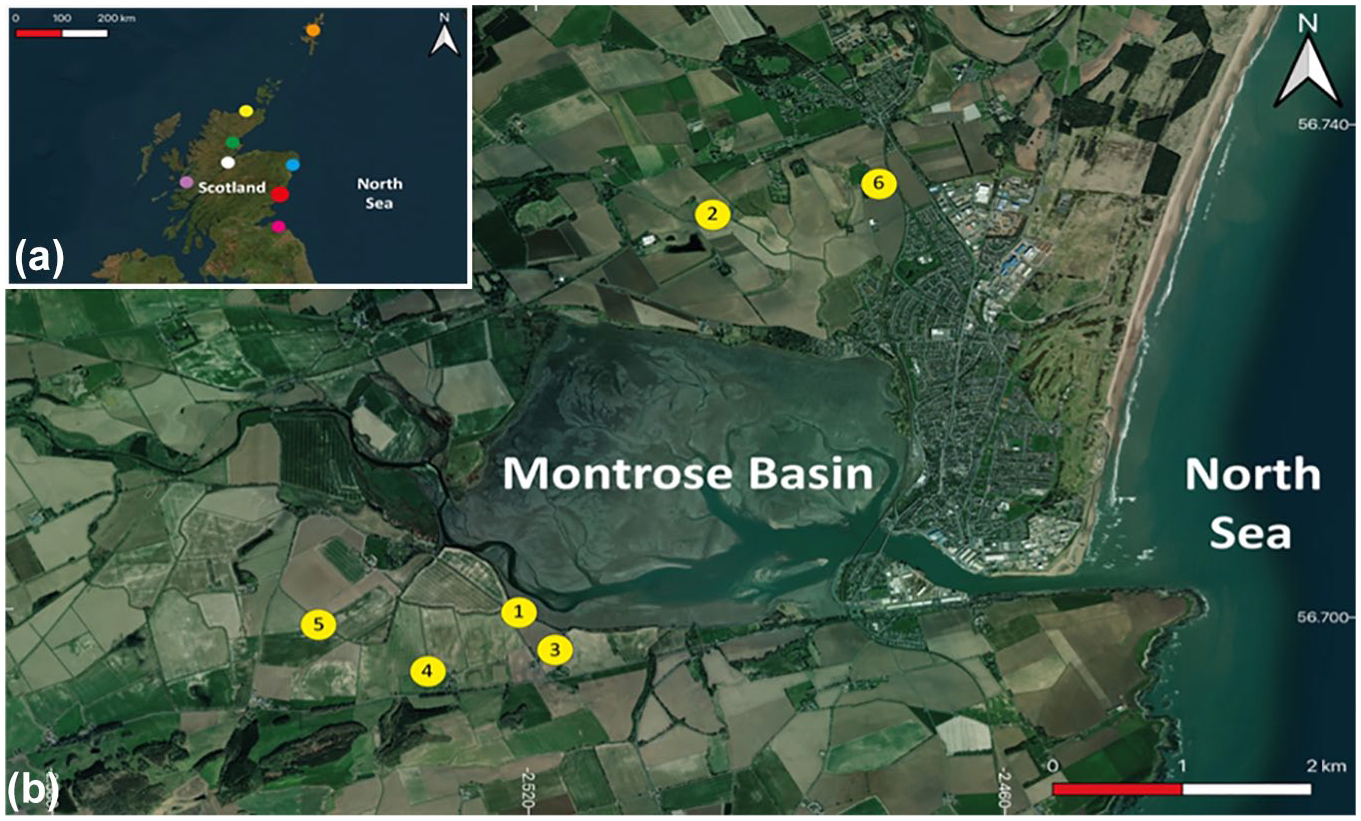
(a) Map of Scotland with sites of known 8.15 ka yr BP Storegga Submarine Landslide Tsunami deposit, coloured circles indicate each studied location: red (Montrose; this study); blue (Ythan Valley); pink (Lochhouses); yellow (Sutherland); white (Moniack), green (Criech), orange (Shetland), purple (Gortenachullish). (b) Locations of various study sites containing Storegga tsunami deposit around the Montrose Basin: (1) Montrose Basin Flames Site (this study); (2) Puggieston; (3) Maryton; (4) Fullerton; (5) Old Montrose; and (6) Dryleas.
The SSDS found in sedimentary deposits form by load deformation (i.e. density and/or uneven loading) of a coarser and denser (e.g. sand) deposit layer overlying a liquified, lower bulk density, fine-grained mud unit (Allen, 1982; Middleton, 2003; Owen, 2003). The sharp interface between these sediment types becomes deformed in the vertical direction as the coarser, denser sands sink into the liquefied muddy substrate. This deformation can result in the formation of antiforms, such as flame structures (FS) and diapirs; as well as synforms, such as simple load casts (SLC), pendulous load casts (PLC), detached pseudonodules (DP), and ball-and-pillow structures (Figure 2). Further deposition and high shear stress deform the muddy substrate, projecting the mud upwards to produce syn-sedimentary asymmetric flame structures (AFS; i.e. forming during deposition of the coarser sediment, Figure 2; Baas et al., 2014, 2016; Butler et al., 2016; Butler and Tavarnelli, 2006; Kelling and Walton, 1957; Martin and Bourgeois, 2012; May et al., 2016; Middleton, 2003; Minoura and Nakata, 1994; Owen, 2003; Peters and Jaffe, 2010; Riou et al., 2020). In sedimentological settings where the underlying substrate is cohesive, particularly in mud-rich deposits, load deformation can be accompanied by ductile deformation due to the high shear stress exerted by the flow (Matsumoto et al., 2008). Where liquefaction is absent, muddy sediment can undergo ductile deformation primarily from loading when cohesive properties are sufficient, for example, high clay content, and the yield strength of the mud is exceeded (Owen, 2003; Peakall et al., 2024).
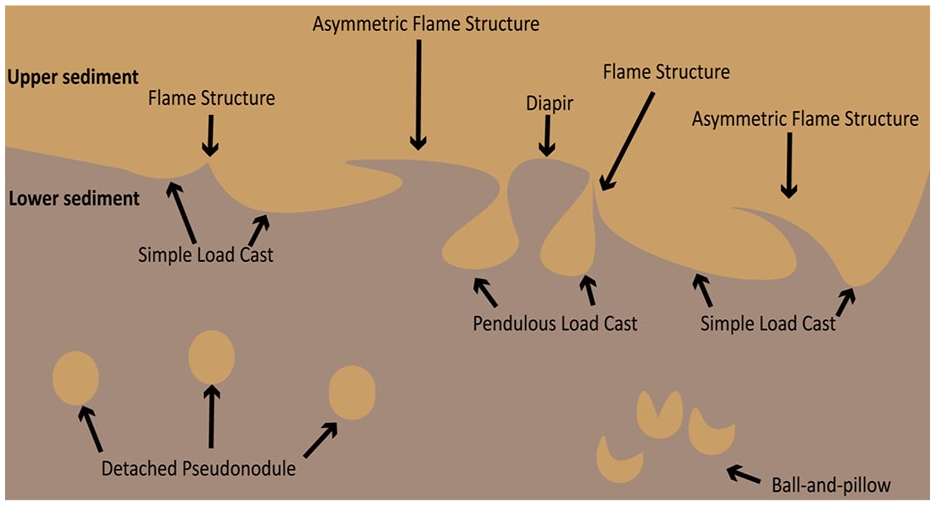
Soft-sediment deformation structures formed by the deposition of a coarser and denser upper sediment promoting load deformation of a lower, less dense finer sediment. Synforms include: load casts (simple and pendulous), detached pseudonodules and ball-and-pillow structures. Antiforms include: flame structures, asymmetric flame structures and diapirs.
The orientation of AFS in the direction of palaeoflow is due to the ongoing shear from a density-driven sediment flow (Anketell and Dżułyński, 1968; Baas et al., 2014, 2016; Butler et al., 2016; Butler and Tavarnelli, 2006; Kuenen and Prentice, 1957) or a tsunamigenic event (Gaffney et al., 2020; Matsumoto et al., 2008; May et al., 2016; Peters and Jaffe, 2010; Riou et al., 2020). AFS can also develop an erosional upper surface due to the shear stress from high energy currents, forming truncated flame structures (Matsumoto et al., 2008).
SSDS formed solely by density contrasts or uneven loading (Figure 2) may be post-depositional rather than syn-sedimentary as coarser sediment can continue to sink into the liquified substrate post-flow (Butler et al., 2016). Where slopes are present, the downslope component of weight may influence the orientation of SSDS more than the shear from the overriding flow. Experimental modelling has shown that SSDS can tilt downslope in the direction of gravitational loading (Allen, 2003; Moretti et al., 2001).
This study presents new evidence of SSDS at a site located at the Montrose Basin (east Scotland). The aim is to characterise both localised flow and the depositional regime of the Storegga Submarine Landslide tsunami event along the inland margins of the deposit through a combination of structure characterisation and analysis of a range of additional sedimentological and geochemical proxies.
Description of Study Area
Montrose Basin is a mesotidal estuary situated in north-east Scotland, UK (Figure 1b). Raised marine and fluvioglacial terraces formed of sand and gravel represent the highest geomorphological features surrounding the basin (>+7 m a.s.l.). These terraces formed during the retreat of the final ice sheet to occupy the area during the Late Devensian (Smith et al., 1980). A lower surface, reaching a maximum +6–7 m a.s.l., dissects these Late Devensian terraces and represents raised palaeoshorelines (Main Postglacial and Blairdrummond shorelines) of Holocene age, formed by the interplay between glacio-isostatic uplift and marine transgressions and regressions since the Late Devensian ice sheet decay (Smith et al., 1980, 1985, 2007; Smith and Cullingford, 1985). The Main Postglacial Shoreline (MPS) is dated at Fullerton (Location 4, Figure 1b) to 7666–7480 cal. yr BP and formed during the Main Postglacial Transgression (MPT; Smith et al., 1980, 2004, 2012). The Blairdrummond shoreline (BDS) is younger, estimated to have formed at Old Montrose at the culmination of relative sea-level (RSL) rise between 4416–3989 cal. yr BP (Smith et al., 2012).
These palaeoshorelines, consisting of clay and silt, form the majority of the land surface surrounding the basin, known locally as the Carselands. These Carselands are formed of silty clay or clayey silt and are colloquially known as ‘Carse Clay’ in eastern Scotland (Barras and Paul, 1999; Smith et al., 1980). Beneath the Carseland, buried peat that formed during a marine regression in the Early Holocene (Smith et al., 1980, 2004, 2007) is found, and is usually visible at surface in the upper section of gullies (e.g. at Fullerton; Figure 1b). Sandwiched within this peat unit is a grey, micaceous, silty fine sand with occasional peat intraclasts that has been interpreted and radiocarbon dated to the 8.15 ka yr BP Storegga submarine landslide tsunami event at multiple locations surrounding the basin (Figure 1b) (Bateman et al., 2021; Dawson et al., 1988; Shi, 1995; Smith et al., 1980, 2004, 2007). The well-studied ‘type’ section for the tsunami is located at Maryton on the raised Carseland surface along the south-western margin of the basin. About 500 m to the west a section containing a distinctive sand deposit is observed (Location 1 in Figure 1b and shown in Figure 3). This outcrop section is the subject of the current study.
Methodology
Field Investigation
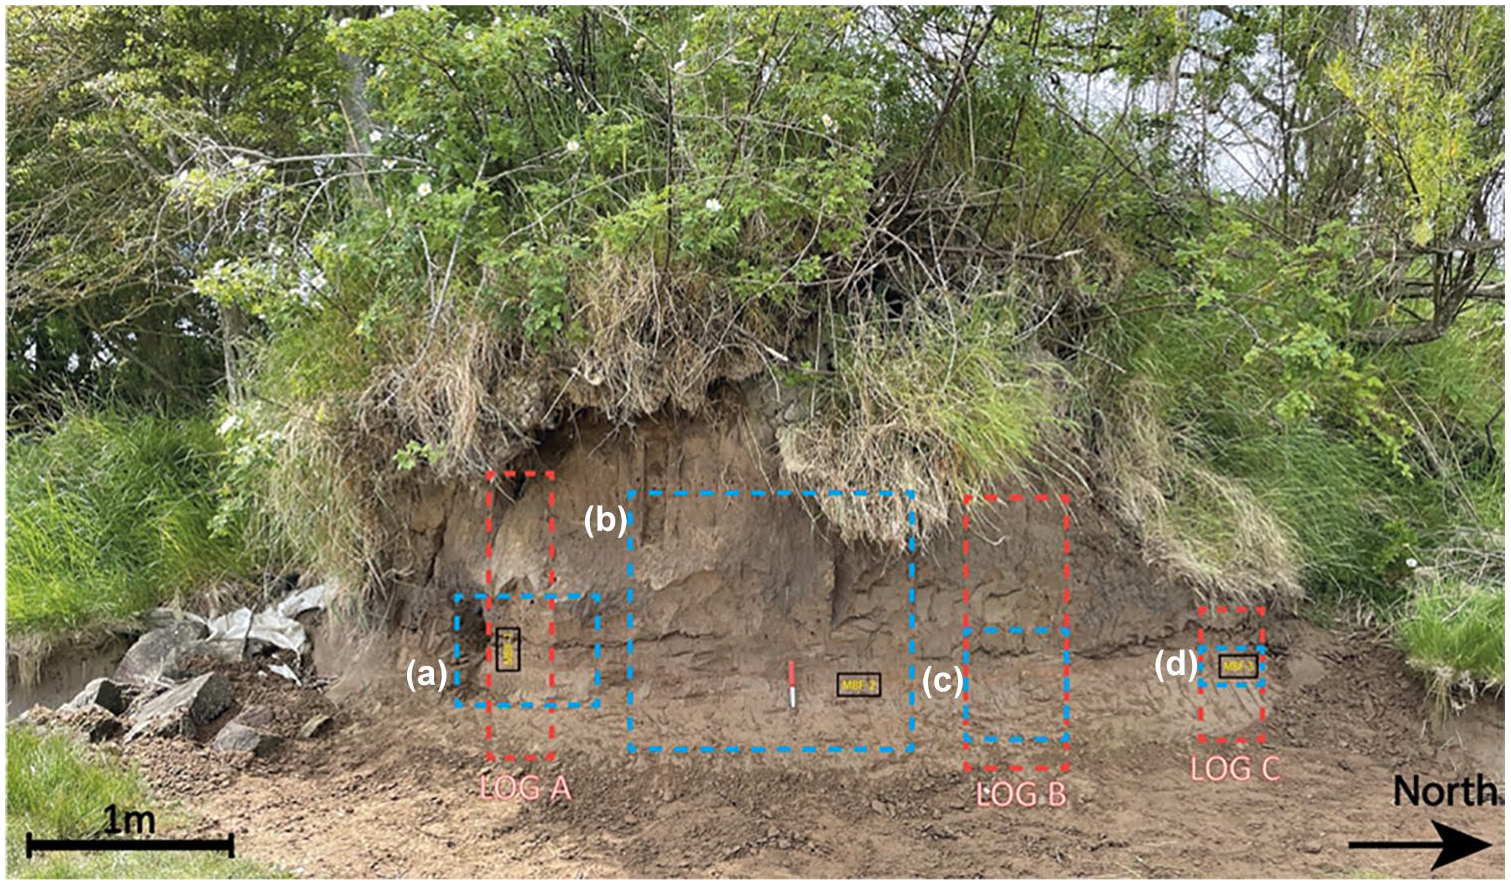
An outcrop section (Figure 3) orientated in a north east (seaward) direction on the south west margin of the basin (Location 1; Figure 1b) was cut back and cleaned with a spade and spatula to provide a surface for detailed investigation of the stratigraphy. Stratigraphical units and boundary characteristics were identified, as well lateral continuity, strata thickness and identifiable SSDS classified according to Owen (2003). Elevation data was collected using a Leica Geosystems Differential Global Positioning System (DGPS). Three box-cores (MBF-1, -2 and -3; Figure 3) were inserted onto different sections of the outcrop, carefully extracted, wrapped in plastic and stored in a freezer. These were obtained across the outcrop section to capture structural diversity and depositional heterogeneities which may exist in the deposit. Samples were taken at 0.5 cm intervals from one side of each box-core due to the thickness changes of the sand unit. Samples from the box-cores were prepared for loss on ignition (LOI) and Particle Size Analysis (PSA) using a set of standard procedures. For PSA, a Beckman Coulter LS13320 laser granulometer and GRADISTAT v6.0 (Blott and Pye, 2001) was used to calculate a range of statistics using the Folk and Ward (1957) graphical statistics methodology.
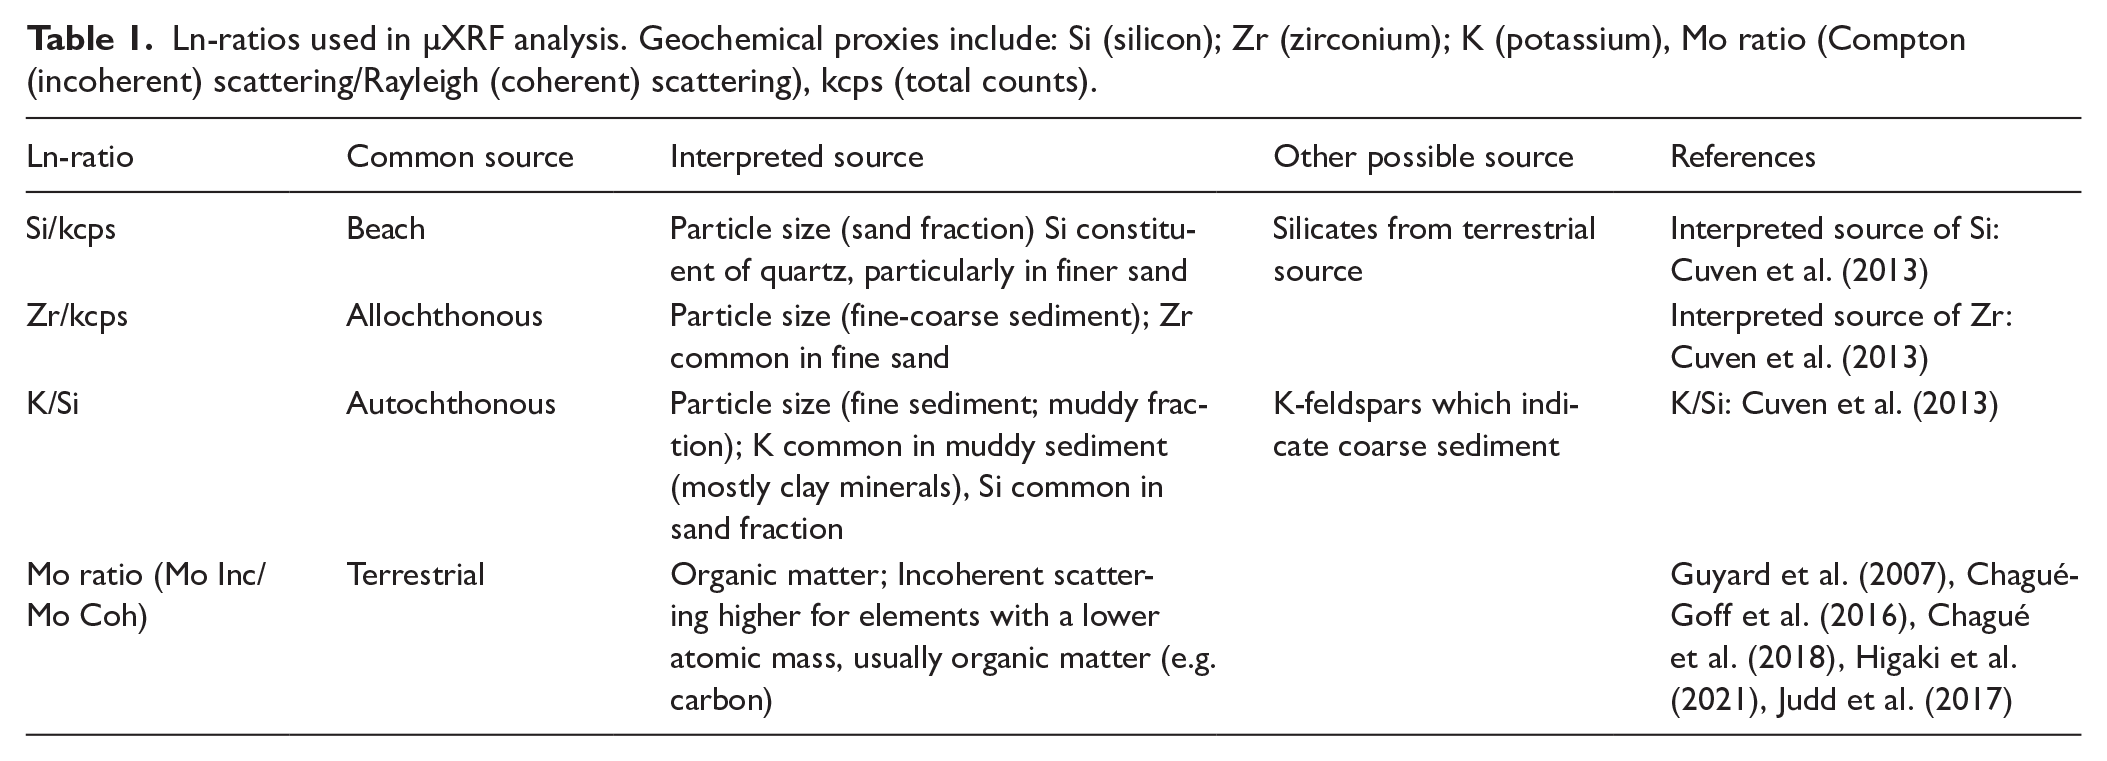
Investigation of the sediment geochemistry using micro X-Ray Fluorescence (µXRF) was undertaken at British Ocean Sediment Core Research Facility (BOSCORF) at the National Oceanography Centre (Southampton, UK) on box cores MBF-2 and -3 using a COX Analytical Systems Itrax X-ray Fluorescence Scanner. This is equipped with a molybdenum tube and operated at a voltage of 40 kV and current of 10 mA. The sediment is examined at 0.1 cm intervals (position) for an exposure time of 15 s. Elements are output as counts and are used in natural log ratios in this current study (Ln-ratios). Ln-ratios are used to normalise these elemental data and provide reliable geochemical proxies and to remove bias (Table 1; Chagué, 2020; Chagué-Goff et al., 2017; Croudace et al., 2006; Cuven et al., 2013).
Ln-ratios used in µXRF analysis. Geochemical proxies include: Si (silicon); Zr (zirconium); K (potassium), Mo ratio (Compton (incoherent) scattering/Rayleigh (coherent) scattering), kcps (total counts).
Analogue Laboratory Experiment
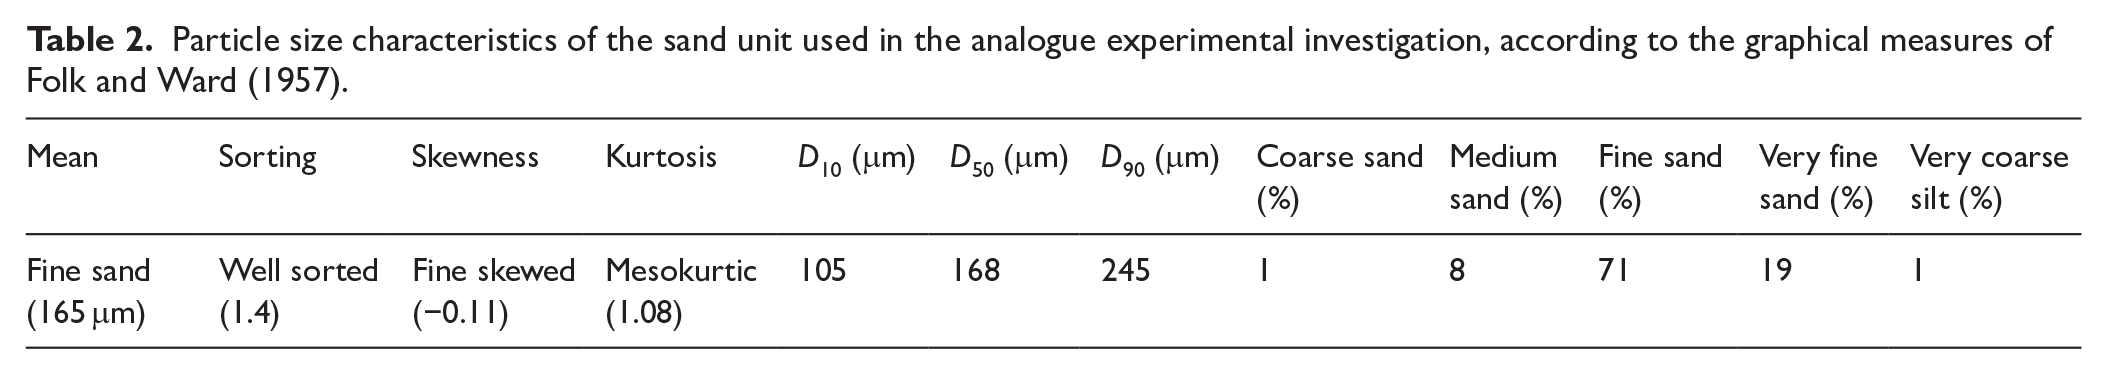
To recreate the sedimentary environment of low-energy estuarine mud overlain by a coarser sand deposit, an analogue experimental investigation was carried out employing a benthic mini-annular flume (Voyager I; Figure 4) with the aim of replicating the types of SSDS found at Location 1 (Figure 1b). The annular flume channel was first filled with a unit of well-sorted, very fine-fine sand to an overall thickness of 3 cm to enable post-experiment drainage (Table 2). A well sorted kaolin clay layer (D < 2 μm) of average thickness of 3 cm was then added to the annular channel above this base sand layer to act as an idealised, deformable mud layer. The clay was allowed to settle over a 24 h period to enable full deposition onto the lower sand base unit. The same very fine-fine sand was then carefully placed in the annular channel above this clay layer to represent the tsunami deposit with a mean thickness of 3 cm (Figure 4). In preparation for the experimental run, the flume was gradually filled with water over 2–3 h in order to minimise disturbance to the sediment layers. A controllable electric motor drives the rotation rate Ω (rpm) of four paddles within the annular channel that exert a shear stress on the sediment bed layers (Figure 4c). In this way, the paddle rotation rate Ω was increased incrementally at 10 min intervals from 0 rpm up to a maximum of 17.5 rpm (Table 3) and running for a further 2 min before being reduced back to Ω = 0 rpm instantaneously.
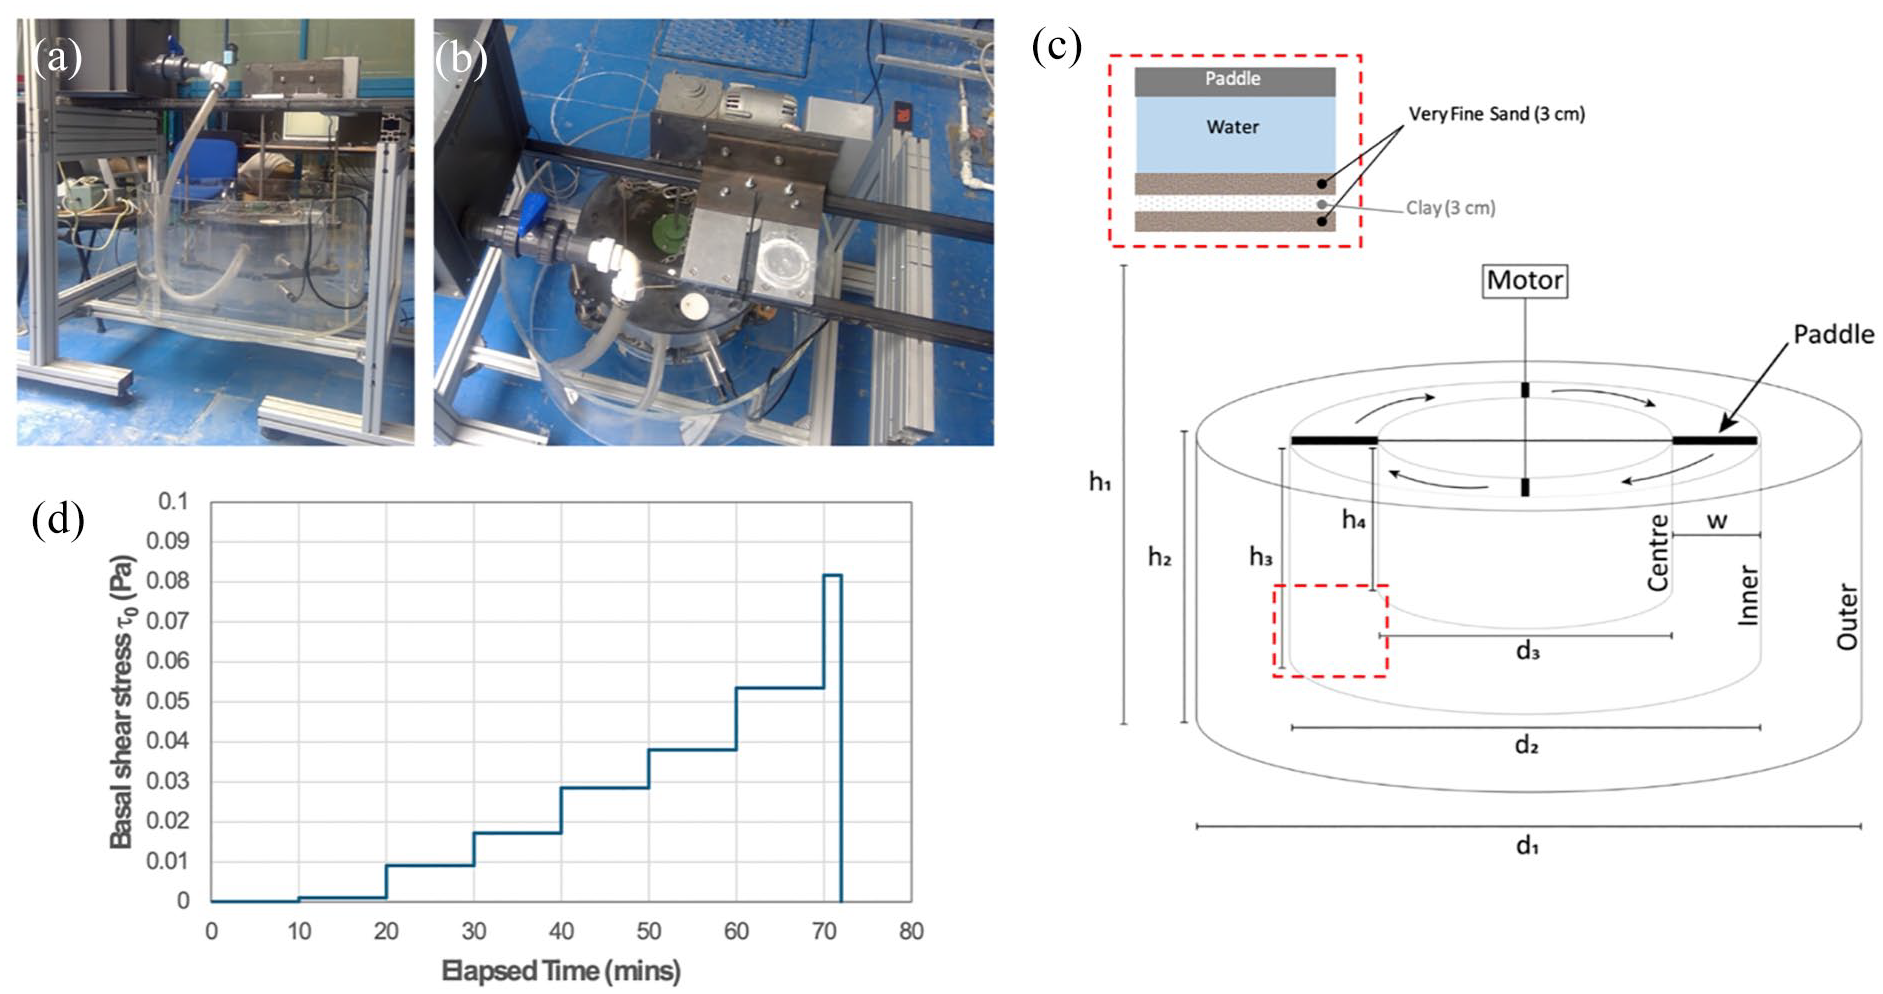
(a and b) Photographs showing the Voyager I portable benthic annular flume arrangement. (c) Schematic of the flume and initial set-up of the layered sand-clay-sand bed. Basal sand, middle unit of clay and upper unit of sand are each 3 cm in thickness. Arrows in annular channel indicate direction of paddle rotation (i.e. clockwise flow direction). Main flume dimensions: h1 (90 cm, total height of wave flume including motor); h2 (41 cm, height of outer channel of the flume); h3 (30 cm, height of inner channel of wave flume); h4 (20 cm, height of centre of wave flume and the water depth from the tips of paddles to sediment bed in the inner channel). d1 (82.5 cm, diameter of outer channel of wave flume); d2 (diameter of inner channel of wave flume); d3 (25 cm, diameter of centre of wave flume); w (12.5 cm, width of the inner channel where paddles produce a basal shear stress). (d) Stepped incremental increase in basal shear stress applied to the layered sand-clay-sand bed (see Table 3 for values).
Particle size characteristics of the sand unit used in the analogue experimental investigation, according to the graphical measures of Folk and Ward (1957).
Motor power dial setting (MPDS) driving the paddle rotation rate (Ω) in rotations per minute (rpm) with horizontal sectional average value for velocity (Ur,ave) and basal shear stress (τ0) in pascals (Pa) for a water depth of 20 cm in the inner channel of the tank (Figure 4c). Ur,ave and τ0 calculated using equations S1 and S2, respectively, found in Supplemental Information A.
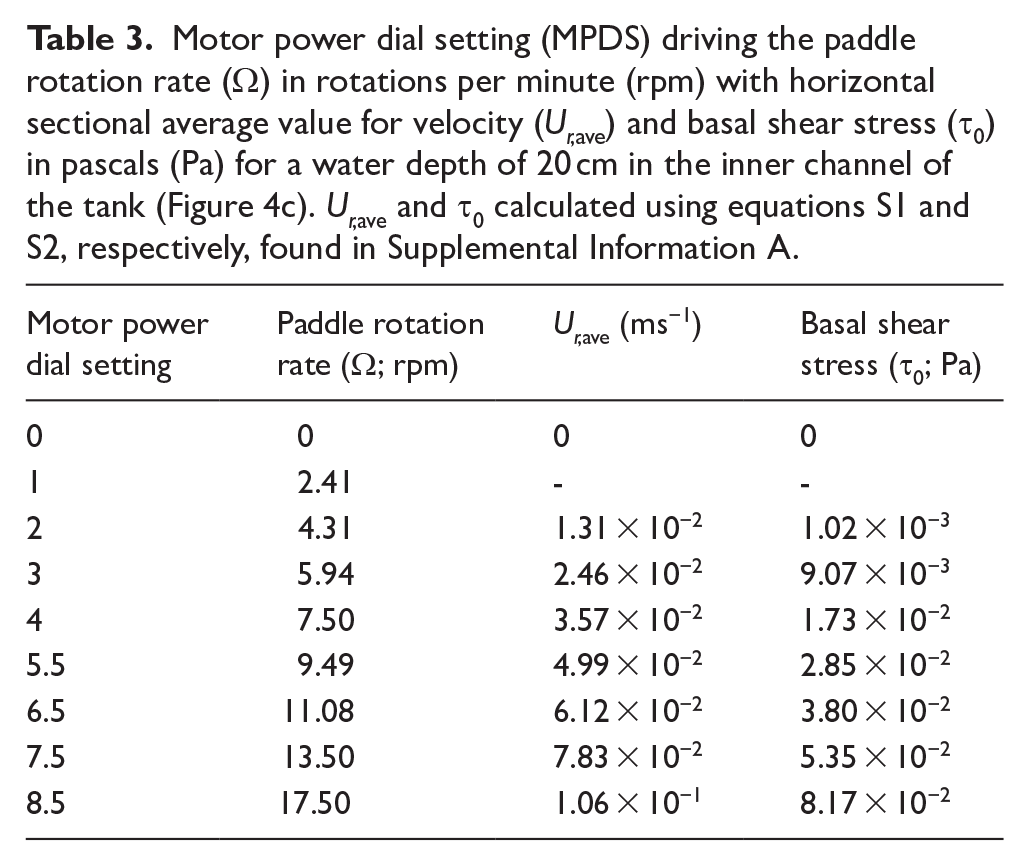
Calibration of the paddle rotation rate (Ω), the average near-bed radial flow velocity Ur,ave and the bed shear stress (τ0) for a bed surface elevation relative to the paddle tips of 20 cm (Figure 4c) has previously been carried out for the same benthic annular flume facility by Davies and Cuthbertson (2006) using 2D particle image velocimetry (2D-PIV; Supplemental Material A).
The erosion and suspension of the upper sand layer and the underlying clay unit during the incrementally-increasing experimental τ0 cycle was monitored using submersible GoPro cameras that recorded the evolving sediment behaviour within the annular flume channel for incrementally increasing τ0 values. Following completion of the experimental run, the mobilised bed was allowed to fully settle and stabilise before the water was drained slowly from the annular flume channel and surrounding tank over a 3 h period. The drained sediment bed was then left to partially dry over a 3 day period before being carefully sampled and analysed for evidence of SSDS at the interface between the clay and upper sand deposit layer.
Results
Lithostratigraphic analysis
Four stratigraphic units are identified on the outcrop section. The stratigraphy consists of Unit 1 (pink clay; sandy silt), Unit 2 (Carse Clay; sandy silt), Unit 3 (micaceous silty sand) and Unit 4 (Carse Clay; sandy silt; Figure 5). Unit 1, 2 and 4 are very fine sandy silts with poor sorting. Unit 3 is coarser (very fine-fine sand) and very poorly sorted due to a higher sand fraction. The Unit 1-2 contact is gradual. Unit 3 has a sharp boundary contact with Units 2 and 4 (Supplemental Material B – Tables S1–S3). All units are laterally continuous, however, Unit 3 becomes undetectable at certain sections on the outcrop (Figures 6, 7 and 9). Unit 1 is consistently around 20 cm thick, thinning to approximately 5 cm at Log C (Figure 5). The thickness of Units 2 and 4 change due to the thickness variations of Unit 3 and both reduce to a minimum at Log C, particularly due to the slumping of the outcrop (Figure 3). Unit 4 is particularly reduced at Log C due to the lowering of the elevation of the outcrop, as the upper vegetated surface is collapsing downwards (Figure 3). Unit 3 ranges in thickness from 0.5 to 8.0 cm (Figures 5 and 6).
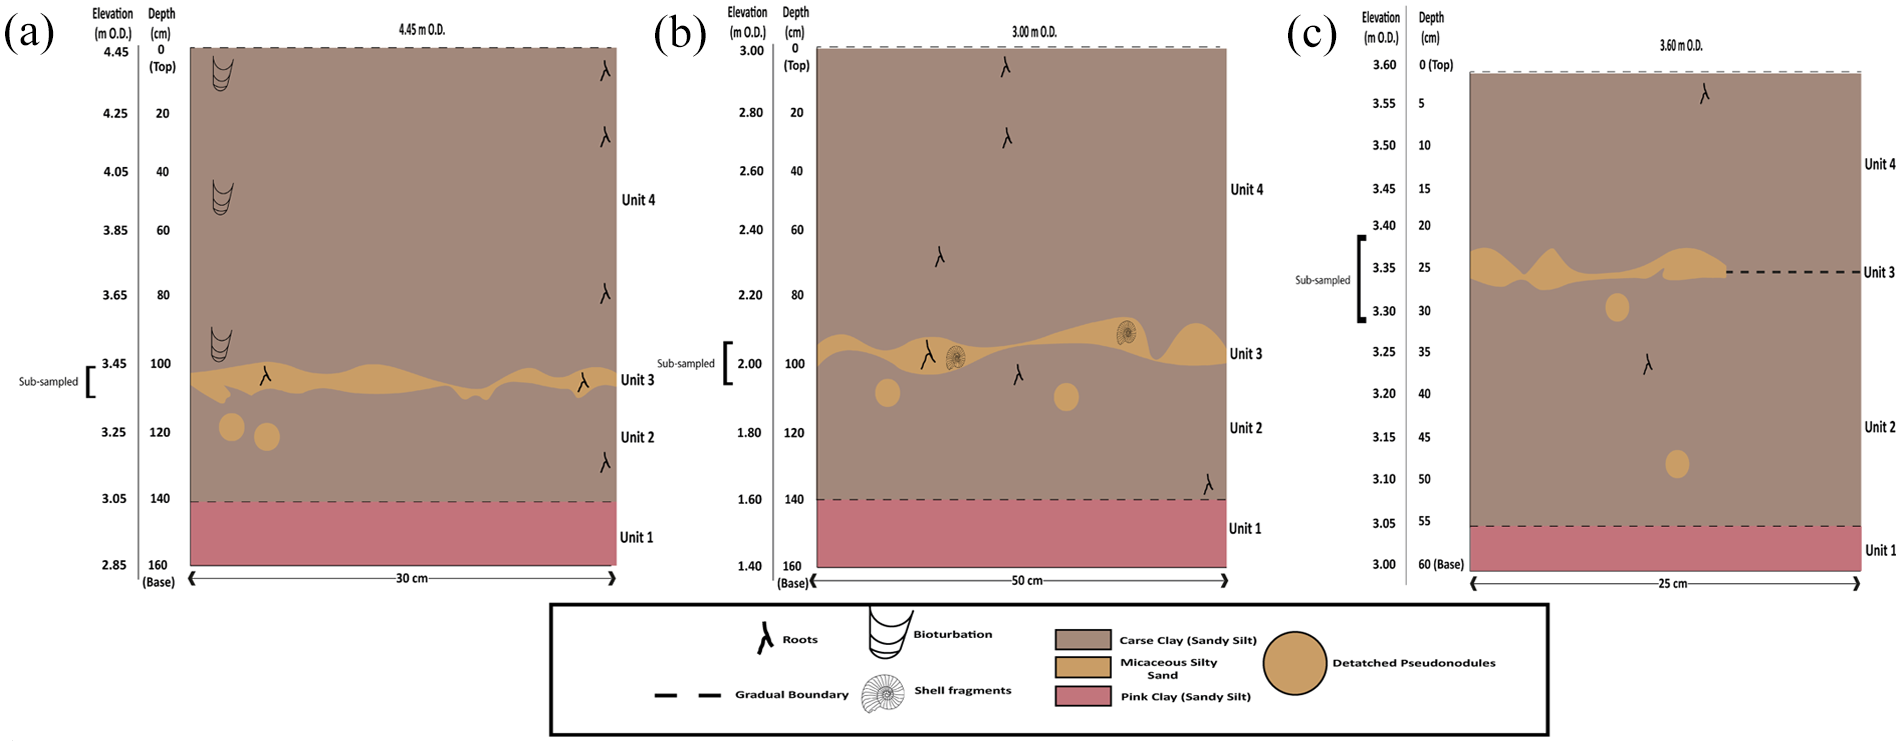
Stratigraphic units identified at the Montrose Basin outcrop. Sedimentary logs (a–c; Figure 3) with legend.
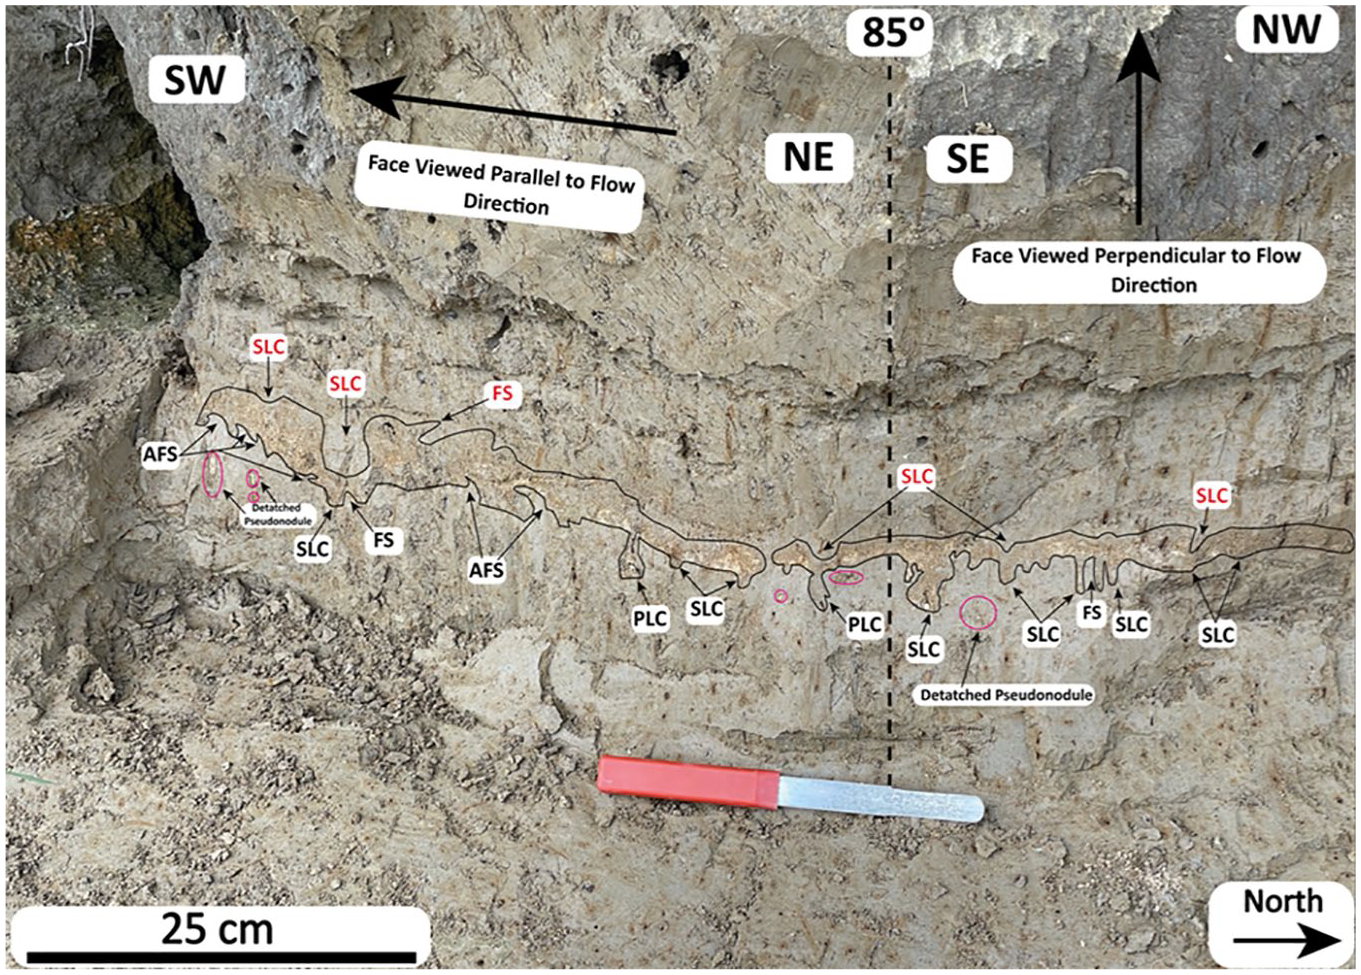
Annotated photograph A (Figure 3), identifying the sand layer (Unit 3; within black outline). Synforms: simple load cast (SLC); pendulous load cast (PLC), and detached pseudonodule (pink circle). Antiforms: flame structure (FS) and asymmetric flame structure (AFS). Dashed line indicates change in direction with angle of difference between the outcrop faces, where features are viewed more parallel (NESW) or perpendicular (NW-SE) to palaeoflow. Black font indicates structures on the lower boundary of the sand layer (Unit 3), where synforms are formed from the sand layer and antiforms by the lower Carse (Unit 2). Red font are structures on the upper boundary, where synforms are formed by the upper Carse (Unit 4) and antiforms by the sand layer.
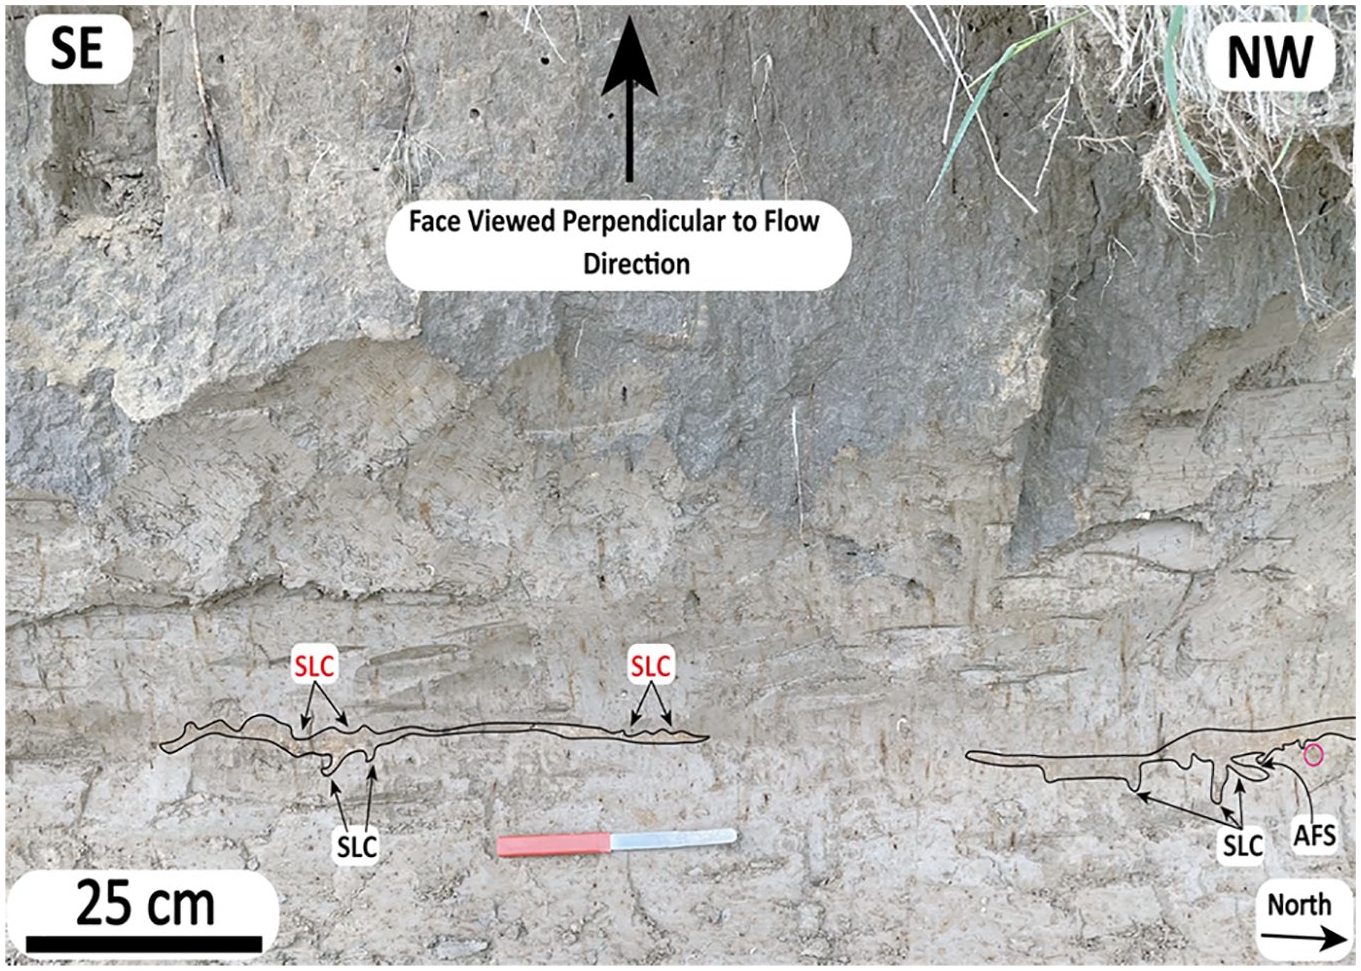
Annotated photograph B (Figure 3), identifying the sand layer (within black outline). Synforms: simple load cast (SLC). Antiforms: asymmetric flame structure (AFS). Black font indicates structures on the lower boundary of the sand layer (Unit 3), where synforms are formed from the sand layer and antiforms by the lower Carse (Unit 2). Red font are structures on the upper boundary, where synforms are formed by the upper Carse (Unit 4) and antiforms by the sand layer.
Soft-sediment deformation structures (SSDS) are identified across the outcrop (Figures 6–9). Synforms from Unit 3 deforming into Unit 2 are present, as well as deforming from Unit 4 into Unit 3. Synforms include SLC, PLC and DP. Antiforms are produced from Unit 2 penetrating upwards into Unit 3 and from Unit 3 into Unit 4. These antiforms are formed of FS and AFS. Eleven single layer AFS are found. AFS are more common on faces parallel to likely palaeoflow directions (NE-SW; 55%) than perpendicular (NW-SE; 45%; Figures 6–9). On the parallel to palaeoflow face, most AFS dip in a SW direction (landward), where one is found to be orientated NE (seaward; Figure 6). The perpendicular faces contain AFS tilted in a SE direction, where two of these illustrate a NW direction (Figures 7–9). Unit 3 also contains embedded marine shell fragments (Figure 8). Additionally, subsampling of box-cores provided detailed analysis of SSDS, sediment type, boundaries, thicknesses, and organics (Figures 10–12; Supplemental Material B – Tables S1–S3).
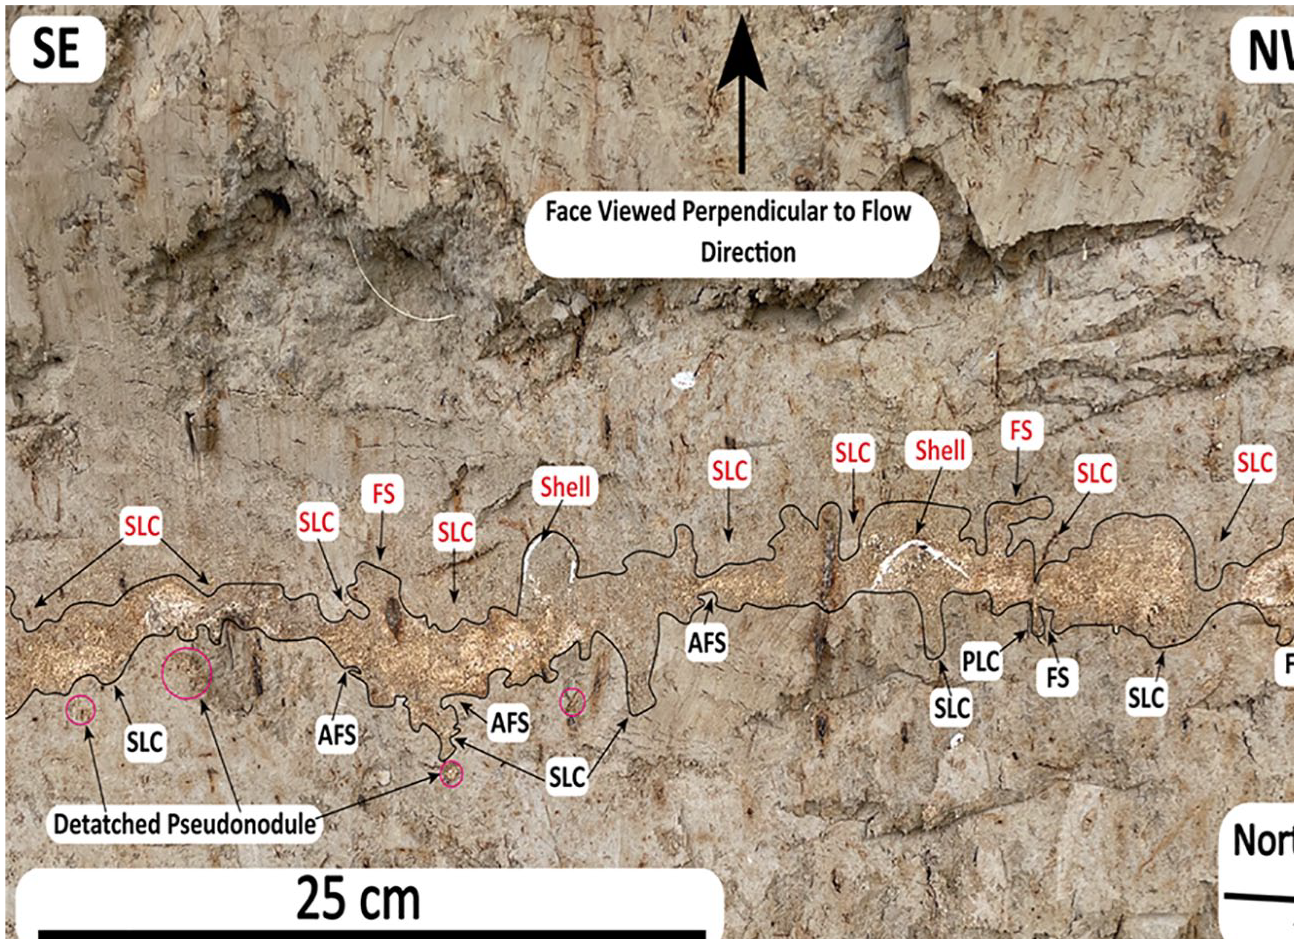
Annotated photograph C (Figure 3), identifying the sand layer (within black outline). Synforms: simple load cast (SLC); pendulous load cast (PLC) and detached pseudonodule (pink circle). Antiforms: flame structure (FS) and asymmetric flame structure (AFS). Shell fragments are also found within the sand layer. Black font indicates structures on the lower boundary of the sand layer (Unit 3), where synforms are formed from the sand layer and antiforms by the lower Carse (Unit 2). Red font are structures on the upper boundary, where synforms are formed by the upper Carse (Unit 4) and antiforms by the sand layer.
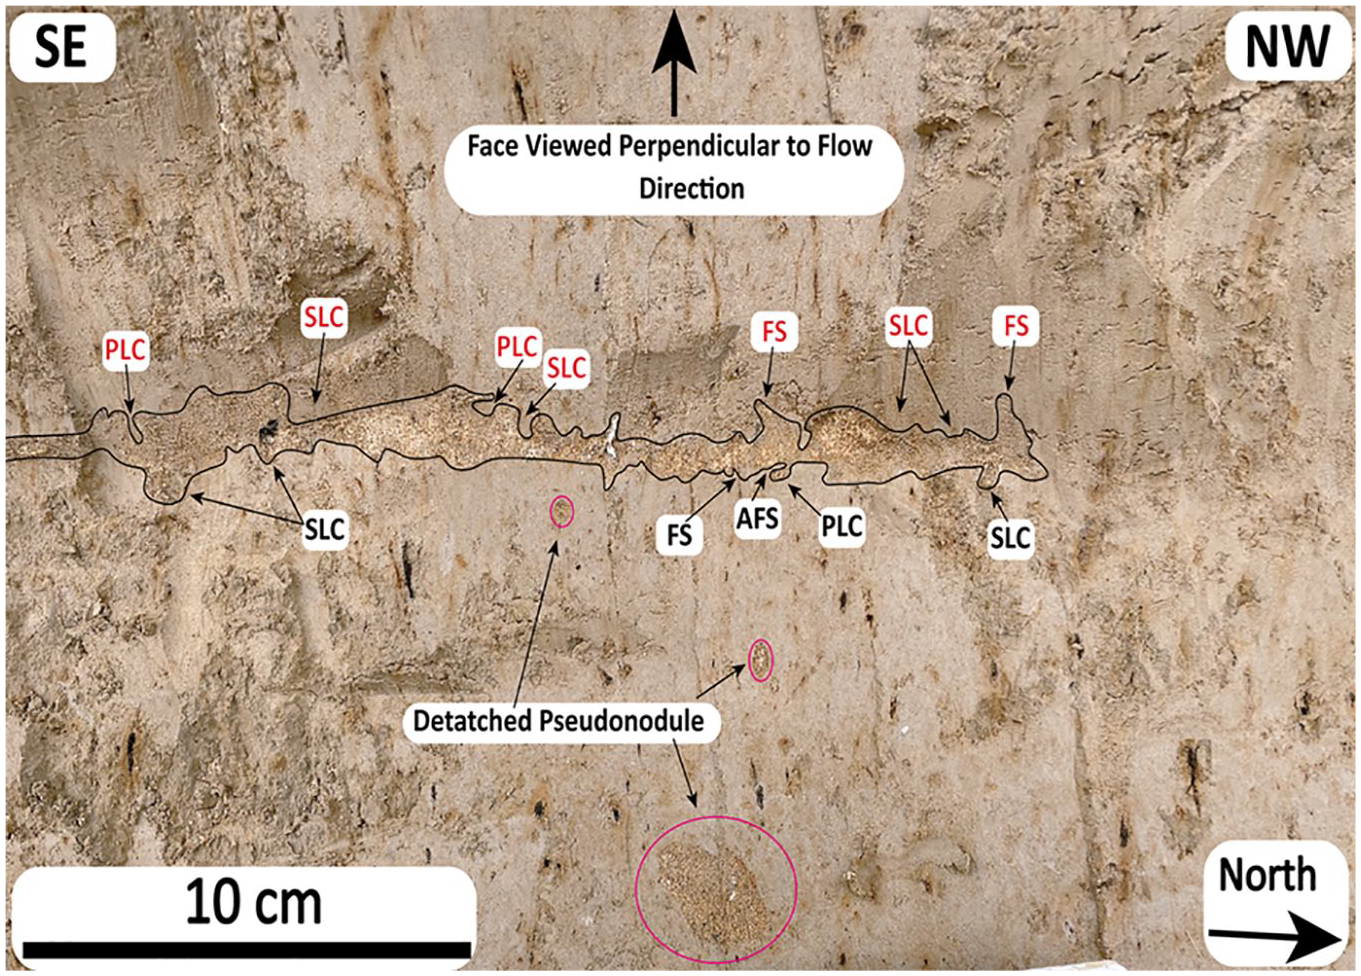
Annotated photograph D (Figure 3), identifying the sand layer (within black outline). Synforms: simple load cast (SLC); pendulous load cast (PLC) and detached pseudonodule (pink circle). Antiforms: flame structure (FS) and asymmetric flame structure (AFS). Black font indicates structures on the lower boundary of the sand layer (Unit 3), where synforms are formed from the sand layer and antiforms by the lower Carse (Unit 2). Red font are structures on the upper boundary, where synforms are formed by the upper Carse (Unit 4) and antiforms by the sand layer.
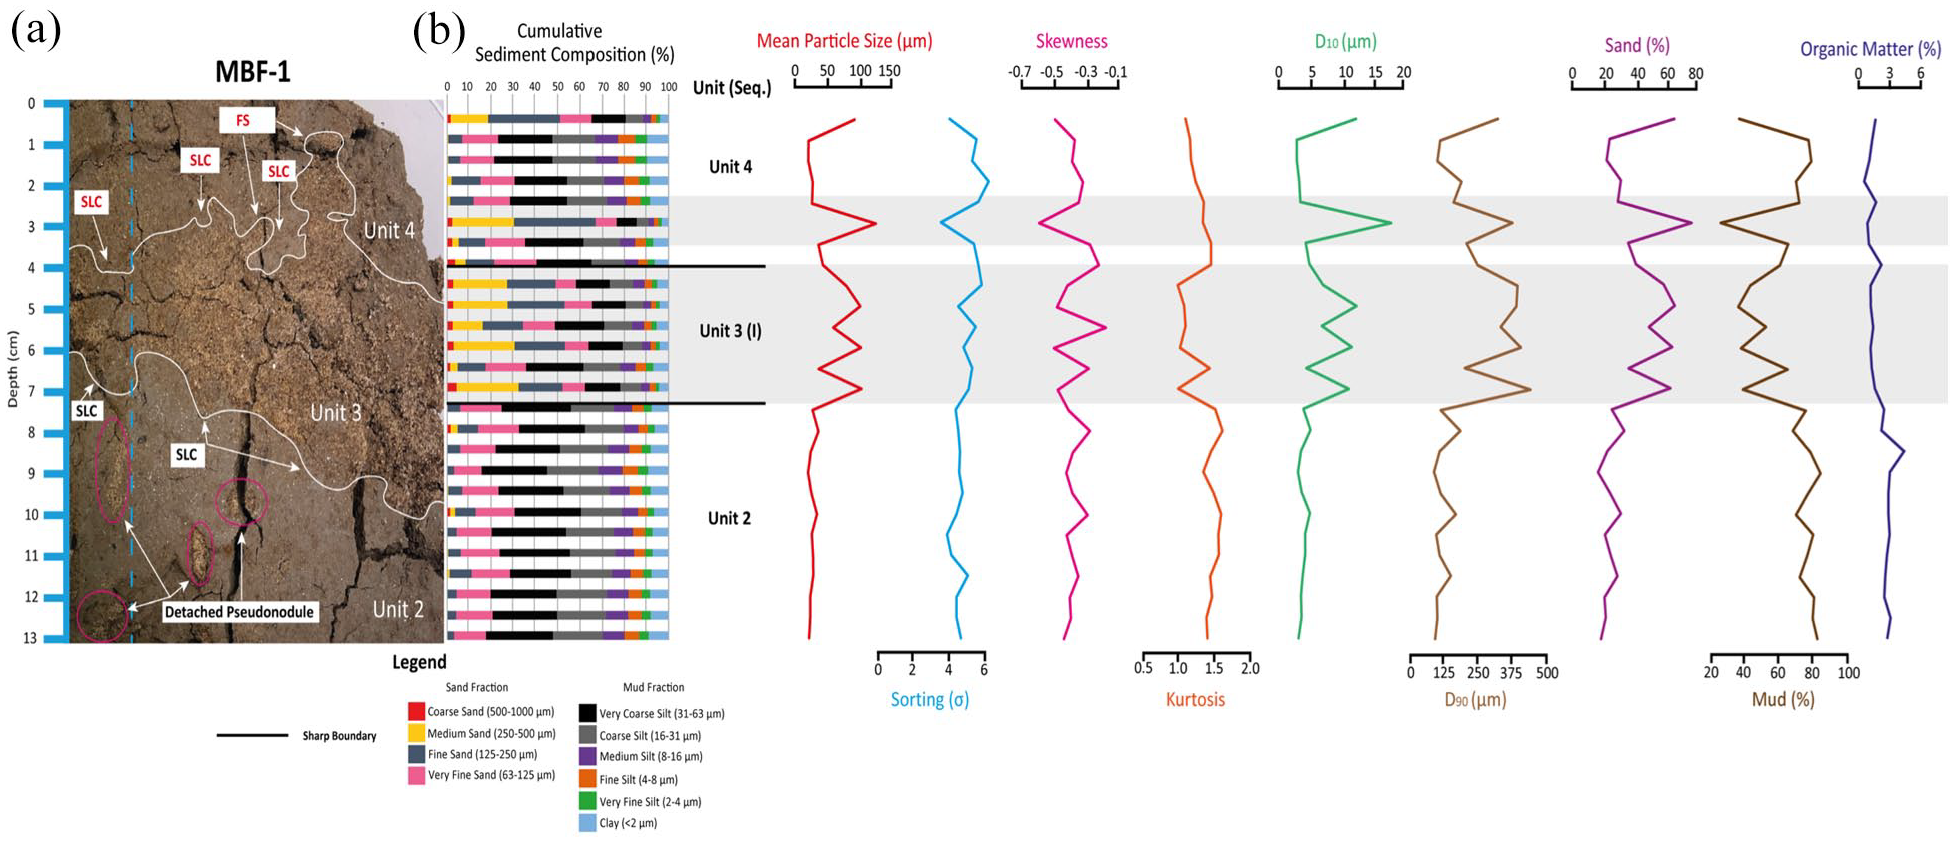
Annotated box-core sample MBF-1. Blue dashed line denotes vertical profile where samples are obtained for each data set on the section of the box-core during subsampling (Supplemental Material B – Table S1). Annotated photograph features include, synforms: simple load cast (SLC) and detached pseudonodule (pink circle). Antiforms: flame structure (FS). Black font indicates structures on the lower boundary of the micaceous silty sand (Unit 3), where synforms are formed from the silty sand and antiforms by the lower sandy silt (Unit 2). Red font are structures on the upper boundary, where synforms are formed by the upper sandy silt (Unit 4) and antiforms by the silty sand. (b) Data from particle size analysis (cumulative sediment composition (with legend), mean particle size, sorting, skewness, kurtosis, D10 and D90), loss on ignition (organic matter content). Shaded areas indicate changes in mean particle size, particularly in Unit 3.
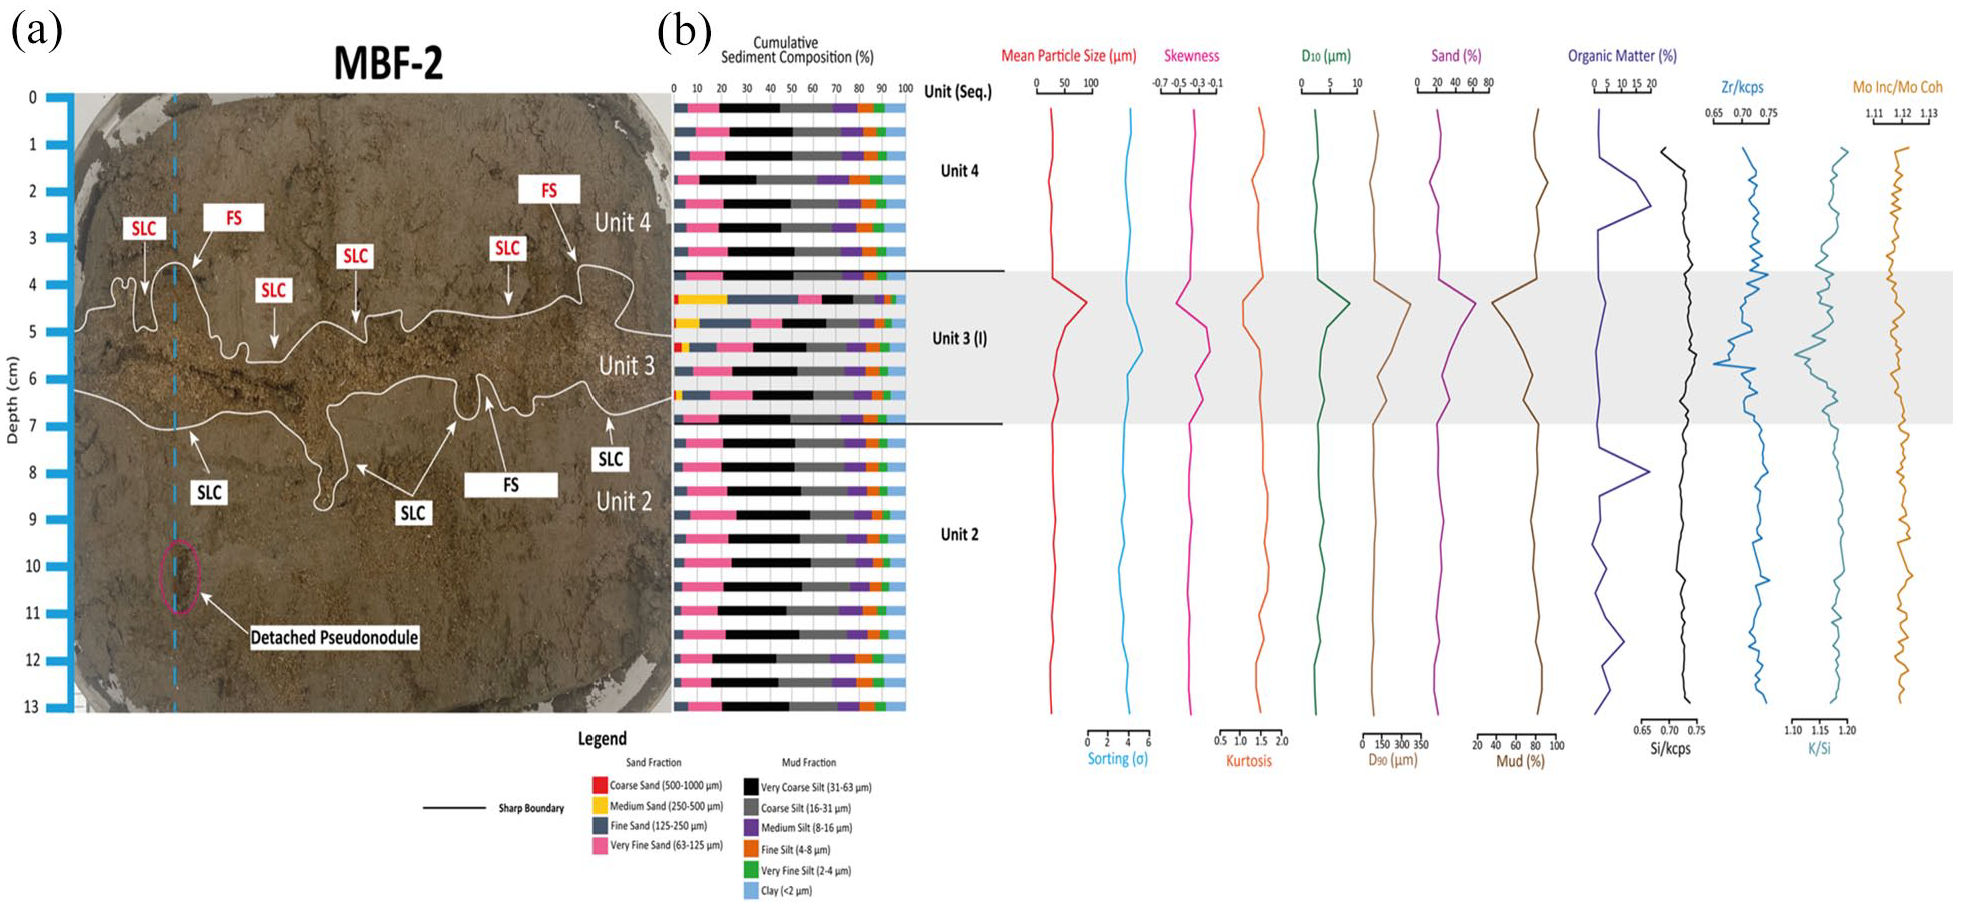
(a) Annotated box-core sample MBF-2. Blue dashed line denotes vertical profile where samples are obtained for each data set on the section of the box-core during subsampling (Supplemental Material B – Table S2). Annotated photograph features include, synforms: simple load cast (SLC) and detached pseudonodule (pink circle). Antiforms: flame structure (FS). Black font indicates structures on the lower boundary of the micaceous silty sand (Unit 3), where synforms are formed from the silty sand and antiforms by the lower sandy silt (Unit 2). Red font are structures on the upper boundary, where synforms are formed by the upper sandy silt (Unit 4) and antiforms by the silty sand. (b) Data from particle size analysis (cumulative sediment composition (with legend), mean particle size, sorting, skewness, kurtosis, D10 and D90), loss on ignition (organic matter content) and μXRF (Si/kcps, Zr/kcps, K/Si and Mo Inc/Mo Coh). Shaded areas in Unit 3 indicates changes in mean particle size.
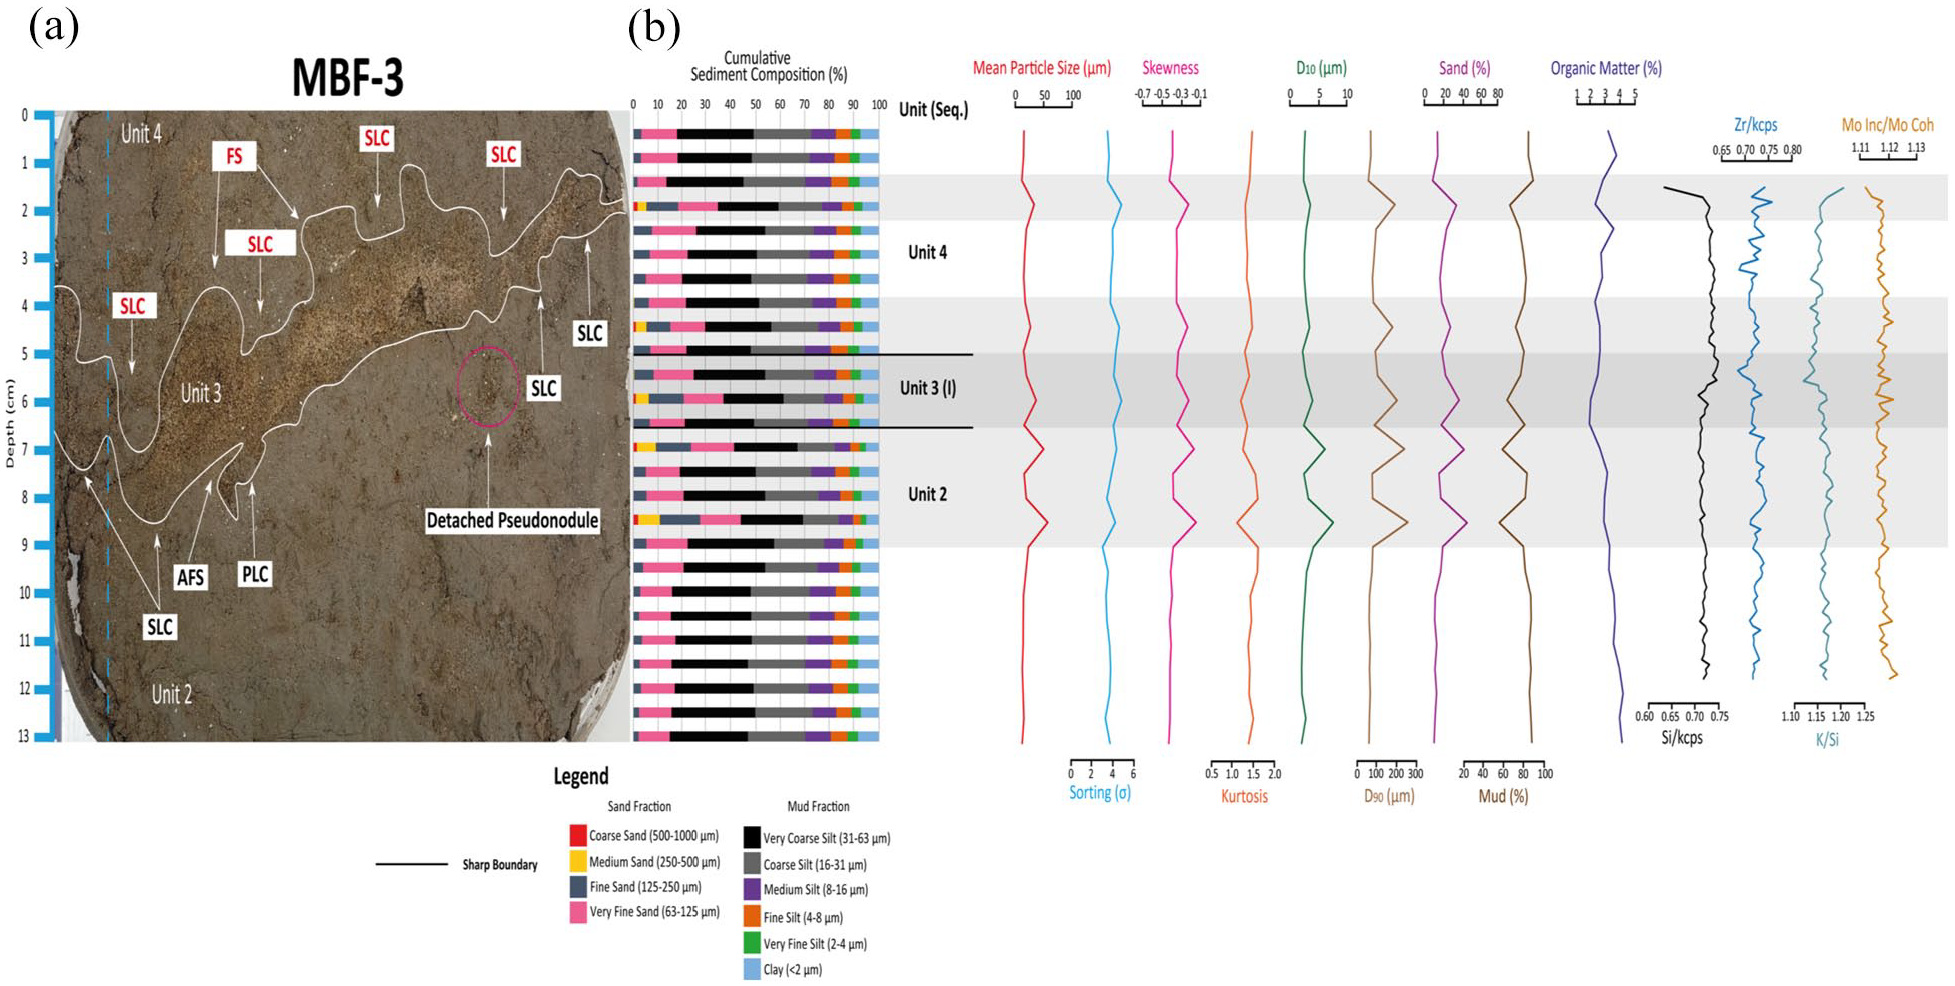
(a) Annotated box-core sample MBF-3. Blue dashed line denotes vertical profile where samples are obtained for each data set on the section of the box-core during subsampling (Supplemental Material B – Table S3). Annotated photograph features include, synforms: simple load cast (SLC); pendulous load cast (PLC) and detached pseudonodule (pink circle). Antiforms: flame structure (FS) and asymmetric flame structure (AFS). Black font indicates structures on the lower boundary of the micaceous silty sand (Unit 3), where synforms are formed from the silty sand and antiforms by the lower sandy silt (Unit 2). Red font are structures on the upper boundary, where synforms are formed by the upper sandy silt (Unit 4) and antiforms by the silty sand. (b) Data from particle size analysis (cumulative sediment composition (with legend), mean particle size, sorting, skewness, kurtosis, D10 and D90), loss on ignition (organic matter content) and μXRF (Si/kcps, Zr/kcps, K/Si and Mo Inc/Mo Coh). Shaded areas indicate changes in mean particle size, particularly within Unit 3.
Particle size analysis & loss on ignition
Figure 10 and Supplemental Material B (Table S4) displays PSA data for MBF-1. Unit 2 has a mean particle size of coarse silt-very coarse silt and is poorly-very poorly sorted. For Unit 2, there is an overall low sand (15.4–32.5%) and higher mud fraction (67.5–84.6%). Unit 3 consists mostly of very fine sand, where this fines to a very coarse silt at 6.5–6.0 cm and 5.5–5.0 cm. Unit 3 shows no clear grading trend, the data points reflect alternating fine and coarse peaks without consistent trends, therefore Unit 3 is ungraded. Conversely, from 5 to 4 cm there is a fining in the mean and sediment composition, however, this only covers two data points. Unit 3 is mostly very poorly sorted. Unit 3 has a higher sand fraction (35.5–65.7%) than Units 2 and 4. Unit 4 contains a range of mean particle size changes, including coarse silt, very coarse silt, very fine sand, and fine sand where the sorting is poor-very poor (Figure 10). The sand fraction (21.1–76.6%) is greater in this unit where the mean particle size is increased due to increases in sand subpopulations, however, the mud fraction (23.4–78.9%) is dominant throughout the other intervals in the unit. The majority of samples in MBF-1 are very fine skewed, with few being fine skewed. Majority of samples have a leptokurtic distribution, where this is very leptokurtic for samples in Unit 2 and a mesokurtic distribution arising for samples within Unit 3. MBF-1 has an overall low organic matter content (OMC), ranging from 1.8-4.1%, which is greatest in Unit 2 and reduced within Unit 3 and 4 (Supplemental Material B – Table S5; Figure 10).
Figure 11 and Supplemental Material B (Table S6) shows PSA data for MBF-2. Unit 2 contains a mean particle size of coarse silt and is poorly-very poorly sorted. The reduced sand (16.2–26.9%) and higher mud (73.1–83.8%) fraction are relatively constant throughout this unit. Unit 3 shows one clear coarsening-upwards sequence from coarse silt at the base (7 cm) to very fine sand (4.5 cm) before fining to coarse silt at the top of the unit (4–3.5 cm). This makes Unit 3 inversely graded with normal grading above (4–3.5 cm). However, this normal grading is based on just two data points. Unit 3 is very poorly sorted throughout, with poor sorting at the base (7 cm). The sand fraction (19.4–63.7%) is more abundant in Unit 3 compared to the other units. Unit 4 has a mean of coarse silt and is very poorly sorted. The sand (10.9–23.9%) and mud (76.1–89.1%) fractions are relatively constant within Unit 4. All samples in MBF-2 are very fine skewed, where few within Unit 3 are fine skewed. Kurtosis is variable through the samples, dominated by a leptokurtic distribution. A very leptokurtic distribution is present within parts of Units 2 and 4. Additionally a mesokurtic distribution is found for samples within Unit 3. MBF-2 has a large range in OMC from 0.8% to 20.0% (Supplemental Material B – Table S7; Figure 11). Unit 3 maintains a steady trend of reduced OMC, where Units 2 and 4 contain greater peaks of 5.1% and 20%, respectively. However, the peaks of up to 20% in organic matter content within Units 2 and 4 in MBF-2 likely arise from root penetration from the surface vegetation above the outcrop (Figures 3 and 5).
Figure 12 and Supplemental Material B (Table S8) exhibits PSA data for MBF-3. The mean particle size of Unit 2 varies from coarse silt-very coarse silt. Unit 2 is poorly sorted, becoming very poorly sorted where the mean is very coarse silt. The mud fraction (56.5–85.2%) is greater than the amount of sand (14.8–43.4%) in this Unit. Unit 3 is thin compared to Unit 3 in MBF-1 and -2. This contains a mean particle sizes of coarse silt-very coarse silt-coarse silt and is very poorly sorted. This change in particle size is reflected by one sequence in this unit, which is constrained by only three data points. No clear trend present in this sequence suggests it is ungraded. Additionally, the mean and sediment composition depict Unit 3 as a micaceous sandy silt, similar to the sandy silt which comprises Unit 2 and 4, despite being part of the same micaceous silty sand unit found in MBF-1 and -2. The sand fraction (21.0–36.5%) is overall reduced in comparison to the mud (63.5–79.0%). Unit 4 has a mean particle size of coarse silt-very coarse silt. Sorting in Unit 4 ranges from poorly-very poorly sorted. The sand fraction (13.5–34.1%) is overall reduced compared to the mud fraction (65.9–86.5%). The mean of all units in MBF-3 are within the mud fraction (silt). Majority of the samples are very fine skewed, with the exception of where the mean is very coarse silt within each unit, becoming fine skewed. Kurtosis for MBF-3 is a leptokurtic distribution, becoming very leptokurtic in parts of Units 2 and Unit 4. The OMC in MBF-3 is similar to that of MBF-1, ranging from 2.2% to 4.0% (Supplemental Material B – Table S9; Figure 12). Unit 3 is reduced in OMC compared to Units 2 and 4.
The poor-very poor sorting of the units in MBF-1, -2 and -3, as well as span values, represents the wide particle size distribution throughout all units, where this distribution is detailed by the cumulative sediment composition and D10 and D90 values (Figures 10–12 and Supplemental Material B – Tables S4, S6 and S8). D10 and D90 follow the same trend as the mean particle size changes due to the increases and decreases in sand and mud content as the subpopulations vary (Figures 10–12). The range of particle sizes gives rise to bi- and multi-modality throughout each of the units, while uni-modal distributions are also present.
Micro-X-ray fluorescence
MBF-2 contains distinct trends within the geochemical proxies (Figure 11; Supplemental Material C). There is an overall increase of Si/kcps (Table 1) within Unit 3. Si/kcps rises with greater sand subpopulations, particularly with fine-coarse sand becoming more prominent within Unit 3 compared to Units 2 and 4 (Figure 11). Unit 3 has a reduction of Zr/kcps (Table 1) from 5.8 to 5.7 cm before increasing to the top of this unit – reflecting the coarsening upwards of particles, greater fine sand. Units 2 and 4 demonstrate a similar increased Zr/kcps signal. K/Si reflects the changes in the mud fraction (Table 1), with a similar overall trend through Units 2–4 as that of Zr/kcps (Figure 11). K/Si mostly matches the coarsening and fining in the Sequence, reflecting the mud fraction which dominates Unit 3. However, from 5.5 to 4.5 cm, K/Si is generally increasing in this interval, while the mud fraction is decreasing. Conversely, the mud fraction does remain high (65.70–36.3%) and K/Si has a decrease where the mud fraction reaches this minimum. The Mo ratio (Mo Inc/Mo Coh) is relatively consistent throughout MBF-2, where there is a decreasing trend through Unit 3. The Mo ratio aligns well with the higher peaks and lower peaks in OMC, however, the pronounced higher peak at 8 cm is missing in the Mo ratio, where the peak at 2.5 cm is less pronounced (Figure 11).
Geochemical proxies also show variability throughout MBF-3 (Figure 12; Supplemental Material C). Si/kcps contains an increase through the Sequence, particularly in the upper section from approximately 6–5 cm, however, this aligns with a decrease in the sand fraction in this interval. Si/kcps is reduced but consistent in Unit 2 and is higher and stable in Unit 4. Changes in Si/kcps display the varying sand subpopulations, however, this sand content is overall reduced in comparison to the prevailing mud fraction in MBF-3. Unit 3 contains a distinct high peak in Zr/kcps at 6 cm, aligning with the coarse peak in the Sequence. Zr/kcps is depicting the subpopulations of the sand fraction, particularly very fine-fine sand throughout all units (Table 1). K/Si captures the mean particle size peak in the Sequence (very coarse silt) before reducing to the top of Unit 3 (Figure 12). K/Si is uniform within Unit 2 and Unit 4 has an increasing trend. K/Si mostly has a direct relationship with the mud fraction for all of the units. Through Unit 3, the Mo ratio rises slightly with peaks in OMC (Figure 12). The Mo ratio follows the same overall increased and decreasing trend in OMC from the base to top of both Units 2 and 4.
Annular flume experiment
The stepped incremental increase in basal shear stress (τ0) applied to the layered sand-clay-sand bed units (Figure 4c and d) resulted in the initial mobilisation of the upper sand layer at a paddle rotation rate Ω = 4.31 rpm (τ0 = 0.001 Pa), with increasing sand entrainment with increasing Ω (Figure 13a). At Ω = 11.08 rpm (τ0 = 0.038 Pa), the underlying clay layer becomes exposed and begins to erode, with clay particles beginning to be entrained into the flow along with the suspended sand (Figure 13b). This sand-clay entrainment process continues to proceed, with the clay unit being increasingly exposed and eroded as the upper sand unit is entrained (Figure 13c and d). The majority of the upper sand unit is in full suspension at the highest paddle rotation rate Ω = 17.5 rpm (i.e. corresponding to the highest basal shear stress τ0 = 0.0817 Pa; Figure 13d).
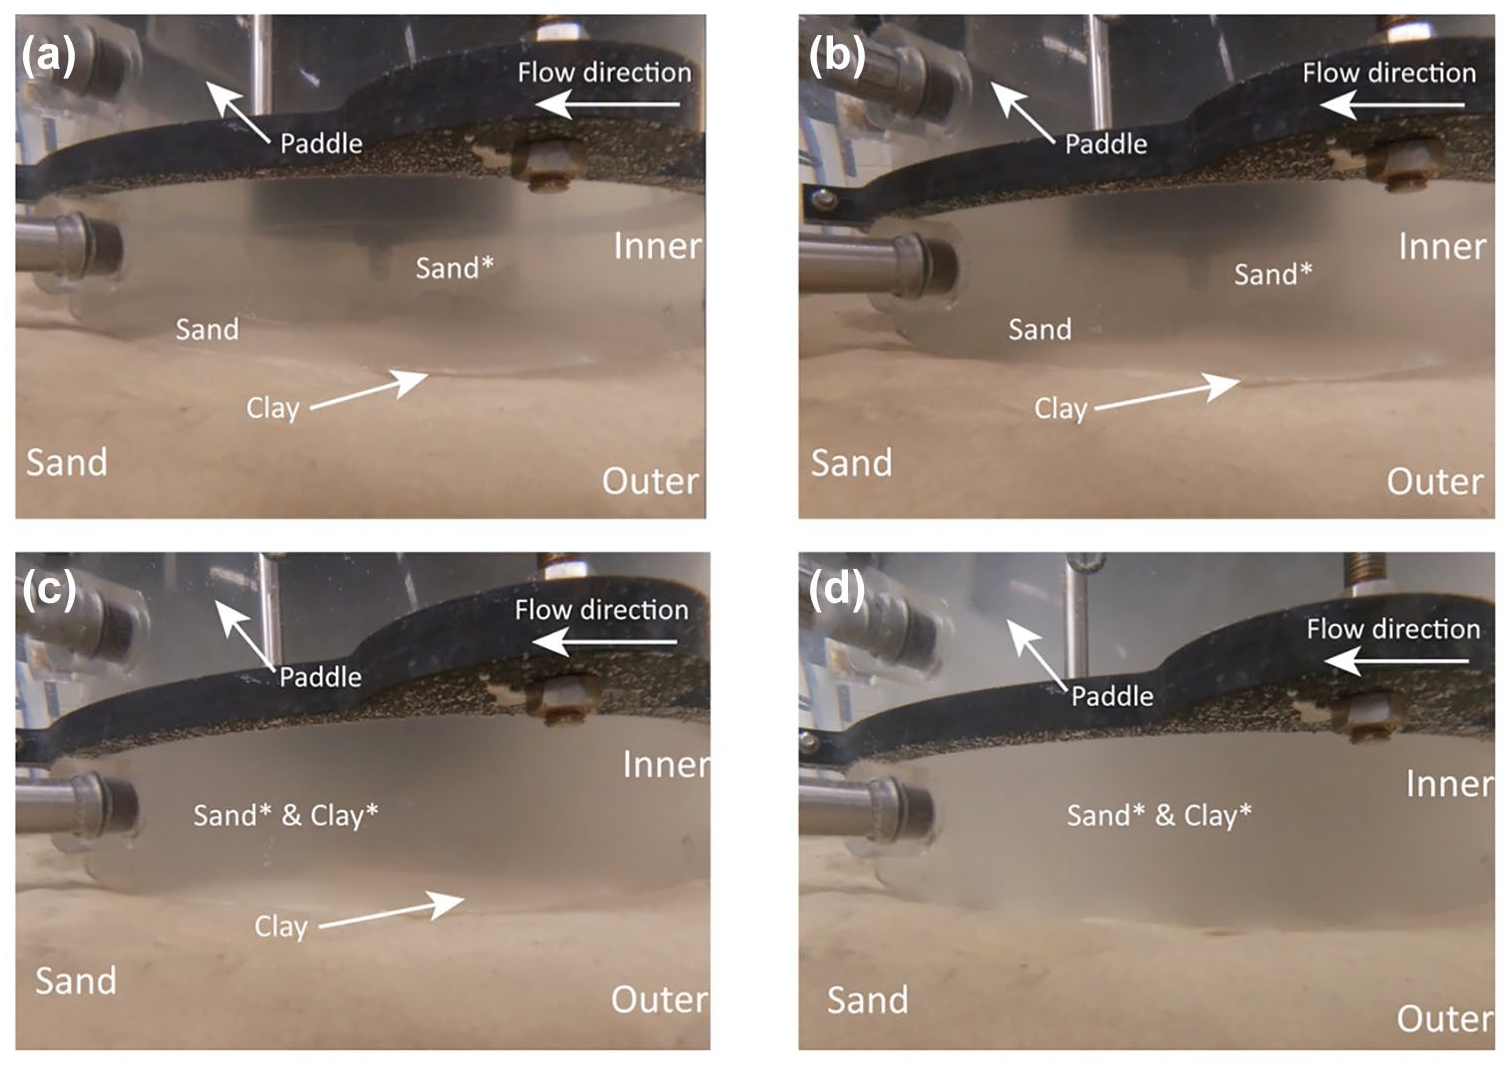
Photographs of annular flume experiment with flow direction, paddles and outer and inner channels (Figure 4c). Outer and inner channels contain a sand bed. Inner channel has a clay unit below the sand. (a) Paddle rotation rate (Ω) = 7.50 (Table 3). Sand in suspension within inner channel of tank, exposing parts of the lower clay unit. (b) Ω = 9.49. Greater sand content in suspension, exposing more of clay unit. (c) Ω = 11.08. Higher entrainment of sand and more exposure of the clay unit, erosion and entrainment of clay occurs. (d) Ω = 17.50. Majority of sand in suspension, further erosion of clay.
It should be noted that throughout the experiment, no erosion of the basal sand unit occurred meaning that the clay unit was exposed to the highest shear stress levels prior to stopping the flow. In this regard, it was anticipated that the clay layer exposure to the increasing τ0 acting on the bed would have acted to initiate the formation of sedimentary structures at the upper interface between the clay layer and the suspended sand-clay mixture (initiated by high basal shear and sand deposition following the cessation of the flow).
Sections excavated through the post-experimental bed layers (Figure 14), indicate deformation of the clay unit (particularly on the upper interface with the overlying sand deposit). This deformation appears to have resulted in the formation of micro-structures, including SLC, PLC, FS and AFS (most notable when viewed parallel to flow; Figure 14a and b). However, some of these features are, on occasion, relatively small and some caution is required in their interpretation. Similar small-scale interfacial features and micro-structures are also suggested in a cross-section through the bed layers that runs perpendicular to the flow direction (i.e. cross-channel section; Figure 14c). Although not entirely conclusive, these structures do suggest that the combination of basal stress and sand deposition does deform the upper boundary of the soft-sediment clay layer, resulting in the formation of micro-structures that are geometrically analogous to those identified in the lithostratigraphic analysis.
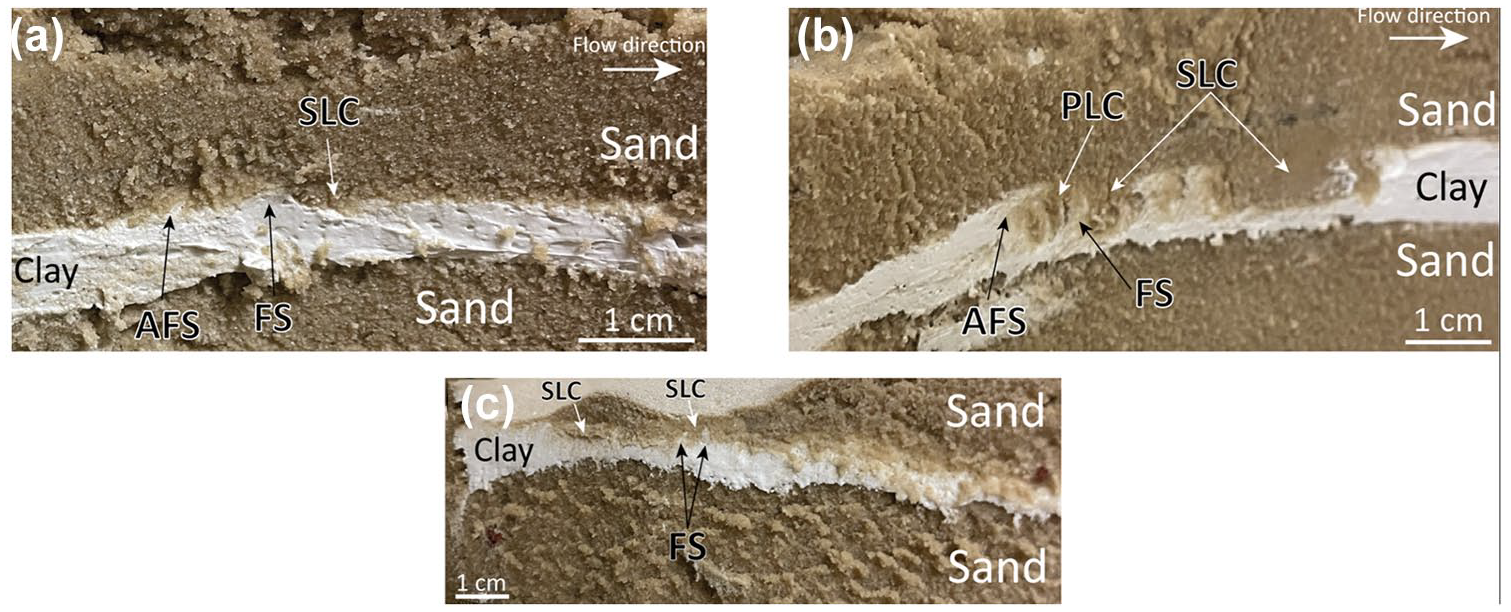
Soft-sediment deformation structures created during annular wave flume experiment (Figure 4c). (a and b) Depict structures formed parallel to flow direction. (c) Shows structures formed perpendicular to flow. Synforms: simple load cast (SLC) and pendulous load cast (PLC). Antiforms: flame structure (FS) and asymmetric flame structure (AFS).
Discussion
Depositional environment
Stratigraphic units at location 1 (Figure 1b) reflect distinct depositional settings. Unit 1, basal pink clays, were deposited within a Late Devensian marine environment (Smith et al., 1985; Smith and Cullingford, 1985). Units 2 and 4, Carse Clay (sandy silt) indicate a low-energy estuarine environment, with poor-very poor sorting due to biological cohesion (extracellular polymeric substances) trapping sand within the mud matrix (Malarkey et al., 2015). These units form the uplifted Carseland surfaces, where Unit 2 forms the MPS, as the MPT was occurring during the period of the tsunami, and Unit 4 likely comprises an overlapping of this shoreline and the younger BDS (Smith et al., 1980, 2004, 2012).
During the MPT, the basin would have been a more open embayment, as the raised Holocene marine barrier to the east on which the town of Montrose resides (Figure 1b) would have been less pronounced. This barrier is formed of Carse Clay, sand and gravel and developed during same period as the formation of the MPS and thus was beginning to form during the period of the tsunami event (Smith and Cullingford, 1985). Additionally, the age of the BDS on the seaward margin at Dryleas (Figure 1b) of 4406–3639 cal. yr. BP argues that the formation of part of the surface of the raised Holocene marine barrier post-dates the tsunami event (Smith et al., 2006). However, the palaeogeography of the former area still reflects a quiescent low energy embayment promoting deposition of the muds.
Unit 3, micaceous silty sand, is deposited within the sandy silt units. Unit 3 has a higher sand fraction as shown by PSA and higher Si/kcps, increasing Zr/kcps signature and overall lower K/Si. The sharp boundary contacts, coarser sediment containing sequences that are ungraded (MBF-1 and -3) or inverse-normal grading (MBF-2), poor-very poor sorting, shell fragments, and SSDS collectively distinguish Unit 3 as a high-magnitude event deposit. As nearby sites surrounding the Montrose Basin contain the confirmed 8.15 ka yr BP Storegga Submarine Landslide Tsunami deposit (Figure 1b), it is highly likely that Unit 3 arises from the same event.
All Units are currently found above present RSL (Figure 5) due to glacio-isostatic uplift since the Late Devensian period. Due to this uplift, the stratigraphical units must have been originally deposited in a more submerged estuarine environment, as RSL rise was greater than the rate of uplift during this period. Additionally, the little evidence of organics throughout each unit, where the roots are from the contemporary vegetation above the outcrop (Supplemental Material B – Tables S1–S3), and low OMC further argues the units were deposited in a submerged environment.
Sediment Dynamics
Grading patterns in the box-cores reveal variations in the flow and depositional regime. Inverse grading identified in MBF-2 indicates sediment transport via a traction carpet (Figure 11). This is characterised by a highly concentrated bedload driven by high shear stresses in the turbulent flow above which transports suspended sediment (Moore et al., 2011; Sohn, 1997; Sumner et al., 2008). Within this traction carpet, particle interactions induced kinetic sieving and geometric sorting, whereby coarser particles were preferentially forced upward while finer particles (e.g. clay-very fine sand) migrated downward towards the base of the bedload during flow (Dasgupta and Manna, 2011; Middleton, 1970; Moore et al., 2011; Sohn, 1997). This is evidenced by greater amounts of the sand fraction (fine-coarse sand; 5.5–4.5 cm) above intervals which are mud-rich (fine silt-very coarse silt; 7–6 cm; Figure 11). Kinetic sieving also operated during deposition. Finer particles in both suspension and bedload moved downward through interstitial spaces between coarser particles during sedimentation (Yoshii et al., 2018). This enhanced the development of inverse grading, as coarser particles were reworked to the top of the bedload.
Fining at the top of the inversely graded unit reflects the finer sediment which was in suspension above the traction carpet and contains a range of mud and sand subpopulations (clay-fine sand; 4–3.5 cm), a spectrum of these size fractions is also found in the inversely graded section (clay-coarse sand; Figure 11). The poor-very poor sorting throughout Unit 3 in MBF-2, as well as the range of particle subpopulations, supports capacity-driven sedimentation of the traction carpet and suspension load.
Capacity-driven sedimentation occurs when the sediment load exceeds the transport capacity of the flow, typically as velocity and shear stress decline due to increased friction with the bed, resulting in rapid deposition from the flow (Hill et al., 2023; Hiscott, 1994; Naruse and Abe, 2017). Sedimentation occurs at higher velocities, that is, those which an unladen flow with identical velocity could transport the same particles. However, the fining upwards that produces the normal grading may reflect a competence-driven phase, where coarser particles settled towards the bedload as the flow began to wane, prior to the onset of a capacity-driven regime.
The ungraded sediment observed in MBF-1 and -3, indicated by no clear trend in the mean, sediment composition and poor-very poor sorting, suggests particle sorting did not occur (Figures 10 and 12). Hindered settling, which can create ungraded deposits, may have occurred due to the range of particle sizes in Unit 3 (Cartigny et al., 2013; Druitt, 1995). However, the finer mud particles (e.g. clay-medium silt) makes hindered settling unlikely. A continuing flow would be expected to retain sufficient velocity and τ0 to transport these fines. Therefore, the ungraded structure of the Unit is due to a capacity-driven sedimentation regime.
The tsunami deposit exhibits considerable spatial variability in composition across a relatively short outcrop section. All box-cores are interpreted to contain the imprint of at least one inundation phase, where this variation in grading styles may reflect anisotropy of the turbulent flow. MBF-2 may represent a higher velocity and τ0 capable of forming a traction carpet, while MBF-1 and -3 reflect a lower-energy inundation flow. MBF-3 contains a notably thinner deposit and a much higher mud fraction compared to MBF-1 and -2 (Figures 10–12), which could be interpreted as a backwash deposit. The backwash phase is thought to be mud-laden due to excess finer sediment remaining in suspension from inundation (Shi, 1995). However, the geochemical signatures do not support a backwash origin. The terrestrial Mo ratio in Unit 3 of MBF-2 and -3 closely resembles that of the underlying and overlying Carse, and OMC is similarly reduced in Unit 3 across all box cores (Figures 10–12). Additionally, there is no evidence of erosional surfaces, for example, a sharp change in composition within Unit 3, which could indicate backwash deposition.
At MBF, the stratigraphy is complex in comparison to nearby Maryton which has previously been studied (Location 3; Figure 1b). Up to three inundation waves have previously been identified at Maryton (Bateman et al., 2021; Smith et al., 2004), while each box-core at MBF shows a different sedimentary imprint and fewer wave phases are preserved. This may be due to post-depositional alterations. Nevertheless, the characteristics of all box-cores indicate that they represent an inundation deposit.
Formation of sedimentary structures
The outcrop section is the only location with visible SSDS. The lower, more cohesive Carse Clay (sandy silt) Unit 2 (Figure 15a) would have been under a liquefied state. The sediment was in a fully saturated state and had a very low effective yield strength, promoting the formation of SSDS (Allen, 1982; Owen, 2003).
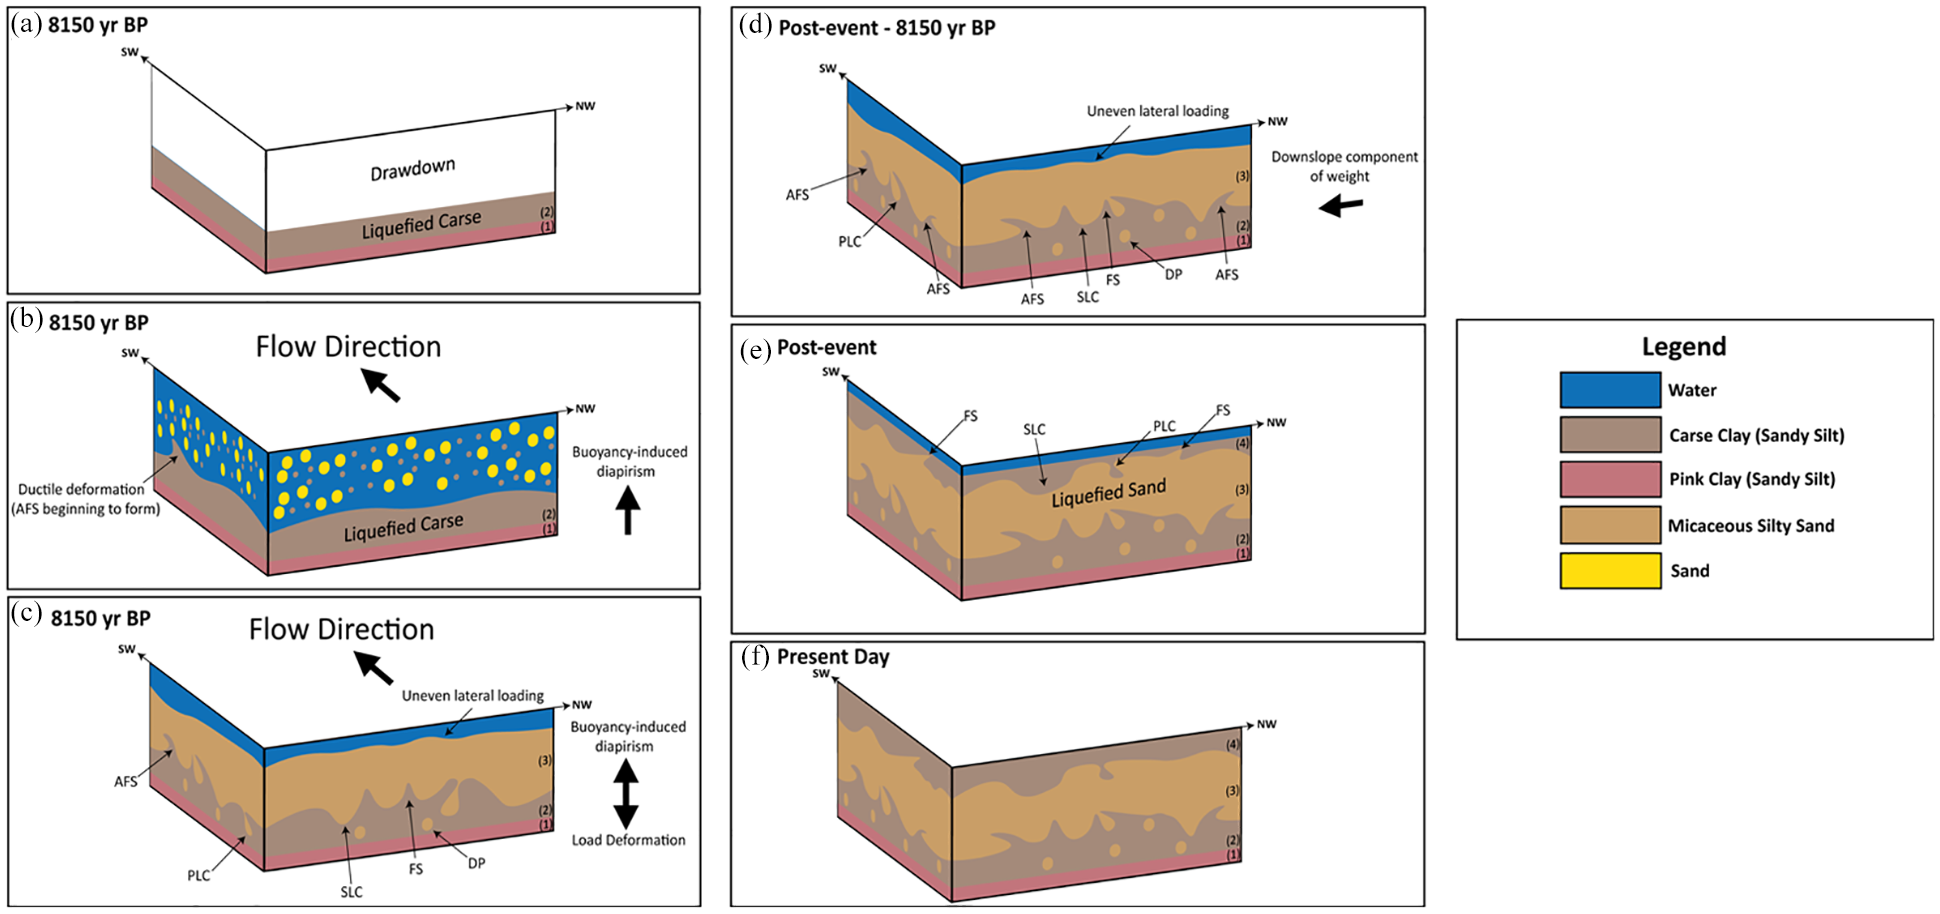
Conceptual model for the formation of soft-sediment deformation structures (SSDS) at the Montrose Basin Flames site. Sedimentary unit numbers in brackets, for example, (2) represents Unit 2. (a) Initial tsunami drawdown promotes liquefaction of the underlying Carse Clay. (b) Inundation by a sediment-laden wave results in erosion of the estuarine Carse. Density contrasts between the flow and the underlying Carse promote buoyancy-driven diapirism and ductile deformation. (c) Deposition of micaceous silty sand initiates load deformation, forming synforms such as simple load casts (SLC), pendulous load casts (PLC) and detached pseudonodules (DP); and antiforms such as asymmetric flame structures (AFS) and flame structures (FS). Buoyancy-induced diapirism continues during deposition and uneven loading contributes to the development of larger synforms. Ongoing shear flow during deposition produces AFS aligned SW (parallel to flow) and FS on the perpendicular outcrop face. (d) Post-event deformation caused by continued loading, uneven loading, and the downslope component of weight produces additional PLC, DP and non-SW-oriented AFS. (e) A return to low-energy estuarine conditions leads to deposition of overlying Carse Clay. Subsequent Holocene seismic activity, associated with glacio-isostatic uplift, triggers liquefaction of the tsunami sand, forming further synforms and antiforms at the upper sand-mud interface. (f) Present day outcrop exposure. Glacio-isostatic uplift has raised the deposit above RSL along the basin margin.
The high τ0 induced by tsunami waves may have promoted liquefaction in the substrate through an increase in the pore water pressure within the sediment layer, especially where this basal stress is greater than the yield strength of the muddy sediment (Yoshii et al., 2018; Young et al., 2009). Furthermore, as drawdown occurs prior to the tsunami, the area in the immediate offshore, such as the submerged inter-tidal zone of MBF at the time of the tsunami, would have been more vulnerable to momentary liquefaction. This occurs because the rapid lowering of the water level reduces the confining pressure exerted by the overlying water column, which normally holds particles together, while the pore water pressure within the bed remains initially unchanged. This imbalance increases the likelihood of liquefaction during drawdown (Yeh and Li, 2008; Young et al., 2009). Drawdown has previously been found to occur during the Storegga event on the north-east coast of Scotland (Harbitz, 1992; Hill et al., 2023) and is therefore likely to have occurred around the Montrose Basin and promoted liquefaction.
The cohesion of Unit 2 is influenced not only by its clay subpopulation but also by van der Waals forces, which act on particles up to approximately 10 µm (clay-fine silt) and form 15–20% of the sediment composition (Figures 10–12; McCave et al., 1995). The cohesivity of Unit 2 could have resulted in the formation of AFS in the direction of shear at the onset of flow (Anketell et al., 1970). Thus, ductile deformation of the substrate, driven by the high τ0 of the flow and buoyancy-induced diapirism, may have occurred prior to load deformation (Figure 15b; Matsumoto et al., 2008). Buoyancy-induced diapirism would have occurred at this point due to the density contrast between the substrate and the above sediment-laden flow (Peakall et al., 2024).
Results from the annular flume test indicate that AFS were created parallel, and in the direction, to flow and formed due to ductile deformation of the clay during the high basal shear flow (i.e. at high τ0) while the majority of the overlying sand remained in suspension. At this stage in the experiment, load deformation from the depositing sand layer had not yet begun and sedimentation occurred only when the flow had ceased. These results suggest that AFS began to form through ductile deformation during inundation (Figure 15b), where in the experiment the clay unit was exposed and sheared before sand deposition triggered load deformation.
Deformation also occurred through two simultaneous mechanisms during deposition of the micaceous silty sand. Firstly, load deformation due to vertical density contrasts (Owen, 2003) caused the coarser sands of Unit 3 to sink into and deform the interfacial region of the lower estuarine muds, producing synforms (SLC, PLC and DP) and antiforms (FS; Figure 15c). This was similarly found in the annular flume experiment, forming SLC and PLC (Figure 14). Additionally, buoyancy-induced diapirism may have contributed to formation of antiforms (Figure 15b) as the less dense mud in Unit 2 was displaced upward by the deposition of the overlying denser sediment in Unit 3 (Peakall et al., 2024), as suggested by the greater abundance of sand subpopulations in this Unit, which indicates a denser sediment load than in Unit 2 (Figures 10 and 11). It is suggested that deposition was rapid as capacity-driven sedimentation is evident in all of the box-core samples. This may also suggest the deformation of the underlying substrate was rapid, occurring during the ongoing flow, and would therefore make the SSDS syn-sedimentary. Uneven lateral loading may have also played a role, as variations in accommodation space allowed for the deposition of thicker sand layers, forming larger synforms (Figure 15c).
Secondly, the deposition of coarser sediment during continued wave-induced shear flow further deformed the finer, muddy substrate. The high shear velocity of the flow displaced and projected finer sediment from Unit 2 upward into the lower boundary of the coarser sediment in Unit 3, forming syn-sedimentary antiforms such as AFS (Figure 15c). The AFS observed tilted landward (SW) when viewed parallel to the presumed palaeoflow direction (NE-SW) suggest formation by the τ0 of the inundating waves (Figures 6 and 15c). However, one AFS dips seaward (NE), but is unlikely to have formed during backwash as no proxy data (PSA, OMC, geochemistry) indicate backwash deposition at MBF. Moreover, the FS viewed on the perpendicular face may be interpreted the same as AFS observed on the parallel face, appearing as differing structures due to the angle of the outcrop (Figure 15c). Additionally, AFS observed perpendicular to flow are interpreted as post-depositional structures (Figure 15d).
Post-depositional alterations and limitations
SSDS at the lower boundary of the silty sand which deform Unit 2 may have also formed through density and uneven lateral loading shortly after deposition (Figure 15d; Owen, 2003). However, distinguishing syn-sedimentary from post-depositional features remains challenging. While AFS orientated parallel to palaeoflow infer the direction of the flow, those that are perpendicular may reflect gravity-driven deformation from the downslope component of weight and are therefore post-depositional (Figure 15d; Allen, 2003; Moretti et al., 2001). This raises uncertainty over the timing and mechanism of the formation of these features. A SE-dipping slope during and after the tsunami event may have contributed to the orientation of the SE-facing AFS but localised uneven loading could also be responsible (Figure 15d). However, evidence of a slope dipping in this direction is lacking but may have been present prior to uplift when the site was submerged.
Similarly, the NW-oriented AFS does not align with other perpendicular structures, introducing further ambiguity. This may instead be attributed to greater uneven lateral loading rather than gravitational downslope movement, though this cannot be confirmed without 3D structural data (Figure 15d). The presence of an NE-oriented AFS on the parallel face also complicates interpretations, contrasting with those which are thought to represent syn-sedimentary deformation and indicate palaeoflow towards the SW. While it might suggest a backwash origin, geochemical and OMC argue against this, reinforcing caution when inferring flow direction solely from structure orientation. This AFS may also represent uneven loading rather than backwash (Figure 15d).
Further, it is likely other SSDS are post-depositional. For example, over time the DPs of coarser sediment developed within Unit 2 as pendulous load casts continued to sink (Owen, 2003), with their necks thinning and eventually detaching, isolating the pseudonodules (Figure 15c and d). Continued sinking of the sand deposit post-flow probably also promoted the formation of other structures, such as SLC and possibly FS. Importantly, it is uncertain which structures are post-depositional as the timing of deformation is unclear, however, this will depend on the amount of time the underlying Carse remains liquified.
The Carse Clay of Unit 4 formed after the tsunami event when normal estuarine conditions resumed, similar to the formation of Unit 2. (Figure 15e). At its base, Unit 4 contains antiform projections of coarser sediment from Unit 3, forming FS. Load deformation, triggered by the deposition of Unit 4 while the stratigraphy remained saturated in an estuarine environment, caused downward movement within the unit, as Unit 3 was unable to support the overlying load. This process deformed the less cohesive Unit 3, resulting in upward-projecting FS. Additionally, this loading formed SLC and PLC within the upper section of Unit 3 (Figure 15e).
The formation of these upper boundary sedimentary structures suggests that liquefaction of the stratigraphy was required to allow deformation to occur. Liquefaction may have been triggered by post-glacial seismic activity. In the Holocene, seismicity is believed to have been most active during the Early Holocene, in comparison to the Mid-Late-Holocene, due to the re-activation of faults and post-glacial uplift stresses following the Loch Lomond Stadial (Firth and Stewart, 2000). SSDS attributed to seismically induced liquefaction, including ball-and-pillow structures, load casts, and FS, have been identified elsewhere in Scotland, such as within Late Devensian glacial outwash deposits at Arrat’s Mill, approximately 6 km west of the Montrose Basin, and Early Holocene sediments in Glen Roy (Lochaber, western Scotland; Davenport and Ringrose, 1987). Therefore, it is probable that seismic-induced liquefaction did occur at the MBF site, particularly as it is evident that the Montrose area has been uplifted and experienced uplift stresses. Additionally, the possibility of seismic-induced liquefaction which formed the upper layer of SSDS at MBF could have resulted in the redistribution of particles within the liquefied sand (Figure 15e), resulting in the erasure of the original grading. This is could be applicable to the ungraded sediment in MBF-1 and -3.
Despite the post-depositional alterations of Unit 3, it is evident that key sedimentary characteristics, such as grading, have been preserved at MBF. This preservation is likely due to rapid burial by estuarine sediments under conditions of high sedimentation rates in the low-energy estuarine environment (Peters and Jaffe, 2010; Spiske et al., 2013; Szczuciński, 2012, 2020). High sedimentation rates are attributed to the deposition of muddy sediment associated with rapid RSL rise, particularly during the formation of the MPS and BDS. Continued uplift, as well as regression of RSL to the present day level, resulted in the outcrop being raised above RSL and exposed on the basin margin which would have also removed the deposit from the wave base and reduced the risk of erosion from tidal or storm waves (Figure 15f).
Future work
Despite the annual flume experiment providing geometrical analogous formation of SSDS, further experimental work is needed to better understand the mechanisms which promote their formation from a high-energy tsunami inundation. This includes using sediments that are more closely related to those found in natural environments, particularly in terms of sediment composition, for example a composition more closely related to the Carse Clay (Figures 10–12) rather than the kaolin clay used in the experiment. This also applies to the composition of the sand used in the experiment (Table 2) compared to that found at the MBF site (Figures 10–12). This would better simulate the conditions necessary for deformation, such as density loading and the cohesive nature of underlying Carse Clay. Additionally, conducting experiments on uneven or sloping bed surfaces would offer valuable insights into how uneven loading contributes to structure formation and whether the downslope component of weight could generate post-depositional deformation.
It is possible that MBF is not the only site displaying SSDS associated with the Storegga tsunami. Long et al. (2016) describe clast nodules, possibly DP, within organic silty clay at the base of a Storegga tsunami deposit at Lochan Harvurn, Northern Scotland. Additionally, FS, SLC and PLC may also be present at this location. A tsunami deposit in Largo Bay, South Fife (Scotland), dated to 8300–7931 cal. yr BP, aligns with the timing of the Storegga event (Boyd et al., 2022). This deposit contains sand laminations, and later investigations have identified DP of coarser sand (fine sand) in its lower sections. The identification of SSDS, including AFS, in other deposits should be recognised and further tested as indicators of the flow and depositional regime of tsunami events.
Conclusions
Our objectives were to combine detailed field and laboratory evidence with experimental modelling to investigate the flow and depositional regime of tsunami waves in a shallow marine environment.
The Lithostratigraphic analysis, subsampling and particle size proxies of particle size analysis and micro-X-Ray Fluorescence, as well as low OMC from loss on ignition, reflect the low energy estuarine environment of Units 1, 2 and 4. Unit 2 is representative of the MPS, while Unit 4 is likely formed of both the MPS and BDS. The interruption of Units 2 and 4 by Unit 3, a silty sand unit with poorer sorting, sharp boundary contacts, grading styles, fragments of marine shells and SSDS support the interpretation of Unit 3 as a high magnitude event deposit derived from the 8.15 ka yr BP Storegga Submarine Landslide Tsunami.
The MBF site reveals significant spatial variability in tsunami sedimentation over a short distance, with each box-core preserving distinct flow and depositional characteristics. Inverse grading in MBF-2 indicates sediment transport via a traction carpet, formed under high shear stress conditions, with suspended sediment and is deposited by rapid, capacity-driven conditions. In contrast, MBF-1 and -3 are ungraded but also indicate capacity-driven conditions without traction carpet development. However, this ungraded sediment may have arose from sediment mixing during liquefaction post-tsunami event, highlighting the ambiguity in interpreting the flow and depositional regime. These findings highlight the complex and variable nature of tsunami sedimentation, with differences likely reflecting localised flow dynamics rather than distinct wave phases. Compared to nearby sites like Maryton, MBF shows a more fragmented preservation of wave phases, possibly due to post-depositional alterations. Nonetheless, all box-cores are interpreted to represent a tsunami inundation rather than backwash.
SSDS offer critical insights into the flow and depositional regime of the Storegga tsunami in a shallow estuarine setting. Their presence only at MBF highlights the spatial complexity of tsunami deposition across the Montrose Basin. Among these, AFS are especially notable, as they are rarely reported in tsunami deposits and are absent from most Storegga studies. AFS aligned with palaeoflow suggest that high shear stress during inundation triggered ductile deformation, followed by load deformation during deposition on a cohesive substrate, which is supported by the syn-sedimentary reproduction of these structures.
Other SSDS, including PLC and DPs, reflect deformation from rapid loading of a liquefied muddy substrate by denser tsunami sands. While most structures likely formed during flow and deposition, some may result from continued post-depositional deformation. This includes continued sinking of the denser tsunami sand into the liquefied Carse, uneven loading and the downslope component of weight – such as the AFS viewed perpendicular to palaeoflow. FS observed perpendicular to flow may represent the same structures as parallel AFS, viewed at different angles. Upper-boundary SSDS may reflect seismic-induced liquefaction from glacio-isostatic uplift post-tsunami event. Despite possible post-depositional alterations, rapid burial in the low energy estuarine environment has preserved these SSDS and sediment characteristics such as inverse grading. These findings provide a robust sedimentological framework for interpreting palaeotsunami deposits and highlight the potential for future experimental and field-based research to further resolve tsunami-induced deformation structures.
Supplemental Material
sj-docx-1-hol-10.1177_09596836251350227 – Supplemental material for Sedimentary structures reflecting the flow and depositional regime of the 8.15 ka yr BP Storegga submarine landslide tsunami at the Montrose Basin, North-East Scotland
Supplemental material, sj-docx-1-hol-10.1177_09596836251350227 for Sedimentary structures reflecting the flow and depositional regime of the 8.15 ka yr BP Storegga submarine landslide tsunami at the Montrose Basin, North-East Scotland by Aidan Wrethman, Sue Dawson, Alan Cuthbertson and Jonathan Wilkin in The Holocene
Supplemental Material
sj-docx-2-hol-10.1177_09596836251350227 – Supplemental material for Sedimentary structures reflecting the flow and depositional regime of the 8.15 ka yr BP Storegga submarine landslide tsunami at the Montrose Basin, North-East Scotland
Supplemental material, sj-docx-2-hol-10.1177_09596836251350227 for Sedimentary structures reflecting the flow and depositional regime of the 8.15 ka yr BP Storegga submarine landslide tsunami at the Montrose Basin, North-East Scotland by Aidan Wrethman, Sue Dawson, Alan Cuthbertson and Jonathan Wilkin in The Holocene
Supplemental Material
sj-xlsx-3-hol-10.1177_09596836251350227 – Supplemental material for Sedimentary structures reflecting the flow and depositional regime of the 8.15 ka yr BP Storegga submarine landslide tsunami at the Montrose Basin, North-East Scotland
Supplemental material, sj-xlsx-3-hol-10.1177_09596836251350227 for Sedimentary structures reflecting the flow and depositional regime of the 8.15 ka yr BP Storegga submarine landslide tsunami at the Montrose Basin, North-East Scotland by Aidan Wrethman, Sue Dawson, Alan Cuthbertson and Jonathan Wilkin in The Holocene
Footnotes
Acknowledgements
This work has been completed by AW as part of his PhD project on the Centre for Doctoral Training programme (GeoNetZero). The authors would like to thank the British Ocean Sediment Core Research Facility at the National Oceanography Centre (Southampton, UK) for conducting micro-X-Ray fluorescence. Thanks to Ryan Dick for initial identification of the outcrop section during his undergraduate dissertation project under the supervision of Sue Dawson. Additional thanks to NatureScot and the Scottish Wildlife Trust (Montrose Basin visitor centre) for granting access permission to the study area.
Author contributions
Funding
The author(s) disclosed receipt of the following financial support for the research, authorship, and/or publication of this article: This work is sponsored by University of Dundee and NeoEnergy Upstream whose support is gratefully acknowledged.
Supplemental material
Supplemental material for this article is available online.
References
Supplementary Material
Please find the following supplemental material available below.
For Open Access articles published under a Creative Commons License, all supplemental material carries the same license as the article it is associated with.
For non-Open Access articles published, all supplemental material carries a non-exclusive license, and permission requests for re-use of supplemental material or any part of supplemental material shall be sent directly to the copyright owner as specified in the copyright notice associated with the article.