
Abstract
Monumental rectangular stone structures called mustatils are an important emerging feature of the Holocene archaeological record of northwestern Arabia. To date, few have been excavated, with available radiocarbon dates suggesting an age range of ca. 5400–4200 BC. Here we present a rigorous spatial analysis to identify the patterning and landscape context of 169 mustatils in the southern and western margins of the Nefud Desert. This included: (1) a systematic survey of satellite imagery to identify mustatils; (2) viewshed analysis to examine location and landscape visibility; (3) a point process model to understand how diverse environmental and landscape variables affect mustatil locations; (4) mark correlation function to assess spatial patterning of mustatils based on their size. Results indicate that mustatil locations are determined most by proximity to water (likely locations of enhanced surface water occurrence under the enhanced humidity of the Mid-Holocene), on east facing slopes, close to rocky areas, at elevations between 880 and 950 masl, and on or near topographic ridges (positive topographic position index). Viewshed analysis showed that mustatils are preferentially located in areas that have good views, but not the best that are available, indicating complex landscape positioning that balances a range of topographic and behavioural factors. Using a rank permutation method with size (length) of mustatils as a proxy for labour mobilization we show that mustatils within clusters are not arranged hierarchically based on size, and were likely built by non-stratified groups of people. Our analyses show that people were choosing multiple factors when deciding where to build mustatils, and that the distribution of mustatils may relate to different groups of people resulting in the construction of complex ritual landscapes. As one of the earliest examples of large-scale monumental stone structure construction in global prehistory, understanding mustatils can enlighten us on human-environment interaction during the Neolithic.
Introduction
Northern Arabia has seen an increase in archaeological research in recent years, which has provided important new insights into human prehistory in the region. Holocene archaeological sites are abundant in Arabia, and one of the most striking forms are monumental stone structures across the peninsula (discussed further in 1.2) These diverse stone structures were constructed from at least the middle Holocene through to the recent past (Kennedy, 2011). One key form, mustatils, are large rectangular structures interpreted as having a ritual function, are unique to northwestern Saudi Arabia, however beyond that little is known about their spatial patterning and how this relates to landscape structure and human use of the structures.
Here we use point process models (PPM), to evaluate the factors that may have influenced the locations of mustatil construction, as a formal way to explore their landscape position and then consider what this tells us about the human societies that made them. Specifically, we explore the location of mustatils in relation to underlying geology, proximity to water sources, differential visibility across the landscape, spatial patterning and evaluate the hypothesis that mustatils were territorial markers in the landscape (Thomas et al., 2021b). Territoriality is formally explored here using a rank permutation method (Carrero-Pazos et al., 2019) to investigate if intra-cluster site hierarchies are present. Mustatils were built by groups of people, and the size (length) of mustatils can inform us on the amount of labour mobilization that was required to build them (Thomas et al., 2021b). If size is a possible marker of hierarchical social relations and community structure (Riris, 2020), this analysis can be used to identify how territoriality was expressed.
Mustatils have received limited attention, and though they are obvious landscape features, they have only recently been formally documented. To date, no site location modelling or spatial pattern analysis has been conducted on mustatils. Initial research has, however, highlighted some broad patterns. At the edges of the Nefud Desert, mustatils are generally evenly distributed but cluster in groups, they are concentrated between 900 and 920 masl, but this appears to be a reflection of the underlying topography (Groucutt et al., 2020). Visibility was apparently important, they are often oriented according to local topography (Thomas et al., 2021b), and proximity to water has been suggested as a key factor (Kennedy et al., 2023).
The geology of northwestern Arabia is characterized by three main rock types, Late Proterozoic sandstones, Caenozoic basalts and volcanic-sedimentary sequences associated with the Arabian Shield (Ekren et al., 1987; Fairer, 1986; Janjou et al., 1994, 1998; Powers et al., 1966; Quick and Doebrich, 1987; Vaslet et al., 1994). The Nefud is the northernmost major sand sea in Arabia, situated north of the Arabian Shield and is made up of densely packed dunes ranging from 60 to 120 m high (Breeze et al., 2017, p. 201; Schulz and Whitney, 1987). As a result, the building materials required for the construction of large-scale monuments are unevenly distributed across northwestern Arabia.
Northwestern Arabia is an arid region today, which receives average winter rainfall of 50–100 mm. Playas are often found at low points in interdune corridors and on the open plains, and episodically hold water after extreme rainfall events (Petraglia et al., 2020). The aridity of the region leads to sparse flora and fauna showing arid adaptations (Edgell, 2006).
The Holocene humid period
The Holocene Humid Period (HHP) was a period of increased precipitation in Arabia, that broadly dates to between 8000 and 4000 BC. The onset of these wetter conditions varied throughout Arabia (Petraglia et al., 2020; Preston and Parker, 2013), and led to the formation of lakes and other wetlands in various areas. In northern Arabia, the wet phase was much shorter than in southern Arabia, lasting from 6800 to 5900 BC, and with some data suggesting a more abrupt termination (Neugebauer et al., 2022). During the Holocene, permanent water may have been available at oases in northern Arabia, two key examples that have been well studied are Tayma and Jubbah (Hausleiter et al., 2019; Neugebauer et al., 2022; Parton et al., 2018). Palaeolakes fed by shallow, recharged groundwater levels would have also provided people with water (Petraglia et al., 2020). Pollen records recovered at Tayma indicate a spread of grassland, which peaked between ca. 6600 and 6000 BC (Dinies et al., 2015), after which there was a return to arid-adapted vegetation. From 6000 BC onwards lake levels declined. Hydrological models based on records from Tayma suggest that rainfall may have been as 150 ± 25 mm/annum, 2–3 times more than current rainfall of 40–90 mm/annum (Wellbrock et al., 2011). These climatic changes varied both temporally and spatially. At Jebel Oraf near Jubbah, two lake high stands occurred at ca. 6500 BC and 5300 BC (Guagnin et al., 2020). Ephemeral pools/marshes and shallow lakes formed in basin playa and interdunal depressions in and around the Nefud, radiocarbon dates obtained during investigations in the 1980’s attributed these to between 7500 and 3800 BC (Breeze et al., 2017; Schulz and Whitney, 1987). The meaning of different timings for humid conditions at Tayma and Jubbah remains unclear but may relate to groundwater dynamics (aquifer recharge) more than immediate rainfall. Alternatively, there may be genuine sub-regional differences in humidity changes across and bracketing the HHP.
While humans can be resilient in the face of climatic changes, environmental changes would have provided both opportunities and constraints for early human populations. This is especially true in arid climates such as northwestern Arabia, where water was (and still is) a major factor in human survival, especially before the development of complex water management in the fifth millennium BC (Gebel, 2016; Zielhofer et al., 2018). During the HHP important cultural developments occurred with the expansion of Neolithic populations and the transition from foraging to herding. Pollen records from Tayma suggest that between 6700 and 6000 BC an increase in moisture supported a more diverse environment, and an expansion in grasslands. In addition, tree taxa that don’t survive in the current arid conditions could have been used by Neolithic populations in the area (Dinies et al., 2015).
Unlike classic concepts of Neolithisation, the environment in Arabia was too arid to allow for agriculture, with no evidence of domesticated crops until the Bronze Age when oasis agriculture developed (Magee, 2014). The earliest evidence for domesticated cattle dates to the early sixth millennium BC in Yemen (Martin et al., 2009). By the late sixth millennium BC evidence for domesticated cattle, goat and sheep is widespread across the Arabian Peninsula (Berger et al., 2020; Carter and Crawford, 2003; Guagnin et al., 2017; Uerpmann and Uerpmann, 2018). It is not clear whether the introduction of domesticates was the result of an expansion of Levantine herder communities, the adoption of herding by local communities, or some combination of both (Crassard and Drechsler, 2013; Drechsler, 2007; Groucutt and Petraglia, 2012; Magee, 2014; Martin, 1999). The archaeological record of northwest Arabia shows evidence of repeated contact with the Levant (Guagnin et al., 2020, 2021). Faunal evidence show that domesticates were present in north western Saudi Arabia at the end of the sixth millennium BC (Guagnin et al., 2017; Guagnin et al., 2021; Kennedy et al., 2023; Thomas et al., 2021b). Rock art also depicts cattle herding in northern Saudi Arabia, the rock art of Shuwaymis (on the southern margins of the Nefud Desert) appears to show a stratigraphic sequence suggestive of local hunters adopting a herding economy while continuing to hunt wild animal species (Guagnin et al., 2015). Mitochondrial DNA (mtDNA) and ancient DNA analyses suggest that there has been repeated admixture between Arabia and the Near East since the Late Pleistocene, with several pulses of populations into Arabia (Fernandes et al., 2015; Martiniano et al., 2024). Lithic evidence also hints at repeated connections between the Levant and northern Arabia (Crassard et al., 2013; Guagnin et al., 2020, 2021; Hilbert et al., 2014).
People were likely highly mobile to ensure survival in northwestern Arabia where droughts occurred even during the HHP (Guagnin et al., 2016). Towards the end of the HHP when the climate became more arid, territorial behaviours seemingly emerged, potentially as a result of increased mobility and decreased carrying capacity. Due to the earlier and more abrupt end of the HHP in northern Arabia, it has been hypothesized that these territorial behaviours would have emerged earlier than in southern Arabia (Groucutt et al., 2020, p. 20). Cattle sacrifice has been suggested as an archaeological proxy for territoriality among mobile pastoralists (di Lernia, 2006; McCorriston et al., 2012). Shi’b Kheshiya in Yemen, is an extraordinary example of this, where 42 cattle skulls were buried simultaneously in a circular formation, next to a stone platform with evidence of hearths, strongly suggesting a sacrificial feast (McCorriston et al., 2012).
Mustatils and other stone structures
Thousands of stone structures are distributed across Arabia, ranging from small cairns to tower and pendant tombs (Kennedy et al., 2021), stone platforms (Munoz et al., 2020), to monumental structures such as mustatils and desert kites (Kennedy, 2012). Cairns are typically small funerary structures that are very common across the landscape and date from the Neolithic to at least the first millennium AD. Larger structures include desert kites and mustatils, these have been argued to be the oldest structures on the landscape as they often underlie other structure types (Fradley et al., 2022; Groucutt and Carleton, 2021; Kennedy, 2017). Desert kites are generally understood to be mass-kill hunting traps used primarily to hunt and trap herds of gazelle (Crassard et al., 2022; Groucutt and Carleton, 2021; Zeder et al., 2013). While their chronology is not well understood, a desert kite in Jordan has been dated to ~10 ka (Al Khasawneh et al., 2019). Mustatils, the focus here, are however quite different in that they likely represent a tradition of monumental architecture for ritual purposes, though they are still poorly understood. Despite being documented in passing in the 1970’s (Parr et al., 1978) they have only been intensively studied in the last 10 years (Fradley et al., 2022; Groucutt et al., 2020; Kennedy, 2017; Kennedy et al., 2023; Thomas et al., 2021a, 2021b). The first systematic study was conducted in 2017 (Kennedy, 2017) and utilized satellite images. They are most common in the Khaybar and AlUla regions and are limited to northwestern Saudi Arabia. Mustatils have been preliminarily dated to around 5000 BC (Abu-Azizeh et al., 2022; Groucutt et al., 2020; Thomas et al., 2021b), and were constructed within a relatively short time frame coinciding with the later part of the broader HHP. This does however postdate the shorter wet period in northwestern Saudi Arabia proposed by Neugebauer et al. (2022).
Mustatils are large rectangular stone structures with two platforms on each short end, which are themselves connected by long, low walls, although some examples have further central dividing walls. They generally range in length from ca. 20 to 600 m (Groucutt et al., 2020; Kennedy et al., 2023). Mustatils were seemingly built using local raw materials, and to an extent preservation of the structures and associated architectural features are dependent on whether they were built using sandstone slabs or basalt as the rocks tend to break differently (Thomas et al., 2021b). More than 1600 mustatils have been identified by the Aerial Archaeology of the Kingdom of Saudi Arabia AlUla (AAKSAU) project through a mixture of remote sensing and aerial photography (Kennedy et al., 2023; Thomas et al., 2021b). However, only four have been excavated and published to date (Abu-Azizeh et al., 2022; Kennedy et al., 2023; Thomas et al., 2021b).
The two platforms at the end of a mustatil can be distinguished as a ‘head’ and a ‘base’, each with distinct architectural characteristics (Thomas et al., 2021b). Although both platforms are visible in satellite imagery, the resolution is often not good enough to distinguish them from one another. The base is characterized by a central corridor, thought to be built as a way to access the courtyard, although in some cases this gap is only 25 cm wide. The head often contains a central chamber that is not visible from the exterior of the structure. Excavations of the central chamber within the head of two mustatils revealed in situ faunal remains of horns and cranial elements of a variety of domestic and wild taxa, including cattle, sheep/goat and gazelle. Cattle crania, however, comprised the bulk of both assemblages, with the remains interpreted as ‘offerings’ due to their position around an orthostat (upright stone) in the central chamber (Kennedy et al., 2023; Thomas et al., 2021b). The courtyards of mustatils seem to be largely devoid of artefacts, however, a rock painted with geometric patterns was found in one mustatil, forming part of the top course of stones of the platform (Groucutt et al., 2020). This would have been visible to people inside the courtyard of the mustatil.
The presence of domestic cattle remains in all mustatils excavated to date, and aurochs in one mustatil (Abu-Azizeh et al., 2022; Groucutt et al., 2020; Kennedy et al., 2023; Thomas et al., 2021b) indicates that there was enough water on the landscape to provide for livestock. Cattle in the Sahel require water every day, however in the peak of the wet season they can go up to days between drinking (Adriansen and Nielsen, 2005). Based on experimental studies of Mayan labour investment, a group of 10 people could construct a 177 m mustatil over a two to three week period (Abrams, 1994; Erasmus, 1965; Thomas et al., 2021b). Larger mustatils (>200 m) would have taken family groups months to build, however if wider communities congregated and mobilized labour this could be completed in a shorter time frame (Thomas et al., 2021b). Gathering of wider groups could act as a mechanism for social cohesion amongst nomadic pastoralists (Magee, 2014, p. 81). The frequent building of mustatils in proximity to one another may also highlight that the act of building structures was an important aspect of their use (Groucutt et al., 2020).
To address some of the extensive gaps in our current knowledge regarding these still enigmatic structures, in this paper we aim to explore in a quantitative manner which factors may explain some of the choices Neolithic people made when choosing particular locations to construct mustatils in northwestern Arabia.
Spatial analysis
Understanding the spatial relationships between objects, sites and people has been central to archaeology from its early stages, and the adoption of GIS has helped to further understand and parameterize these relationships. Megalithic architecture has been associated with solar and lunar calendars (Hensey, 2017; MacKie, 1997), visibility to and from structures (Carrero-Pazos, 2021; Caruana and Stroud, 2020; Costanzo et al., 2021), position in relation to least cost paths on the landscape (Carrero-Pazos, 2021), proximity to important features such as access to sea and fertile agricultural plains (Grima, 2004, 2008) or where raw materials for construction are abundant and locations of existing structures (Costanzo et al., 2021). These examples highlight both the functional diversity of different forms of stone structures, but also the need for detailed spatial analyses to elucidate the landscape distribution of these forms.
Point pattern analysis is a suite of statistical methods used to address spatial relationships that might exist among real-world phenomena, by simplifying these phenomena as two-dimensional points (Bevan, 2020). Point patterns can be formally described as random, regular (dispersed) or clustered (aggregated). In particular, regular and clustered patterns are thought to be the product of interesting processes. Regular patterns are the result of an inhibition process, while clustered patterns represent attraction processes (Bevan et al., 2013). Both of these patterns could be present due to preservation bias or active choices by humans in the past.
Due to the heterogenous nature of many real-world spatial patterns, it is useful to distinguish between first-order and second-order effects. This is where the strength of point pattern analysis and modelling lies, as opposed to more standard approaches such as site location modelling (predictive modelling). First-order effects relate to the intensity (density) of points within a study area, these refer to external processes such as natural phenomena (elevation, distance to water etc.). Second-order effects relate to the interactions between points that shape the spatial patterns, these often correspond to active choices made by people in the past (Bevan et al., 2013).
Point process models can be used to consider whether environmental factors such as elevation have a significant effect on site location, as well as the influence of second order effects such as clustering or inhibition. While the results of point process modelling do not offer a definitive explanation, they do narrow down the processes that could have created a pattern.
Data and methods
Study Area
The study area spans ca. 44,100 km2 across the southern margins of the Nefud Desert (Figure 1), from the ‘15’ road near Tayma in the west to the western edge of Jebel Aja near Hail in the east, extending slightly north of Jubbah and in the south extending just past the ‘70’ road (Supplemental Figure S1). This area was chosen as it covers mixed geographical zones, which could affect how people were interacting with the landscape. This area has also been subject to relatively intensive archaeological research (Breeze et al., 2017; Fradley et al., 2022; Groucutt et al., 2020; Guagnin et al., 2021; Hausleiter et al., 2019) providing context for the mustatil phenomenon through evidence from other aspects of the archaeological record. A large part of the study area is underlain by Palaeozoic and Caenozoic rocks, specifically Siq and Saq sandstones which are exposed along the east and south of the study area. The northern half of the study area is covered by Quaternary deposits of the Nefud Desert, characterized by sand dunes in the far north and terrace deposits towards the edges of the Nefud (Janjou et al., 1998). Along the southern margin of the Nefud Desert later tertiary deposits are exposed (Hadley, 1987). Proterozoic rocks are exposed in the south east corner of the study area, which is part of the Arabian Shield (Quick and Doebrich, 1987) (wadi ash shuba). There is a small section of Harrat Ithnayn included in the south of the study area, that comprises Basalt flows ranging from the tertiary to recent (Harrat Ithnyan).
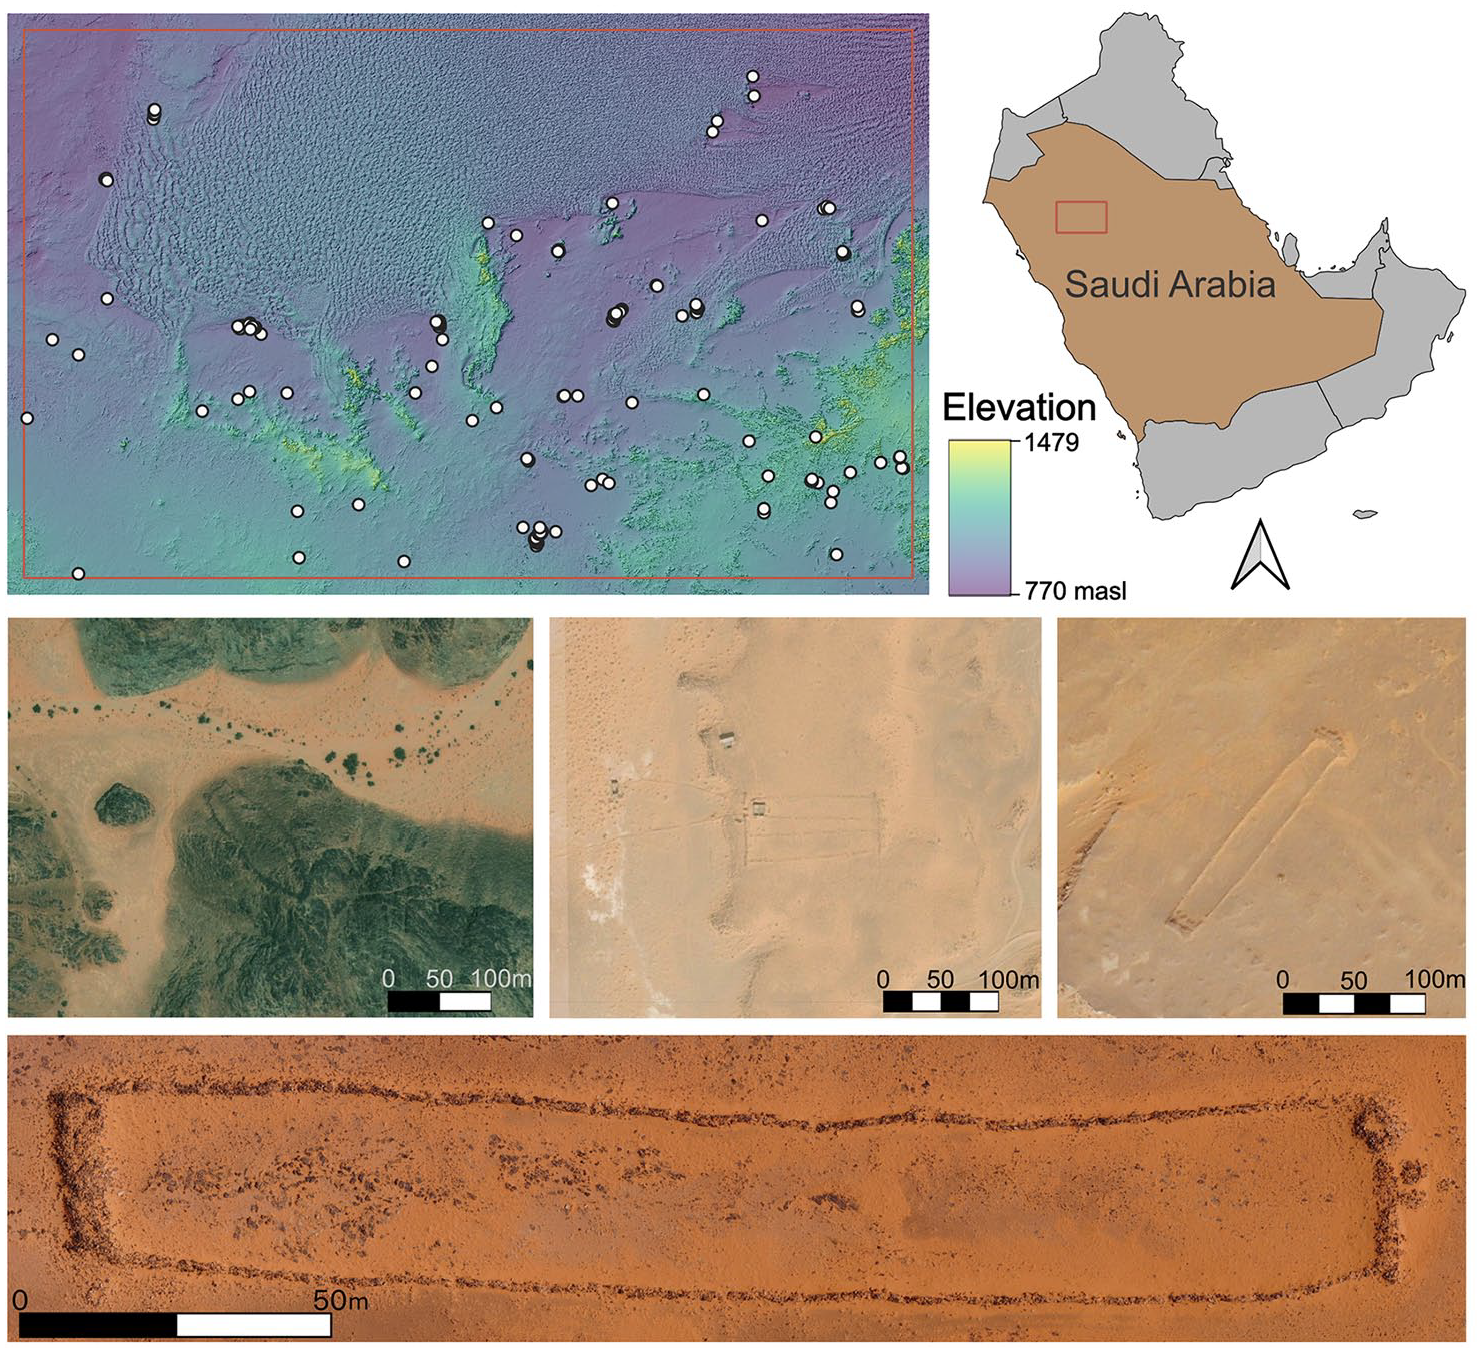
Map of the study area. Top: elevation map of the study area, showing the mustatil locations in white. Middle: Satellite imagery of mustatils within the study area. Left: A mustatil that has been built up the slope of a jebel. Middle: A mustatil with two dividing walls in the courtyard, it has been built next to what appears to be the enclosure of a desert kite with converging walls extending to the left. Right: Mustatil, with cairns built near both platforms. Bottom: Drone image of a mustatil within the study area. All satellite imagery is from Microsoft Bing Aerial.
All analyses were conducted using free and open-source software, with an emphasis on reproducibility. Data and code for the analysis are available (OSF, DOI 10.17605/OSF.IO/VXNKP). All spatial data were projected to UTM 37N (EPSG 32637) for analysis.
Data Gathering
We used the mustatil distributions published by Groucutt et al. (2020) and in addition, we conducted a systematic survey of Bing/Google imagery to verify mustatil locations and identify any that had not yet been documented in the extended geographic range of the study area (Figure 2:1.1). Locations of six mustatils were provided by Hugh Thomas (University of Sydney). In total 169 mustatils were identified within the study area through our systematic survey, it is possible that additional mustatils which are badly degraded or covered by sand may have not been recorded. Open-source satellite imagery was inspected visually using a square grid system of 0.01 of a decimal degree longitude/latitude (measuring approximately 1 km2) to guide the surveyor to ensure systematic and comprehensive survey at the highest levels of ‘zoom’, and thus spatial resolution, for these data. Both Bing Aerial and Google satellite imagery were used within QGIS, as spatial resolution of these data often varied internally between different areas and tiles, altering which was more suitable for identifying structures depending on the location. Each mustatil was recorded by creating a polygon around its perimeter (Figure 2:1.2)
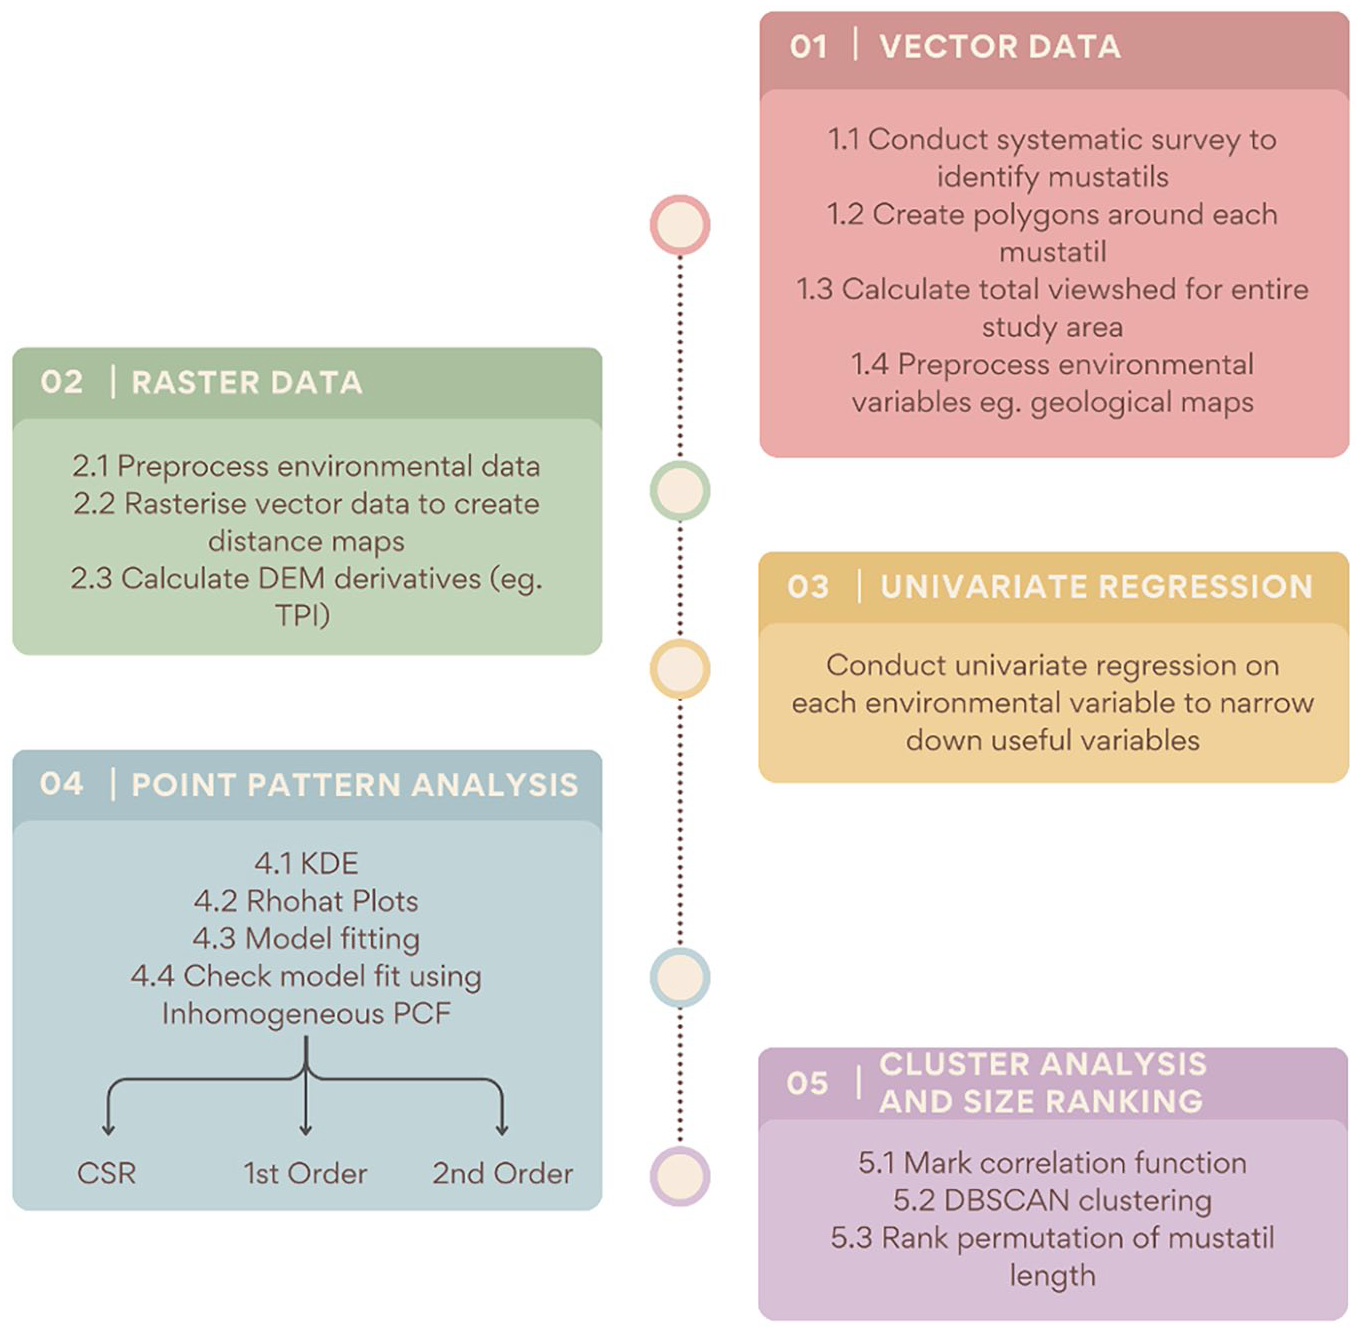
Simplified workflow for analysis, showing the main steps and sub steps for each part of the analysis.
To assess whether visibility is an important factor in mustatil location a total viewshed was created for the entire study area (Supplemental Information: Figure S2; Figure 2:1.3), using a custom Python script which utilized GRASS GIS (8.2.0).
All spatial analysis was conducted in R (R Core Team, 2022), especially using the terra, sf, spatstat and tidyverse packages (Baddeley et al., 2015; Hijmans, 2022; Pebesma, 2018; Wickham et al., 2019). Kernel Density Estimation (Supplemental Figure S3, Figure 2:4.1) and univariate analysis (Supplemental Information Table S1; Figure 2:3) were conducted to elucidate the spatial patterning and environmental variables that have an effect on mustatil location.
Exploratory data analysis (Figure 2:4.2)
We calculated Relative Density Estimation (Rhohat) plots for each of the covariates (Supplemental Table S1), allowing for the effect of a covariate on the intensity of points in a study area to be understood (Baddeley et al., 2015, p. 179). These are very useful as they show values for each covariate, where mustatils are more likely to occur than by chance (Figure 3). The small black lines at the bottom of the plots represent each mustatil, while the black trend line shows at which covariate values mustatils are more likely to be located than by chance. The grey band is a confidence interval, so areas where the black line and grey band are above the dashed red line are values where mustatils are statistically significantly more likely to occur.
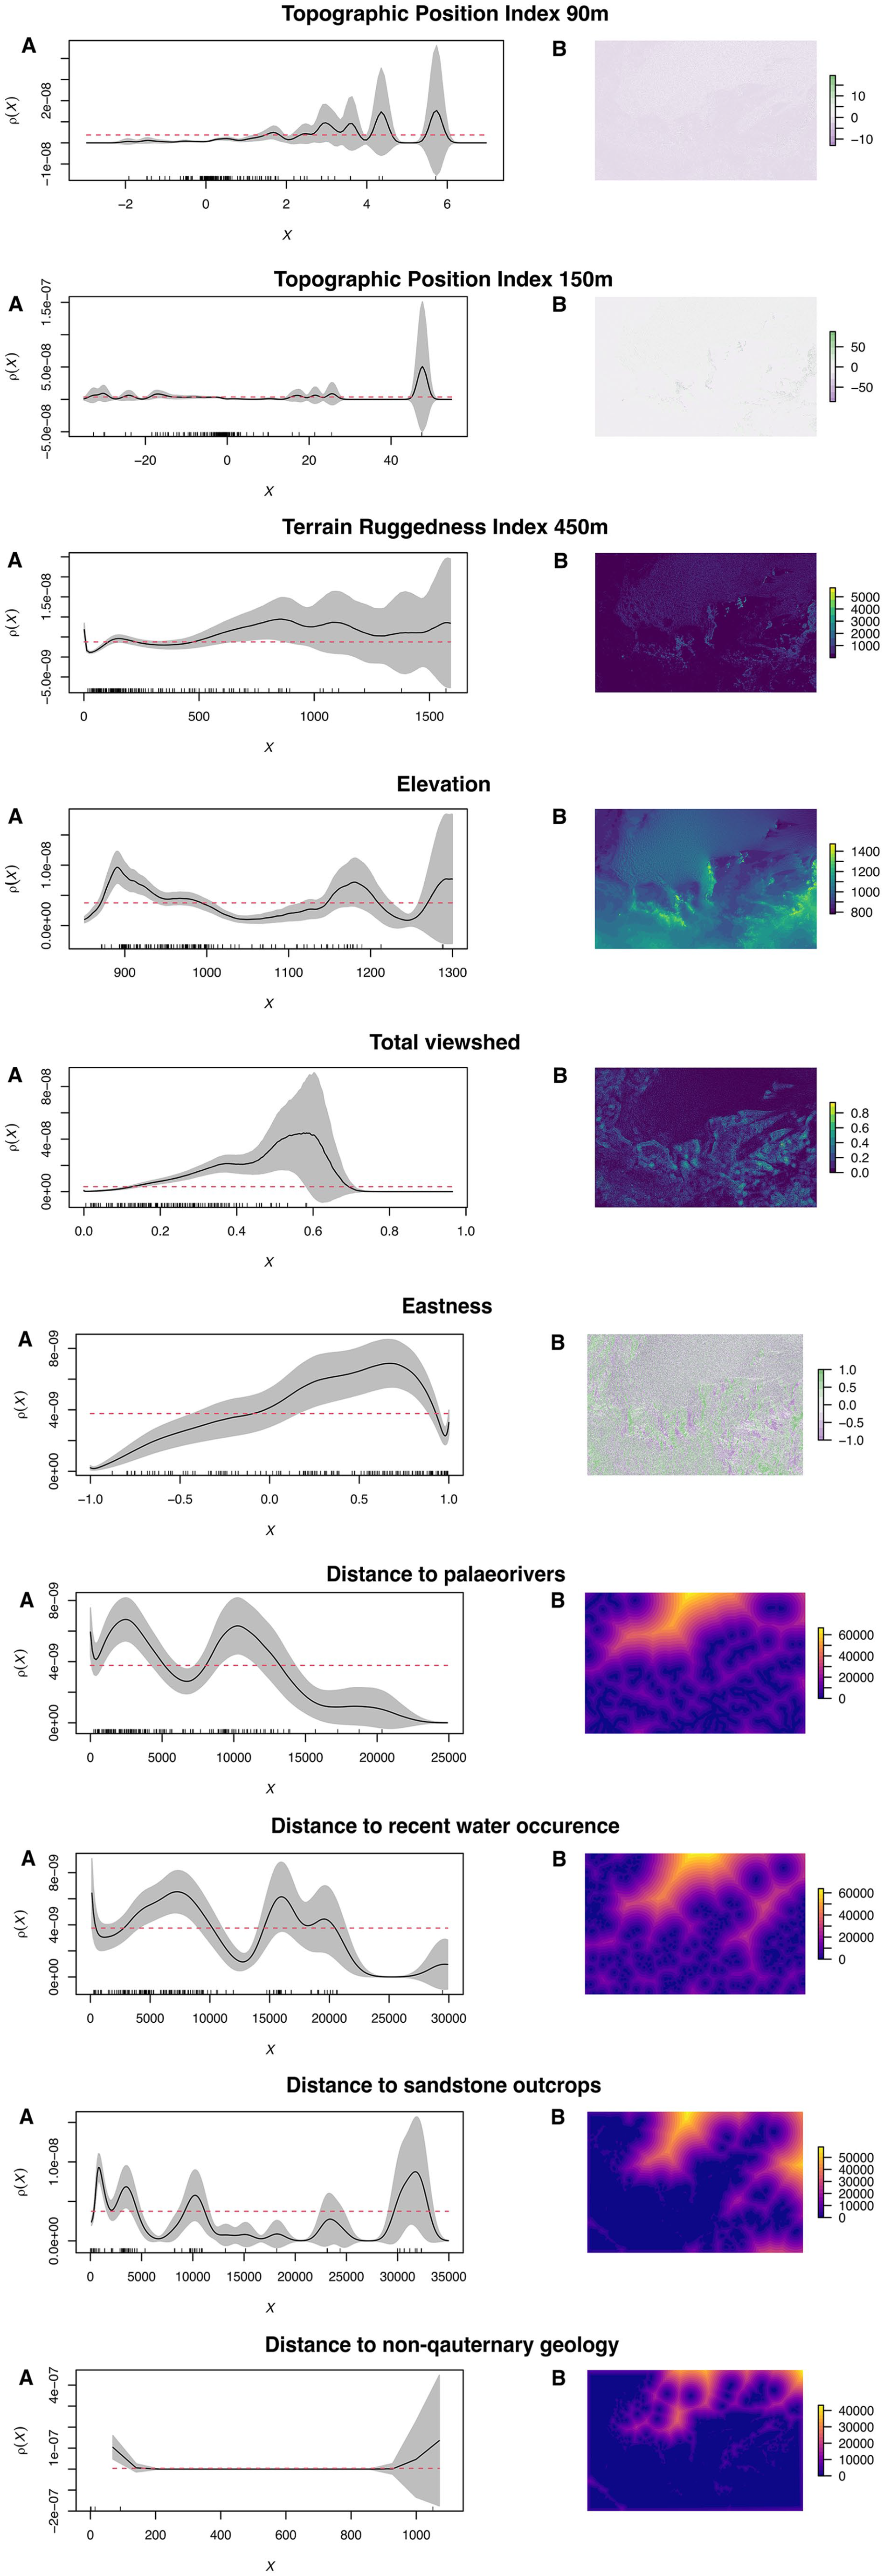
Relative distribution estimate plots showing how the intensity of mustatil locations changes depending on the value of covariate data. Each small vertical black line at the bottom of the plot represents a site, while the plotted black line is the estimated density of sites as a function of each covariate. The grey band represents a 95% confidence interval. Maps of each covariate have been plotted within the plots to show how they vary across the study area.
Model fitting (Figure 2:4.3)
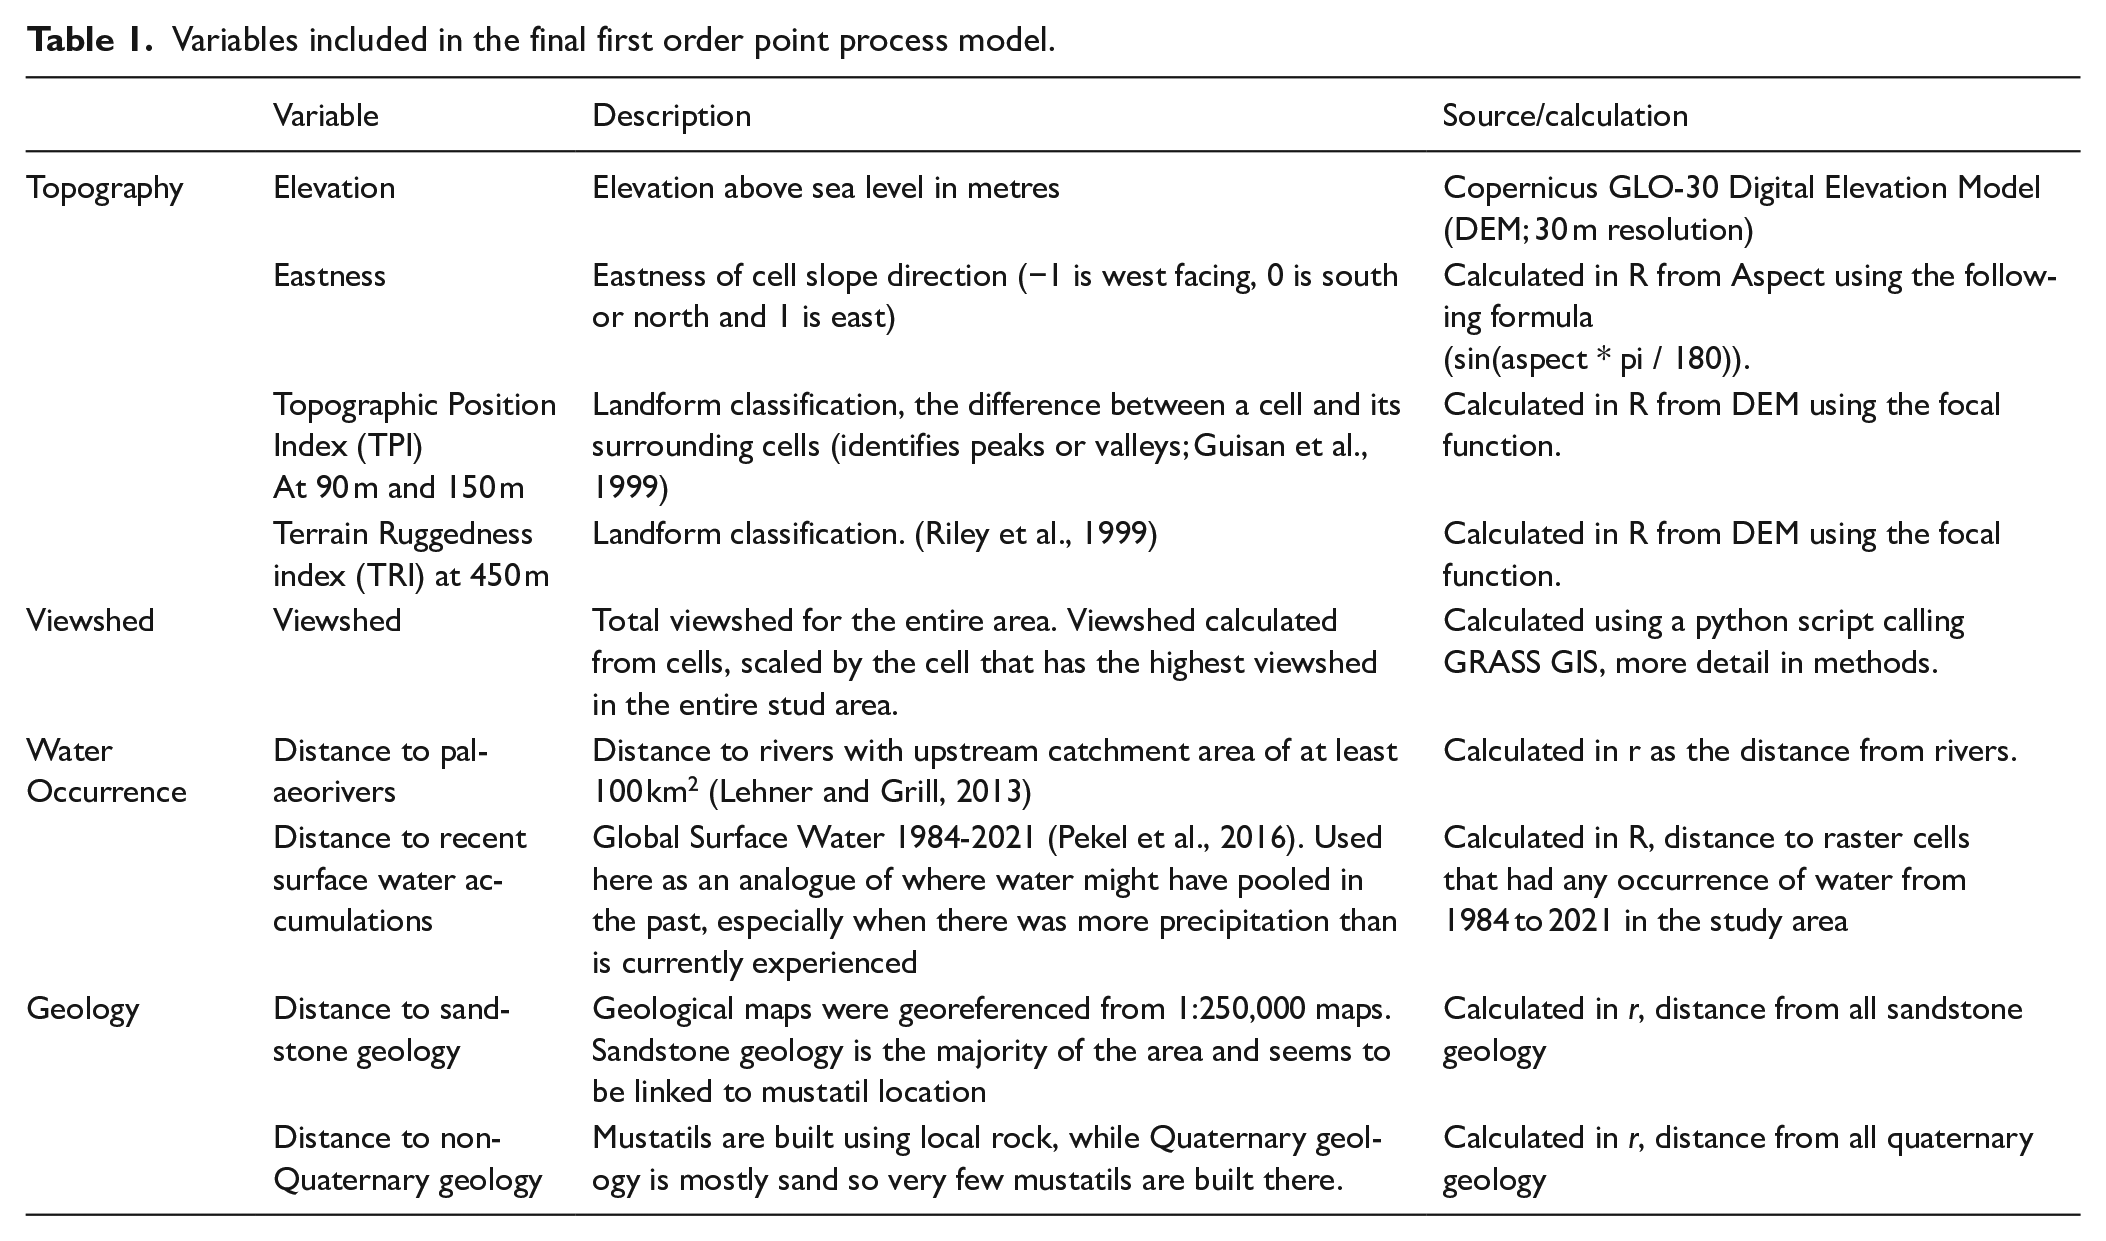
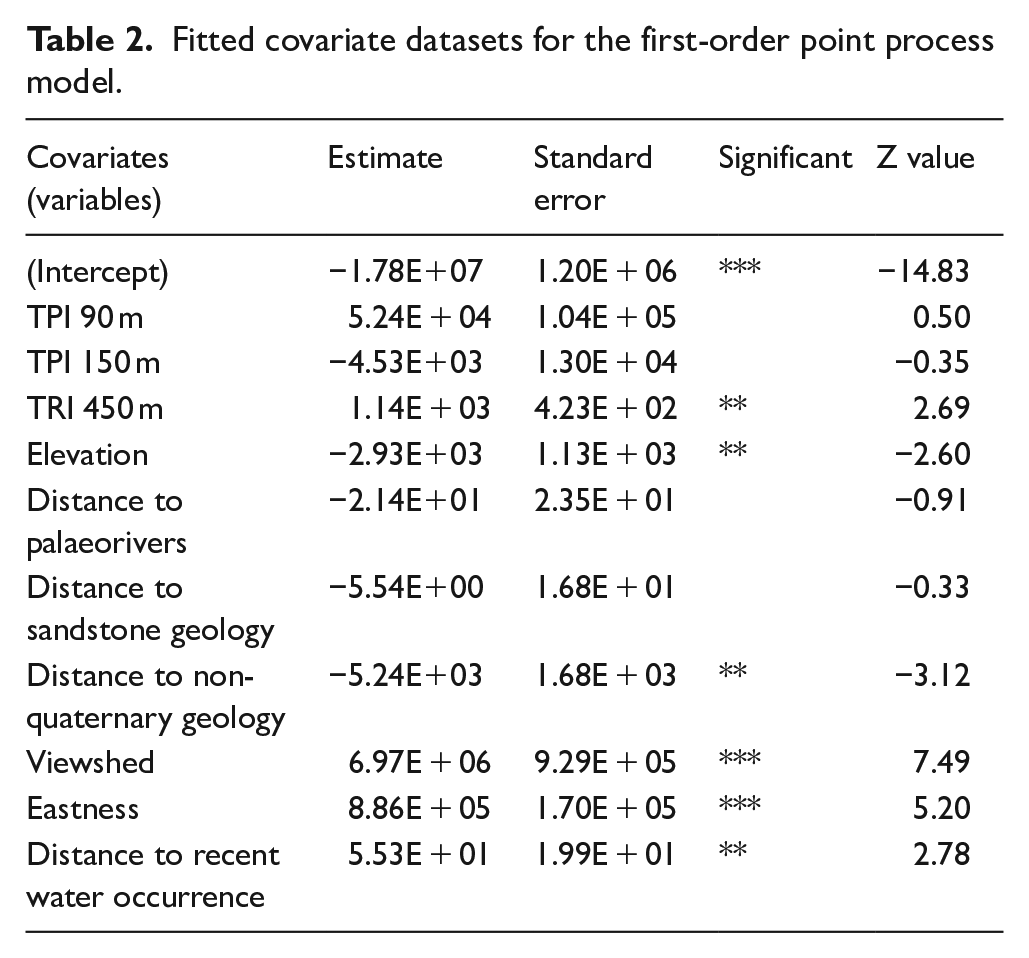
Point process models (PPM) were applied to assess multivariate effects on mustatil patterning based on 11 key variables (Supplemental Information, Table S1). The first model is a Poisson model, representing the null hypothesis of complete spatial randomness (CSR). Following this we fitted a first order model to the point pattern data. Variance Inflation Factor (VIF) was used to exclude non-independent variables from the model. The VIF for each variable was calculated, and the variable with the highest value was removed in a stepwise procedure until all of the variables had a VIF of <5. The 11 remaining variables used in the PPM were elevation, eastness, Topographic Position Index (TPI) 90 m, TPI 150 m, Terrain Ruggedness Index (TRI) 150 m, TRI 450 m, distance to palaeorivers, distance to sandstone geology, distance to non-quaternary geology (i.e. distance to rocky areas), viewshed and distance to recent water accumulation. Descriptions of the data and their sources can be found in Table 1. TPI is a landform classification metric where the difference between a central cell and the average of its surrounding cells are calculated. Negative TPI values represent valleys, while values close to zero indicate flat ground, positive values indicate ridges (Guisan et al., 1999). Similarly, TRI is a landform classification metric where the difference in elevation between raster cells is calculated, higher values indicate areas of the landscape that are rugged, while lower values are flat areas (Riley et al., 1999). Both TPI and TRI can be calculated at varying scales by including more or fewer surrounding cells. A stepwise procedure was also adopted for model fitting (Supplemental Table S2). This works by adding covariates to the model one at a time - at each step the generated models are compared to one another using the Akaike Information Criterion (AIC) as a guideline (Akaike, 1974).
Variables included in the final first order point process model.
We then fitted a second order model to account for the influence of points on one another. This model includes environmental variables of the first order model with an added model interaction term. We chose the area interaction model as it is relatively flexible. The model works by generating patterns of inhibition or clustering based on a defined circular neighbourhood around each point.
Checking model fit
Inhomogeneous Pair Correlation Functions (PCF) were used to assess the goodness of fit for each of the three models (Figure 2:4.4). PCF is a derivative of the K function, that summarizes typical point intensity in several non-cumulative annuli (doughnuts) around each site, to identify second order clustering or regularity at multiple scales (Bevan et al., 2013). Ripley’s isotropic correction was used to account for edge effects (Ripley, 1977).
Monte Carlo simulations of point patterns conditioned on different assumptions were run 999 times to create a 95% critical envelope for the PCF plots. The first PCF is a comparison of the point intensity of sites and random points, effectively a null model. The Monte Carlo envelope is conditioned on Complete Spatial Randomness (CSR) for this model. The second is a comparison of site intensity to points conditioned on the first order trend. The 95% critical envelope for the last model is conditioned on the second order model which is a combination of the first order trend with an interaction term.
Clustering and size ranking
We used results of the second order model and a mark correlation function (Figure 2:5.1) to determine a meaningful clustering distance to identify clusters of mustatils using Density-Based Spatial Clustering of Applications with Noise (DBSCAN) method (Figure 2:5.2; Ester et al., 1996). Once clusters of mustatils have been identified we used a rank permutation method (Figure 2:5.3) to determine whether mustatils are hierarchically distributed across the landscape (Carrero-Pazos et al., 2019).
Results
Covariate data
Relative density estimation plots (Figure 3) were created for each of the 10 covariates (Table 1) and show values where mustatils are more likely to occur than by chance. More mustatils are located at elevations between 880 and 950 masl than by chance (Figure 3 [plot 9]). Eastness is a good predictor for mustatil location, and mustatils are more likely to be located in areas that slope towards the east. The confidence interval band for TPI at both scales is quite large so it is difficult to see how significant the relationships are, however at the 90 m scale shows that mustatils are most commonly found in areas with positive values, that is, areas that are ‘local’ peaks in the landscape (Figure 3 [plot 6]). At the 150 m scale mustatils are more likely to be located in flat areas (Figure 3 [plot 7]). Mustatils are less common than expected in areas that do not have rugged terrain and are flatter on a broad scale (450 m; Figure 3 [plot 8]). Visibility from mustatils seems to be an important factor in their location, there are more than expected in areas that have a viewshed of between 0.2 and 0.8 (the highest value is 1; Figure 3 [plot 10]). Distance to palaeorivers has two peaks where there is an increased density of mustatils, at about 2.5 km and 10 km away from rivers. In comparison, there are more mustatils than expected between 4 and 9 km away from areas of recent surface water occurrence (Figure 3 [plot 3]). Mustatils are generally located very close to non-quaternary geology (i.e. rocky areas), and there are more mustatils than expected within 250 m of sandstone outcrops.
Point process models
Null model; complete spatial randomness
We fitted a Poisson point process model to the mustatils, which acts as the initial null hypothesis of Complete Spatial Randomness (CSR). This shows the general spatial patterning of mustatils well, where mustatils are clustered from 0 to 3 km (Figure 4:1).
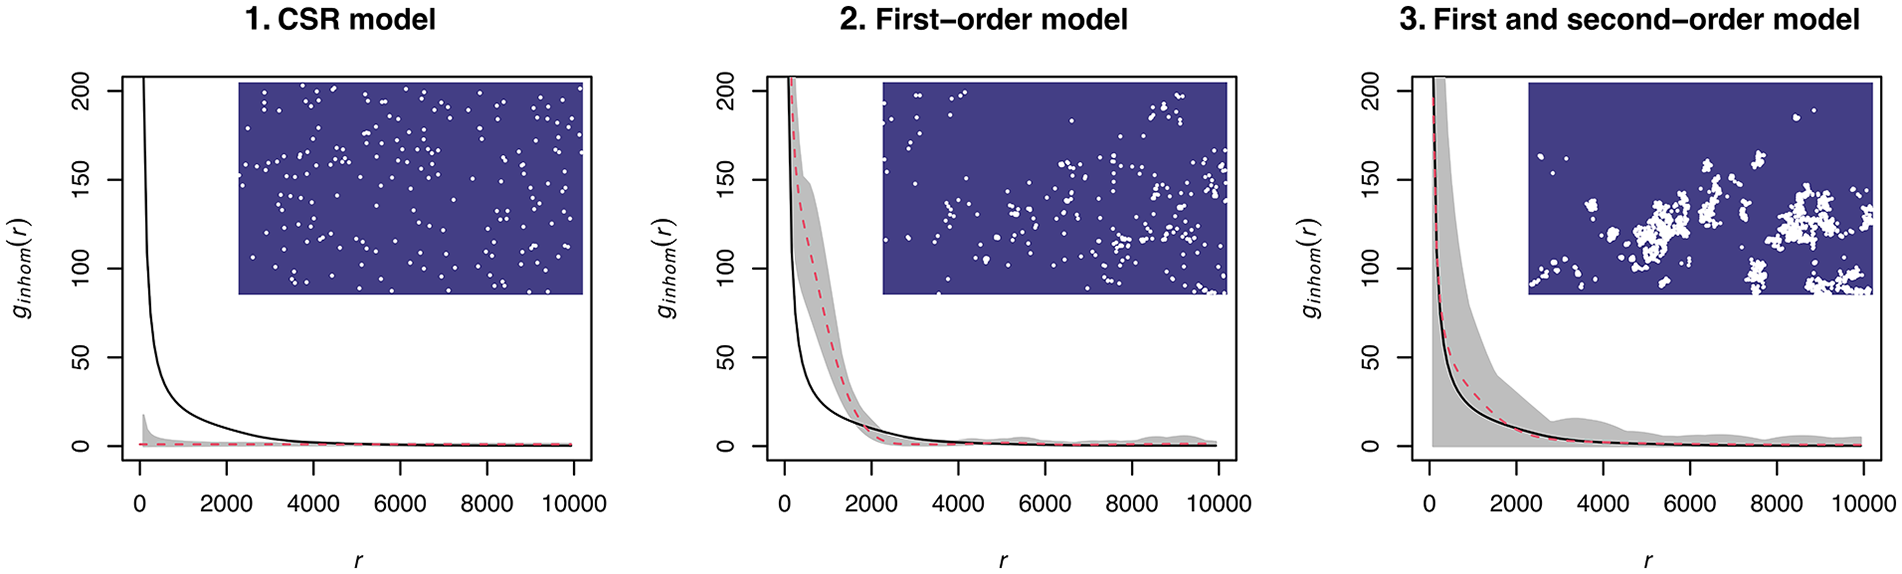
Results of the point process modelling, with simulated mustatil locations based on each model shown in white on the blue study area. 1. CSR: The PCF for the null hypothesis shows statistically significant clustering in the first 4 km. 2. First-order model: the PCF with an envelope (in grey) conditioned on the environmental variables accounts for more of the spatial patterning, but there is now statistically significant repulsion from 0 to ~1.8 km, and clustering from ~2 to 3 km. 3. First and second-order model: The final model, incorporating the first order variables and an area interaction term accounts for all of the variability in mustatil patterning.
First order model
The first order model (Figure 4:2) provides an improved fit (Supplemental Table S2), with mustatils being dispersed between 0 and 1.8 km, and clustered between 2 and 3 km away from one another. The stepwise procedure resulted in the final model that includes 10 variables: TPI 90 m, TPI 150 m, TRI 450 m, elevation, viewshed, eastness, distance to palaeorivers, distance to recent water occurrences, distance to sandstone geology and distance to non-quaternary geology (rocky areas). Six out of 10 of the variables are statistically significant in the first order model (Table 2). Despite their significance in explaining mustatil patterning there is still significant dispersion and clustering at small scales that is unexplained by this model.
Fitted covariate datasets for the first-order point process model.
Second-order model
Once we create a second order model by combining an interaction term with environmental variables (Supplemental Table S2), we see that all the variation in mustatil patterning is explained (Figure 4:3). Therefore, mustatil patterning can be explained by broad locational preferences (first order patterning) for TPI, elevation, distance to water, viewshed, eastness and distance to specific geology together with tendencies for dispersion and clustering at small scales (second order patterning).
Clustering and size ranking of mustatils
To better understand small-scale dispersion and clustering of mustatils that we identified, and how that might relate to the organization and structuring of the landscape, we conducted hierarchy analysis based on mustatil length. Hierarchy analysis shows how the largest mustatils are distributed across different clusters and therefore the landscape. The mark correlation function shows that mustatil length is significantly autocorrelated for mustatils spaced 25–35 km apart (Figure 5a). Therefore, the process determining mustatil length repeats itself at roughly 30 km intervals, and mustatils that are 25–35 km away from one another are likely to be the same or a similar length. By grouping clusters of mustatils using a distance threshold of half that size (15 km) we can identify potential meaningful clusters. In total 15 clusters of mustatils were identified using DBSCAN (Figure 5b), ranging in size from 3 to 29 mustatils (Figure 5c). Out of the 169 mustatils, 16 (i.e. <10% of the sites) do not form part of any cluster. Cluster 8 is largest and dominates along with clusters 4513 and 15 in terms of numbers (Figure 5c). There does seem to be a fair amount of variation in the geographic area each cluster takes up, although cluster 8 has the most mustatils it takes up a smaller area than cluster 15 (Figure 5b). Cluster 8 is located in an area where more dunes are present, and therefore less area to build mustatils, while cluster 15 is in the southwest of the study area, which is dominated by sandstone outcrops with very few dunes.
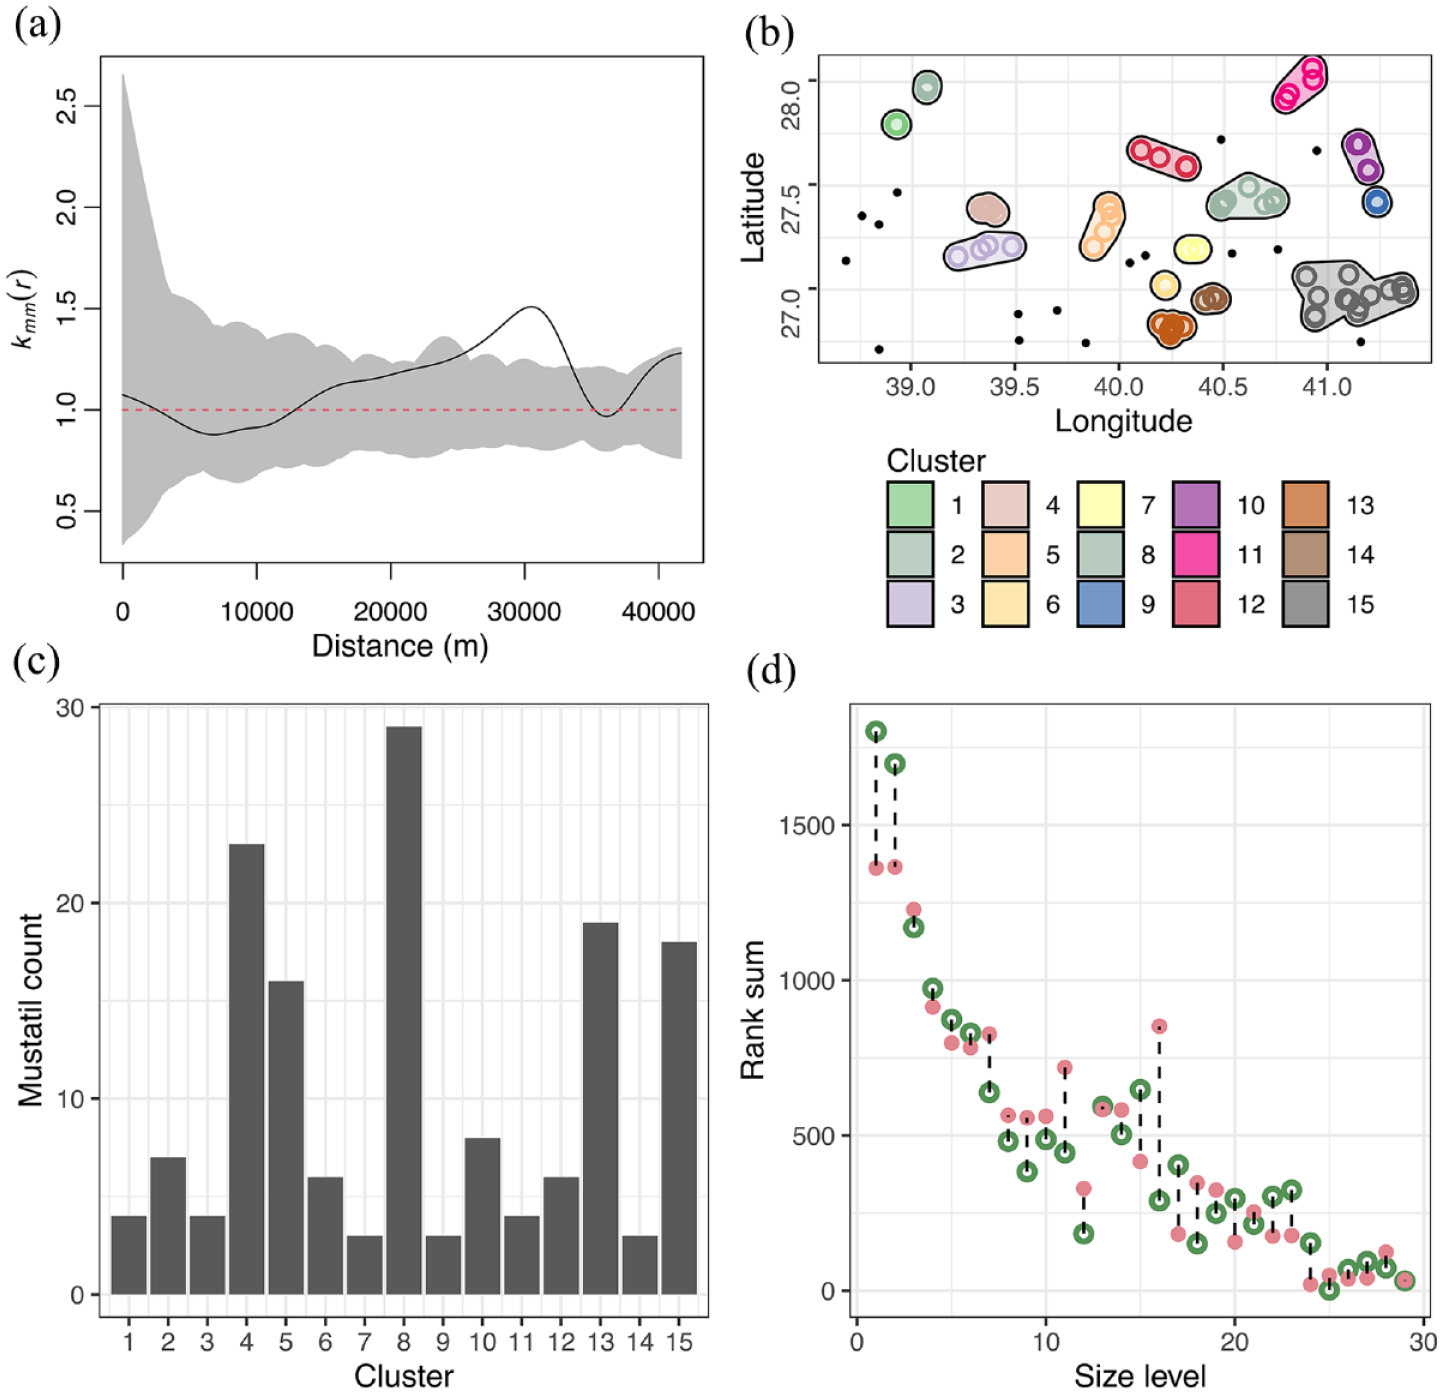
Non-hierarchical organization of mustatils in the southern Nefud Desert created using code from Riris (2020). (a) Estimated mark correlation function for mustatil length (solid black line) and pointwise envelope (grey shading) from 999 random relabellings of the mustatil data, showing significant autocorrelation of length for mustatils spaced ~25–35 km apart. (b) Results of the DBSCAN algorithm showing cluster locations and sizes, 15 discrete mustatil clusters are highlighted with their convex hulls, identified at a threshold of 15 km. Black points indicate mustatils that are not part of any cluster. (c) Count of mustatils for each cluster, minimum group size = 3. (d) Differences in rank sums of mustatil length between an ideal hierarchy (green) and observed distribution (pink), given the same number of mustatils and clusters.
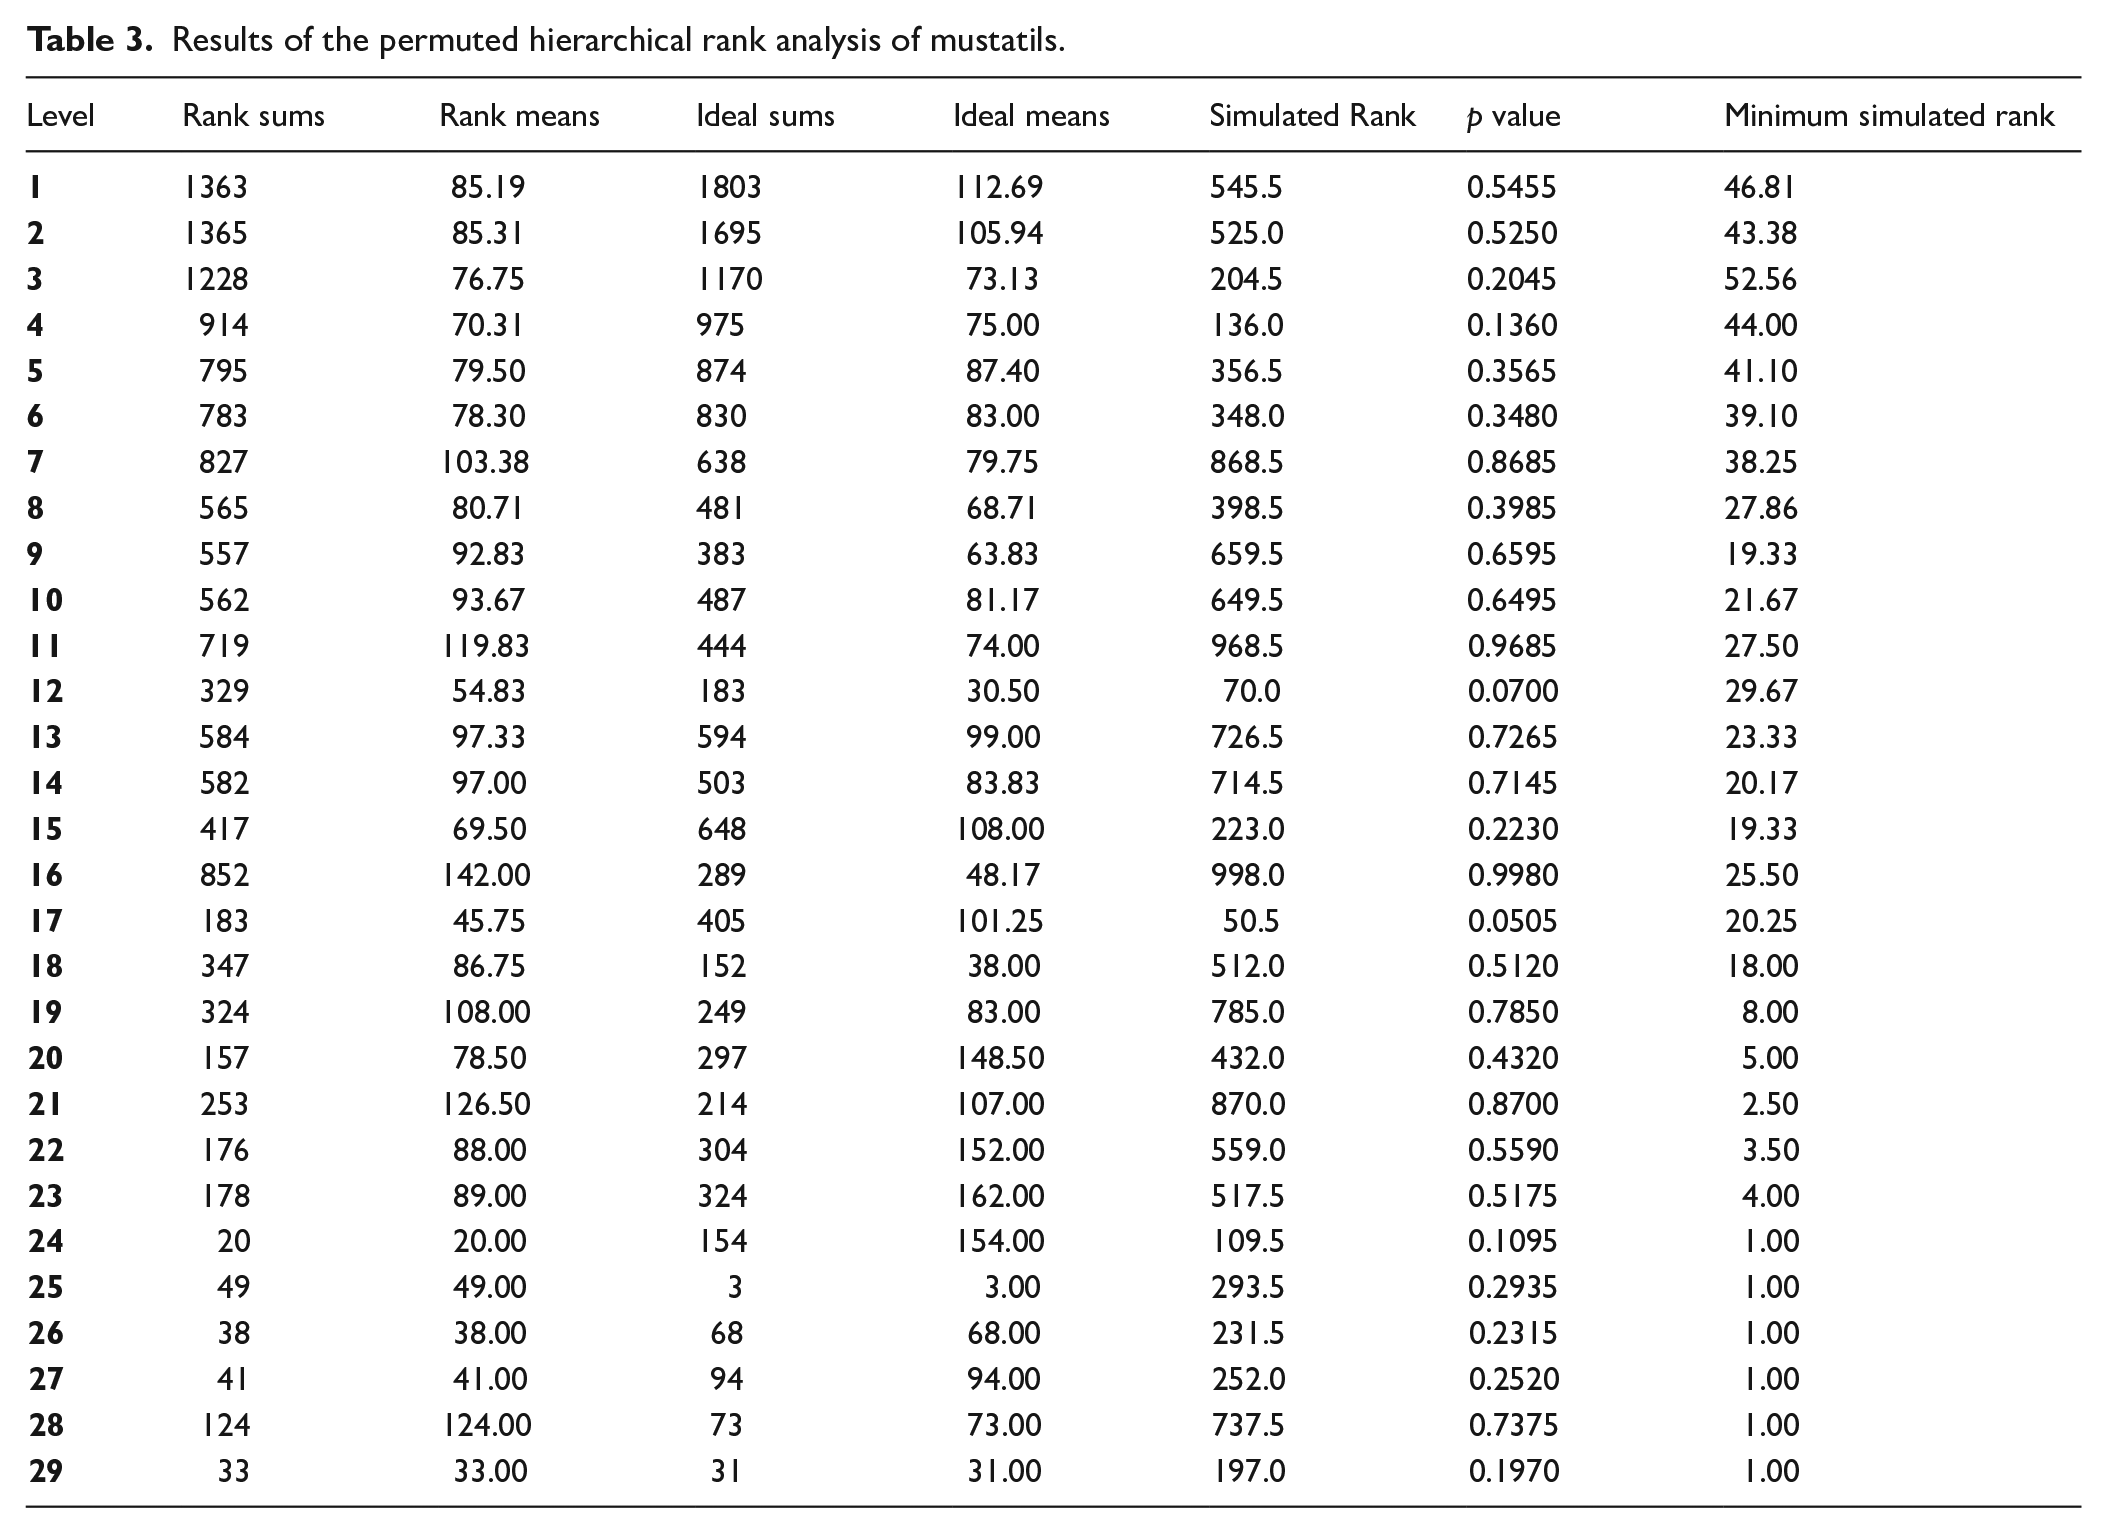
Mustatils vary significantly in length, the largest in this study area is 616 m long and the shortest 17 m. Visually, mustatils of different sizes cluster together (Figure 6). In order to test whether mustatils within clusters are arranged hierarchically, we analysed meaningful clusters using a rank permutation method developed by Carrero-Pazos et al. (2019). By hierarchically arranged, we mean that within clusters there are large mustatils, followed by medium-sized and small mustatils. The implication being that all mustatils across the study area are ranked, where the longest is ranked 1 and the shortest 169, in this case. A hierarchy of mustatil lengths is then created within each cluster, where the longest mustatil in the cluster has a hierarchical level of 1 and the shortest is equal to the number of mustatils in that cluster. This allows for comparison of mean and sum ranks at each hierarchical level. The sum of observed hierarchy levels for clusters is compared to the sum of the ideal distribution of hierarchy levels, if there was a perfect hierarchy given the same number of ranks per group. The number of hierarchical levels is 29, corresponding to the number of mustatils in the largest group. Generally, the observed rank sums of mustatils for each hierarchy level differ from the ideal (Figure 5d). The observed size hierarchies of the first two levels, which would be the largest and second largest mustatil in each group, are much smaller than the ideal if mustatils were hierarchically arranged within clusters. The observed hierarchies of other levels do not appear to follow any particular pattern, but all differ from the ideal hierarchy. These results suggest that mustatils within clusters are not hierarchically distributed. In order to confirm that the differences between observed and ideal values are greater than might be expected by chance we used a Monte Carlo simulation and randomly shuffled hierarchy ranks independently of group membership. The observed ranks can then be compared to 999 simulated shuffled ranks, resulting in a p-value. Results show that none of the hierarchical levels of mustatil sizes for 15 clusters can be distinguished from the null hypothesis of no internal ranking (Table 3). Therefore, the largest mustatils are not distributed across the clusters in a way that is hierarchical.
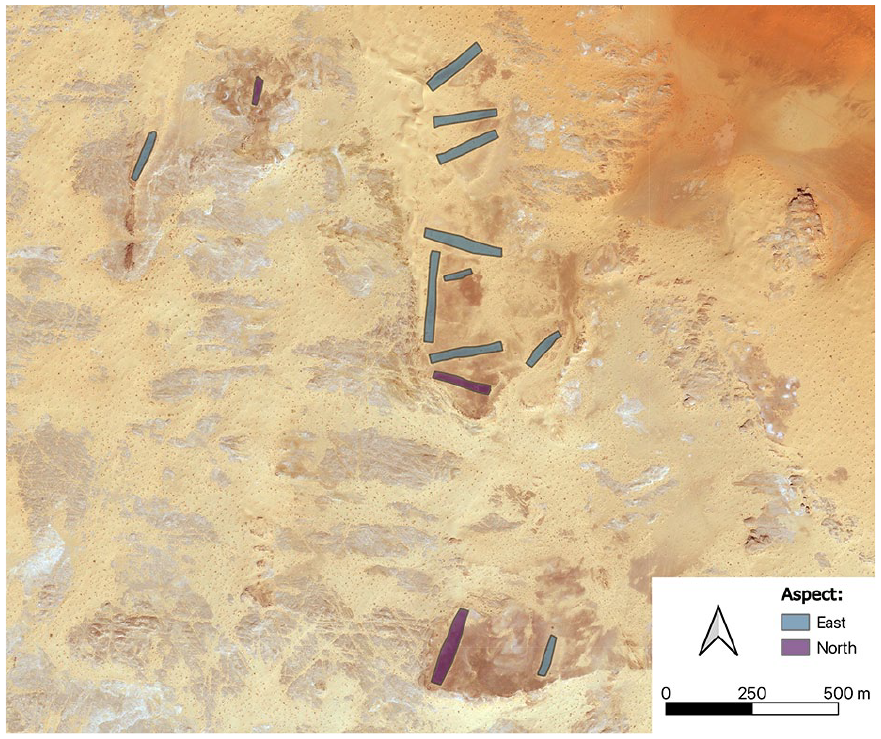
View of cluster 5, containing 13 mustatils identified using DBSCAN. This cluster is located in the centre of the study area, just west of Jebel al-Misma, at the southern edge of the Nefud Desert. Mustatils are outlined, while aspect is shown to highlight the frequency of mustatils built on east sloping ground. Satellite imagery is from Microsoft Bing Aerial.
Results of the permuted hierarchical rank analysis of mustatils.
Our results of the point pattern analysis (Figure 2, step 4) show that mustatils along the southern margin of the Nefud Desert concentrate at elevations between 880 and 940 masl, within 5 km of likely water sources and 2 km of sandstone geology (Figure 3). Mustatils are also concentrated along ridges that have a moderate view across the landscape and are on east-facing slopes (Figure 3). Once these first order locational trends have been accounted for, mustatils still show dispersal and clustering at distances of 0–3 km away from one another (Figure 4). This implies that once people built mustatils in an area it encouraged construction of new ones, or that multiple mustatils were built all at once in an area.
Discussion
The large size and frequency of mustatils in the landscape indicates that they were an important part of people’s cultural identity when they were built. Dating evidence suggests that mustatils were constructed within a relatively short time frame, making their large number all the more interesting. Mustatils appear to have been territorial markers in the landscape, as well as localities where ritual activities were conducted.
Through the use of spatial analysis, we empirically tested archaeological hypotheses about the interplay of different causes for the spatial patterning of mustatils along the southern margins of the Nefud Desert. We demonstrated that people who built mustatils in this area chose locations based on preferences for certain topography and in the vicinity of water and raw materials for construction. At a local scale, based on the mark correlation function and cluster analysis, the spacing of mustatils shows that there was some kind of spatial partitioning of the landscape which may relate to the rangelands of different groups of people (Figure 5).
We have shown the importance of proximity to water on mustatil location (Table 2), which supports hypotheses by other researchers (Kennedy et al., 2023), through the correlation of palaeorivers and recent surface water accumulations with mustatil locations. It is significant to note that we have utilized a conservative threshold for defining these rivers, with only channels accumulating water from an upstream area in excess of 100 km2 considered. This excludes very small wadi and headwater courses. A relatively lower abundance of drainages in the study area meeting this criterion further reinforces the observed spatial association. A speculative explanation for this association may be that even if such courses were only episodically active with surface flow, then a longer persistence of vegetation along the wadi courses may have provided a ready source of pasture and browsing for domesticates, such as those observed in mustatil assemblages, and attracted hunted prey.
We have used recent surface water occurrence (1984–2021) as a conservative analogue for where water would likely have pooled for at least some of the year during the enhanced humidity of the HHP. Our fieldwork in the area suggests these recent surface water data reflect areas on Holocene playa that have held water at some point during the last 30 years. It remains surprising however that distance to palaeolakes/wetlands/playa does not seem to be an important factor in mustatil placement, and may be due to the diachronic nature of this dataset. Proximity to recent surface water occurrence is however an important factor (Table 2) and is closely related to palaeolakes. The current absence of detailed early to Mid-Holocene palaeoenvironmental information from dated proxies in northern Arabia (with the exception of the aforementioned sites at Tayma and Jubbah within rare deep structural basins holding recent high groundwater) inhibits our understanding of the persistence or otherwise of moisture on the wider landscape. As such, beyond being confident that moisture availability was greater than present it is hard to qualify how persistent surface water was, and high mobility may have been a prerequisite for accessing any standing water rapidly. Evidence from multiple mustatils now shows that the majority of faunal remains belong to domesticated cattle, followed by caprids and small numbers of wild (hunted) animals (Groucutt et al., 2020; Kennedy et al., 2023; Thomas et al., 2021b), with the exception of one mustatil which has an abundance of wild fauna (Abu-Azizeh et al., 2022). Based on this evidence and the large size and typological similarity of mustatils across large geographic distances, it is becoming clear that mustatils are likely territorial markers on the landscape, with a strong indication that this might be related to ancestral pasturage (Thomas et al., 2021b)
We have shown that the process determining mustatil length repeats itself every 30 km, resulting in 15 clusters of mustatils across the study area which are not hierarchically distributed based on mustatil length (Figure 5). If mustatil size (length) is a proxy for labour mobilization and site importance, this finding of non-hierarchically distributed mustatils indicates that the groups that built them were unlikely to have hierarchical social relations or community structure. Each cluster was likely built by a different group of people practising localized authority over areas associated with access to pasture and water. Ethnographic studies of pastoralists in southern Syria and Jordan have shown that Bedouin peoples follow a general seasonal pattern of east-west movement (Bahhady, 1980; Meister et al., 2019; Roe, 2000). In both areas, people spend the dry summer in the west, in areas that have more permanent water sources. Around October, people start their migration east in search of pasturage during the rainy season, by May they return west. Safaitic inscriptions dating to at least the 1st century AD in northern Saudi Arabia and southern Jordan make reference to seasonal migration (Macdonald, 1992). The inscriptions indicate that people were going to the open desert, and most of these inscriptions are on the eastern edge of the harrats where people might have congregated before the wet season (Macdonald, 1992). There is also evidence in the recent past (pre 1970s) of people moving vast distances from northern Saudi Arabia as far as Syria and Iran during years of drought (Gardner, 2003).
The majority of mustatils that are currently known cover the area between Tabuk, Medina and Ha’il, with the largest concentrations in Khaybar and AlUla. While at this stage it is not possible to know what patterns of transhumance might have looked like, the broad distribution of mustatils might provide insight into the area across which this was practised by groups of people who constructed mustatils. While we cannot currently know whether people were moving this entire distance, it is clear that people who built mustatils shared a common idea of what mustatils should look like and what they were used for. The geographic overlap between the distribution of mustatils and that of the so-called ‘Jubbah style’ Neolithic rock art (Guagnin, 2020)provides further evidence of shared cultural traits across this region. Perhaps the majority of people lived in the areas where mustatils are most concentrated and moved seasonally towards the east during the rainy season. Across multiple years of fieldwork in the area, we have observed how rapidly the dune areas of the Nefud host grass following strong rains. Given that the region was less arid during the Holocene, many areas on the edges of the Nefud could have provided seasonally rich pasturage. During the 20th century, each tribe of Saudi Arabia had a dirah’, an area in the desert over which that tribe had pasturage rights. The most important locations within the dirah’ were the water sources which acted as waypoints in the social geography of the region (Gardner, 2003). While ethnography cannot be directly projected onto people of the past, it does provide a starting point from which we can create hypotheses. The Mutair, one of these tribes, had an area of ancestral pasturage in north-eastern Saudi Arabia during the 20th century (Dickson, 1949). People within this tribe would make an average of 20 moves a year, covering a total distance of 350 km (Alvard and Kuznar, 2001; Dickson, 1949). The practice of territoriality over pasturage was present ethnographically, and based on current evidence from mustatils it is likely that this practice has occurred in some form in northwestern Saudi Arabia since around 5500 BC. We know that mustatils were used as ritual structures, where feasting took place, possibly to strengthen bonds between different groups of people. Future work should aim to better understand how clusters of mustatils identified here (Figure 5) relate to possible groups and what transhumance patterns may have been. A single group would have needed multiple pasturage areas in order to cross large distances, and the fact that mustatils were likely built by groups of people coming together also complicates this matter.
The finding here that mustatils are preferentially located on east facing slopes (Figure 3) may link to the potential transhumance patterns and the ritual aspect of mustatils. If mustatils were built to mark ancestral pasturage to be used in the rainy season there may be some significance with autumn and spring solstice, when sunrise is directly east. This could also be more generally to do with light and shadow across the mustatil, which is an important factor in rock art locations (Guagnin et al., 2022). The start of the rainy season, in October, and the end of the rainy season in February are fairly close to the solstices. The presence of a deciduous molar of a caprid found in a mustatil also indicates that people buried the caprid skull in the mustatil between spring and summer (Kennedy et al., 2023), and that the mustatil was potentially constructed at the end of the rainy season when there would have been enough resources to allow time to construct a monument. As with any landscape positioning it is difficult to untangle multiple attributes and reasons for positioning of mustatils. The east-sloping preference might also be related to a more functional hypothesis. The prevalent direction of wind in the study area is north-west in summer and southwest in winter, however, the windy season in northern Saudi Arabia is from late autumn to late spring (Edgell, 2006; Whitney et al., 1983). Mustatils may be preferentially built on east sloping ground in order to take advantage of wind shadows created by jebels or other landforms. More work on understanding both the spatial patterning of mustatils, as well as more fine-scaled work on isotopes and seasonality will hopefully shed light on this in the future.
The study area chosen here represents the eastern edge of the mustatil tradition, and comparing the results of locational preferences here with mustatils in Khaybar and AlUla counties will help our understanding. More broadly, it has been suggested that mustatils represent a link between platform-like structures in the Levant and platforms related to Cattle Cults in southern Arabia (Groucutt et al., 2020; McCorriston et al., 2012; Munoz et al., 2020; Rosen, 2015). While mustatils are a unique phenomenon with a limited spatial distribution, they fall both temporally and spatially between these two platform traditions. Investigating the relationship (if any) between these different traditions of constructing social meaning on the landscape would be an interesting avenue of further research.
More chronometric dates on mustatils within clusters will clarify the order in which they were built and how this relates to size. Understanding the timing of construction of mustatils of different sizes could shed light on whether mustatils of different sizes were built together or at different times. More chronological data on mustatils will also allow for the use of more complex spatial statistics which take into account the dates of structures. Similarly, more work should be done to apply bi or multivariate spatial statistics to assess the patterning of different types of stone structures and how they compare to one another, given the tendency for structures both of similar and discrete types to be built in close proximity to one another.
Conclusion
We have shown that spatial statistics can help to understand why people chose specific locations, and more broadly what kind of economies and movement patterns people were using during the Neolithic of northern Saudi Arabia. People chose areas close to water, sources of raw material for building, and on ridges with elevations of 880–950 masl and with good views of the surrounding landscape. Furthermore, we were able to identify meaningful clusters of mustatils which may hint at mobility and transhumance patterns of Neolithic peoples in northwestern Saudi Arabia. Our results provide further context for the mustatil phenomenon. This type of analysis could be applied to a wider range of structures across the Arabian Peninsula to better understand these monuments that cover the landscape in their thousands, and any variability in spatial patterning and construction priorities across different regions of Arabia. The combination of high-resolution excavation data and wider landscape scale analysis will continue to shed further light on these enigmatic structures and the organization and landscape-level structure of Neolithic societies in northwestern Saudi Arabia. More broadly, our results show the power of detailed spatial analysis to elucidate the landscape positioning of large-scale archaeological structures which have fascinated both academics and the general public globally.
Supplemental Material
sj-docx-1-hol-10.1177_09596836241275010 – Supplemental material for Landscape positioning of Neolithic mustatil stone structures along the margins of the Nefud Desert, Saudi Arabia
Supplemental material, sj-docx-1-hol-10.1177_09596836241275010 for Landscape positioning of Neolithic mustatil stone structures along the margins of the Nefud Desert, Saudi Arabia by Amy Hatton, Paul S Breeze, Maria Guagnin, Faisal al-Jibrin, Abdullah M Alsharekh, Michael Petraglia and Huw S Groucutt in The Holocene
Footnotes
Acknowledgements
We thank HH Prince Badr Bin Abdullah Bin Farhan Al-Saud, Saudi Minister of Culture, for permission to conduct research in Saudi Arabia. We also thank Dr Jasir Alherbish, CEO of the Saudi Heritage Commission, and Dr. Abdullah al-Zahrani, General Manager of Archaeology for their support. We thank Dr Hugh Thomas and Dr Melissa Kennedy of Prehistoric AlUla and Khaybar Excavation Project for the locations of some mustatils.
Author contributions
Funding
The author(s) disclosed receipt of the following financial support for the research, authorship, and/or publication of this article: Funding for this research was provided by the Max Planck Society. AMA acknowledges the support of the Researchers Supporting Project number (RSP2024 R126) King Saud University, Riyadh, Saudi Arabia.
Supplemental material
Supplemental material for this article is available online.
References
Supplementary Material
Please find the following supplemental material available below.
For Open Access articles published under a Creative Commons License, all supplemental material carries the same license as the article it is associated with.
For non-Open Access articles published, all supplemental material carries a non-exclusive license, and permission requests for re-use of supplemental material or any part of supplemental material shall be sent directly to the copyright owner as specified in the copyright notice associated with the article.