
Abstract
The European climate during the Holocene period is characterised by frequent changes of temperature and precipitation. The North Atlantic plays a major role as a driver for European climate and is a dominant precipitation source, particularly for the western European and north African realm. Atmospheric pressure gradients over the Atlantic (North Atlantic Oscillation, NAO), Atlantic circulation patterns (Atlantic Multidecadal Oscillation, AMO) or positioning of the Atlantic jet stream have been suggested to be responsible for precipitation patterns across western Europe. However, proxy data provide an inconsistent picture on how precipitation responds to changes in the Atlantic realm such as changes of Atlantic temperature (IRD), atmospheric pressure (NAO), water circulation (AMO) or the jet stream. Here we present a record of speleothem-based winter precipitation amount from Portugal. The record covers most of the Holocene and demonstrates that wetter conditions were synchronous in western and southern Iberia during early and mid Holocene. The record also shows a correlation between increased winter precipitation amount in western Iberia and Atlantic cooling, evidenced by Bond events, between 10 and 4 ka.
Introduction
Despite relative climate stability during the Holocene, frequent climatic changes are nevertheless observed in the northern Hemisphere (Mayewski et al., 2004), for example in the form of episodic Atlantic cooling (Bond et al., 2001), North Atlantic storminess (Goslin et al., 2018) or changes of precipitation and temperature over continental Europe (Mauri et al., 2015). The Atlantic plays an important role for precipitation patterns across Europe via atmospheric pressure cells and the North Atlantic Oscillation (NAO) or via Atlantic water circulation (Deininger et al., 2017; Delworth et al., 2017; Domínguez-Villar et al., 2017; Hurrell, 1995; Wanner et al., 2001), but precipitation patterns are inherently complex systems. The NAO index characterises relative changes of the average pressure differences between the Azores (sub-tropical) high-pressure cell and the Icelandic (sub-polar) low-pressure cell (Wanner et al., 2001). A positive NAO is indicated when both sub-tropical high and sub-polar low are stronger than average and during a positive NAO phase westerlies are positioned more northward (Visbeck et al., 2001; Wanner et al., 2001). As a result, climatic conditions are typically colder and drier across the Iberian Peninsula and Mediterranean regions and warmer and wetter in northern Europe. When the NAO is negative, both the sub-tropical high and sub-polar low are weaker than average, positioning the westerlies more southerly and bringing moisture to the Mediterranean realm with colder and drier conditions in northern Europe. Also, a connection between NAO, Atlantic sea surface temperature (SST) and Atlantic Multidecadal Oscillation (AMO) has been suggested, with a positive (negative) NAO leading to Atlantic warming (cooling) resembling the AMO (Delworth et al., 2017). Furthermore, western Europe late winter precipitation and the Atlantic jet stream variability are found to correlate with Atlantic sea surface temperature (Simpson et al., 2019).
While it has generally been documented by proxy data that the Holocene climate in Europe was variable in precipitation and temperature, detailed palaeoclimate data about spatial or seasonal differences and connections between the Atlantic (e.g. SST) and continental climate (e.g. precipitation) are lacking. In particular, a possible connection between Atlantic cold phases and western European precipitation remains ambiguous. A Holocene speleothem record from northern Spain indicates dry conditions during North Atlantic cold events (Smith et al., 2016). In contrast, a speleothem record from Morocco suggests that, during the early and late Holocene, Atlantic cold phases evidenced as Bond events are associated with a negative NAO resulting in wetter conditions in the western Mediterranean realm (Ait Brahim et al., 2019). A recent study using instrumental data over the last hundred years suggests that in late winter a positive AMO is accompanied by enhanced precipitation over Iberia (Simpson et al., 2019). Further Holocene winter precipitation records from Iberia would be ideal to test the relationship between Atlantic cooling phases and precipitation in the peninsula.
Stable isotopes, in particular variations of δ18O, are commonly used as climate proxies, linking various archives such as ice cores, deep sea sediments or speleothems. However, interpretation of δ18O variation in various proxy archives is not always straight forward. Here we present past precipitation changes based on an alternative proxy – stalagmite growth rate – which can only be applied under specific circumstances and is not generally applicable as a palaeo rainfall proxy. We present two stalagmite records from Portugal, which formed during the Holocene in close proximity in the same cave. Growth rates, isotope data and monitoring results for the two specimens reveal that one of the two stalagmites formed largely as a result of increased late winter rain and provides a Holocene winter precipitation record for western Iberia.
Setting and methods
Cave site
The Almonda karst system (Torres Novas, Portugal; 39.5057°N 8.6157°W) is located on the ~40 km long fault escarpment separating Portuguese Estremadura’s Central Limestone Massif from the Tagus Cenozoic basin. The karst system is situated approximately 40 km inland between 75 and 150 m.a.s.l., oriented in a NE-SW direction and is home to a network of cave passages and archaeological sites, namely Galeria da Cisterna, Gruta da Oliveira, Gruta da Aroeira and Galeria das Lâminas (GdL) (Figure 1). (Daura et al., 2017; Deschamps and Zilhão, 2018; Marks et al., 2001; Trinkaus et al., 2007, 2011; Zilhão, 2009; Zilhão et al., 1991, 2010). The site is situated on the boundary between present-day climate zones Csa and Csb, according to the Iberian Climate Atlas (AEMET, 2011). Vegetation cover today consists of subhumid thermomediterranean and woody flora dominates the area. The most abundant species are: Olea europaea var. sylvestris, Rhamnus alaternus, Pistacia terebinthus, Pistacia lentiscus, Myrtus communis, etc. In the areas with deeper soils, Pinus pinaster and Quercus sp. evergreen grow (Badal et al., 2012).
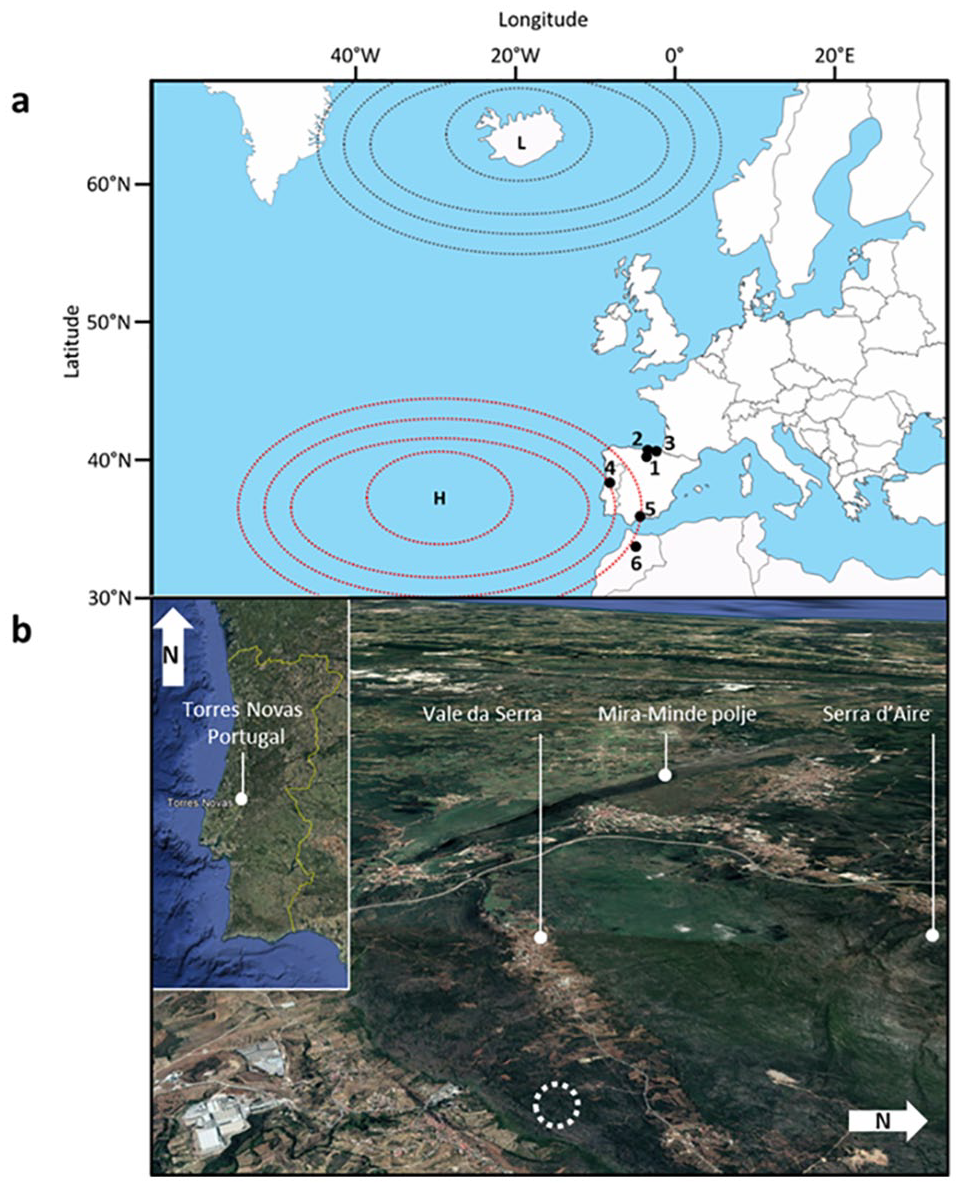
(a) Positions of the Icelandic low (grey)/Azores high (red) pressure centres (indicated by dashed lines) and site locations of the speleothem climate records discussed in the text: (1) Kaite Cave, Spain (Domínguez-Villar et al., 2017), (2) Cueva de Asiul, Spain (Smith et al., 2016), (3) La Garma Cave, Spain (Baldini et al., 2015), (4) Galeria das Lâminas (this study), (5) El Refugio Cave, Spain (Walczak et al., 2015) and (6) Chaara Cave (Ait Brahim et al., 2019). (b) Galeria das Lâminas is situated in the Almonda Karst nearby Torres Novas, Portugal and its position is indicated by the dashed circle.
The site was selected due to its proximity to the Portuguese coast and potential sensitivity to large-scale climatic changes, such as the NAO and sea surface temperature fluctuation. Two stalagmites (GdL2014-1 and GdL2016-1) were collected in Galeria das Lâminas, a passage through which flows the Ribeira do Norte, one of the two underground rivers that come together at the Almonda spring. GdL is currently accessed via a subvertical shaft connected to the surface via an artificial entrance opened in the Vale da Serra synclinal, ca. 1 km upstream from the spring and approximately 70 m above the level of the underground river (Supplemental, Figure S1). During the wet period in late winter/early spring, large amounts of water flow through the passage. In spring some sections are still inundated but, in summer, the phreatic level is much lower and the floor of the passage, mostly rocky but sandy in patches, becomes exposed.
Speleothem collection
Both speleothems – GdL2014-1 and GdL2016-1 – were active upon collection and were removed in situ in 2014 and 2016. The passage is rather large and has a patchy decoration of speleothems. The collection locality is well above the level reached during winter flooding. The two specimens were situated approximately 20 m apart and grew from spots approximately 1.8 to 2 m (or more) above the locality’s current floor. Both specimens are candle type stalagmites with average diameters of 68 mm (GdL2014-1) and 60 to 98 mm (GdL2016-1). GdL2014-1 measures 104 mm in length, while GdL2016-1 measures 780 mm (Figure 2). The specimens were selected based on their unique features: both had a distinct colour change from clear-translucent white to a reddish tint: The top 10 cm of GdL2016-1 consist of clear, transparent calcite while the longer bottom part has a distinct reddish discolouration. The top 8 cm of GdL2014-1 are also clear and transparent. A reddish band is visible at approximately 2 cm from its base. The colour change was interpreted as a possible growth hiatus or a change in cave system dynamics.
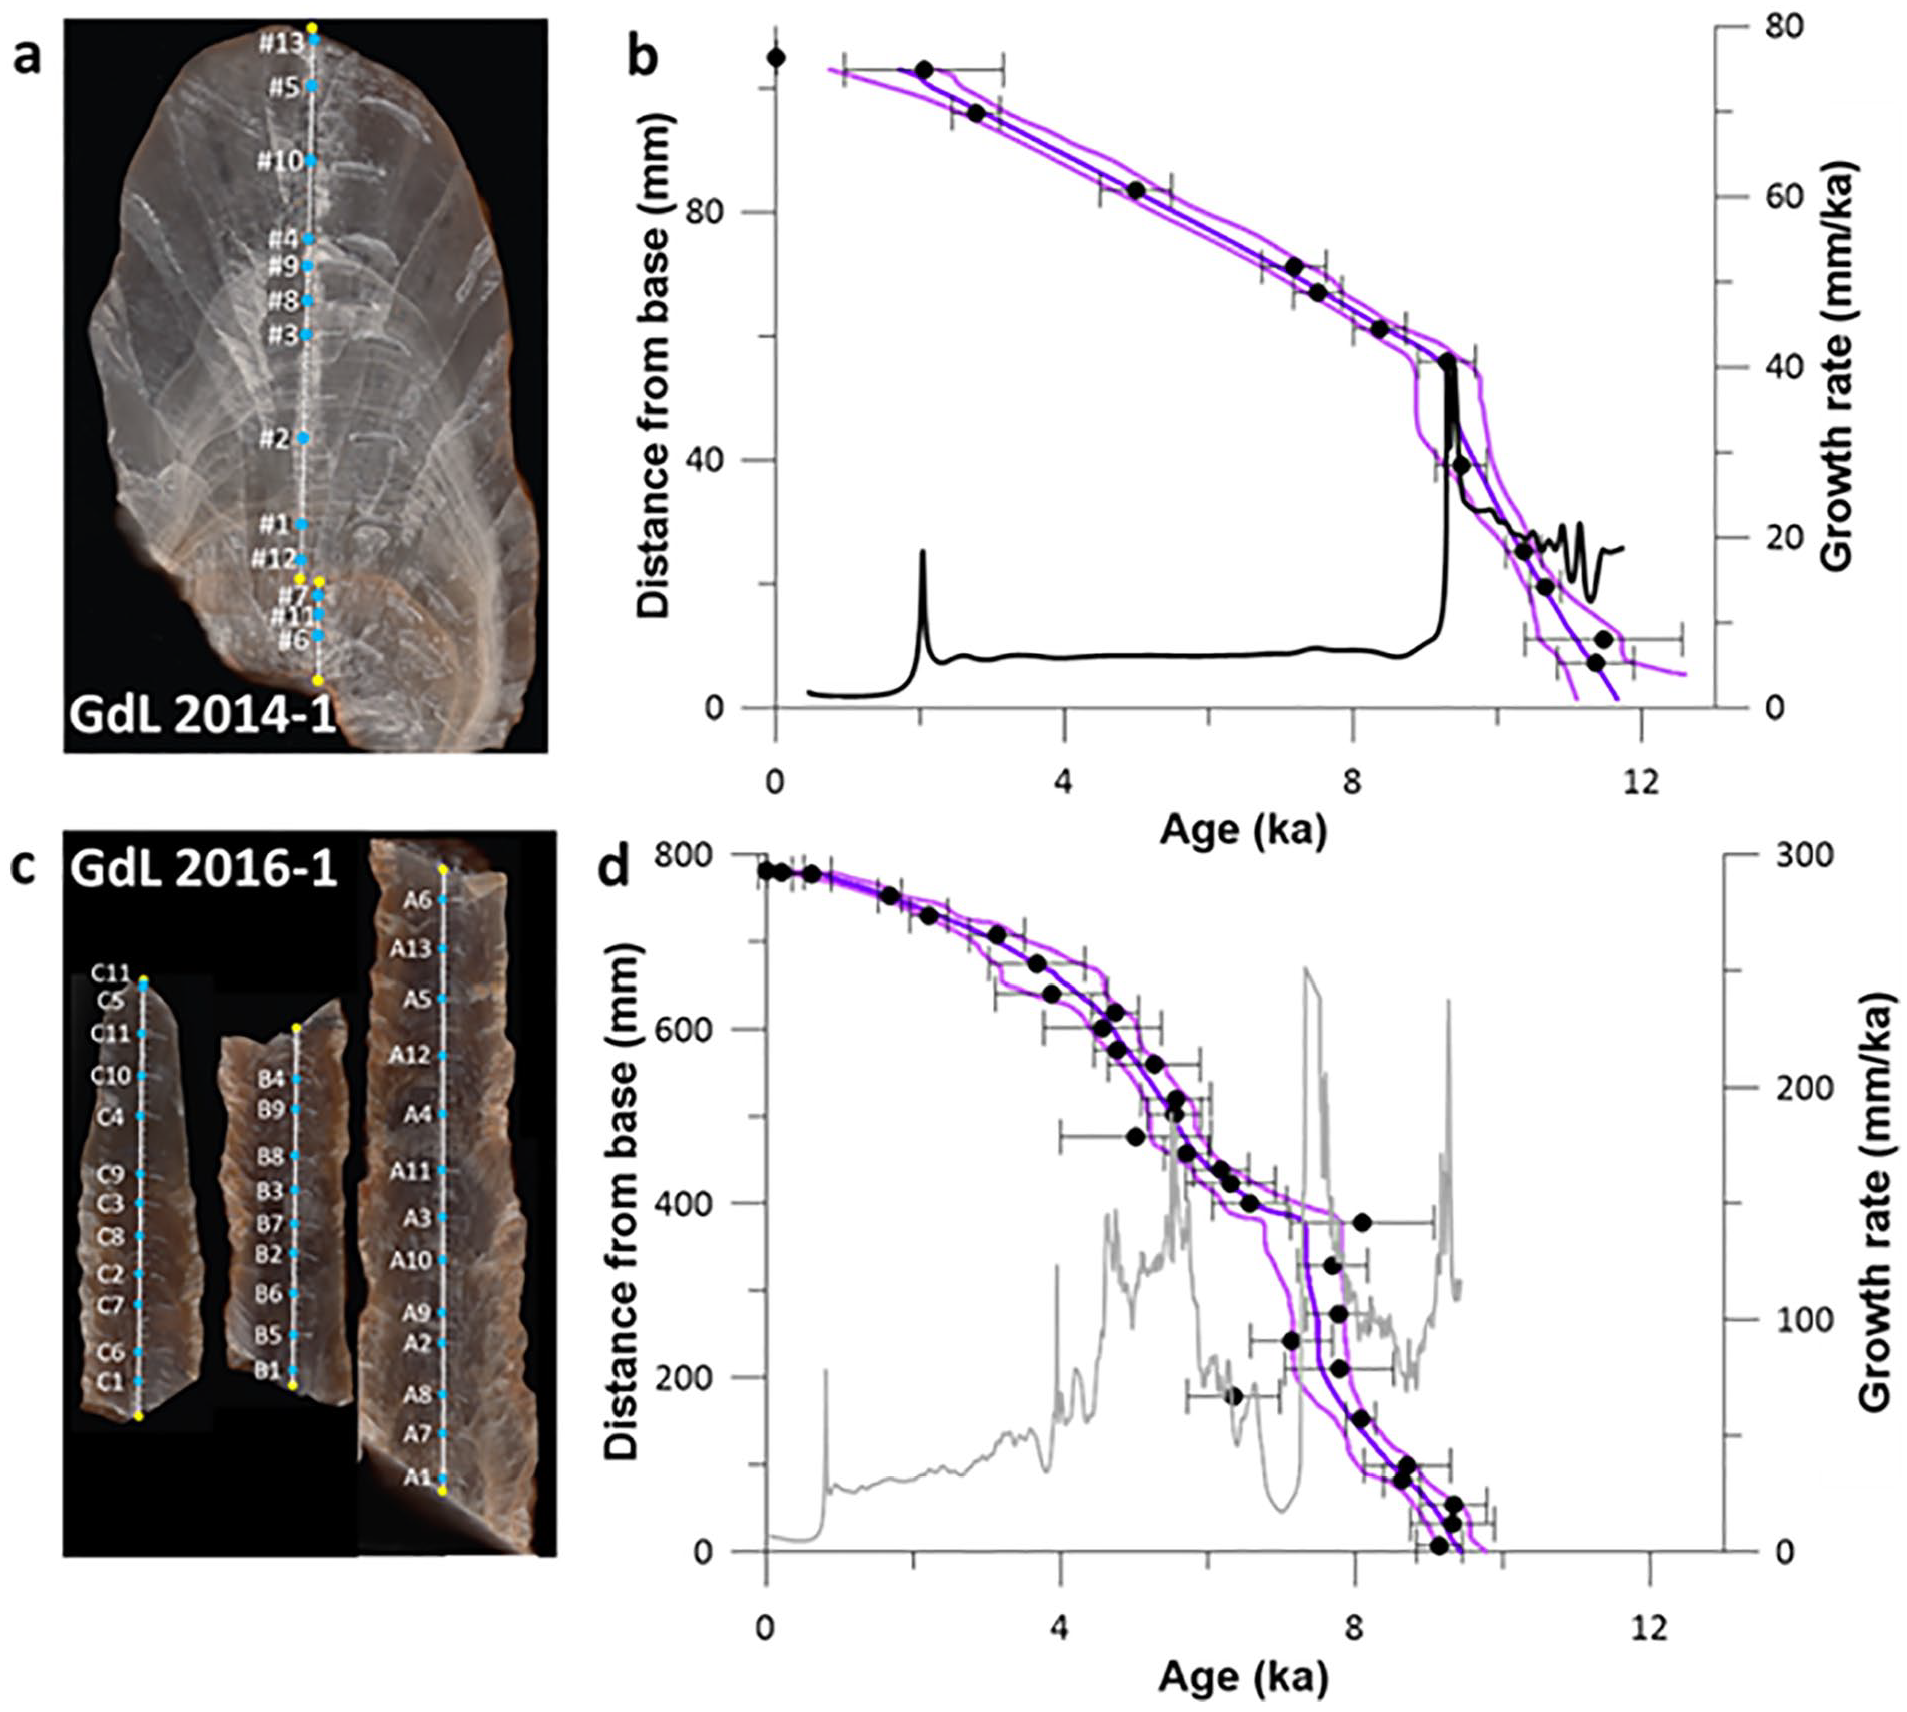
(a) GdL2014-1 speleothem profile with sub-sample positions. The sample positions for U-Th dates are shown in blue, with respect to the central growth axis and indicated with a sample number. The sampling tracks for stable isotopes are indicated by white lines with a yellow dot at both ends of each section of the track. (b) Age model for GdL2014-1 created using the algorithm StalAge (Scholz and Hoffmann, 2011). The dates are shown in black with 2σ error bars. The central purple line represents the mean age, with outlying lines indicating the 2σ uncertainty bands. The growth rate of the stalagmite is superimposed on the image (black line). (c) GdL2016-1 speleothem profile with sub-sample positions. The sample positions for U-Th dates are shown in blue, with respect to the central growth axis and indicated with a sample number. The sampling tracks for stable isotopes are indicated by white lines with a yellow dot at both ends of each section of the track. (d) Age model for GdL2016-1 created using the algorithm (Scholz and Hoffmann, 2011). The dates are shown in black with 2σ error bars. The central purple line represents the mean age, with outlying lines indicating the 2σ uncertainty bands. The growth rate of the stalagmite is superimposed on the image (grey line).
Cave monitoring
Basic cave monitoring was undertaken to better understand the current cave system and the response to changes outside the cave. Cave monitoring for GdL includes temperature and relative humidity, drip rates for the positions of the specimens analysed for this study and CO2 logging.
Two Hobo temperature loggers were installed at the collection locality and one was positioned in the access shaft, half way down from the entrance. A Hobo relative humidity logger was also positioned in the collection locality. Temperature and relative humidity were recorded at 4 hour intervals. As the two stalagmites were active upon collection, Stalagmate drip counters (Collister and Mattey, 2008) were installed at the position of sample removal for both specimens to record current drip rates.
Upon visits to the cave, CO2 levels were measured throughout the descent, using a handheld Vaisala CO2 meter. Additionally, a CORA CO2 monitor (Luetscher and Ziegler, 2012) was installed in close proximity to the position of the two stalagmites in the cave. CO2 levels were then recorded at 4 h intervals throughout one seasonal cycle. We also obtained rainfall amount and air temperature data for Torres Novas from Meteoblue History+ (www.meteoblue.com, 30.01.2020), to compare the cave logging data to outside cave weather conditions. Meteoblue History + provides simulation data compiled from nearby weather stations and various national weather services that are incorporated into model simulations to provide high precision data at high spatial resolution. More information regarding meteoblue data sources can be found here: https://docs.meteoblue.com/en/meteo/data-sources/data-sources. Stable isotope data of rainfall for selected Portuguese locations were retrieved from the GNIP data base.
Speleothem sub sampling
The stalagmites were cut into two halves along the growth axis using a diamond coated circular saw. The surfaces were then polished to reveal the calcite structure and possible laminations. The dense and pristine calcite shows no visible indications of recrystallisation and its structure varies from translucent white to light cream in colour. Possible growth hiatuses were observed along the growth axes of both stalagmites in the form of a thin, red layer approximately 90 mm from the tip of each specimen. Subsamples for U-Th dating and stable isotope analyses were collected using a handheld micro drill with tungsten carbide drill bits. Uranium-Thorium (U-Th) samples with masses ranging between 19 and 40 mg were collected from isolated layers along the growth axis of each stalagmite. Stable isotope sampling was done at 1 mm intervals from base to tip of both specimens.
U-Th analyses
For U-Th dating, a total of 13 samples for GdL2014-1 and 34 samples for GdL2016-1 were processed and analysed at the Max Planck Institute for Evolutionary Anthropology (MPI-EVA) in Leipzig, Germany. A modified, double resin procedure was used for chemical separation and purification of U and Th for MC-ICPMS, as described by Hoffmann et al. (2016). Uranium series measurements were undertaken on a ThermoFinnigan Neptune MC-ICPMS with a Cetac Aridus II and a Savillex PFA 50 µl/min micro concentric nebulizer. Refer to Hoffmann (2008), Hoffmann et al. (2007) and Hoffmann et al. (2018) for further details regarding measurement methods, including standards and protocols used to assess and correct instrumental biases. An age model for each stalagmite was created using StalAge (Scholz and Hoffmann, 2011).
Stable isotopes
Stable isotope records for δ18O and δ13C were also measured at the MPI-EVA isotope laboratory. In total, 104 sub-samples for GdL2014-1 and 772 sub-samples for GdL2016-1 were drilled along the central growth axis of each specimen using a drill bit diameter of 0.7 mm. Samples were measured on a Thermo Scientific MAT-253plus Isotope ratio mass spectrometer (IRMS) connected to a KIEL IV Carbonate Device.
Results
Monitoring
Monitoring in Galeria das Lâminas was started in 2016. Seasonal cave flooding of passages occasionally prevented continuous maintenance and data collection, resulting in non-continuous fragmented data sets. However, the period of November 1, 2016 to April 1, 2018 is nearly complete and provides detailed information about the cave environment over an annual cycle. Cave monitoring data support that GdL is generally well suited for speleothems to record palaeoenvironmental proxy data. For example, the passage is non-ventilated and temperature stays constant, even though part of the underground Ribeira do Norte water flows through GdL after extensive rain events in spring.
Cave temperature, humidity and CO2 levels
Temperature and relative humidity in Galeria das Lâminas are stable. The temperature inside the cave at the collection locality remains stable at 16.5°C. Figure 3 shows the cave temperature over the course of one and a half years together with the outside mean daily temperature. Outside temperatures fluctuate between 9°C and 30°C (Meteoblue History+, www.meteoblue.com), and do not appear to affect the cave temperature (Figure 3). The relative humidity in the cave is constant at 100%.
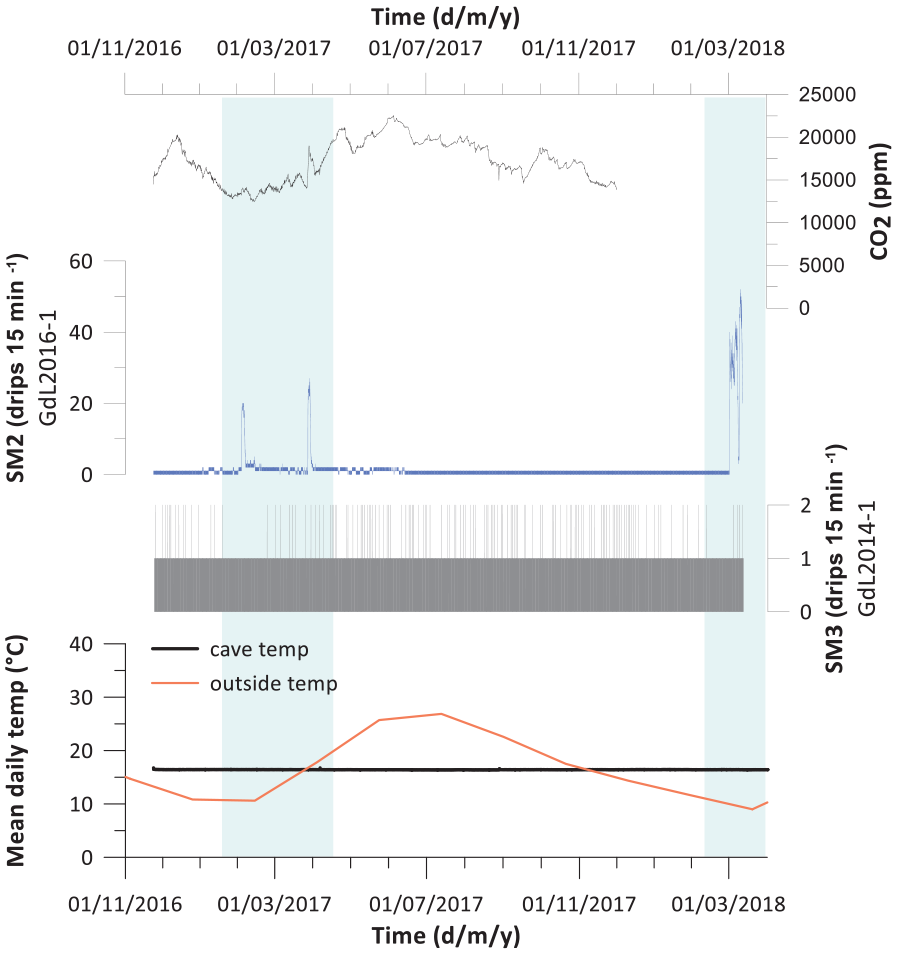
Cave monitoring data from Galeria das Lâminas, spanning 1/11/2016 to 1/4/2018. CO2 levels were measured with a CORA CO2 logger (top black line). Stalagmate drip loggers SM3 and SM2 recorded drip rates from the active straws feeding GdL2014-1 and GdL2016-1 respectively. Blue highlighted areas indicate the winter and early spring months exhibiting the highest recorded levels of precipitation. Temperature recordings were taken directly next to the location of GdL2014-1 and are indicated by a thick black line. The outside temperature data (orange line) was obtained from Meteoblue History+ (www.meteoblue.com 30/01/2020) for the Torres Novas station.
A CORA CO2 logger was installed in November 2016 and over the course of one year recorded CO2 levels for one seasonal cycle. CO2 in the cave atmosphere is generally high in GdL with values between 12,000 and 22,000 ppm. The lowest CO2 levels were found in winter between January and March, coinciding with a period of increased drip rates for GdL 2016-1 (see below), while highest levels are reached in June (Figure 3).
Drip rates and rain events
Average annual rainfall across the Iberian Peninsula is rather variable, with the highest levels of precipitation occurring in north and northwest Iberia (AEMET, 2011). The Iberian climate Atlas (AEMET, 2011) provides mean monthly precipitation values (1971–2000) for Coimbra (about 100 km north of Torres Novas), Santarém (about 40 km south of Torres Novas) and Lisbon (about 100 km south of Torres Novas). Highest monthly rainfall occurs between October and February, while the driest months are around July, supporting that north – western Portugal is generally affected by increased winter precipitation and dry summers.
The drips feeding the two stalagmites have very different patterns. GdL2014-1 is fed by a constant very slow drip rate with a drip interval d of ~2000 s. In contrast, the drip rate feeding GdL2016-1 is highly seasonal (Figure 3). During summer/autumn (July–Dec) it has a similar long drip interval as GdL2014-1 with d ~ 1300 s. However, in winter/spring (January–June) the average drip interval is shorter with about 530 s and we find peaks where d is as short as 18 s. Meteoblue data show that variable rainfall amounts are evident throughout November to May in Torres Novas, with particular phases of high precipitation occurring between January and April (Figure 4). Periods with increased drip rates/short drip intervals are found in late winter/early spring and correlate with heavy rain events. However, strong rain events also occur in early winter (Figure 4), but a drip rate response cannot be detected before late winter. Thus, there is a delay in response of the drip rate to the outside precipitation volume. It appears that the overlying soil and epikarst need to reach field capacity before changes of the drip rate feeding GdL2016-1 can be observed (Figure 4). Once the epikarst is saturated, the peaks in drip rate closely follow strong rain events (Figure 4) as found in February and March.
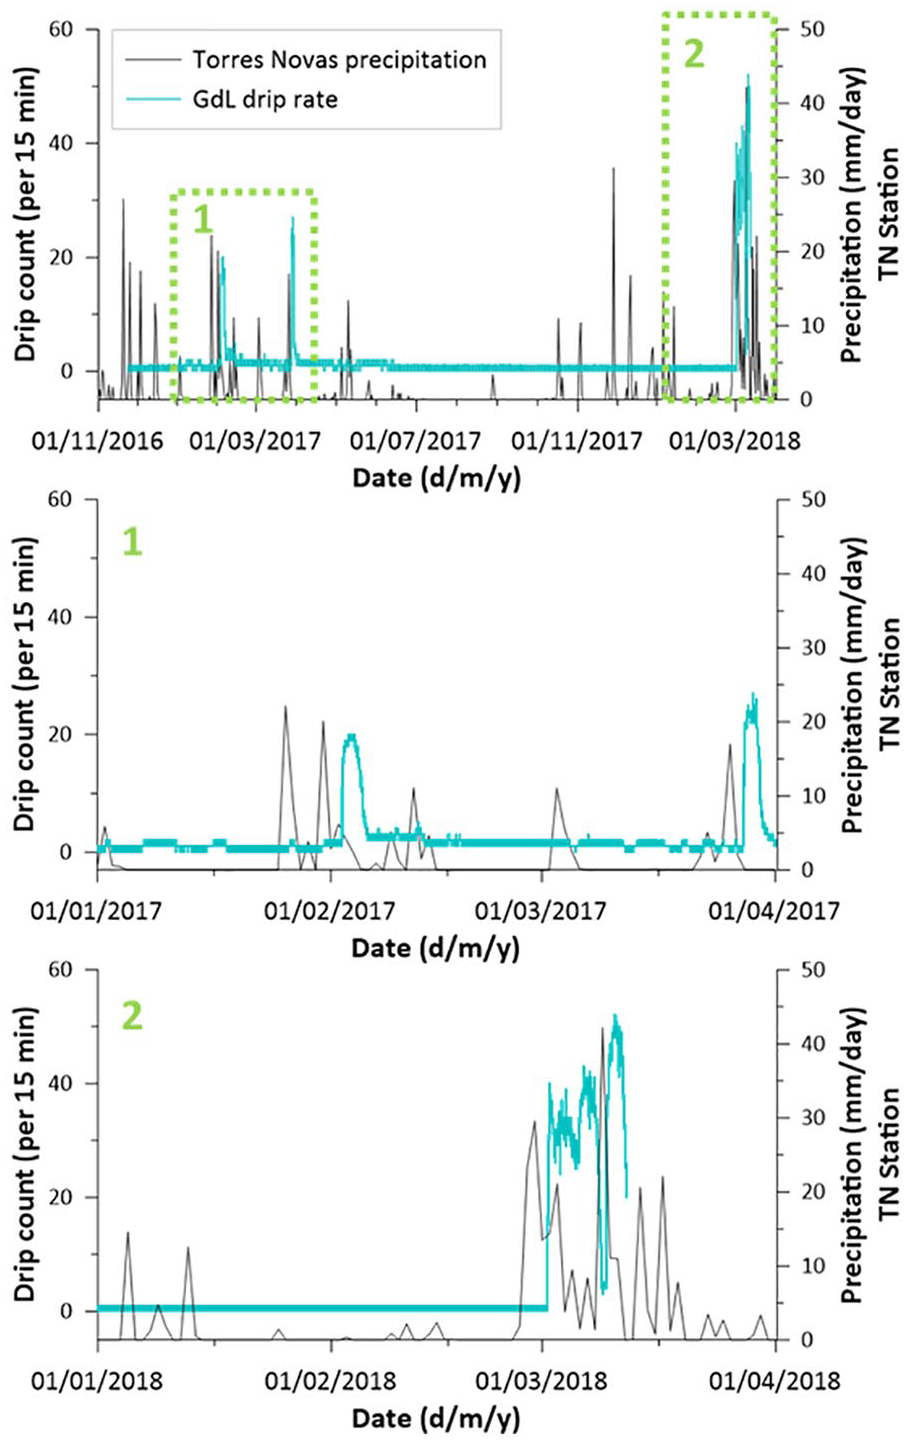
Top: Drip rates for GdL2016-1 (blue line) and precipitation data from Torres Novas weather station (black line), plotted against time. The monitoring data covers the period of 01/11/2016 to 01/04/2018. Precipitation data for Torres Novas was obtained from Meteoblue History+ (www.meteoblue.com). The sections highlighted with green boxes with numbers 1 and 2 are shown in detail below. (1) and (2): Detailed sections to illustrate the slight delay between increased outside precipitation and the subsequent groundwater response responsible for feeding GdL2016-1, during: (1) the wet phase 01/01/2017 to 01/04/17 and (2) wet phase 01/01/18 to 01/04/18.
After the period including two peaks in drip rate in February and April 2017, we found a ‘lake’ in the bottom parts of GdL (visit on 06/04/17). The water was more than two meters deep and covered a roughly 20 m long section of the cave. This indicates that a significant rise of the karst’s phreatic level occurred after the rain events in February and March. During the period with a very strong rain/drip peak in 2018, we found extremely high water levels in the lowest section of the passage. Its functioning as the course of an underground river was well apparent during a visit on 03/03/18, when logging equipment could not be accessed.
U-Th dating and chronology
U-Th ages reveal that GdL2014-1 started to form at 11.4 ± 0.5 ka. The topmost sample two mm below the active surface has an age of 2 ± 1.1 ka. U-Th ages for GdL2016-1 fall between 9.14 ± 0.31 and 0.62 ± 0.27 ka, again with an active surface. Figure 2 shows the distance-age models based on all of the dates for GdL2014-1 and GdL2016-1 respectively, with interpolated values and associated confidence levels generated using the StalAge algorithm (Scholz and Hoffmann, 2011). Figure 2 also illustrates the growth rates of the two specimens, derived from StalAge interpolated ages along the growth axis. Growth rates for both specimens are highly variable. GdL2014-1 has a mean growth rate around 14 mm/ka and GdL2016-1 has a mean growth rate around 96 mm/ka. In more detail, for GdL2014-1, we find two main growth phases, with initial growth averaging 81.9 mm/ka until 9.3 ka, at which point the rate decreases to 6.6 mm/ka (Figure 2). The formation of GdL2016-1 appears to be more variable, averaging 120 mm/ka between 9.4 and 7.5 ka, with a reduction to 24 mm/ka occurring between 6.7 and 7.2 ka. Growth increases again to 121 mm/ka between 6.7 and 4.5 ka, followed finally by a steady decrease in growth of 51 mm/ka from 4.5 ka towards the present (Figure 2). Supplemental Table S2 provides reference data for U-series calculations for both specimens.
Uranium concentrations are relatively consistent within each of the two stalagmites but we find a difference of mean U concentration between the two specimens. GdL2014-1 has quite low concentrations between 10 and 46 ng/g and an average of 30 ng/g. 238U concentrations of GdL2016-1 are about twice as high as of GdL2014-1 with values between 49 and 112 ng/g and an average of 69 ng/g (Figure 5). Overall, a shared trend of steadily decreasing values can be observed in both stalagmites from initial growth towards the present. Additionally, the initial 234U/238U activity ratios calculated for the two stalagmites are also significantly different, with GdL2014-1 displaying higher values (~1.27) than GdL2016-1 (~1.14) (Figure 5), which suggests different water sourcing for the two specimens. 232Th concentrations are quite variable in both specimens. GdL2014-1 has generally very low 232Th concentrations (below 1 ng/g) but has a peak of 4 and 44 ng/g at the base (Supplemental, Table S2). This peak is associated with a red layer indicating increased detritus incorporated in this section. The sample with 44 ng/g 232Th is not datable by U-Th due to a dominating detrital component. There is also a slightly elevated concentration at the top (Figure 5). The 232Th concentration in GdL2016-1 is generally higher than in GdL2014-1, as also found for U, and the 232Th concentration is typically more variable with values between 0.2 and 2 ng/g (Figure 5). We also find concentration peaks up to 25 ng/g, again typically associated with red layers pointing to increased detrital contamination. The observed higher 238U and 232Th concentrations in GdL2016-1 and the 232Th concentration peaks can probably be explained by colloidal or particle bound transport of U and Th during periods of increased rainfall and subsequent ‘overflow’ which today feeds GdL2016-1. GdL2014-1 was possibly fed by a similar mechanism for the first 2 ka where we find the increased 232Th concentrations as well as a higher growth rate. This changed at 9.7 ka, the time when growth of GdL2016-1 started (Figure 5).
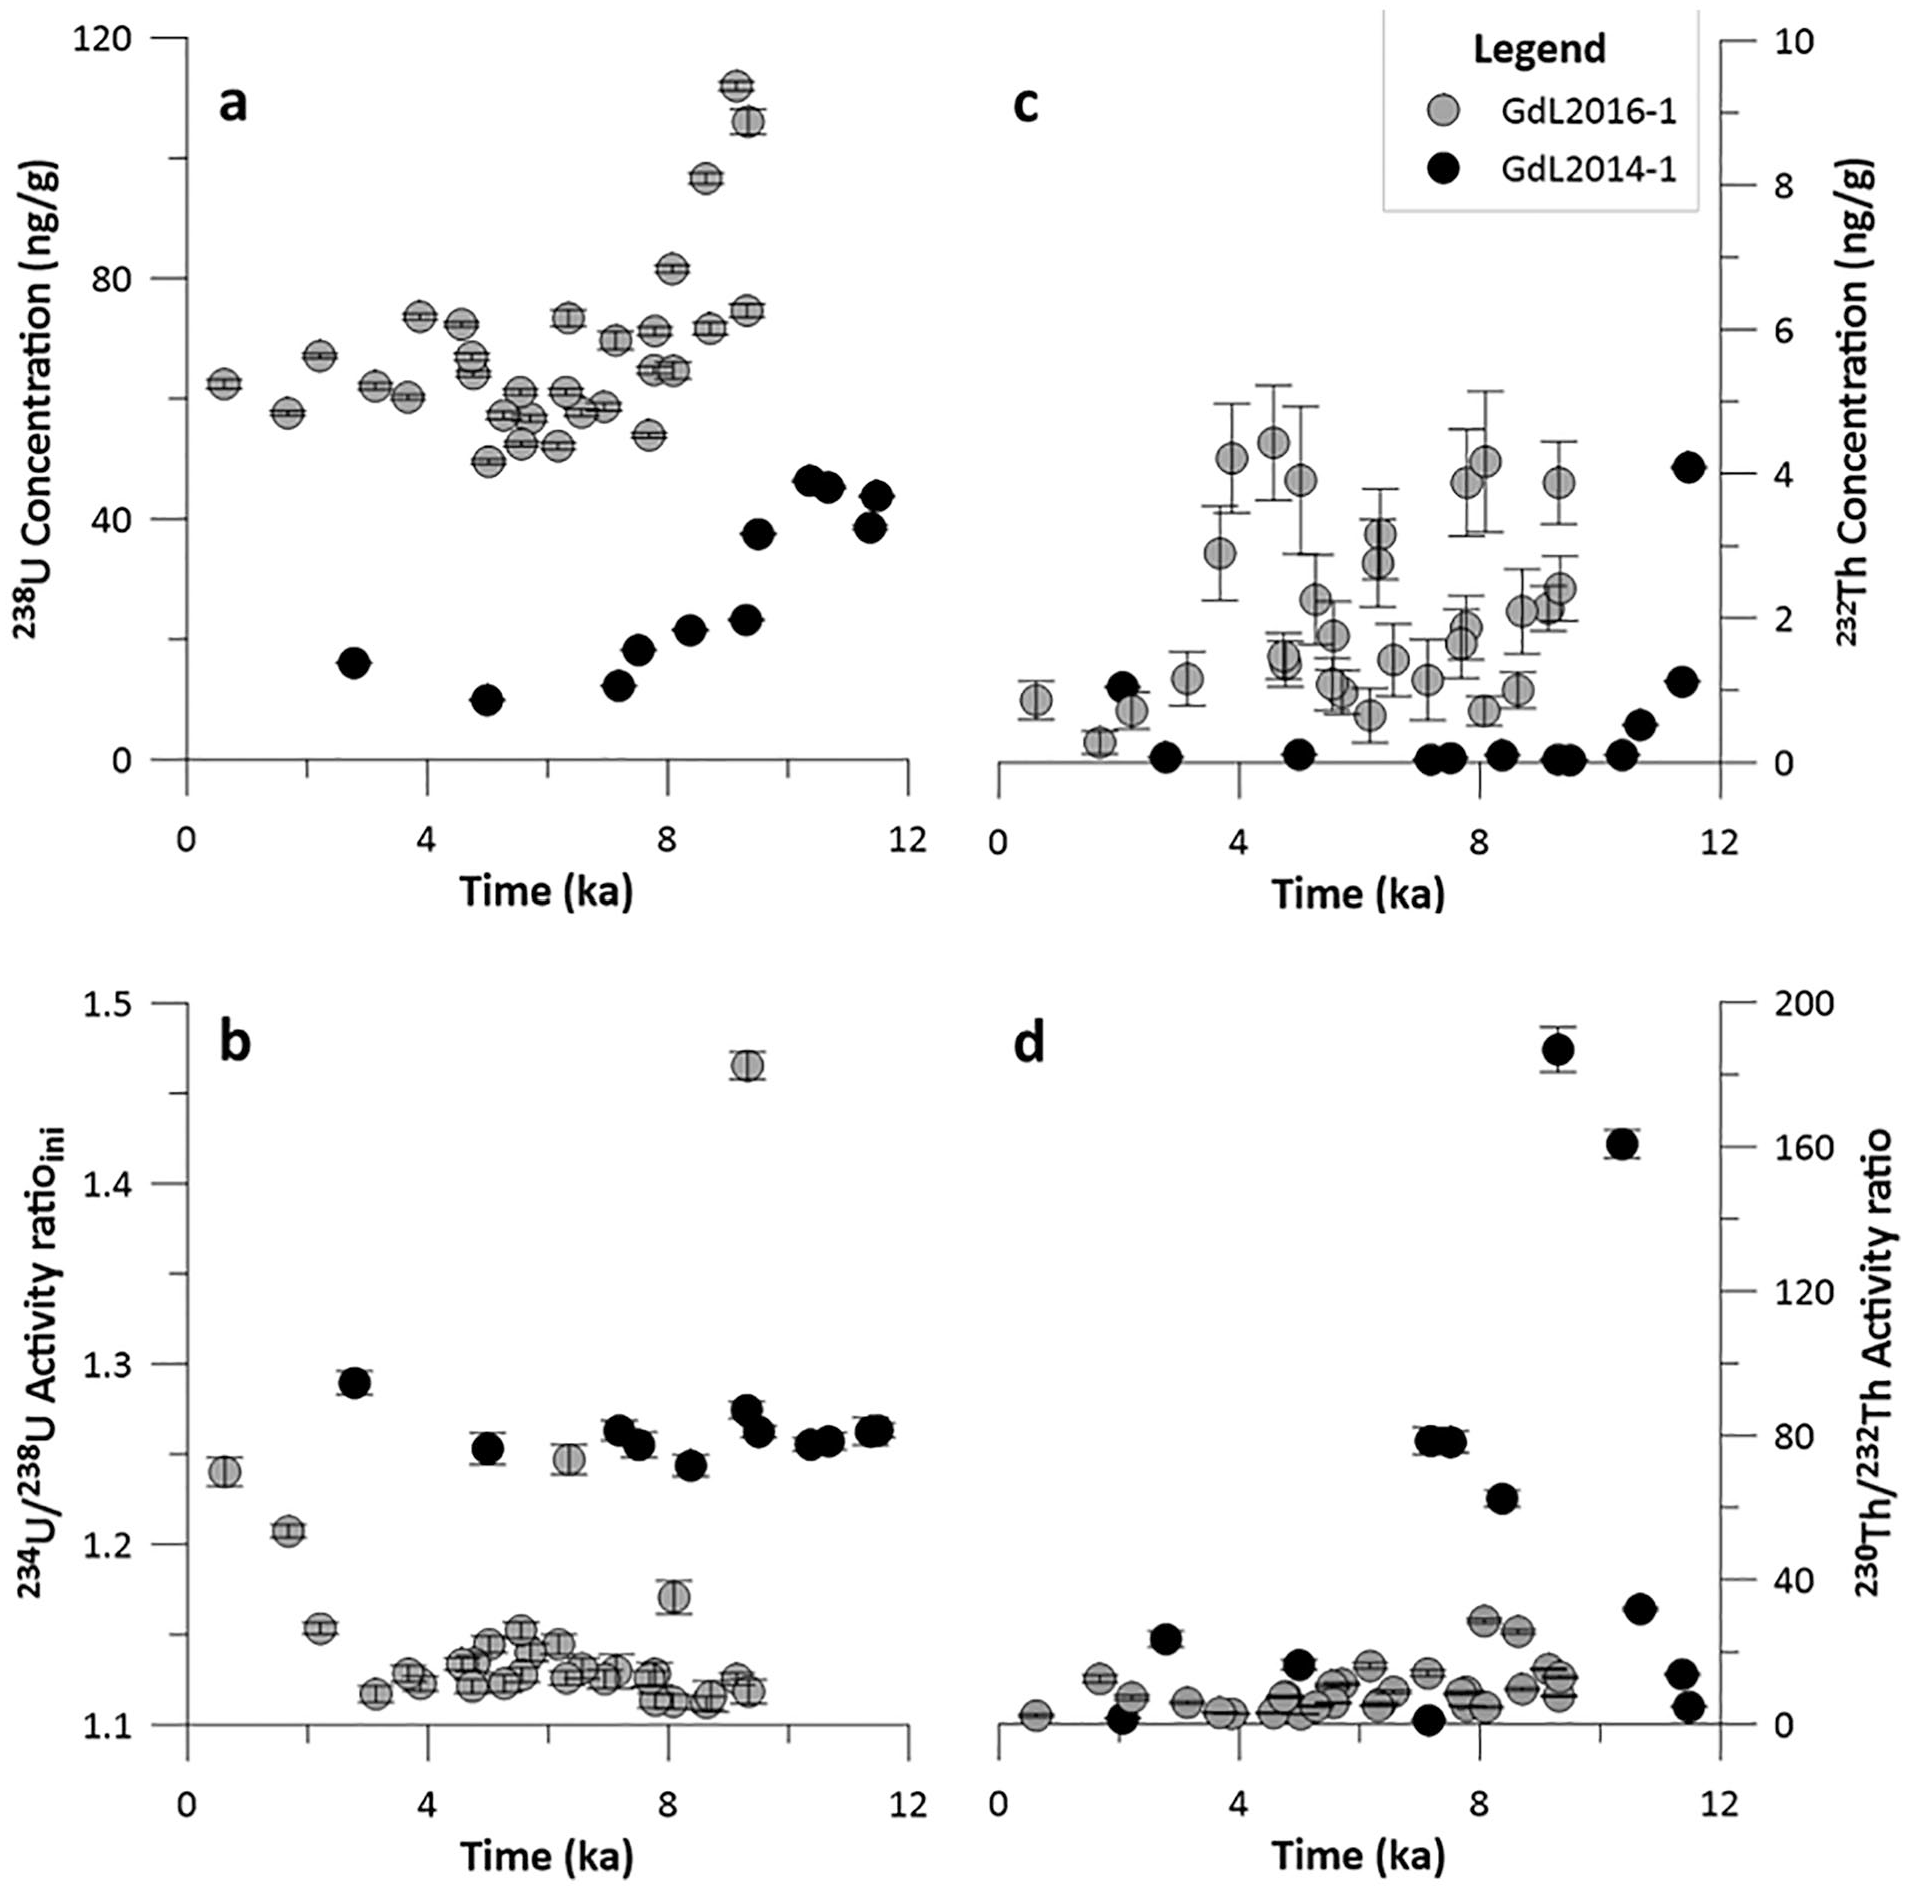
U and Th isotope measurement results for GdL2014-1 and GdL2016-1. (a) U concentrations for stalagmites GdL2014-1 (black) and GdL2016-1 (grey) plotted against time. Error bars signify 2σ uncertainty. (b) Initial U/U activity ratios for stalagmites GdL2014-1 (black) and GdL2016-1 (grey) plotted against time. Error bars signify 2σ uncertainty. (c) Th concentrations for stalagmites GdL2014-1 (black) and GdL2016-1 (grey) plotted against time. Error bars signify 2σ uncertainty. (d) Th/Th activity ratios for stalagmites GdL2014-1 (black) and GdL2016-1 (grey) plotted against time. Error bars signify 2σ uncertainty.
For most GdL2014-1 samples, the 230Th/232Th activity ratios are above 20 which, for a Holocene specimen, indicates a small or negligible detrital fraction. Only the section affected by the red layer has very low 230Th/232Th activities with values of 4.8 and 1.1. Here, a detrital correction is significant, sample UEVA 1059 is dominated by detritus making the U-Th result inconclusive (Supplemental Table S2). Due to the young age and low U concentration, the U-Th age of the top sample (UEVA 1779) is also significantly affected by a detrital correction resulting in a large uncertainty for the top age. Corrected U-Th ages of GdL2014-1 are all in stratigraphic order (Figure 2).
230Th/232Th activity ratios of GdL2016-1 are overall lower and quite variable with values between 0.8 and 29. Thus, U-Th dating of this specimen is generally more affected by detrital correction. Samples UEVA 1084, 1087 and 1073 are dominated by detritus and the dating results are not diagnostic (Supplemental Table S2). The so-called 'bulk earth' detrital factor based on the average U and Th composition of the upper crust (Hans Wedepohl, 1995) is used for detrital correction. The corrected U-Th ages, especially for sample UEVA 1073, fall in stratigraphic order, except for sample UEVA 1085 (Figure 2), which is suggested as a criterion for accurate detrital correction (Hellstrom, 2006). However, a conservative uncertainty of the correction factor of 50% increases U-Th dating uncertainties leading to age model uncertainties of several hundred years. For more details regarding analytical U-series results for both specimens, please refer to Supplemental Table S2.
Stable isotopes
In order to facilitate adequate interpretation of our data with other records, the δ18O data were corrected for the global ice volume effect following Bintanja et al. (2005) (Supplemental Figure S2). For GdL2014-1 the δ13C values range from −10.46‰ to −8‰, with a mean value of −9.47‰ (Figure 6). Positive excursions are observed at 5.26, 10.25, 10.77 and 11.29 ka respectively. δ18O values range from −4.2‰ to −3.22‰, with a mean value of −3.76‰. Amplitudes of both, δ13C and δ18O were generally higher between 11.7 and 9.5 ka. ‘Stepped’ increases, followed by large negative excursions are observed during the initial growth phase until ~9.5 ka, which is somewhat mirrored in the δ13C values.
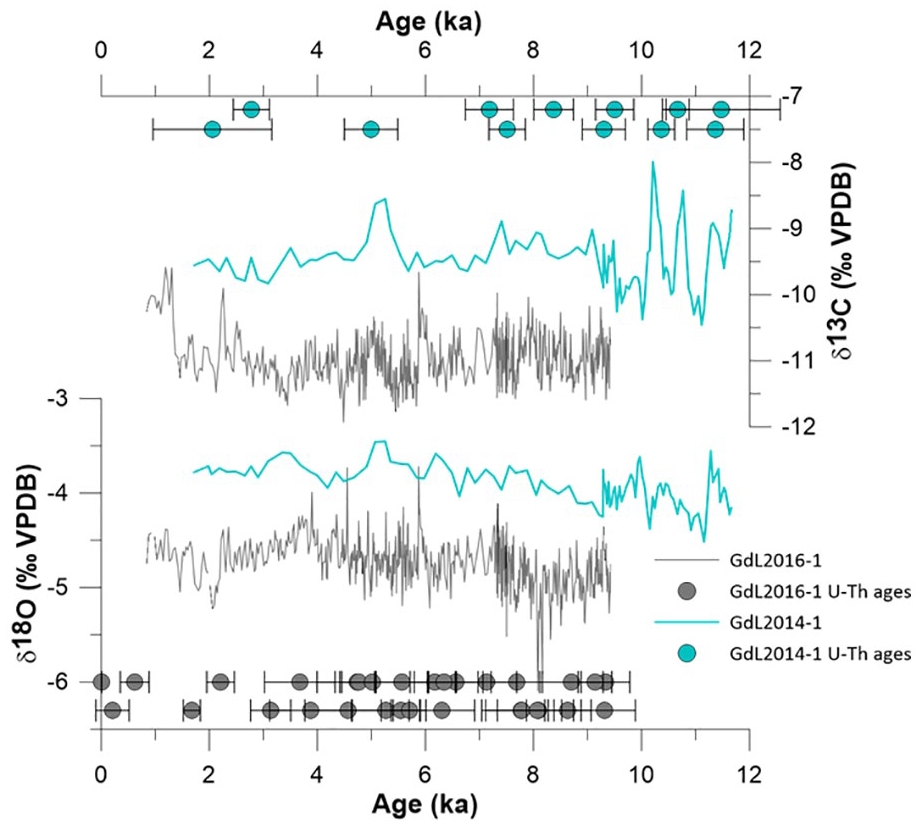
Stable isotope values for both GdL2014-1 (blue line) and GdL2016-1 (black line) graphed against time. U-Th dates (blue diamonds for GdL2014-1 above and black circles for GdL2016-1 below) are shown with 2σ error. d18O values have been corrected for the ice volume effect as indicated by Bintanja et al. (2005).
For GdL2016-1 the δ13C values range from −11.93‰ to −9.6‰, with a mean value of −10.96‰ (Figure 6). δ18O values range from −5.98‰ to −3.66‰, with a mean value of −4.66‰. Notably, there is a large, negative double excursion between 8.06 and 8.16 ka, where δ18O values drop from −4.48‰ to −5.98‰. In order to replicate the values and structure of this excursion, this section was reanalysed to ensure robustness of the record. The duplicate measurements verified initial findings. Considering the timing between 8.06 and 8.16 ka, this drop in values corresponds with the 8.2 ka cold event (Alley et al., 1997; Bond et al., 2001; Born and Levermann, 2010; Daley et al., 2011; Domínguez-Villar et al., 2009; Thomas et al., 2007).
Discussion
Speleothem δ18O records
δ18O is an important palaeoclimate proxy, linking speleothem CaCO3 oxygen isotopes to rain water oxygen isotopes and thus potentially climate information. Of course, δ18O in the CaCO3 (precipitated from drip water in the cave), is not only dependent on the rain water signature, but is also affected by a range of effects including temperature, rain amount or disequilibrium fractionation (McDermott, 2004). Therefore, interpretation of speleothem δ18O requires knowledge about a series of controlling conditions inside and outside the cave. We derived two independent δ18O records from the two coeval GdL specimens. The two records overlap for a substantial period during the Holocene, but have different temporal resolution. GdL2016-1 has a growth rate around 100 µm/a, thus the sampling size here mixes several years. GdL2014-1 has an about ten times lower growth rate and the sampling size mixes decades. Based on the drip rate monitoring results we expect δ18O of GdL2014-1 to represent annual mean rain values while δ18O of GdL2016-1 is dominated by winter rain. We use modern precipitation data from Portuguese GNIP stations (Porto, Lisbon, Portalegre, and Penhas Douradas) to identify typical d18O values of winter months rainwater (December to March) and annual mean values for comparison with our proxy data for each record (Supplemental, Fig. S3). Overall, winter/early spring months exhibited higher precipitation rates and lower d18O values compared to annual mean values (Supplemental, Table S1). The offset typically ranges between 0.22‰ and 0.84‰ and indeed, we also find an offset of 0.87‰ between the two records.
The low temporal resolution of the GdL2014-1 δ18O record does not provide a detailed structure. In contrast, GdL2016-1 provides relatively high temporal resolution, albeit also sampled only at 1 mm spacing. The GdL2016-1 record exhibits several negative excursions, the most prominent at 8.15 ka which we assign to the 8.2 ka event, an abrupt cooling episode which brought very cold and dry conditions to the northern-hemisphere, especially in the winter time (Alley and Ágústsdóttir, 2005; Daley et al., 2011; Thomas et al., 2007). The 8.2 ka event was caused by a freshwater influx pulse into the North Atlantic which weakened the meridian overturning circulation (AMOC). In turn, this reduced northward heat transport, subsequently cooling the North Atlantic region (Born and Levermann, 2010; LeGrande and Schmidt, 2008; Renssen et al., 2002). We can identify a response of δ18O in GdL2016-1 to the 8.2 ka event including the typical double trough. During the 8.2 ka event the GdL2016-1 δ18O values drop by 1‰, exhibiting the lowest values observed in the entire record (Figure 6). We cannot identify the 8.2 ka event in the GdL2014 δ18O record, which is best explained by the low temporal resolution of this record.
Recently, the 4.2 ka event (Arz et al., 2006; Geirsdóttir et al., 2019; Isola et al., 2019) has been assigned as a global marker for the subdivision of the Holocene by the International Subcommission on Quaternary Stratigraphy (Walker et al., 2018). The 4.2 ka aridification event marks the beginning of the Meghalayan stage. We thus tried to identify a response of δ18O in our record to this event. There is a slight trough centred around 4.2 ka, but it does not stand out as a significant peak. So despite being a global marker, there is only a weak potential 4.2 ka signal in the GdL2016-1 δ18O record. There is also no detectable significant hiatus at 4.2 ka visible in the growth rate and thus no indication of a severe aridification event in western Iberia. However, following 4.2 ka (from about 4 ka) the growth rate of GdL2016-1 becomes relatively low and is steadily decreasing, which could indicate overall dryer winter conditions for the Meghalayan period.
In Figure 7 we compare our record with other Iberian δ18O speleothem records from the Atlantic influenced realm from La Garma (Baldini et al., 2019), Kaite (Domínguez-Villar et al., 2017) and Cueva de Asiul (Smith et al., 2016). We also briefly compare to a record from north Africa in the western Mediterranean realm (Ait Brahim et al., 2019). Due to age model uncertainties of the GdL2016-1 record we do not provide a detailed comparison or interpretation of centennial scale variations. Overall, the GdL2016-1 δ18O record is broadly similar to GAR-01 (Baldini et al., 2019) for early and mid Holocene. The mean δ18O values are around – 4.5‰ for both stalagmites and they display a similar structure between 9.5 and 4 ka. This represents over 80% of the GdL 2016-1 record. We note an opposite trend for the remaining record, covering the late Holocene between 4 ka and present. The structure of the δ18O record from Kaite cave (Domínguez-Villar et al., 2017) is also quite similar to GdL2016-1, albeit about 2‰ lighter. The most striking similarity of the records shown in Figure 7 is that the 8.2 ka excursion is present in all records except for Cueva de Asiul, which has a hiatus around this time. We note that the timing of 8.15 ka found for the 8.2 ka event in our record demonstrates accuracy of the U-Th dates and derived age model despite detrital correction.
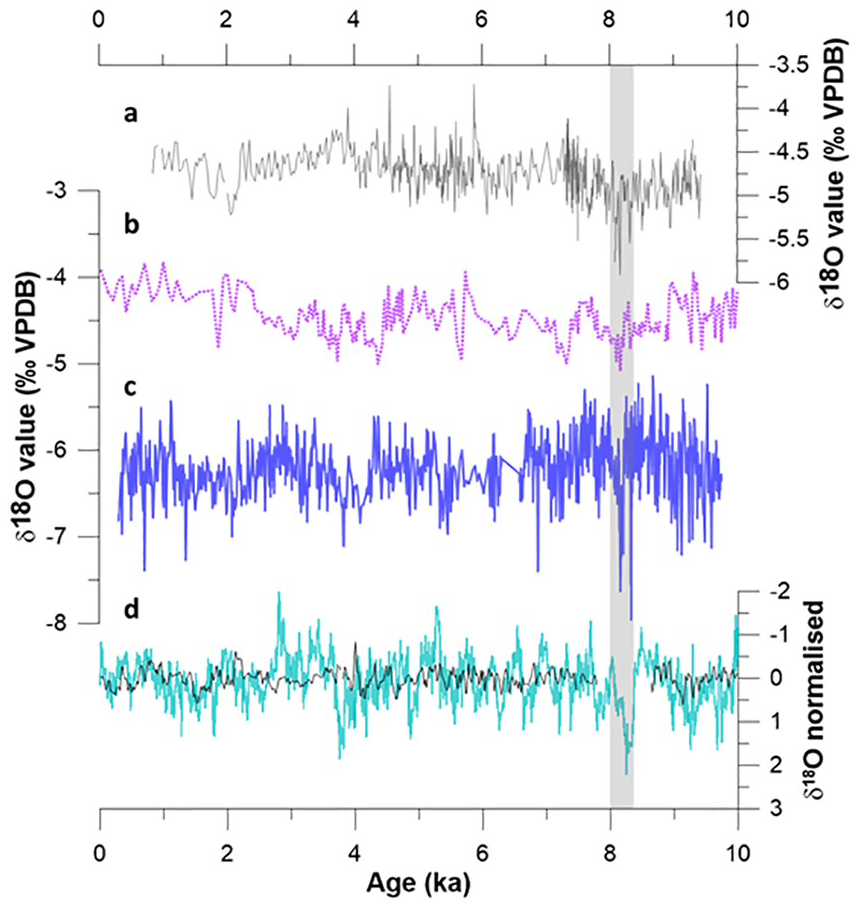
Comparison of d18O records. Stable isotope values for GdL2016-1 (line a), La Garma (line b) (Baldini et al., 2019), Kaite Cave (line c) (Domínguez-Villar et al., 2017). Detrended and normalised d18O record derived from three speleothem d18O records (Cha1, Cha2 and GP2) from northern Morocco (Ait Brahim et al., 2019) (turquois line, d). Combined and detrended speleothem d18O data for ASM and ASR from Cueva de Asiul (Smith et al., 2016) (black line, d). Grey shading indicates the coincidence of the 8.2 ka event.
Baldini et al. (2019) suggest temperature and rain amount to be main drivers for δ18O variability in the GAR-01 record, while Domínguez-Villar et al. (2009) suggest based on the δ18O record of stalagmite LV5 from Kaite cave that δ18O in Iberian speleothems traces changes of ocean surface water isotope composition. Additionally, using δ18O records of four stalagmites from Kaite cave, Domínguez-Villar et al. (2017) hypothesised that the Holocene δ18O record from Kaite Cave (Figure 7) is controlled on a millennial scale by a variable proportion of recycled precipitation in the total rain amount and suggest that the millennial δ18O anomalies can be explained by a zonal displacement of atmospheric pressure fields over the North Atlantic. The δ18O records from Cueva de Asiul (Smith et al., 2016) and north Africa (Ait Brahim et al., 2019) are detrended and normalised (Figure 7). The two records are both interpreted to be proxies for Atlantic driven precipitation changes, albeit with opposing conclusions. Smith et al. (2016) propose reduced moisture availability to coincide with North Atlantic cold periods as also suggested by Zielhofer et al. (2019) based on a north African lake record. In contrast, Ait Brahim et al. (2019) suggest humid conditions to be synchronous with Atlantic cold events during early and late Holocene. We now further investigate the timing of palaeoprecipitation in Iberia compared to Atlantic cold events using an alternative proxy.
GdL2016-1 growth rate as winter precipitation proxy
GdL2014-1 and GdL2016-1 formed more or less coevally only 20 m apart in the same section of the cave and shared almost identical conditions like cave temperature, cave PCO2, humidity and outside climatic conditions. However, a distinct difference between the two sampling positions is the response of the feeding drip rate to outside rain. GdL2014-1 was continuously fed by a slow and steady drip rate throughout a year. In contrast, GdL2016-1 was fed by a similarly slow drip rate in summer/autumn, but during winter/spring the drip rate is episodically significantly higher and has large peaks when outside rainfall amount is large (Figure 4). Thus, our cave monitoring shows a strong correlation between increased outside precipitation and high drip rates during late winter/early spring months for GdL2016-1, suggesting that growth of this specimen is due primarily to increased late winter precipitation.
This correlation is not observed for GdL2014-1, which is constantly fed by a steady drip throughout the year. GdL2016-1 is approximately eight times longer than GdL2014-1, and has an average growth rate of 96 mm/ka compared to an average of 14 mm/ka for GdL2014-1 for the period when both specimens formed. The difference in growth rate and size between the two specimens is best explained by the difference of the drip rate with seasonally high drip rate phases in late winter/spring for GdL2016-1. It suggests that the phases with high drip rate are the reason for the significantly higher growth rate for GdL2016-1. This means that GdL2016-1 growth was fed by a higher proportion of winter rain. This is supported by stable isotope values for the two specimens (Figure 6). An average of 0.87‰ offset is observed in the δ18O stable isotope values between the two records, with GdL2016-1 exhibiting the lighter values (Figure 6). GNIP data confirm a δ18O value offset in rainwater between annual mean and the winter/early spring months throughout Portugal. The average annual versus winter (December–April) offset from Portuguese GNIP stations ranges from 0.1‰ to 0.68‰, averaging 0.37‰. For Lisbon, the closest station near the coast, we find an offset of 0.46‰. The average δ18O difference of 0.87‰ between GdL2014-1 and GdL2016-1 is slightly larger than today’s difference of δ18O between annual and winter rain so there are additional local effects at play. For example, it has been shown that drip rates also influence stable isotopes in speleothem calcite (Mühlinghaus et al., 2009). The effect is strongest for δ13C and we find that the average offset in δ13C values between GdL2014-1 and GdL2016-1 is also quite large (1.17‰). The enrichment of δ13C in speleothem calcite values is dependant of the water residence time on the stalagmite surface and drip interval. Long drip intervals (i.e. d = ~2000 s) result in higher overall carbon isotope ratios, while shorter intervals (d = ~50 s) will result in lower ratios (Mühlinghaus et al., 2009). Indeed, we observe a considerable offset in the δ13C values in our records, with the higher values attributed to GdL2014-1 with long drip intervals. Other factors that could contribute to the δ13C difference between the two specimens include residence time of water in the host rock and potential prior calcite precipitation. Drip intervals potentially affect oxygen isotope ratios as well. However, for long and short drip intervals, d18O of drip water and the bicarbonate should be almost identical (Mühlinghaus et al., 2009). Thus, the influence of drip rate on the d18O in GdL2014-1 (long drip interval) and GdL2016-1 (short drip interval for main growth) is probably small. Additionally, we observe no obvious correlation between d18O and d13C, indicating that disequilibrium is not playing a dominant role here.
We argue that the high growth rate for GdL2016-1 is a result of high drip rate events during winter and the water source feeding the formation of GdL2016-1 was dominated by the winter-early spring precipitation, while GdL2014-1 formed constantly during summer and winter with no seasonal bias. Therefore, we suggest to largely assign the observed offset of δ18O to different feeding water compositions, dominated by winter rain signature for GdL2016-1 and mean annual rain signature for GdL2014-1. The variation of the growth rate of GdL2016-1 is suggested to be a proxy for winter rain amounts for this particular specimen.
The interpretation that GdL2016-1 largely formed and was dominated by fast water transfer through the epikarst as evidence for high winter rain drip rate events is supported by significant differences in U and (common) Th concentrations between the two specimens (Figure 5). Th is not soluble in natural waters which is a precondition for U-Th dating of speleothems. However, Th can be present in particles or colloids which can be transported by groundwater through larger fissures. This is the main reason for potential transport of Th in groundwaters and subsequent inclusion in speleothem CaCO3. Typically water flow through epikarst bedrock filters particles or colloids from water entering caves. However, flow through larger fissures, as typical for the 'overflow' scenario inferred for GdL2016-1, might allow a larger fraction of particles and/or colloids to be transported resulting in detectable amounts of common Th in speleothems. The colloids would also be an additional effective transport for U. Indeed, U and Th concentrations are higher in GdL2016-1 (Figure 5). Particularly the high 232Th contents point towards colloids and/or particles transported by drip waters, indicating that the high drip rates of late winter/early spring are fed via a different water pathway. The difference in water feeding mechanism between GdL2016-1 and GdL2014-1 is further supported by significantly lower initial 234U/238U activity ratio in GdL2016-1. The colloidal/particle transported fraction of U has a different isotopic signature than the water soluble fraction as shown by the different 234U/238U activity ratios in GdL2016-1 compared to GdL2014-1.
Atlantic cold phases and winter precipitation
Here we have presented evidence that the growth rate of one of our two stalagmites, GdL2016-1, is dominated by the amount of winter precipitation. The growth rate of GdL2016-1 is about eight times higher than for GdL2014-1 and indicates that the amount of winter rain and hence winter drip rate has a direct influence on the growth of GdL2016-1. The variable growth rate of GdL2016-1 throughout the Holocene is therefore suggested to be a proxy for winter rain amount. It is important to point out that we do not suggest stalagmite growth rate to be a general rain amount proxy, as evident by our two different records from the same cave.
Based on GdL2016-1 growth rates we find a humid phase starting around 9.5 ka, when GdL2016-1 formation initiated (Figure 8), lasting until about 7.2 ka. Two significant growth rate peaks are found centred at 9.2 and 7.5 ka. A small peak is also visible around 8.5 ka. This suggests wet winters in western Iberia from 9.5 until about 7.2 ka, with highest growth rates at beginning and end of this period. This is followed by a period with dryer winters indicated by a significantly smaller growth rate after 7.2 until 6.8 ka. From 6.8 until 5.8 ka the growth rate is steadily increasing again with small peaks superimposed on the long-term trend, followed by a high growth rate and thus a wet winter phase between 5.8 and 4.5 ka. From about 4 ka until present, the growth rate is decreasing, indicating overall dryer conditions for the last 4 ka. The wettest phases in western Iberia fall into the period of the early and mid Holocene with higher (lower) summer (winter) solar insolation due to precession (Figure 8), which also resulted in the ‘Green Sahara’ scenario between 9 and 5 ka (Kuper and Kropelin, 2006). Higher summer insolation in the early to mid Holocene (Figure 8) would potentially have raised sea surface temperatures in autumn and early winter. This in turn could lead to enhanced evaporation and thus possibly caused an increase in rainfall during early winter.
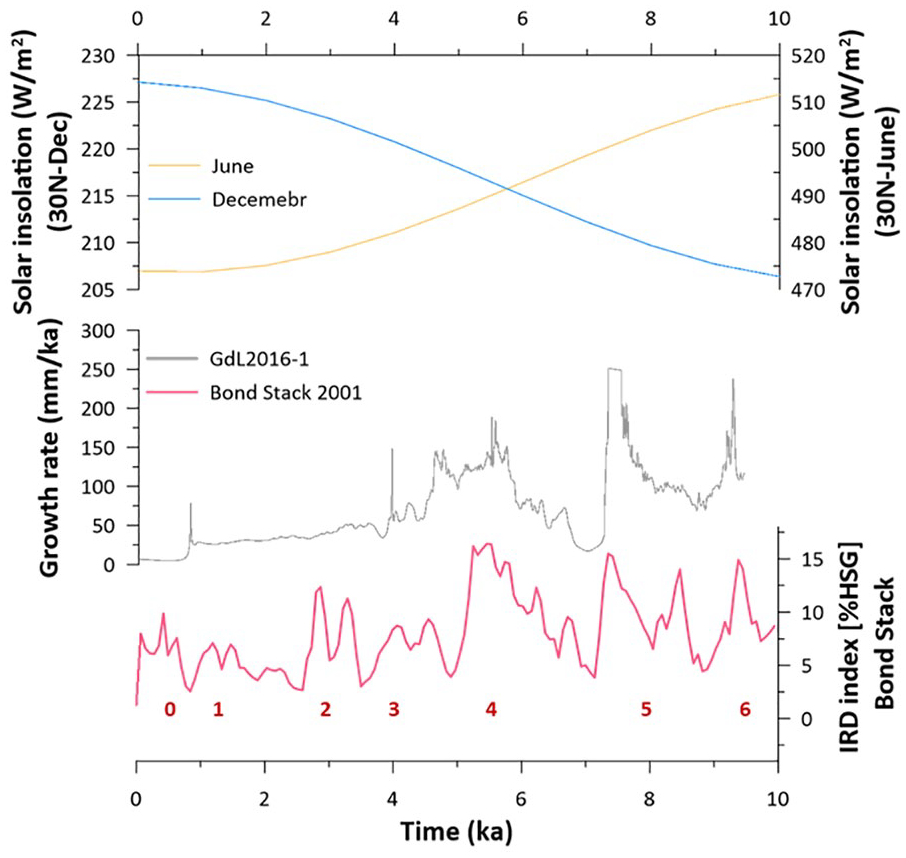
From top to bottom: Insolation at 30°N for winter (light blue dashed line) and summer (yellow line) as presented by Berger and Loutre (1991). Growth rates for GdL2016-1 (grey line), plotted against time of growth. The data has been calculated using model age estimates every mm along the stalagmite axes. The growth rate record is plotted with the Bond stack (% Icelandic Glass, or HSG) (Bond et al., 2001) (red line), where wet/cold phases are represented by large peaks and corresponding event number (in red) and warmer phases by troughs (Bond et al., 2001). Between 9.7 and 4 ka HSG peaks coincide with increased growth rates of GdL2016-1.
Bond et al. (1992) identified frequent IRD deposition peaks in north Atlantic sediment cores during the Holocene. These so-called Bond events are interpreted as drift ice cycles and hence centennial scale north Atlantic cooling phases. The north Atlantic cooling is possibly related to a weakening of the thermo-haline circulation, albeit the exact forcing mechanism of the IRD peaks is not clear. Figure 8 illustrates a correspondence of the growth rate of GdL2016-1 with Bond events. We find a correlation of Bond peaks with high speleothem growth of GdL2016-1 in the early and mid Holocene until ~4 ka. The correlation of Atlantic drift ice cycles 3, 4, 5 and 6 with increased growth of the winter-precipitation dominated stalagmite GdL2016-1 suggests that between 9.7 and 4 ka Atlantic IRD events are accompanied by increased winter rainfall in western Iberia. From 4 ka to present, the growth rate of GdL2016-1 steadily decreases and there are no significant rain intensity peaks in this period. Thus we do not find corresponding peaks for drift ice cycles 0 and 1 and 2 (Bond et al., 2001). Wetter conditions in Iberia during high IRD transport in the Atlantic is also supported by a Holocene lake sediment record from the Pyrenees (Pèlachs et al., 2011) based on a LOI (loss on ignition) record. Pollen percentages in the same lake record also suggest dryer conditions during low IRD phases in the Atlantic. Another lake record from north-western Iberia confirms an abrupt increase in moisture between 10 and 9 ka (Morellón et al., 2018) as suggested by the GdL2016-1 stalagmite record.
A stalagmite from Refugio Cave (REF-07) in southern Iberia was used to derive a CT scan based stalagmite density record which is also interpreted to be a proxy for past hydrology changes (Walczak et al., 2015). Figure 9 shows the CT numbers record compared to GdL2016-1 growth rate record. A high CT number is suggested to indicate higher humidity. It is striking that the growth of REF-07 coincides with the wet phase early to mid Holocene found by the GdL2016-1 record. The beginning of the dry period at 7.2 ka in GdL2016-1 is marked by the start of a hiatus in REF-07. REF-07 continued to form with the beginning of the second high growth rate phase in GdL2016-1 record at around 6.5 ka. Note that the exact timing of phases and events in both stalagmites is associated with rather large uncertainties. The GdL2016-1 U-Th dates are affected by detrital corrections, although timing of the 8.2 ka event and stratigraphically consistent ages demonstrate accuracy of the age model. The REF-07 stalagmite was largely kept intact for the study by Walczak et al. (2015) and not cut open in two halves. This approach is less destructive, but a sub-sampling strategy to extract samples for chronological control was needed nevertheless. Hence, sub sampling for U-Th dating of REF-07 was done by drilling horizontally/sideways into the specimen and assignment of sampling positions is based on a prior CT scan. The assignment of precise and accurate distances to U-Th dates and proxy data derived from a stalagmite is even challenging when sub sampling was performed on a polished surface of a stalagmite cut in two halves along the growth axis. More so the distance age model of REF-07 and its assignment to the CT scan is potentially affected by imprecise assignment of U-Th sample positions. Additionally, the horizontal drilling approach is prone to ‘contamination’ of the final sample powder with material from the (younger) flanks.
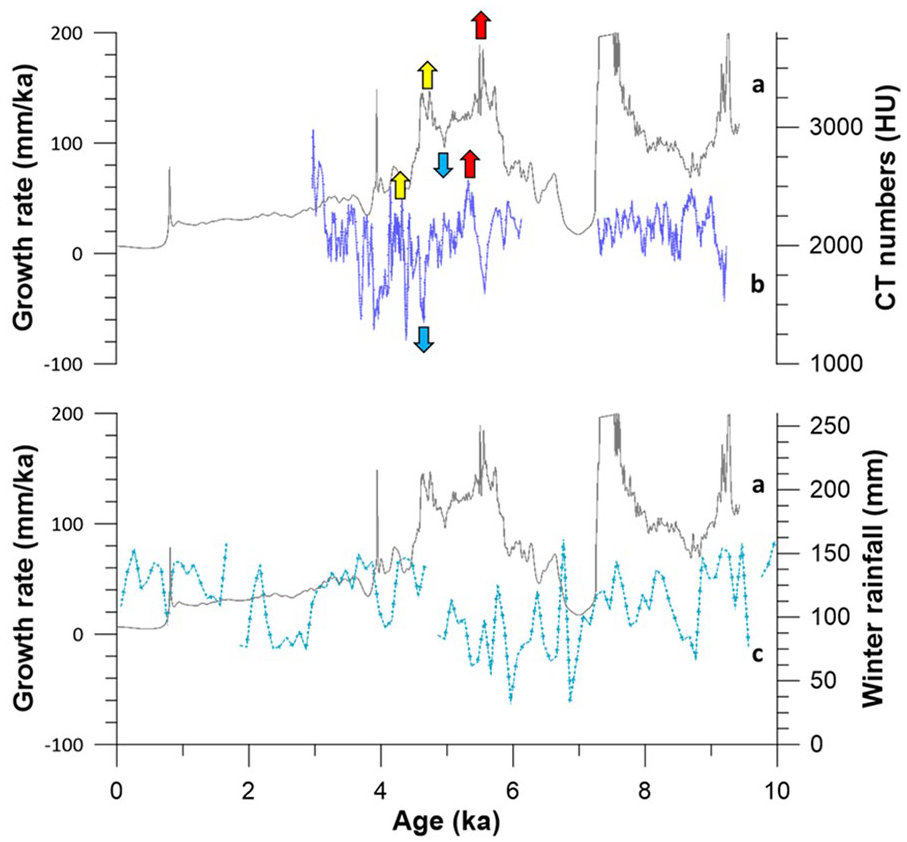
From top to bottom: Growth rate record for GdL2016-1 (line a), plotted against time of growth. The data has been calculated using model age estimates every mm along the stalagmite axes. El Refugio Cave CT scan data (line b) (Walczak et al., 2015) plotted against time. Colored arrows indicate corresponding peaks/trough between the GdL growth rates and El Refugio Cave CT scan data. La Garma modelled winter precipitation data (Baldini et al., 2019) (line c) also plotted with GdL2016-1 growth rate (line a).
Between 9.5 and 7.2 ka the structure of the CT numbers indicates dominantly wet conditions (Walczak et al., 2015), in agreement with the GdL2016-1 growth rate record. Both records start with increasing precipitation and a double peak, albeit with slightly different timing which can be explained by the limitations of the associated speleothem chronologies. Both records have a trough around 8.8 ka (GdL2016-1) or 8.4 ka (REF-07) and higher precipitation thereafter. While CT numbers stay relatively constant between 8.3 and 7.2 ka, the GdL2016-1 growth rate indicates a steadily increasing winter rain intensity towards the peak around 7.5 ka (Figure 9). This could indicate that summer rain intensity also contributes to the REF-07 precipitation record. Between 6.2 and 3 ka the REF-07 CT numbers are more variable and alternating between wet and dry conditions (Walczak et al., 2015). During this mid Holocene phase the peak structure of the REF-07 CT numbers record closely matches the winter rain intensity variation record of GdL2016-1, albeit with a difference in absolute timing of peaks between the two records, with the REF-07 record being younger by about 400 years. This can be explained by younger material mixed into the U-Th dating samples due to the sampling strategy, but there is no d18O record for REF-07 that could be used to further compare timing of excursions like the 8.2 ka to check the chronology as is the case for GdL2016-1 where the timing of the 8.2 ka event confirms accuracy of the detrital corrected chronology. However, we note that the 400 years offset between 6.2 and 3vka is mostly within uncertainty of the GdL2016-1 age model, which is in the range of 300 a between 6.2 and 4.5 ka and increases to more than 400 a between 4.3 and 3.2 ka, a section where the growth rate of the stalagmite significantly changed.
Another stalagmite-based Holocene precipitation record for Iberia has been derived from the GAR-01 d18O record (Baldini et al., 2019). The underlying assumption here is that seasonality changes in rainfall and temperature are the main driver for d18O values in the La Garma speleothem. A conceptual model was used to derive seasonal rainfall distributions between winter and summer rain from the measured d18O record of GAR-01 (Baldini et al., 2019). For this, an independent temperature record was used as one constraint and the total annual rain amount was held constant throughout the Holocene. The model provides winter and summer rain fractions of the total rain amount and we compare our record to the winter rain intensity results for GAR-01. The GAR-01 chronology is robust and can serve as a reference for the other speleothem based records in the region where chronology is compromised by a detrital correction or the sampling procedure.
The GdL 2016-1 and GAR-01 records are shown in Figure 9. The GAR-01 winter rainfall record extends back to the Younger Dryas and covers the complete Holocene, so it also covers the time before the GdL2016-1 record starts. The peak at the beginning of the GdL2016-1 record is also present in GAR-01, as well as a trough around 8.8 ka. The following two peaks in GAR-01 at 8.2 and 7.6 ka are similarly present in GdL2016-1, albeit the relative height of the peaks (and hence the underlying trend) is different, in particular around 7.6 ka. This can be explained by the model constraints for the GAR-01 record, limiting the peaks to a fixed and constant total annual rain amount. GdL2016-1 indicates a dry period between 7.2 and 6.8 ka. A comparison with GAR-01 suggests that this period is more likely a shorter dry phase as found by a trough at 7.9 ka in GAR-01. The winter rain peaks in GAR-01 following the 7.9 ka trough until about 5 ka are also closely matched in GdL2016-1, again with different relative height und underlying trend. The correlation between the GAR-01and GdL2016-1 breaks down for the late Holocene from about 4 ka. This is the top section of the GdL 2016-1 stalagmite where growth substantially slowed down and the correlation with IRD also breaks down.
Other speleothem δ18O records from Spain and Morocco have also been employed previously to investigate past precipitation amounts. For example, Ait Brahim et al. (2019) analysed a stalagmite from Morocco and suggest that the δ18O record is dominated by the amount effect. They suggest that during the early and late Holocene Bond events are associated with a negative NAO resulting in wetter conditions in the western Mediterranean realm as found by our precipitation record for western Iberia. In contrast, Smith et al. (2016) suggest that dry conditions prevailed in northern Spain during North Atlantic cold events based on the δ18O record of a stalagmite from northern Spain and suggest that a positive NAO is associated dry conditions in southern Europe during Holocene cold phases in the North Atlantic, which is not supported by our record. A Holocene sediment record from southern Iberia (Ramos-Román et al., 2018) indicates a wet phase between 9.5 and 7.6 ka, in agreement with our record, but also suggests another wet phase between 7 and 5 ka which includes a dry phase in our record. This shows that past precipitation patterns are potentially depending on a variety of boundary conditions like the type of proxy archive and which season is recorded or the location of the archive. Galeria das Lâminas is located just within climate zone Csb (AEMET, 2011), more or less at the boundary between two different climate zones Csa and Csb. La Garma is located in zone Cfb, whereas Refugio is located in zone Csa. A southward/more inland displacement of zone Csb would bring more precipitation to GdL, in turn a northward displacement of the boundary would lead to dryer Csa conditions at the location of GdL. The impact of zonal displacement is strongest at the boundary between zones as is the case for GdL.
Conclusions
We present a Holocene growth rate-based precipitation reconstruction for western Iberia. Palaeoprecipitation patterns for the Iberian Peninsula are important for understanding the climate system of the western Iberian – North Atlantic realm. The Holocene precipitation proxy archives analysed so far provide a diverse and in parts contrasting picture pointing to potential differences between archives, proxies and/or regions. For example, it is important to constrain whether a proxy records precipitation of a specific season or annual mean values and whether local factors might play a role.
The growth rate of a stalagmite as a proxy for precipitation amount, used in this study for GdL2016-1, can only be applied under very specific circumstances. Here, two coeval stalagmites from the same cave chamber together with cave monitoring results could be used to show that the formation of one of the specimen is fed by a larger proportion of late winter precipitation amounts and hence the growth rate could be used to assess past precipitation intensity for the (late) winter season. Our data support increased winter precipitation during cold Bond phases which would indicate a more negative NAO prevailed in early and mid-Holocene winter if a connection between NAO and precipitation intensity in the western Iberian realm was accepted for the early and mid Holocene. Lake sediment data from Iberian sites (Morellón et al., 2018; Pèlachs et al., 2011) support our findings. Our results are complemented by another speleothem-based precipitation record for southern Iberia (Walczak et al., 2015). Here, the CT scan density of a stalagmite was used to infer precipitation amounts. The stalagmite (REF-07) formed exactly during periods when our record shows overall increased precipitation and a hiatus started synchronous to a dry phase recorded in GdL2016-1. Between 6.2 and 4 ka the two independent records show an almost identical structure, albeit the timing of the precipitation peaks does not perfectly align which can be explained by a potential sampling bias for the REF-07 chronology. The coherence of the records for the mid Holocene indicates that southern Iberia experienced wetter conditions when winter rain intensity in western Iberia was higher.
Baldini et al. (2019) used the d18O record of a northern Iberian stalagmite (GAR-01) to model the distribution between summer and winter rain intensity. The reconstructed winter rain intensity shows similar intensity peaks as found in GdL2016-1, albeit the relative peak heights do not match which could be related to the locations of GdL and GAR in different climate zones (AEMET, 2011). The differences in peak heights could also be a result of a model constraint that keeps the total annual precipitation constant during the Holocene. The model 'only' determines how the total annual rain was distributed between summer and winter, limiting (or exaggerating) peak heights to a fraction of today’s precipitation amounts. At a first glance the d18O record of GdL2016-1 does not indicate a correlation with the growth rate, used to constrain winter rain intensity variability. However, the GdL 2016-1 d18O record is similar to GAR-01 between 10 and 4 ka, which in turn was used to model winter rain intensity. The model results are similar to the growth rate-based winter rain variability, which supports the assumption that the d18O record is mainly influenced by temperature and rain amount (Baldini et al., 2019).
Supplemental Material
sj-pdf-1-hol-10.1177_09596836211011666 – Supplemental material for A speleothem record from Portugal reveals phases of increased winter precipitation in western Iberia during the Holocene
Supplemental material, sj-pdf-1-hol-10.1177_09596836211011666 for A speleothem record from Portugal reveals phases of increased winter precipitation in western Iberia during the Holocene by Alexa Benson, Dirk L Hoffmann, Joan Daura, Montserrat Sanz, Filipa Rodrigues, Pedro Souto and João Zilhão in The Holocene
Footnotes
Acknowledgements
We thank the Max-Plank-Gesellschaft for funding this field work and research. J. Daura and M. Sanz were supported by Ramon y Cajal (RYC-2015-17667) and Juan de la Cierva (IJCI-2017-33908) postdoctoral grants, respectively. We graciously thank Birke Brumme for her assistance (and company) with U-Th sample processing and preparation in the clean lab. We would also like to graciously thank the two anonymous reviewers and journal editor, Dr. Atle Nesje, for comments that significantly improved our paper.
Author contributions
Sample collection was done by all authors; cave monitoring was done by all authors; U-series was carried out by A.B. and D.L.H.; stable isotope analysis was done by A.B. Site mapping and on-site maintenance was done by F.R., P.S. and J.Z. A.B and D.L.H. wrote the paper with contributions from all authors.
Funding
The author(s) received no financial support for the research, authorship and/or publication of this article.
Supplemental material
Supplemental material for this article is available online.
References
Supplementary Material
Please find the following supplemental material available below.
For Open Access articles published under a Creative Commons License, all supplemental material carries the same license as the article it is associated with.
For non-Open Access articles published, all supplemental material carries a non-exclusive license, and permission requests for re-use of supplemental material or any part of supplemental material shall be sent directly to the copyright owner as specified in the copyright notice associated with the article.