
Abstract
Gender difference graphs and tables typically present data representing males first, ahead of data representing females. The Publication Manual of the American Psychological Association in 2010 advised authors against this “bias” when reporting gender differences. An experiment examined how this preference is related to embodied cognition, and two content analytic studies examined its persistence despite the American Psychological Association's (APA) advice against it. In Study 1, 256 students drew bar graphs of gender differences and power differences. Participants spontaneously arrayed men first and higher power groups first most often, even when graph axes were placed to cue the opposite order. These results suggest that males-first order preferences follow from embodied biases to position agentic groups left and higher up in graphs and tables. Two content analyses systematically sampled psychology articles in four journals over a decade (Study 2) or 70 journals in a recent year (Study 3) to examine the impact of the APA manual’s advice on authors. The males-first preference remains prevalent in psychology publications, has reversed in Psychology of Women Quarterly (Study 2), and became polarized by author gender in social psychology (Study 3). These findings suggest that embodied cognition affects the visual representation of gender differences in psychology and is variably moderated by recent injunctions.
Graphs and tables are a familiar sight in psychological science publications on gender differences. These visuospatial displays use extensions in the vertical and horizontal direction as metaphors to represent variables other than spatial extension. Visuospatial displays can be constructed to represent the same data in multiple ways. They require some expertise to construct and interpret, which academic style guides often provide (see e.g., APA 2020, pp. 195–250). Some visuospatial conventions are arbitrary; physicists and chemists have opposing conventions for representing high temperature as high or low in the vertical axis of diagrams (Wolff-Roth, 2003), and time can proceed up or down in cladograms depicting evolutionary processes (Novick et al., 2012). Other aspects of graph comprehension have been described as “cognitively natural,” including the tendency to assume that bar graphs represent discrete variables whilst line graphs represent continuous variables (Zacks & Tversky, 1999). This research examines a convention for prioritizing male people in visuospatial displays of gender differences.
Visuospatial representations of data such as graphs and tables are created specifically to enable disembodied scientific thinking that is “off-line” and away from the real-world environments in which phenomena occur and data are collected (Latour, 1990). The experience of looking at a graph can seem akin to observing the very thing that the graph represents (Latour, 1990; see also Smith et al., 2002). Consequently, scientists’ published graphs can appear to present literal truths rather than human-made interpretations of material realities. Contemporary practices of graphing and tabulating gender difference data are also part of a larger history of “mechanical objectivity”; a project that began in 19th-century science to automate and mechanize the representation and visualization of nature by removing human interpretation. In their history of scientific objectivity, Datson and Galison (2007) argue that we live in a world in which the ideals of this project were never fully realized. This paper informs that claim by examining one way that androcentric subjectivity continues to affect the construction of graphs and tables representing psychological gender differences, despite the ongoing project to routinize how psychologists communicate about their data.
Specifically, we are concerned with the ways that gender groups are ordered to prioritize data representing males by literally positioning them first. Content analyses of both scientific articles in the field of psychology and psychology experiments have shown a preference to construct graphs and tables representing gender differences by positioning data representing males ahead of data representing females (Hegarty & Buechel, 2006; Hegarty et al., 2010). 1 The sixth edition of the Publication Manual of the American Psychological Association cited such research to warn authors that positioning dominant groups first in graphs and tables would problematically “imply that these groups are the universal standard” (APA, 2010, p. 73).
The aims of the current research in this context are (a) to clarify whether graphing conventions or embodied cognition is the more likely cause of the males-first order preference, and (b) to gauge whether, where, and among which authors the preference changed in the decade since the sixth edition of the APA manual warned authors against it. This first research aim is addressed by an experiment (Study 1), and the second is addressed by content analyses (Studies 2 and 3). There are many versions of the argument that cognition is “embodied,” but the radical claim that “off-line cognition is body based” is the one that is most relevant to the current research. As Wilson (2002, p. 626) puts it, this is the claim that cognition is embodied because “even when cognition is not about the immediate environment it remains affected by mechanisms of sensory processing and motor control that evolved for dealing with the environment”. In the present research, this very general claim is represented by the very specific hypothesis that gender stereotypes impact choices for how to visualize gender differences that emerge in psychological research. Evidence that such stereotyping continues to occur in research publications prompts consideration of the relationship between embodied cognition and feminist theories of science. By way of introduction to these three studies, we review past research on the males-first order preference, consider the case that it expresses embodied cognition, and argue for its relevance to feminist epistemology.
Prioritizing men in graphs and tables
The graph order preference was first observed in a content analysis of 282 articles in APA journals published between 1965 and 2004 (Hegarty & Buechel, 2006). These authors found that 74% of published visualizations arrayed data representing males first, whilst only 26% arrayed data representing females first. This preference did not vary by decade of publication, or by the gender of the article’s first author. However, the percentage of visualizations with males first varied somewhat between the four journals sampled, Psychology of Women Quarterly (62%), Journal of Personality and Social Psychology (64%), Journal of Abnormal Psychology (72%), and Developmental Psychology (87%). The authors attributed the preference to the androcentric conflation of men with the universal standard (cf. Bem, 1993). This order preference is not specific to APA journals. Rudin et al. (2009) reviewed 501 articles published between 1998 and 2008 in the Journal of the American Medical Association, and found that 70% of tables and 60% of graphs arrayed data representing males first.
Several psychology experiments have also confirmed that students in the UK and the US share implicit representations akin to “graph schemas” (Pinker, 1990), which default to positioning males first. When U.K. students drew graphs, both women and men showed the preference to position data representing males first (Hegarty et al., 2006, 2010, Study 1; see also additional replications reported in Hegarty & Lemieux, 2011). When U.S. students drew gender difference graphs from memory, they were 3 times as likely to misremember and switch order if they had been asked to recall a graph with data representing women ordered first than a graph with data representing men ordered first. People misremember graphs by mutating them towards canonical forms of those graphs (Tversky & Schiano, 1989). Positioning males first seems to be the canonical form for gender difference graphs.
Further experiments suggested that this preference does not originate in men’s typicality within androcentric categories, but in the shared belief that men are more powerful than women, which is true in patriarchal societies (Pratto, 1996). In Hegarty et al. (2010, Study 3), U.K. students graphed differences between pairs of social groups that they chose themselves, to represent how those groups varied on one of several semantic dimensions. These dimensions were all semantically related to widespread gender stereotypes and included the dimensions of marginality–typicality and weakness–power. Participants showed an overall preference to graph powerful groups ahead of weaker ones, but not to graph typical groups ahead of more marginal ones; the authors did not find any influence of any other semantic dimension on graph order preferences. This finding suggests that people prefer to graph males first because men are stereotyped as powerful, rather than because men are assumed to be prototypical. Indeed, when graphing differences between Queen Elizabeth II and less powerful male members of her household, U.K. participants overwhelmingly positioned the Queen first (Hegarty et al., 2010, Study 4). We next consider how such semantic beliefs about group power can impact visuospatial representations of scientific data.
The spatial agency bias
The gender difference graph order preference is usually attributed to a more general phenomenon called the spatial agency bias (SAB; e.g., Hegarty et al., 2010; Lamer et al., 2021; Suitner et al., 2017, p. 46) The SAB reflects the impact of both the writing direction and the grammatical word order of one’s given language on the imagination of actions in space (Maass & Russo, 2003; Maass, Suitner, & Nadhmi, 2014; for a review, see Suitner & Maass, 2016). Early findings of a SAB by French psychologist Jean-Pierre Deconchy, whilst teaching French to Arabic-speaking children in Lebanon, went overlooked for several decades (see Maass, Suitner, & Deconchy, 2014). More recently, some authors have shown that several psychological phenomena show an imprint of the direction in which language is written on basic perceptual, motor, and attentional phenomena. For example, whether your language is written left-to-right (as with French or English) or right-to-left (as with Arabic or Hebrew) impacts phenomena such as inhibition of return (Spalek & Hammad, 2005), the mental representation of numbers (Zebian, 2005) and time (Tversky et al., 1991), and the depiction of action (Chatterjee, 2001).
Such biases can also affect preferences for visualizing social groups in space. Maass et al. (2009) showed that preferences exist in Western art to depict Adam and Eve respectively on the left and right of representations of the Garden of Eden, and that study participants similarly constructed images with men first (i.e., left for Italian speakers and right for Arabic speakers in these studies). Spatial schemas also encode the implicit belief that groups with greater power should be depicted higher up in images (Lamer & Weisbuch, 2019; Paladino et al., 2017; Schubert, 2005). Yet, order in horizontal and vertical space differs because the relationship between verticality and power is scaffolded by metaphors in language (e.g., “being high up in an organization”), whilst the relationship between left–right and agency is not linguistically scaffolded in this way (for discussion, see Suitner & Maass, 2016).
As explanations of graph order preferences, phenomena such as the SAB suggest that graph cognition is not only a disemodied amodal process. It can also be an embodied one, grounded in acculturation among people learning to write a language in the horizontal axis whilst also acquiring gender stereotypes. The SAB is acquired through learning to speak, read, and write. However, graph cognition may not be an effect of the SAB at all. Indeed, very early advice from the American Statistical Association Joint Committee on Standards of Graphic Presentation (1915) to read graphs from left to right explicitly suggests that the public had to be taught this now habitual way of scanning graphs. There are also empirical limits to current experimental findings. Following ordinary conventions, Hegarty and Buechel (2006) defined “first” in visuospatial displays as meaning “on the left” or “on the top.” In addition, Hegarty et al.’s (2006, 2010) participants remembered, drew, or interpreted bar graphs with horizontal orientations in which graph order was always presented as proceeding left-to-right by placing the Y axis conventionally on the left side of the graph. Hegarty et al. (2010, p. 338) voiced caution about the SAB interpretation of their graph order effect because “metaphorical meanings of graph space might well be affected by such features as left-positioned axes.” Study 1 aims to tease apart whether the graph order preference is more likely an effect of ordering men and other powerful groups first in absolute space, as the SAB suggests, or first in conventional graph space. As this experiment touches on the question of whether and how graph order preferences might be embodied, we next discuss the importance attributed to embodied knowledge in feminist epistemology.
Feminist epistemology
As Grosz (1994) has argued, feminism seems to require an account of embodiment that deconstructs a long-standing Western philosophical tradition that separates disembodied reason (gendered male) from forms of embodiment that are projected onto women whose bodies are then deemed incapable of housing rational subjects (see also Rooney, 1991). Feminist psychologists are familiar with Harding’s (1986) description of three broad strategies for engaging with such patriarchal schemas about science and reason: feminist empiricism, standpoint theory, and feminist postmodernism (e.g., Riger, 1992). Summarizing a quarter century of work in the first two epistemological traditions, Intemann (2010) noted that both feminist empiricists and standpoint theorists had come to agree on three key points: (a) knowledge is grounded in experience, (b) theory justification happens in relation to cultural assumptions, and (c) science can become stronger by relying on diverse collectives rather than brilliant individual minds. The graph order preference is relevant to these three concerns to the extent that it (a) reflects the effects of acculturation experiences on cognition, (b) shows arbitrary androcentric conventions at play in the scientific representation of gender differences, and (c) was advised against by APA’s (2010) norms for scientific writing for the diverse collective of authors of psychology research articles.
Intemann (2010) also describes standpoint theories and feminist empiricism as distinct in the values that they place on diversity and social values. Whilst both approaches call for diverse views in science, only standpoint theories particularly value subjugated and marginal views for bringing an “epistemic advantage” to the table. Intemann (2010) acknowledges that subordination and marginalization can create both systematic epistemological disadvantages and advantages. As Hill Collins (1991, p. 243) put it, on its own, “subjugation is not grounds for an epistemology.” Intemann (2010) argues that what Hill Collins (1991) calls “insiders-outsiders,” or people from subjugated communities who also understand the perspectives of dominant groups, are those who are most likely to develop insightful epistemological standpoints. Relatedly, she argues that standpoint feminism is more explicit than feminist empiricism in its claims that existing scientific knowledge is a hegemonic system, based on the values and interests of privileged groups, which have never been empirically justified, and which can, for that very reason, be unmasked as unjustified.
The graph order effect is relevant to Intemann’s (2010) argument for the continuing merits of standpoint theories over feminist empiricism. The fact that women and men both position data representing males first in graphs and tables of gender differences demonstrates that simply being subjugated as a woman is no guarantee that a woman will abstract information about gender differences in a more feminist way than a man will. But perhaps women psychologists are “insiders-outsiders” in some contexts? Both Riger (1992) and Intemann (2010) argue that standpoint theory’s claim about groups’ epistemic advantage can, and should, be informed by empirical studies. Two final experiments by Hegarty et al. (2010) demonstrate the psychological possibility that women’s subordination within graphs and tables creates a particular possibility to oppose the androcentric graph order convention.
First, in Hegarty et al. (2010, Study 5), women and men were asked to investigate graphs positioning women or men first for apparent bias. Only about one sixth of participants noted the ordering of data as evidence of bias, regardless of the graphs’ order. Among this subgroup, most thought that the author had prioritized their own gender by positioning it first in the graph. Second, in Hegarty et al. (2010, Study 6), women and men drew two groups representing a gender difference and a difference between themselves and a familiar person “of the opposite gender.” When participants drew the self–friend graph first, men almost always positioned themselves first, but women positioned self and friend first with equal frequency. When participants next drew gender difference graphs, men showed the usual preference to graph men first, but women were equally likely to position data representing women first or men first. Jointly, these two studies show both the capacity for insight among women and men that graph order might express an ingroup bias (cf. Tajfel & Tuner, 1986), and how women adopting a self-relevant perspective might break the androcentric habit of positioning men first in gender difference graphs. The present studies flesh out the claim that the graph order preference is embodied (Study 1) and examine if the APA’s (2010) advice to avoid it has made insider-outsiders of subgroups of feminist authors or women authors in psychology (Studies 2 and 3).
Study 1: Why graph males first? The spatial agency bias and graphing conventions
Study 1 aimed to clarify whether graphing conventions or embodied cognition is the more likely cause of the males-first order preference. The study specifically tested whether shifting the location of axes within graphs impacted the order in which gender and power groups were arrayed. The graph prompts used in Study 1 are shown in Figure 1. Embodied cognition hypotheses based on absolute spatial order predicted that in most vertically oriented graphs (i.e., Figure 1A & 1B), participants would array males and higher power groups on the top, whilst in most horizontally oriented graphs (i.e., in Figures 1C & 1D), participants would array males and higher power groups on the left. Conventional graph order is shown by arrows in all four graphs in Figure 1. Graph direction proceeds bottom-to-top in Figure 1A and right-to-left in Figure 1D. In these two pivotal conditions, conventional graph order predictions conflict with absolute spatial order predictions.
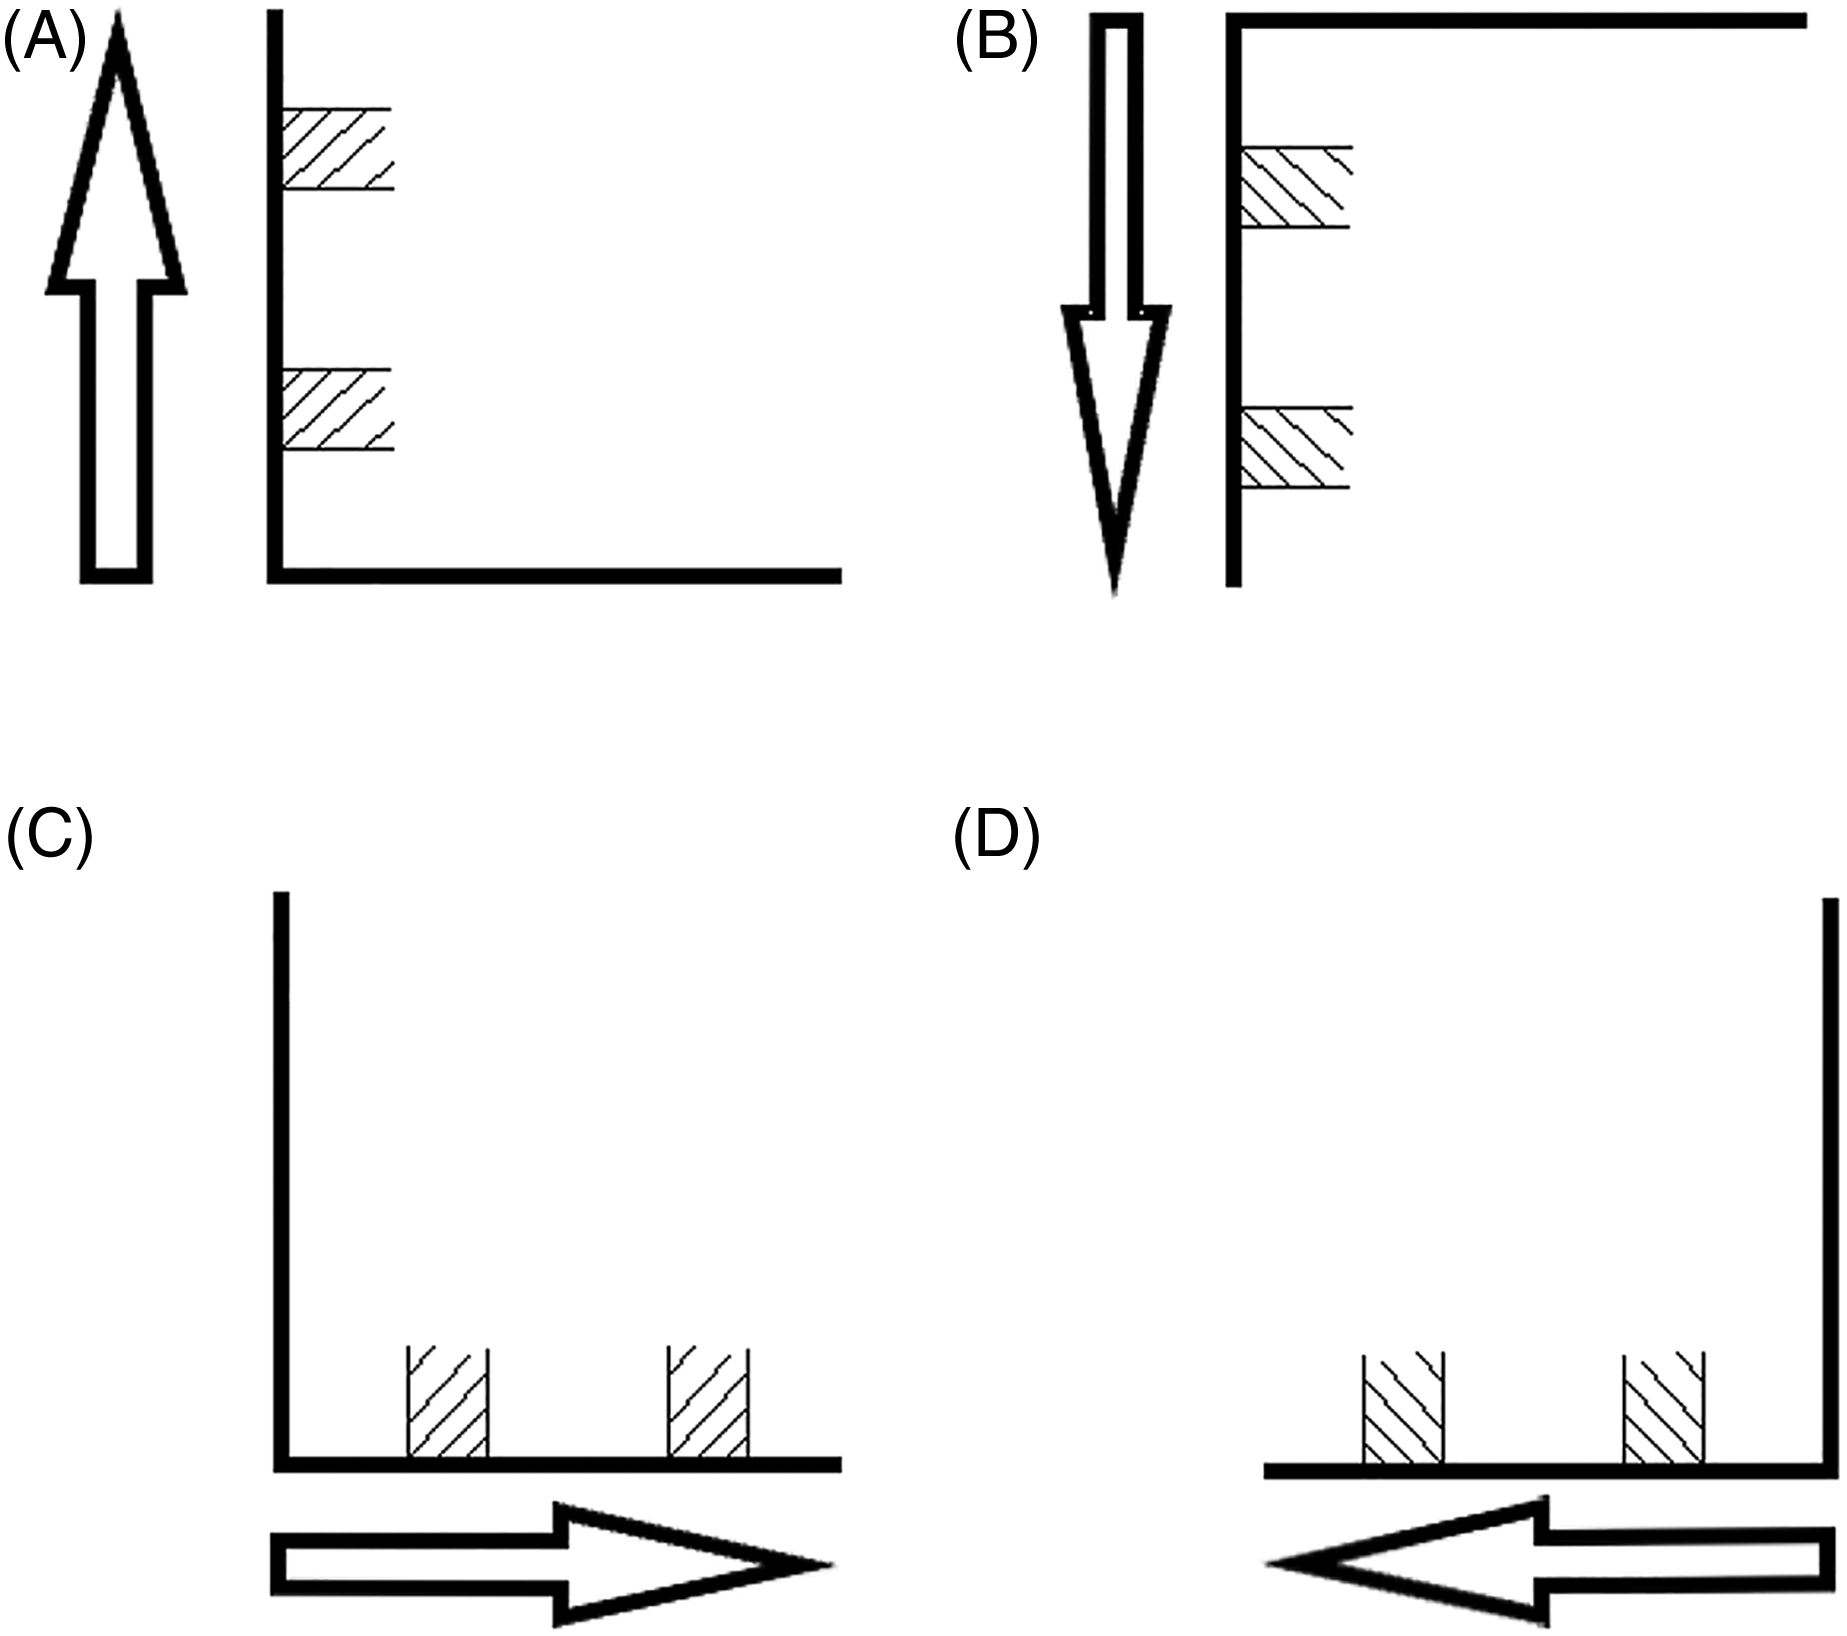
Graphing prompts by graph orientation and conventional direction determined by axis placement: Study 1.
When prompting participants to graph power differences, we followed Hegarty et al. (2010, Study 3) by asking for graphs of groups that varied in either “power” or “weakness.” We expected to replicate Hegarty et al.’s (2010) findings that “weakness” graphs arrayed the powerful group first roughly half of the time, whilst “power” graphs arrayed the powerful group first almost always, producing an overall preference to graph powerful groups first.
Method
Participants
Materials were distributed to 296 student participants at a U.K. university. We analysed the data from 255 participants who completed at least one interpretable graph (144 women and 111 men; age range = 17–63 years, M = 21.77 years, SD = 6.90 years). They described their handedness as exclusively right-handed (n = 227), exclusively left-handed (n = 22), or as some combination of the two (n = 6). Five reported some knowledge of languages whose script direction is right-to-left; two each reported knowing some Farsi or some Urdu, and one reported knowing some Arabic.
Design and materials
The paper materials prompted participants to draw two graphs representing gender differences and power differences on subsequent pages. The prompt to draw a gender difference graph presented a graph frame created by two axes, and the stems of two bars within that frame (see Figure 1). Participants were asked to label those bars with the names of “the two genders” to represent a gender difference with respect to some variable (for a full description of this task, see Hegarty et al., 2010, Study 6). The prompt to draw the power difference graph was visually similar, except that no labels were attached to the bars in the graph frame. Also, participants were asked to graph either two social groups that differed on how powerful they were in society, or two groups that differed on how weak they were. In both cases, participants were instructed to label the bars with the names of two relevant social groups and to complete the bars to show the power–weakness difference, as in Hegarty et al. (2010, Study 3).
Procedure
Participants were recruited by students completing an experiment on social memory for a research methods class. The participants completed the current task as a distractor task between the learning and test phases of that experiment. Participation occurred in diverse venues chosen by the student experimenters, who were unaware of the hypotheses. Because the task raised no ethical issues and participation was anonymous, confidential, and voluntary, it did not require ethical review at the U.K. university at the time it was conducted.
Results
Coding
Among the 255 participants, eight drew meaningless gender difference graphs, leaving 247 gender difference graphs for analysis. Fifteen participants drew meaningless power difference graphs, leaving 240 power difference graphs for analysis.
Each usable graph was coded with respect to absolute spatial order (i.e., left-to-right in horizontally oriented graphs, and top-to-bottom in vertically oriented graphs). For the power difference graphs, we determined which group the participant considered to have more power by inspecting the relative height of the bars within their graph, as in Hegarty et al. (2010). If the higher bar was first, the graph was coded as arraying the more powerful group first; if the lower bar was first, the graph was coded as arraying the weaker group first.
Graph order
Table 1 displays the percentages and counts of participants in each orientation and axis placement condition who drew gender and power difference graphs in each order. The data are tabulated such that “first” means “left” in regard to the horizontal graphs, and “on top” in regard to the vertical graphs, consistent with embodied cognition predictions.
Percentages (and counts) of graphs, ordering each group first by graph orientation, axis placement, and prompt condition.
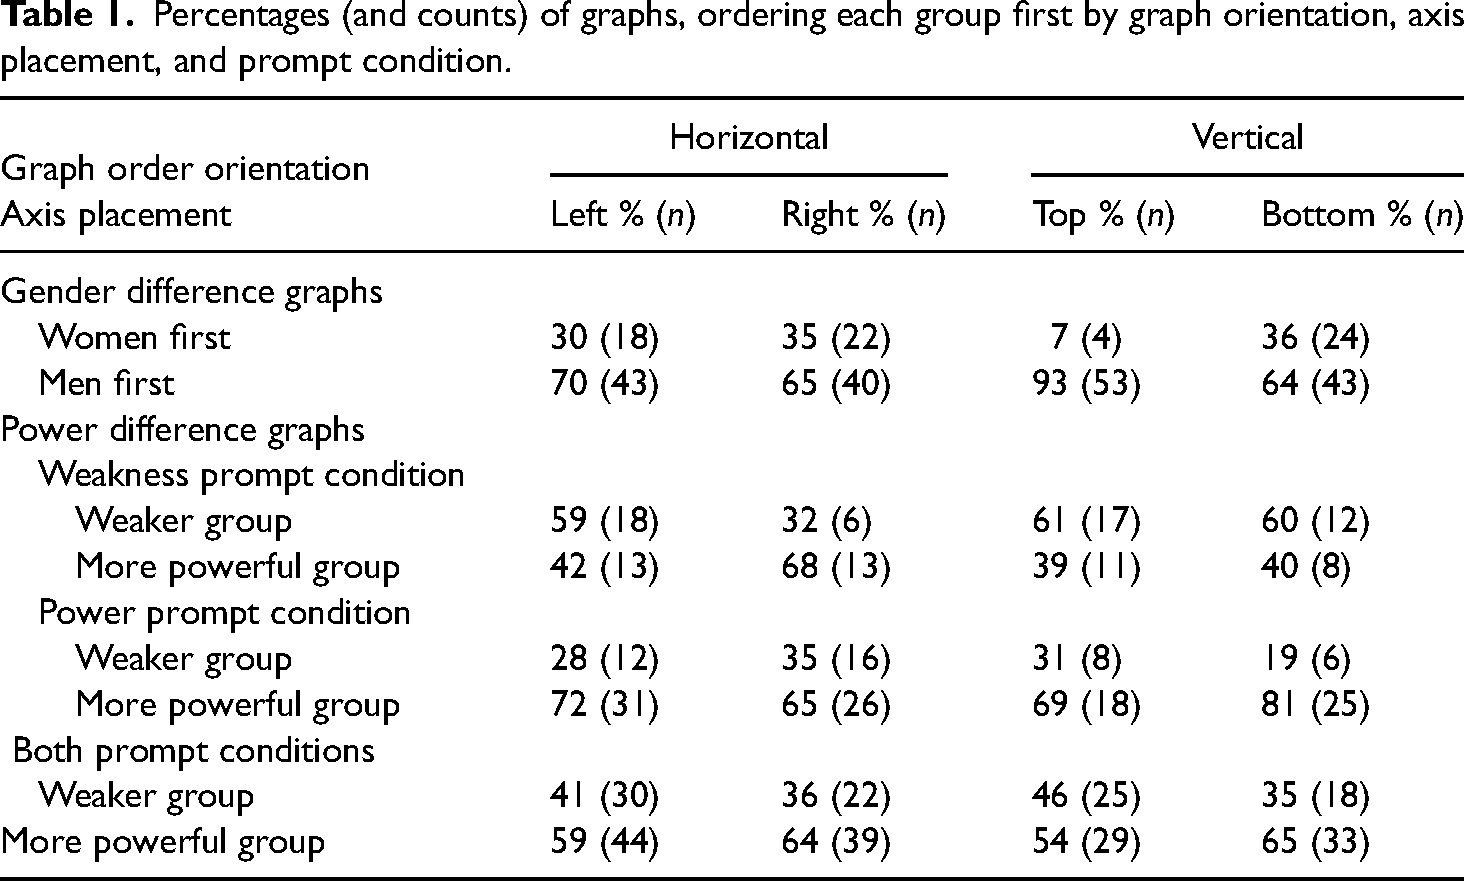
The findings for gender difference graphs are tabulated first. Across all four conditions, women were arrayed first in only 28% of the graphs, whilst men were arrayed first in 72% of the graphs (binomial p < .001). The second and third columns of Table 1 show the results for the gender difference graphs for the horizontal-axis-right condition (see Figure 1D) and the vertical-axis-bottom condition (see Figure 1A). Even in these two critical conditions, where conventional graph order and absolute space order are opposed, most graphs arrayed men first (i.e., on the left or on top; 83 vs. 46 graphs; 64% vs. 36%; binomial p = .001). These findings point to the SAB and related embodied cognition biases, and not to conventional graph order, as the more likely explanation for the placement of gender groups in these bar graphs.
The findings for power difference graphs are tabulated in Table 1 both separately by prompt condition and aggregated across prompt conditions. Participants largely arrayed powerful groups first when prompted to graph power differences (100 of 142 graphs, 70%; binomial p < .001), but weak and powerful groups were arrayed first by equal proportions of participants prompted to graph weakness (55 vs. 45 graphs; binomial p = .27). 2 This pattern replicates Hegarty et al.’s (2010) findings. We aggregated data across both word prompt conditions. Higher power groups were arrayed first in 60% of power difference graphs overall (binomial p < .001). Even in the critical horizontal-axis-right and vertical-axis-bottom conditions (see Figure 1A, 1D), powerful groups were arrayed first more often than weaker groups (72 vs. 40 graphs; 64% vs. 36%; binomial p = .001). Order in these power difference graphs can also be explained by embodied cognition biases, but not by conventional graph order account.
Discussion
In Study 1, participants drew graphs that arrayed men and high-power groups first in absolute space across all conditions, irrespective of axis placement. As such, these results suggest that graph order preferences are associated with how embodied cognition affects the placement of groups in absolute space (e.g., Schubert, 2005; Suitner & Maass, 2016). The preference to graph men first was stronger than the preference to graph higher power groups first overall, and we will return to this point in the General Discussion section. As Study 1 confirms an influence of embodied cognition on graph order preference, it compels the question of whether the APA’s (2010) advice to authors has shifted norms in psychology to facilitate feminist and women authors to adopt a standpoint that reverses this preference.
Study 2: Replicating Hegarty and Buechel (2006) for the period 2010–2019
Study 2 was the first of two content analyses that aimed to examine how the preference to graph and tabulate men’s data first changed in the decade (2010–2019) since the sixth edition of the APA manual warned authors against it. The APA publication manual is an explicitly prescriptive document with a long history (Sigal & Pettit, 2012). Whilst it has often been criticized for insisting that authors reiterate a masculinist separation of knowing researchers from their research participants (Walsh-Bowers, 1999), the APA manual’s advice has also progressed how gender is represented in psychological science. For example, advice to avoid androcentric language largely extinguished masculine generic terms from psychological publications over the 1980s (Gannon et al., 1992). Late 20th- and 21st-century editions have also reflected and amplified new norms to avoid pejorative language about social groups (Sigal & Pettit, 2012). Drawing on Hegarty and Buechel’s (2006) content analysis, APA (2010) expanded its advice about fairness and respect to visuospatial representations of social groups. Study 2 replicated Hegarty and Buechel’s (2006) content analysis for the decade following the publication of this advice.
Method
We sampled at random one issue of the Journal of Personality and Social Psychology (JPSP), Developmental Psychology (DP), the Journal of Applied Psychology (JAP), and Psychology of Women Quarterly (PWQ) for each calendar year from 2010 to 2019 inclusive. All 475 research articles in each sampled issue were included in the corpus, whilst book reviews, editorials, special sections, and comments were excluded. We coded each article’s publication source (coded 1 = JPSP, 2 = DP, 3 = JAP, 4 = PWQ), year of publication, number of journal pages, number of empirical studies, number of coauthors, number of female coauthors, and first-author gender (coded 1 = women, 2 = men). Lettered replications of a study (e.g., Study 1a, 1b, 1c, etc.) were counted as independent studies if and only if each study had a distinct write up of its Method and Results sections. We most often determined authors’ genders from their names and web page photos.
Results
Coding
Seventy articles (14.7%) included one or more spatial representations of gender difference. These 70 articles included an average of 4.00 tables and 3.33 graphs in total, including, on average, 1.49 tables and 0.67 graphs representing gender differences. These articles’ first authors were more often women (n = 54) than men (n = 16). We coded whether each representation arrayed gender groups with females or males first. Where gender groups were represented by lines in line graphs, their spatial order was determined by the order of gender groups in the line graphs’ legend. Structural equation diagrams were not coded as ordering gender groups.
Following Hegarty and Buechel (2006), we took the article as the unit of analysis. Authors ordered females and males consistently across representations in 64 of 70 articles (91.4% of cases). Accordingly, we conducted nonparametric analyses on these 64 cases to test our main hypotheses. Identical statistical conclusions were reached when parametric tests were performed and when the remaining six articles were apportioned on the basis of the proportion of males-first visuospatial representations in their pages.
Graph and table order
Significantly more articles arrayed data representing males first than data representing females first (n = 40 vs. 24; 62.5% vs. 37.5%; binomial p = .03). Whilst our principal hypothesis was confirmed, the proportion of articles positioning males first was significantly lower than 74%, the proportion observed by Hegarty and Buechel (2006) for the period 1965–2004 (binomial p = .03). This finding suggests a possible shift in the representation of gender differences among some authors.
We first investigated first-author gender as a possible moderator of these order preferences. However, order preferences did not differ significantly by author gender, χ(1, N = 64) = 1.42, p = .23. Fewer articles arrayed females’ data first overall, whether their first authors were women (28 of 48 articles, 58.3%) or men (12 of 16 articles, 75%). However, preferences differed significantly by publication outlet. As shown in Figure 2, only a minority of articles in PWQ arrayed data representing males first (four of 15 articles, 26.6%), whilst the preference remained strong in the other three journals (36 of 49 articles in the other publications, 73.4%). These proportions between PWQ and the other three journals differed significantly, χ(1, N = 64) = 10.73, p = .001. Only one article in PWQ in this sample had a man first author. It consistently arrayed data representing females first.
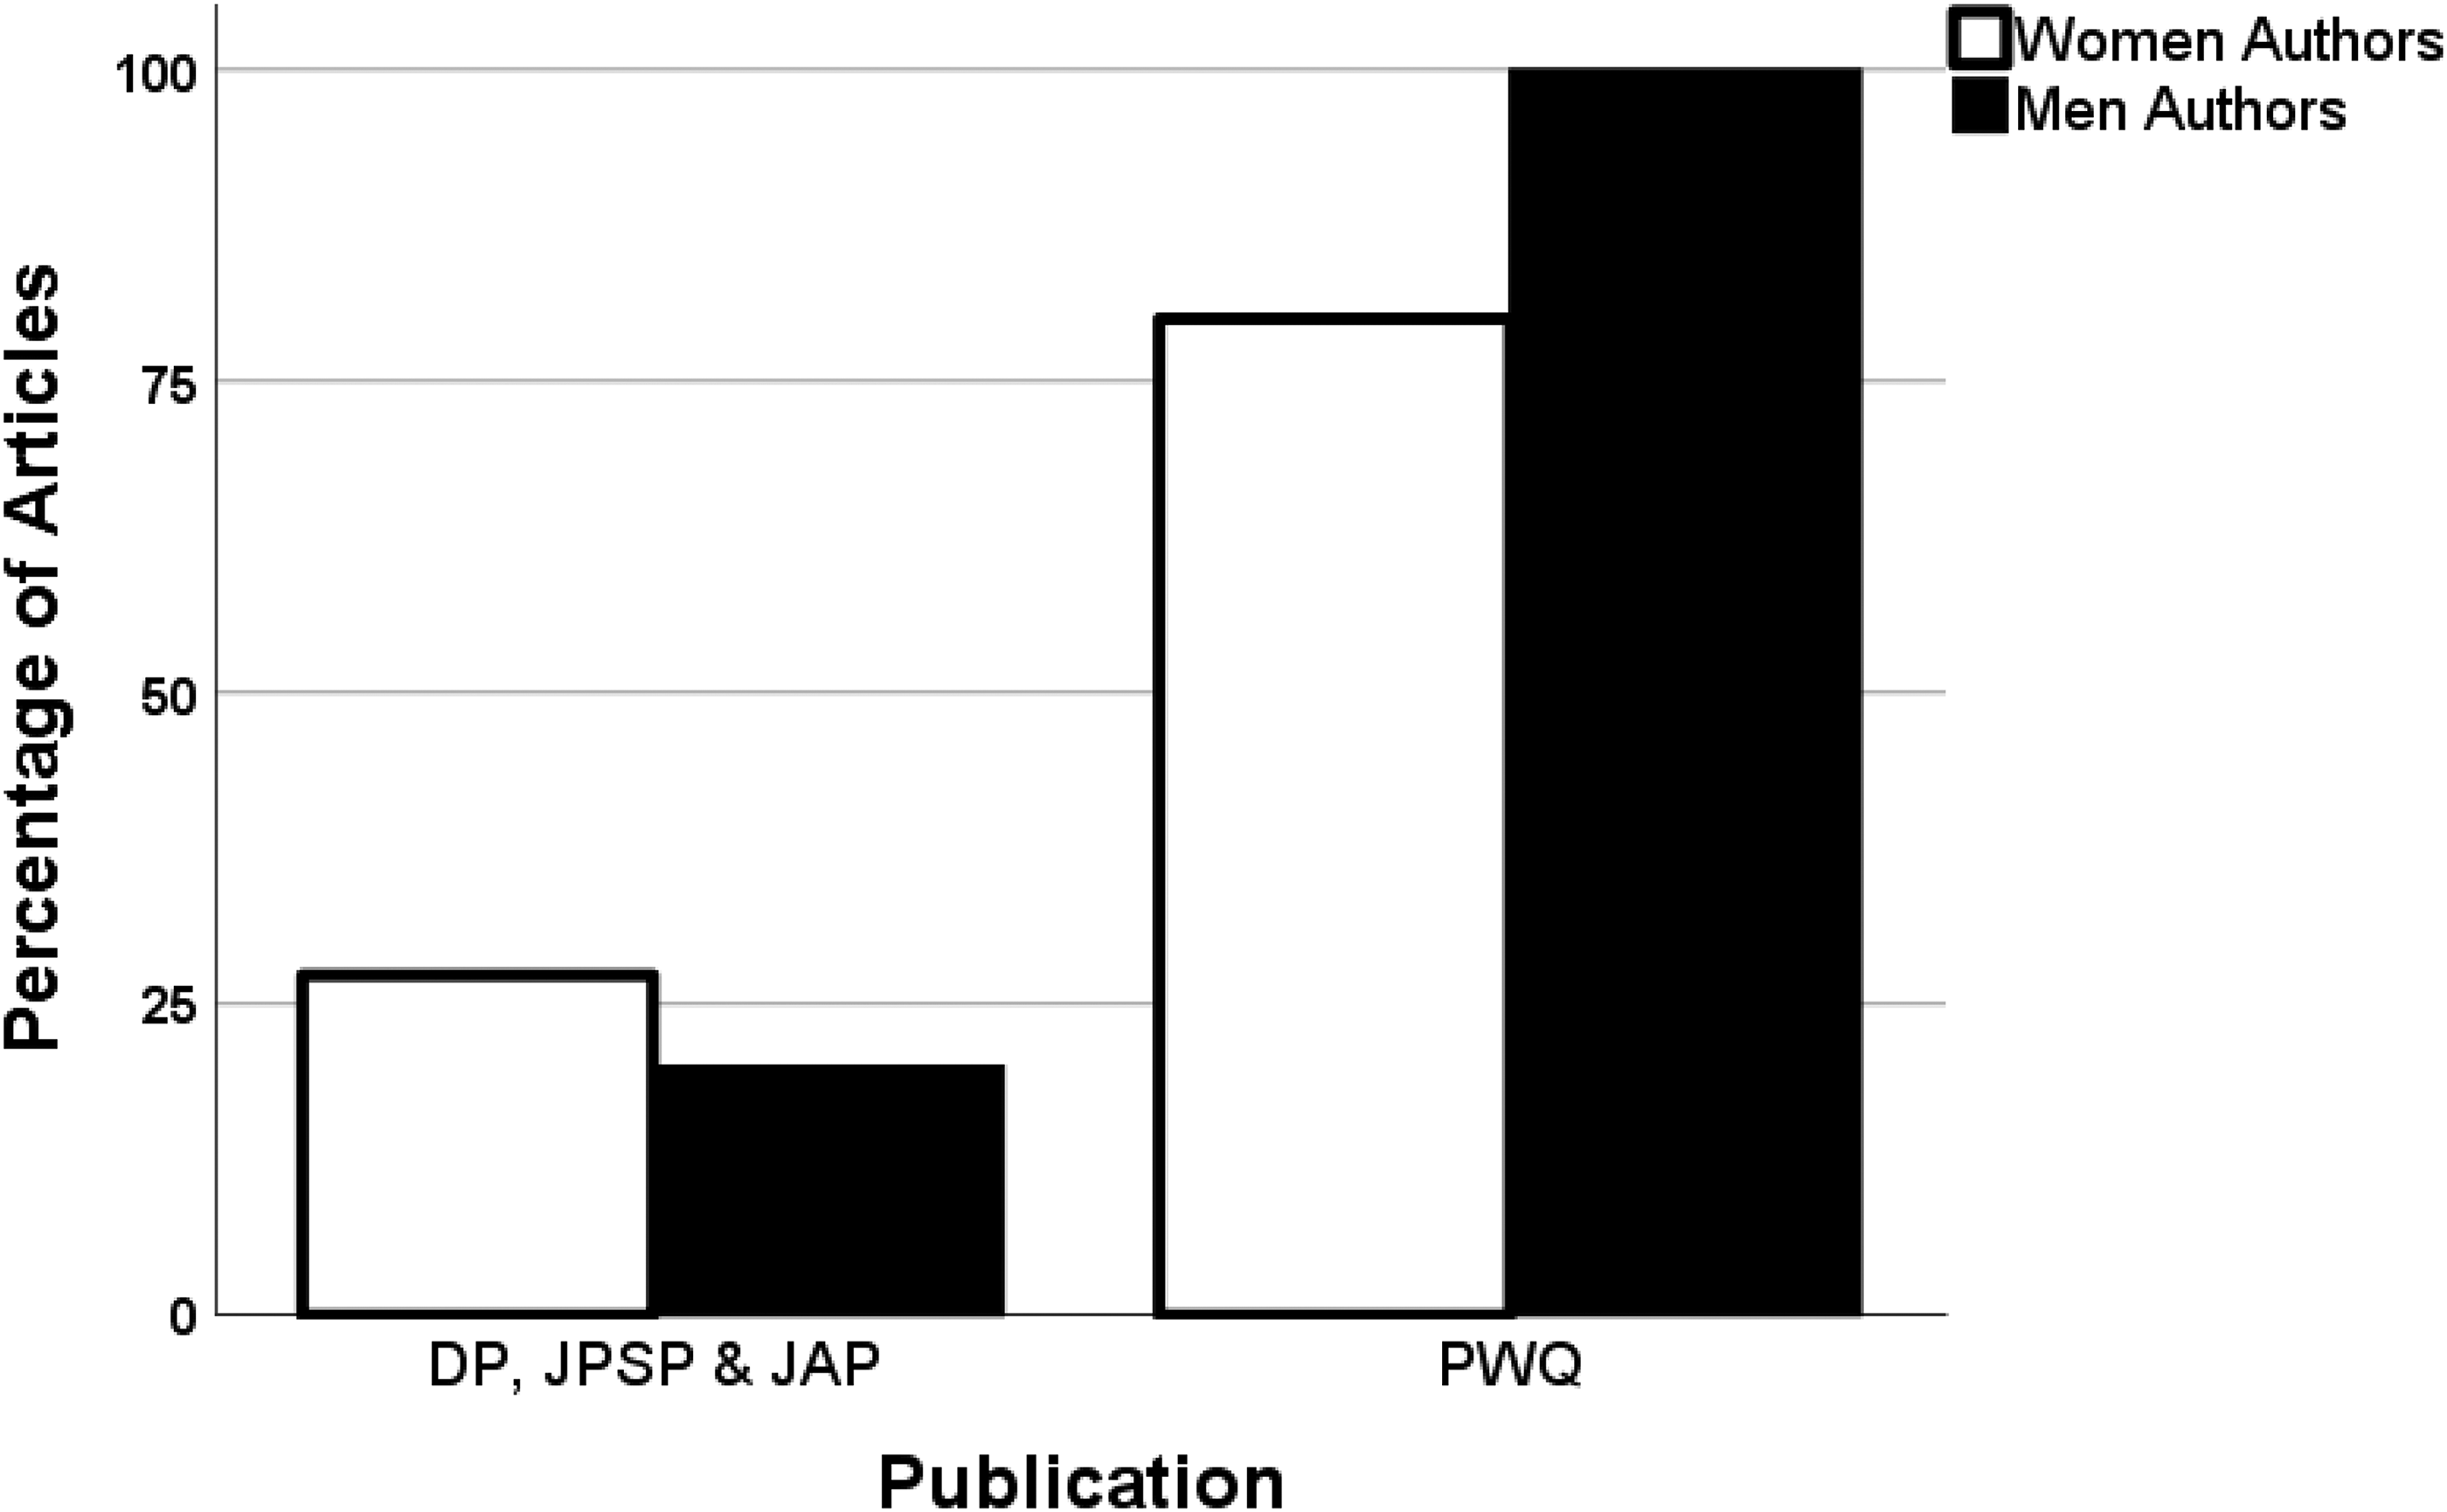
Percentages of articles with females positioned first, by author gender and publication: Study 2.
Discussion
Study 2 showed continuation of the incumbent males-first preference in three journals and change in PWQ in the decade following advice to avoid this practice. Consistent with Intemann’s (2010) and Hill Collins’s (1991) accounts of standpoint feminist epistemology, being a woman psychologist does not guarantee that one graphs and tabulates data in a feminist way. However, engagement with feminist publications might afford the insight to change one’s practices. Indeed, PWQ has long been a driver of methodological and conceptual innovation in the psychology of gender (Lykes & Stewart, 1986), and showed the smallest males-first preference among these four journals for the 1965–2004 period (Hegarty & Buechel, 2006). As Study 2 examined few journals, it had limited scope to analyse the interaction of author gender with subdisciplinary area. Study 3 examined a wider range of journals within a narrow and more recent time frame.
Study 3: Ordering gender differences in social and developmental psychology (2019)
Like Study 2, Study 3 was a content analysis that examined if the males-first preference has persisted even after the APA publication manual’s advice to avoid it. In a large systematic review of the psychology of gender literature, Eagly et al. (2012) determined that four PsycInfo content code classifications were most commonly associated with gender difference findings: social processes and social influences, developmental psychology, personality psychology, and social psychology. Informed by their findings, Study 2 sampled high-impact journals in social psychology and developmental psychology. We limited our sample to articles published in 2019; a decade on from the APA’s (2010) published advice to avoid the males-first preference. By drawing on a larger number of articles from a larger number of impactful journals, Study 3 allowed us to examine the impact of author gender in greater depth than Study 2 had done.
Method
Using Web of Science journal citation reports, we sampled the top 50% of journals, ranked by impact factor, in the social psychology and developmental psychology categories (n = 32, 38 journals respectively). Sex Roles was included in both journal lists, and was excluded from the analysis to allow a clear test of similarities and differences between these subdisciplines. One issue of each journal published in 2019 was sampled at random as in Study 2, and the same criteria for inclusion of empirical articles and coding procedures applied in Study 2 were used here.
In this corpus, 83 articles published in developmental psychology journals and 35 articles published in social psychology journals included visuospatial representations of gender differences. These 118 articles’ first authors included more women than men (n = 79, 39 respectively; binomial p < .001). Women and men first authors were equally distributed across subdisciplines, χ2(1, N = 119) = 1.09, p = .30. These articles included a mean of 3.71 tables and 3.31 graphs in total, and a mean of 1.42 tables and 0.48 graphs that specifically represented gender differences.
Results
As in Study 2, ordering of the genders within graphs and tables was largely consistent within articles, and only nine articles included representations with both possible orders. Among the 109 articles with a consistent order, a significant majority (70, 64.2%) arrayed males first (binomial p = .004). The preference to graph and tabulate data representing males first continued to be evident a decade after the publication manual advised against it, in the areas of psychology where gender differences are most commonly reported (cf. Eagly et al., 2012). However, as in Study 2, the proportion of articles following this convention was also lower than the 74% observed by Hegarty and Buechel (2006; binomial p = .03).
As in Study 2, the evidence that the graphing preference had weakened prompted our further investigation of specific areas where that change may have occurred. We conducted log-linear regression to examine the intersection of subdiscipline and author gender among the 113 articles with a consistent order. The three-way contingency was marginally significant in the full log-linear model, Z = 1.86, p = .063, and we retained the full model, which included no other significant two-way interactions.
The overall preference to array data representing males first was equally strong in developmental psychology (50 of 77 articles, 64.9%) and in social psychology (20 of 32 articles, 62.5%), χ2(1, N = 109) = 0.49, p = .48. We split the corpus by subdiscipline and conducted 2 × 2 chi-square tests to examine the impact of author gender on order preferences separately for each subdiscipline. Figure 3 shows the percentage of articles arraying females’ data first by author gender and subdiscipline. In developmental psychology, articles rarely arrayed females’ data first regardless of whether their first authors were women (25 of 55 articles, 36.4%) or men (seven of 22 articles, 31.8%), χ2(1, N = 77) = 0.14, p = .71. However, in social psychology, author gender impacted preferences significantly, χ2(1, N = 32) = 4.69, p = .03. Women first authors arrayed females first in slightly more than half of the cases (11 of 20 articles, 55%), whilst men first authors almost never arrayed females first (one of 12 articles, 9.3%).
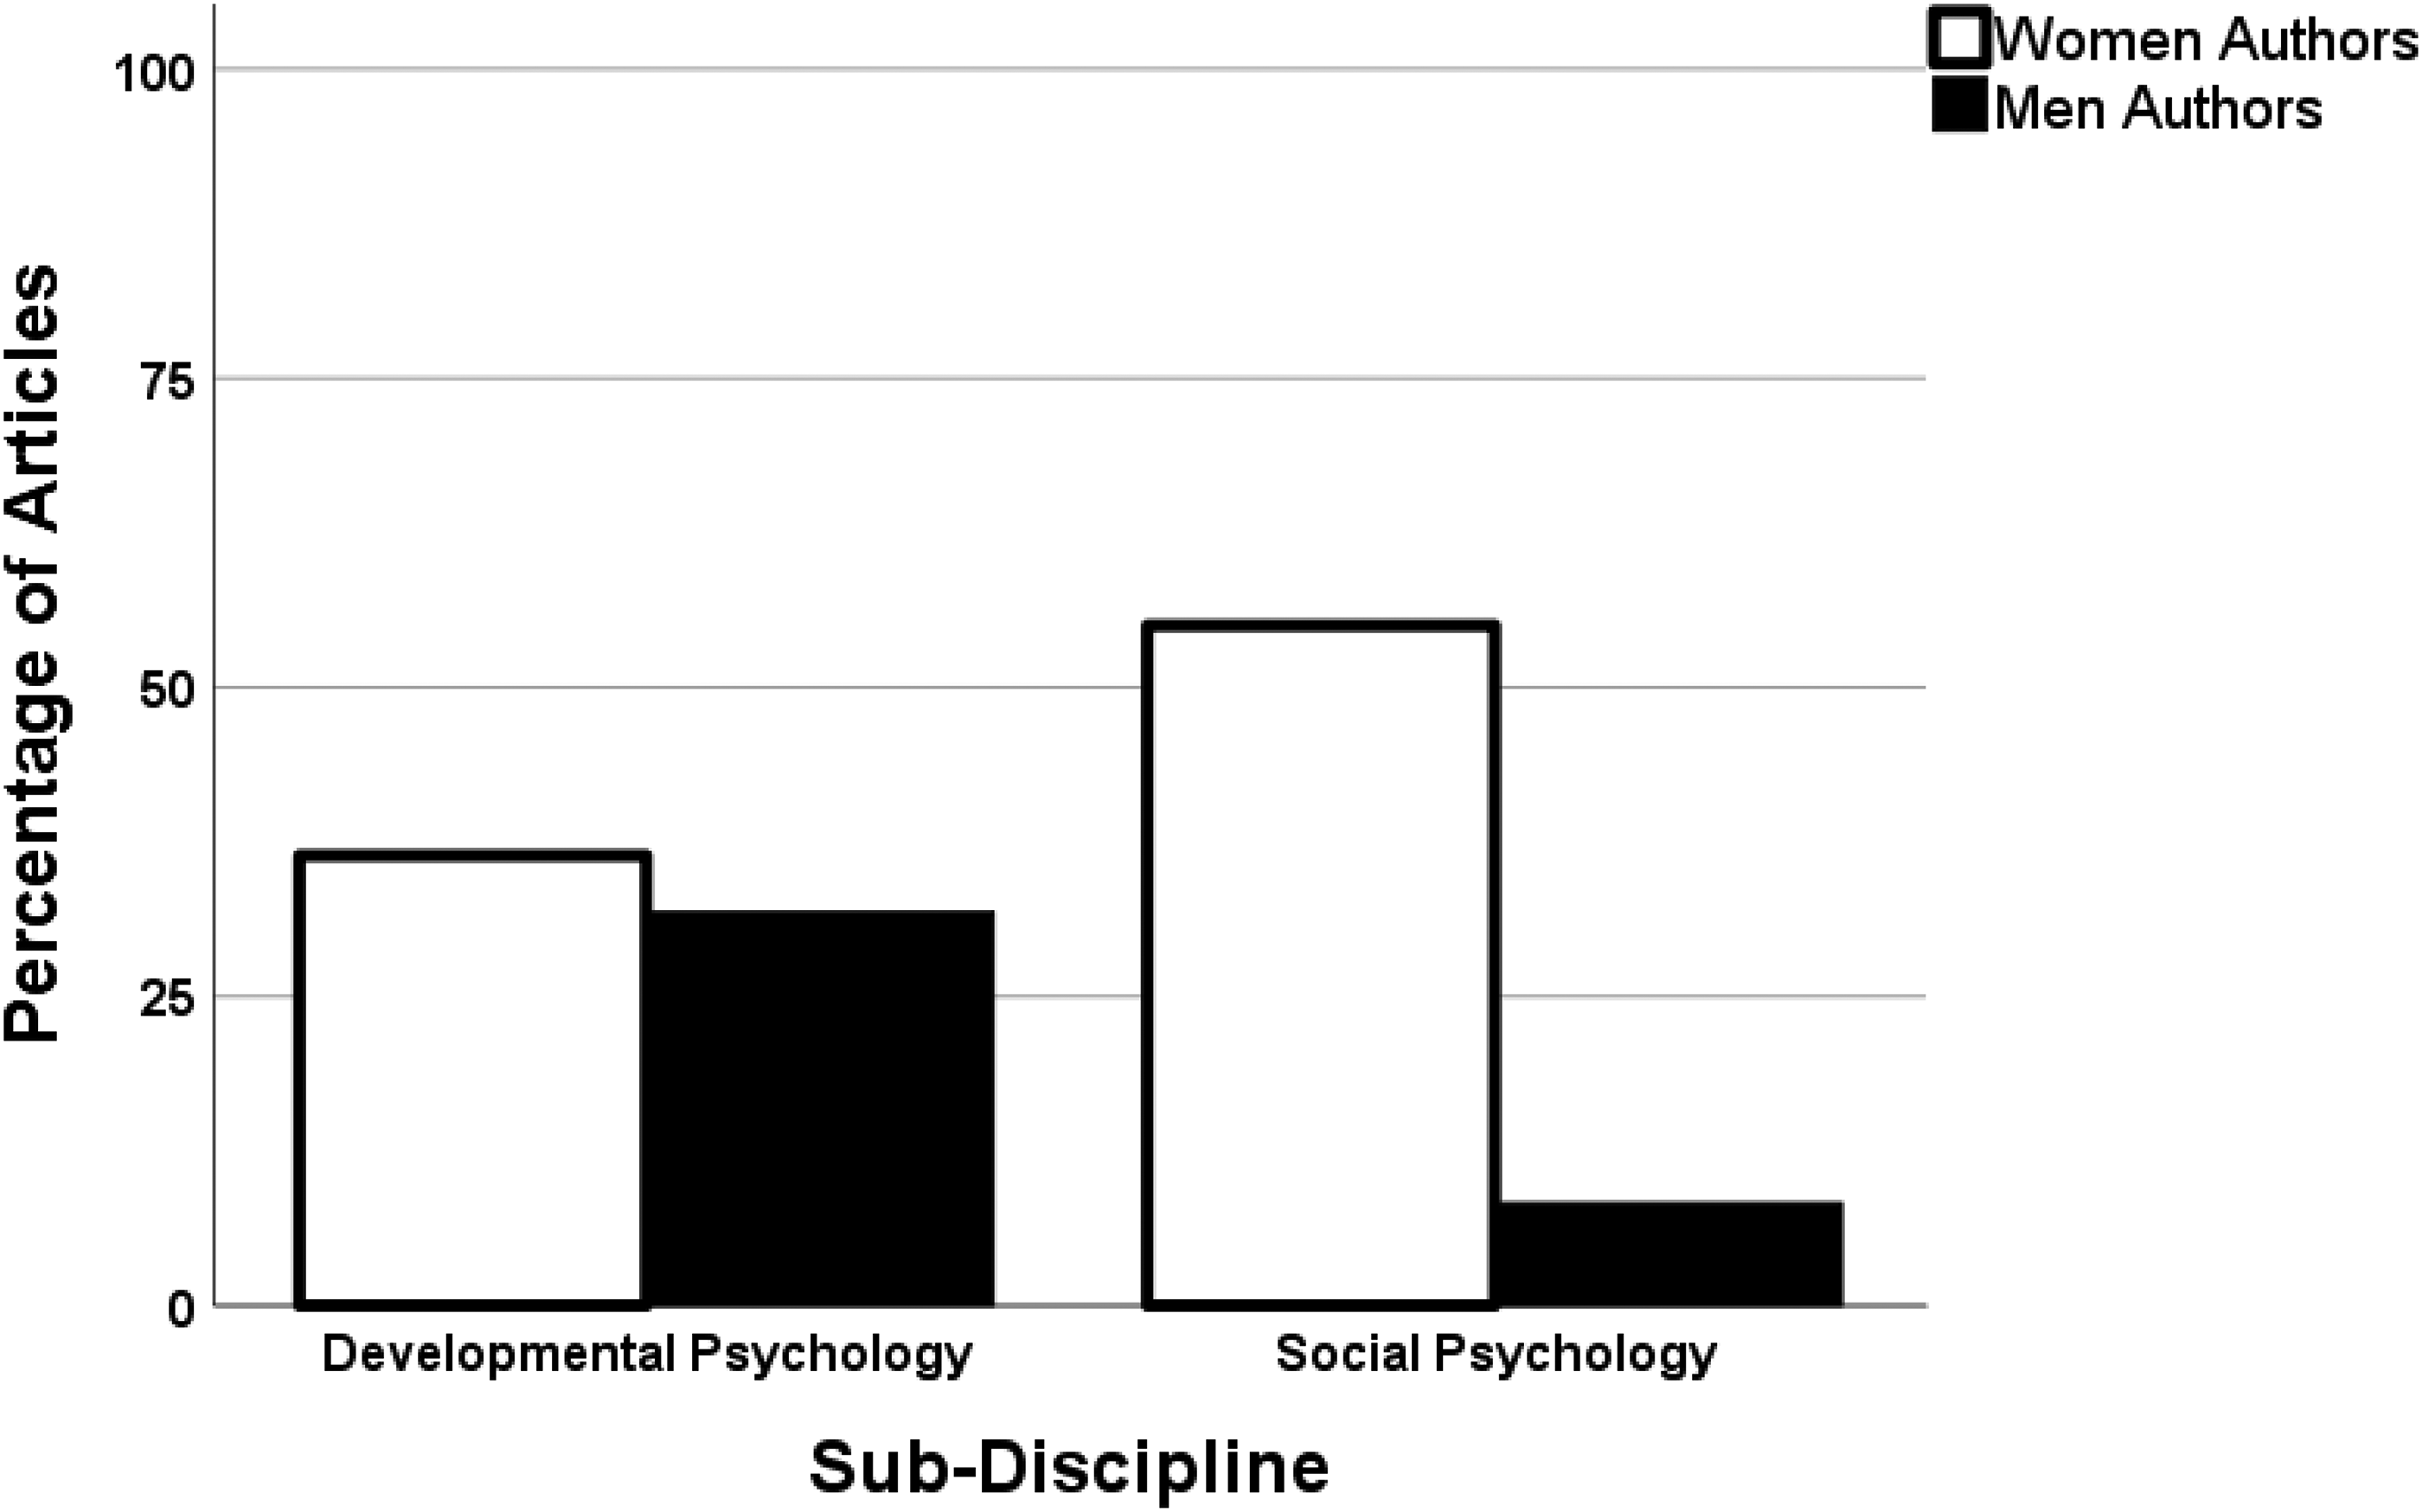
Percentages of articles with females positioned first, by author gender and subdiscipline: Study 3.
Discussion
Study 3 showed that the preference to prioritize males in graphs and tables continues in psychology into quite recent times, but that it is changing noticeably in some areas. Developmental psychologists continue to follow the conventional males-first format. Women social psychologists do not, whilst the preference is stronger than ever among men in social psychology. In social psychology, ordering data in visuospatial representations of gender differences now seems to express the author’s gender identity in the manner projected by participants in an earlier experiment (Hegarty et al., 2010, Study 5). One might say that graph order now expresses a “standpoint” in social psychology more than it does in developmental psychology. The possible reasons for these subdisciplinary differences are discussed in the General Discussion next.
General discussion
The practice of ordering data in visuospatial representations to prioritize men and other powerful groups seems to be embodied (Study 1), and to be continuing in psychology albeit in somewhat weakened form since it was first described in 2006 and described as a problematic practice by APA in 2010 (Studies 2 and 3). These findings have implications for embodied cognition, feminist epistemology, and their mutual relevance to the psychology of gender.
The finding in Study 1 supports the interpretation of the graph order preference as an effect of stereotypes about men’s greater power being drawn down into graph order in both horizontal and vertical orientations. The males-first preference was somewhat stronger than the powerful-group-first preference in this study, possibly due to word order conventions. Spatial agency biases can be affected not only by the usual temporal order of words in sentences such that those things mentioned first are also depicted first (Maass et al., 2014). The preference for “men and women” over “women and men” in English originates in an outdated grammatical prescription that presumes men’s superiority (Bodine, 1975). This word order is stronger and more fixed than is the order of other binomial phrases (Mollin, 2014). The preference is also grounded in several gender stereotypes (Hegarty et al., 2016), and can communicate that men have more agency than women (Kesebir, 2017). Effects of preferred binomial word orders on graph and table order should be investigated, and should also be interpreted in light of this evidence of the semantic grounding and implicit meanings communicated by binomial word order. In addition, the findings regarding power difference graphs in Study 1 suggest that graph order may impact other identities marked by hierarchical power with which gender intersects.
Graph and table order demonstrates the difference between the cognitive and ideological analyses of androcentrism (see Bailey et al., 2019). The graph order preference is not a result of the implicit representation of men as the default, unmarked, or normative gender group. People do not graph men first because men are implicitly held to be more prototypical of the categories in question. Rather, men are graphed first because they are perceived as powerful. The preference is not an example of individual cognitive androcentrism, but it is ideologically androcentric for its alignment with a representation of reality that both prioritizes men over women and its use of a format that connotes that the representation is not constructed at all (Latour, 1990). As such, the APA’s (2010) advice that graphing men and other dominant groups first repositions them as the universal standard is best interpreted not as a claim about individual authors’ cognitive biases, but of how those authors are reproducing an androcentric framing of gender differences if they mindlessly allow embodied cognitive biases to determine how they graph and tabulate data.
This distinction between cognitive and ideological androcentrism seems particularly pressing as Studies 2 and 3 showed that some psychologists are now ordering graphs and tables to prioritize their own genders whilst others are not. These new trends speak to Intemann’s (2010) arguments about the particular value of insiders-outsiders in unmasking and undoing unjustified patriarchal practices assumed to be objective. As noted in the introduction, order conventions can be different in different sciences (Wolff-Roth, 2003), and ordering gender groups in psychology may now be an expression of feminist identity or of social identity as a woman scientist in a way that was not happening 15 years ago. Men social psychologists may be graphing and tabulating data with males first more than ever (Study 3), recalling Lamer et al.’s (2021) recent suggestion that men’s order preferences can express “precarious manhood” under conditions of threat (cf. Vandello & Bosson, 2013). When androcentric conventions to use “he” and “man” for everyone were challenged, backlash ensued and gender differences in attitudes towards such language reforms remain polarized by gender differences (e.g., Sczesny et al., 2015).
The cultural change in scientific representations shown here in PWQ and among women social psychologists has precedent in the visual arts. In the 19th century, women artists changed the horizontal orientation of models in portraiture that had long represented men as more agentic than women (Suitner & Maass, 2016), much as women social psychologists appear to be graphing differently now. We may currently be witnessing a shift in how graph and table order expresses sexual politics in psychology, from an androcentric practice to the expression of authors’ identities and attitudes in some areas.
Conclusion: Grounding a feminist standpoint in cognitive psychology
We conclude with some thoughts about how this phenomenon may speak to feminist engagement with cognitive psychology more broadly. Whilst feminist philosophy may need to challenge the concept of the disembodied mind (Grosz, 1994; Rooney, 1991), standpoint theories can fail to mount such a challenge when they essentialize and polarize differences between women’s and men’s ways of knowing or thinking (Riger, 1992). Consequently, it is important that the embodied basis of cognition which feminist theory might articulate is not simply theorized as a natural consequence of differently sexed bodies, produced by evolution, or imagined as occurring irrespective of social and cultural contexts (for discussion, see Bluhm et al., 2012; Pitts-Taylor, 2015). Practices of prioritizing men and boys in graphs and tables exemplify how cognition can become embodied through acculturation to create patterns in the gendered subjectivities through which scientific knowledge about other people is produced and interpreted.
Because the mechanization of objectivity has been incomplete in psychology and elsewhere (Datson & Gallison, 2007), and the study of gender differences remains the dominant way of approaching gender in psychology (Eagly et al., 2012), there are feminist political stakes in selecting how differences are conventionally and collectively visualized and communicated. The empirical findings reported here might form one basis of a broader feminist psychology of mental imagery. Gender differences in spatial abilities have often been used to justify inequalities, and particularly to limit expectations of what women can achieve in scientific domains. For this reason, it may seem that feminist psychology does best to avoid questions about mental imagery altogether. However, beyond the graphs and tables investigated here, visualization is pivotal to accounts of how cognition is embodied (Wilson, 2002) or otherwise grounded (Barsalou, 2008). Moreover, feminist arguments staked a claim early on that male-centred language is harmful precisely because it prompts male-centred visualizations (e.g., Hyde, 1984). In other words, feminist psychology’s continuing critique of androcentric ideology in the representation of gender differences in psychological science has long been invested in the debate within cognitive psychology about the reality and importance of mental imagery (see also Kosslyn et al., 2006). The present research anticipates and calls for deeper feminist engagement with cognitive psychology.
Footnotes
Acknowledgements
We thank George Phillips and Lee Yung Teng for research assistance with Study 1.
Author note
Studies 2 and 3 were conducted by the second author under the supervision of the first as partial fulfilment of a MSc in Psychology at the University of Surrey.
Funding
The author(s) received no financial support for the research, authorship, and/or publication of this article.