
Abstract
Changes in household structures and employment patterns alter the balance between households with an above- versus a below-average poverty risk while also affecting relative income poverty thresholds. Examining 11 countries for which suitable microdata is available from LIS back to the mid-1980s shows that patterns of change in household composition and employment exhibited some common features but also very substantial variation. The share of single adult households rose in most countries, couples with no or only one person in paid work fell in most, while couple households with two earners increased in a majority but not in Denmark, Norway and the USA and only modestly in Hungary and the UK. A counterfactual exercise assessed the impact of these changes in composition on relative income poverty rates by reweighting the 2019 samples to impose the composition structure observed in 1986. In the absence of these composition changes the relative poverty rate in 2019 would have been a good deal higher in Germany, Greece, and Italy, and especially in Israel and Spain. Composition changes had only a modest impact in the UK and made very little difference in Denmark, Hungary, and the USA, while working to increase the relative poverty rate in Czechia and Norway. This reflected the varying scale and nature of the composition changes seen across these countries. Their impact included driving up the relative poverty threshold (except in the USA), and if this effect is discounted the composition shift over the period would have had a greater poverty reduction impact in most countries, especially in Israel, Italy and most powerfully in Spain.
Introduction
Progress over recent decades in reducing poverty in rich countries, assessed in terms of the share of the population in households falling below widely-used relative income poverty thresholds, has been limited and disappointing (Cantillon, 2022; Tóth et al., 2024; Vandenbroucke and Vleminckx, 2011). This is a puzzle in the context of changes in household structures and patterns of employment: why have falling fertility rates and the increasing proportion of couples with both partners in employment not had a more pronounced impact in reducing poverty rates? What does this mean for the design of anti-poverty strategies, and indeed for how their impact is best assessed? These are the questions we address by examining the experiences of a range of countries since the 1980s and drawing out the implications.
A significant body of research has sought to understand the impact of changes in household structures and employment patterns on income inequality across countries and over time (Breen and Salazar, 2010, 2011; Cancian and Reed, 1998; Förster and Vindics, 2022; OECD 2011, 2020), but their impact on poverty trends in a comparative setting has received much less attention. (Nieuwenhuis et al., 2020; Zagel et al., 2022 are exceptions focused on single parent households). The most marked changes across rich countries over recent decades have been falling household size and an increasing share of single-adult households (OECD, 2011). At the same time increases in women’s labour force participation have driven up the share of couples with both partners in paid work. After some debate (Esping-Andersen, 2007; Harkness, 2013) these changes in the extent and nature of women’s labour market participation are seen as generally reducing income inequality (Azzollini, Breen, and Nolan, 2023a; Grotti and Scherer, 2016; Kollmeyer, 2013; Nieuwenhuis et al., 2017).
These changes in household structures and employment patterns may also have major implications for household poverty in ways that need to be disentangled and better understood. Theoretically, they could impact on standard measures of household poverty in a variety of ways. Shifting the balance between ‘types’ of households facing an elevated versus below-average poverty risk, for example workless versus two-earner households, impacts directly on trends in aggregate poverty. However, population shares and poverty risks of such household types are not independent; the complex causal processes underpinning increasing dual earnership for example may have also undermined the labour market position of some low-educated men, serving to increase the poverty risk of such single earners via pay levels and increased unemployment. More narrowly but importantly, such changes in shares may affect average/median incomes in the population and thus the relative income poverty thresholds against which progress is most often assessed.
Counterfactual reweighting techniques have been applied productively in studies of the evolution of earnings and income inequality (for example Breen and Salazar, 2010, 2011). Here we employ them to assess the role played by changes in household structures and employment patterns in trends in relative income poverty in 11 rich countries, going back to the mid-1980s using microdata from the Luxembourg Income Study. We first capture how varied the experiences of these countries have been in terms of household structures and employment patterns; this has not been adequately reflected in poverty research to date. We then assess their role in driving aggregate poverty trends, including the extent to which lack of progress in that respect is attributable to the fact that the target is a moving one when relative income thresholds are the focus. This makes a significant contribution to understanding what has driven poverty trends, with important implications for strategies to reduce poverty, as brought out in our concluding discussion.
Section 2 provides a brief overview of relevant research. Section 3 describes the data and analytical methods. Section 4 sets the scene in terms of poverty levels in aggregate and across households categorised in terms of structure and employment patterns. Section 5 examines how household structures and employment patterns have changed over time. Section 6 presents the results of our counterfactual analysis assessing how these changes impacted on overall trends in relative income poverty, and also how the relative income thresholds involved were affected and the role this played. Section 7 highlights the key findings and discusses their implications.
Background and literature
Both household size and composition and patterns of labour market participation have changed substantially over recent decades in rich countries. Low and/or declining fertility rates in most OECD countries means families have fewer children and together with changing family structures have led to a growing share of households without children, with the proportion comprising a single adult living without children or partner generally also rising (OECD, 2011). At the same time, female employment has risen especially for married mothers, leading to an increase in the share of couples with both partners in paid employment (Adema et al., 2020)
A sizeable literature has examined how these demographic and employment trends affected the evolution of inequality in household income or earnings, both for individual countries and comparatively. The analytical approach employed in this research has often been a variant of counterfactual shift-share as we discuss in the next section; here our focus is on the main findings. These generally suggest that demographic shifts per se have played a relatively minor role but an increasing share of women’s earnings in family income may have had a more marked impact on income inequality (Förster and Vindics, 2022; Jäntti, 1997; OECD, 2011; OECD, 2020). Analysis of the impact of increased labour market participation by partnered women has pointed to the importance of the education level of the women involved and their partners (Cancian and Reed, 1998; Burtless, 1999; Breen and Salazar, 2010, 2011; Spitzenpfeil and Andreß, 2014; Gonalons-Pons and Schwartz, 2017; Sudo, 2017). As shown by Esping-Andersen (2007) and subsequent studies, an equalizing effect of women’s employment will primarily emerge when it is lower educated women’s labour supply that increases. The potential role played by increased assortative mating received particular attention but Breen and Salazar (2011) found only a weak impact on household earnings inequality in the USA over time and Grotti and Scherer (2016) saw little impact for Denmark, Germany, Italy, the UK and the US, consistent with Boertien and Permanyer’s (2019) simulation of changes in educational homogamy in 21 countries. Kollmeyer’s (2013) analysis of data for 16 countries also suggested that increased female employment reduces income inequality whereas increased prevalence of single-mother families heightens it. Nieuwenhuis, Kolk, and Need (2017) find that if women’s earnings had remained unchanged from the 1970s/80s inequality in household earnings would have been higher in 18 OECD countries. Zagel and Breen (2019) find that rising female employment, assortative mating and single parenthood help to explain inequality growth in West Germany but not the USA between the 1990s and the 2000s. Azzollini, Breen and Nolan’s (2023a) simulation exercise suggests that closing the gender gap in employment could reduce household earnings inequality considerably in a range of OECD countries.
In contrast to this comparative research focused on inequality, the impact of changes in household structures and employment patterns on poverty has mostly been studied only at national level (e.g. Hoynes et al., 2006, for the USA). Among the limited number of comparative studies Brady and Burroway (2012) found that the increasing share of children in single-mother families impacted on the poverty rate but employment and welfare state institutional factors were more important. Nieuwenhuis et al. (2020) examined the association between trends in women’s employment and poverty across 15 OECD countries and found that, for the most part, increasing women’s employment was associated with a reduction in poverty, though not in Nordic countries where women’s employment rates were initially very high. Zagel et al. (2022) analyse contrasting trends in single-mother poverty in Germany, the United Kingdom and Sweden since 1990 and emphasise how both individual-level and contextual-level factors need to be incorporated in explaining such trends.
In framing expectations about the likely impact of changes in household structures and employment patterns on poverty, findings on their effects on inequality offer limited guidance. Falling family size might be expected to usually work towards lowering overall poverty given the enhanced poverty risk generally facing those with three or more children. A shift to both partners being in paid work should reduce poverty among couple households, though the scale of that impact will depend on how many were already above the poverty line with one earner. However, falling fertility and an increase in dual-earning among couples may have only a limited impact on poverty if the overall importance of couples in the population is declining as single adult households become more prominent (Schwartz, 2013; Maldonado and Nieuwenhuis, 2015; Nieuwenhuis and Maldonado, 2018; Zagel et al., 2022). Indeed, with increasing polarisation between struggling single-person or single-parent households and higher-earning dual-earner households overall poverty could even increase.
This likelihood is exacerbated when poverty is measured using relative income thresholds, as is often (though not always) the case in official poverty monitoring. While the EU also monitors levels of material deprivation, and multi-dimensional measures of poverty are now also widely employed in research, individual countries and monitoring the UN’s Sustainable Development Goals, income-based measures of poverty continue to play a central role, most often framed in a purely relative manner. Whether a household is considered poor then depends not only on its own income but also those of other households. Debate about disappointing progress in reducing poverty in Europe features how income growth for some households “raises the bar” for others, making it more difficult to escape poverty (OECD, 2011). Nieuwenhuis (2022) finds some support for this argument, noting that single-parent households face higher relative income poverty risks in countries with a large share of dual-earner households, though only in countries that have relatively low public expenditures on childcare and income transfers. Here we build this directly into our analysis and discuss the implications for the design and assessment of anti-poverty strategies.
Data and methods
The data we employ are from household surveys brought together in the Luxembourg Income Study (LIS) harmonised micro-data, for the years 1986 (or closest available) and 2019 (or closest available). This includes the information we require on household structures, income, and labour market participation. Crucially, it also allows us to cover the evolution of household structures and employment for a considerably longer time-span than would be permitted by other comparative micro-datasets such as the EU-SILC (even combined with the European Community Household Panel). Our comparative analysis covers 11 countries: Czechia, Denmark, Germany, Greece, Hungary, Israel, Italy, Norway, Spain, United Kingdom, and United States of America 1 . For these countries LIS has both the full information on household structure and employment and the long observation period we need; we cover a wide range of economic and institutional contexts which allows us to capture the extent of cross-country variation in the role of changing household structures over the longer term. This is important in light of the evidence from studies focused on household structure change and inequality that context and policies matter (Nieuwenhuis et al., 2020; Zagel et al., 2022); it also means we cover a set of countries where initial composition in terms of household types in the 1980s varied widely, which plays a key role in our findings as we will see.
We restrict our analysis to working-age households, as the distinctive situation of older mostly retired households can more productively be studied separately. Various empirical approaches are employed in the literature to distinguish working age households, here we focus on where the household reference person is aged between 20 and 60. Disposable household income is defined in the standard way to include earnings from all sources, income from capital and from private pensions, and cash social transfers, deducting income tax and social insurance contributions paid. To facilitate comparisons across countries, all incomes are converted into 2017 US Dollars adjusted for Purchasing Power Parity using the deflators provided in LIS. Household structure is measured using information on the ages of individual household members, their marital status, and their relationship to the household reference person. A couple household is where the reference person is married or in a union/cohabitation, while single adults may be never married, widowed or divorced. In our categorisation of household types we define ‘child’ not in terms of age but rather as offspring of the household reference person so including those of working age living with one or both parents.
We measure household poverty using relative income poverty lines. Household disposable income is ‘equivalised’ to take the size and composition of the household into account using the square root of household size. The poverty line in a given country in a particular year is then derived as a proportion of median or mean income in the country; 60% of median income is often used, but here we employ 50% of the mean which gives very much the same results but has advantages in terms of manipulation and interpretation as will be discussed.
Turning to analytic methods, we employ a counterfactual approach based on reweighting the samples for each country to assess the impact of changes in their composition. We noted earlier that these methods, which start from the approach developed by Lerman and Yithzaki (1985) and are usefully reviewed in Fortin et al. (2011), are widely employed in the literature on the relationship between demographic/employment structures and income inequality (including Breen and Salazar, 2010, 2011; Grotti and Scherer, 2016; Sudo, 2017; Zagel and Breen, 2019; Boertien and Permanyer, 2019; Azzollini, Breen, and Nolan, 2023b). As with all such analyses, the counterfactuals are artificial, insofar as they only vary some parameters while keeping everything else fixed. They are none the less informative on the direction and scale of likely effects of the changes in household structures and employment patterns on which we focus.
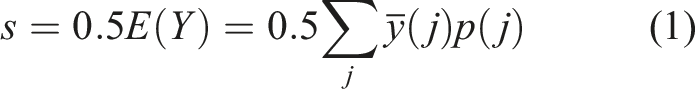
We define a poverty threshold, s, as 50% of mean household income, Y:
The poverty rate in each household type,
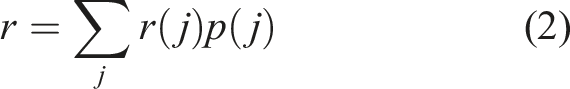
A change in the distribution of household types affects the poverty rate in two ways: first, because it shifts the poverty threshold, s, via the relationship shown in equation (1), and, secondly, because it changes the weight given to each household type in the calculation of the overall poverty rate, as shown in equation (2). In our counterfactuals we can vary these independently.
Let r(86,86,86) mean the observed poverty rate in 1986 (and likewise for 2019, which we write r(19,19,19)). Here the first argument is the year for which incomes are measured. The second argument tells us which distribution of household types is used to weight the household-type specific poverty rates to get the overall poverty rate (this is the
Using this notation, our main counterfactual poverty rate for 2019 is r(19,86,86): we use the distribution of household types in 1986 to weight the 2019 incomes in both the calculation of the poverty threshold and the overall poverty rate. Comparing this with the actual poverty rate for 2019 and observed change since 1986 allows us to see the impact that the changing distribution of household types had on that level and change. A second, and also informative, counterfactual is r(19, 86, 19): this uses the 1986 distribution of household types in deriving the poverty rate in equation (2) but the 2019 distribution of types in deriving the poverty threshold in equation (1). So in the second counterfactual we apply the observed 2019 poverty threshold rather than the threshold re-calculated with the 1986 distribution of household types.
Comparing the observed poverty rate in 2019 with the first counterfactual rate tells us the effect of the change in the distribution of household types between 1986 and 2019 on poverty: if the counterfactual rate is higher than the observed rate for 2019 this implies that the effect of the composition changes has been to reduce poverty because, hypothetically, if those changes had not occurred, poverty would be higher. Subtracting the counterfactual from the actual poverty rate in 2019, or equivalently subtracting the counterfactual change between 1986 and 2019 from the observed change, thus provides a measure of the impact of composition change on poverty over the period. The second counterfactual then allows us to see what that impact would be if the poverty threshold is not permitted to be affected, and thus infer how much of a role the shifting of the poverty threshold plays in the first counterfactual.
Like previous such exercises, these counterfactuals involve the simplifying assumption that population shares and poverty risks of particular household types are independent, so that the former can be manipulated while holding the latter fixed. The broad stability of relativities in poverty risk between different household types over time provides some reassurance in that regard.
Poverty and household composition/employment patterns
Relative income poverty levels and change, Selected countries, 1986-2019.
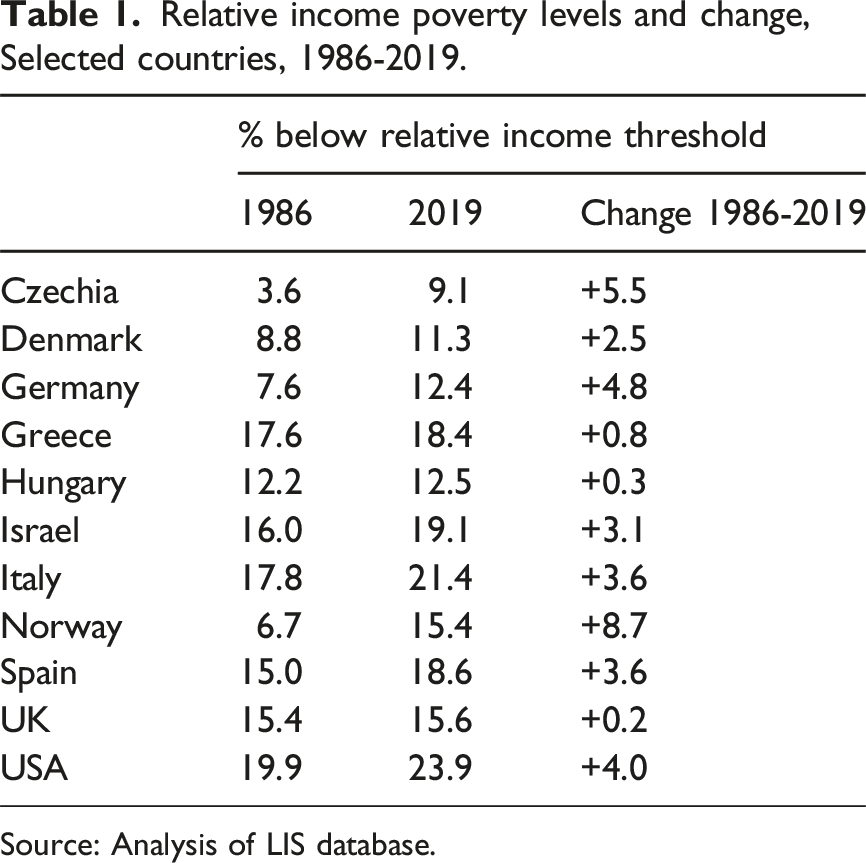
Source: Analysis of LIS database.
Poverty by Household Type 2019 (Red/Bold indicates poverty rate > 1.33 times national average, Blue/Italics < 0.66 average).
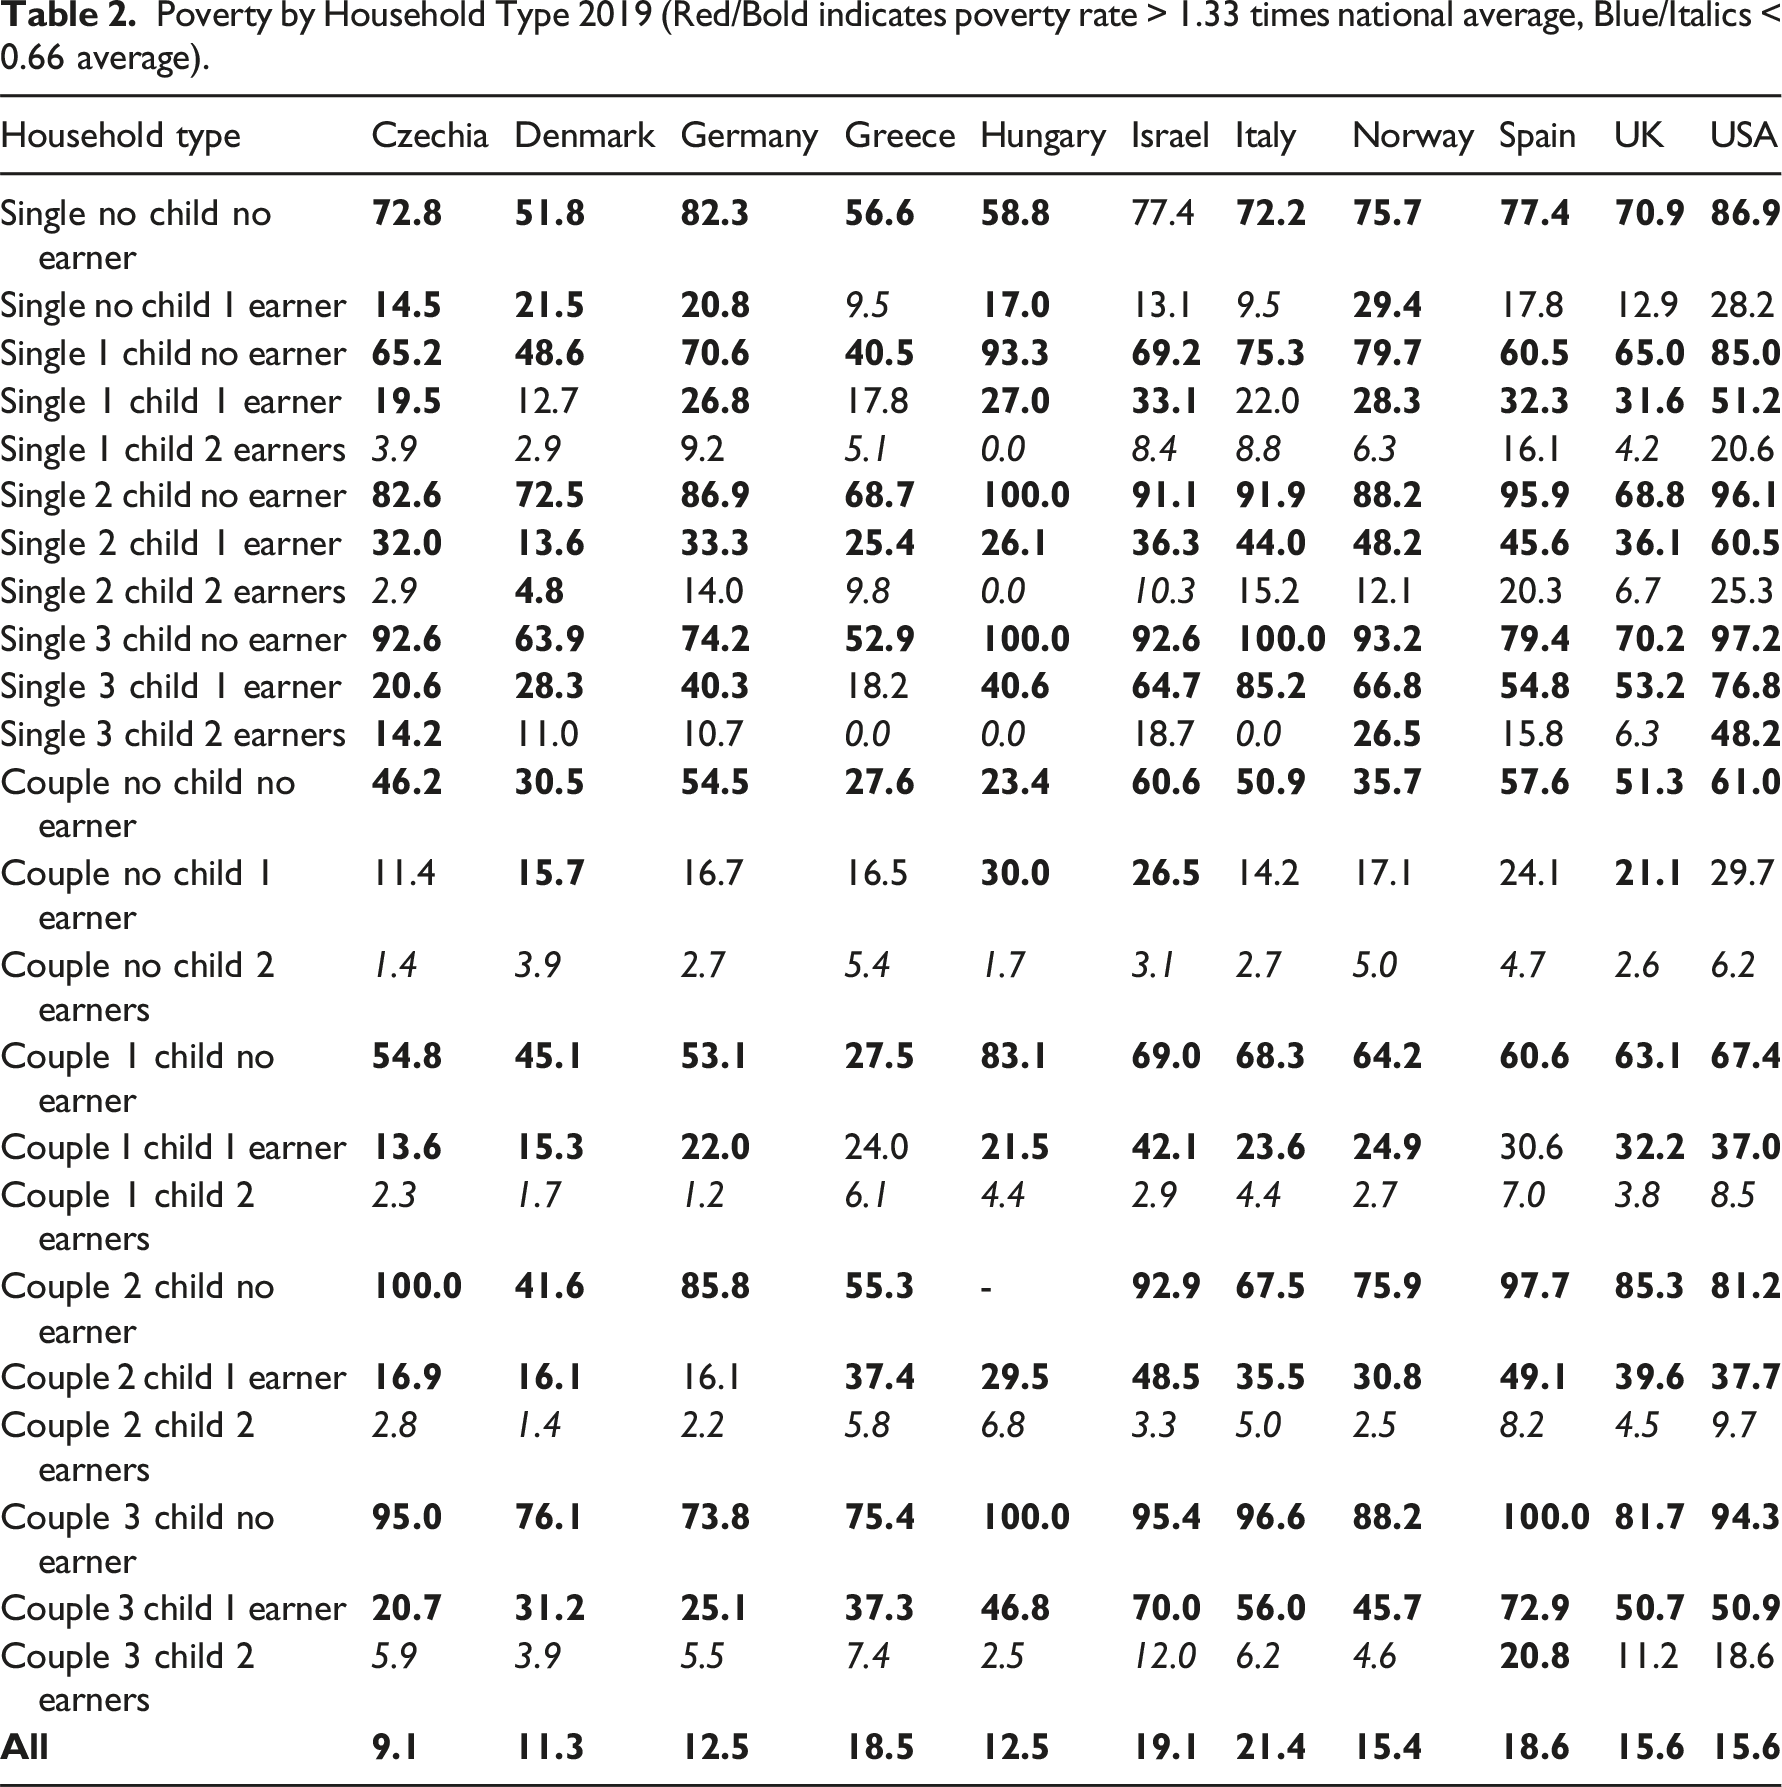
This brings out the very high degree of consistency across countries in patterns of poverty risk. Households with a single non-working adult are at above-average risk in all countries, and risk mostly increases with the number of children. Households with a single adult and children are also at above-average risk everywhere even if they contain one earner. Couple households with no earner face relatively high poverty almost everywhere with risk increasing with the number of children. Couples with only one earner and no children often face an average risk (above average in four countries), while those with children almost always have an above-average risk. By contrast, two-earner couple households almost always have below-average poverty rates, whether without or with children and irrespective of the number of children. Single adults in work with no children have an above-average poverty risk in five countries, average in four and a below-average in two.
The relative position of different household types in terms of poverty risk was also rather stable from 1986, with very few moving from above or below average to average. This underpins the expectation that a shift in the profile of these household types could have major implications for the overall poverty rate.
Patterns of change in household structure and employment
We now examine the initial composition of the samples for each country in terms of household structure and employment and how these profiles changed from 1986 to 2019 for our 11 countries. Expectations in that regard are informed by the evidence that some countries embarked on both the demographic transition and the move away from the male breadwinner model much earlier than others, associated with the evolution of gender norms as well as labour market conditions (Esping-Andersen and Billari, 2015; Goldin, 2006), with Nordic countries in the vanguard and Mediterranean ones in the rear. Presenting all 26 of our distinct household types would be unwieldy so we focus our description on more aggregated groupings to convey the key features of change. Figure 1 shows the point of departure in terms of composition in 1986, distinguishing three highly aggregated groups: single adult households (irrespective of number of earners and whether there are children), couple households with only one or no earner (irrespective of presence and number of children), and couple households with 2 earners (irrespective of presence and number of children). Importance of single adult, couple 0-1 earners, and couple 2 earner households in 1986.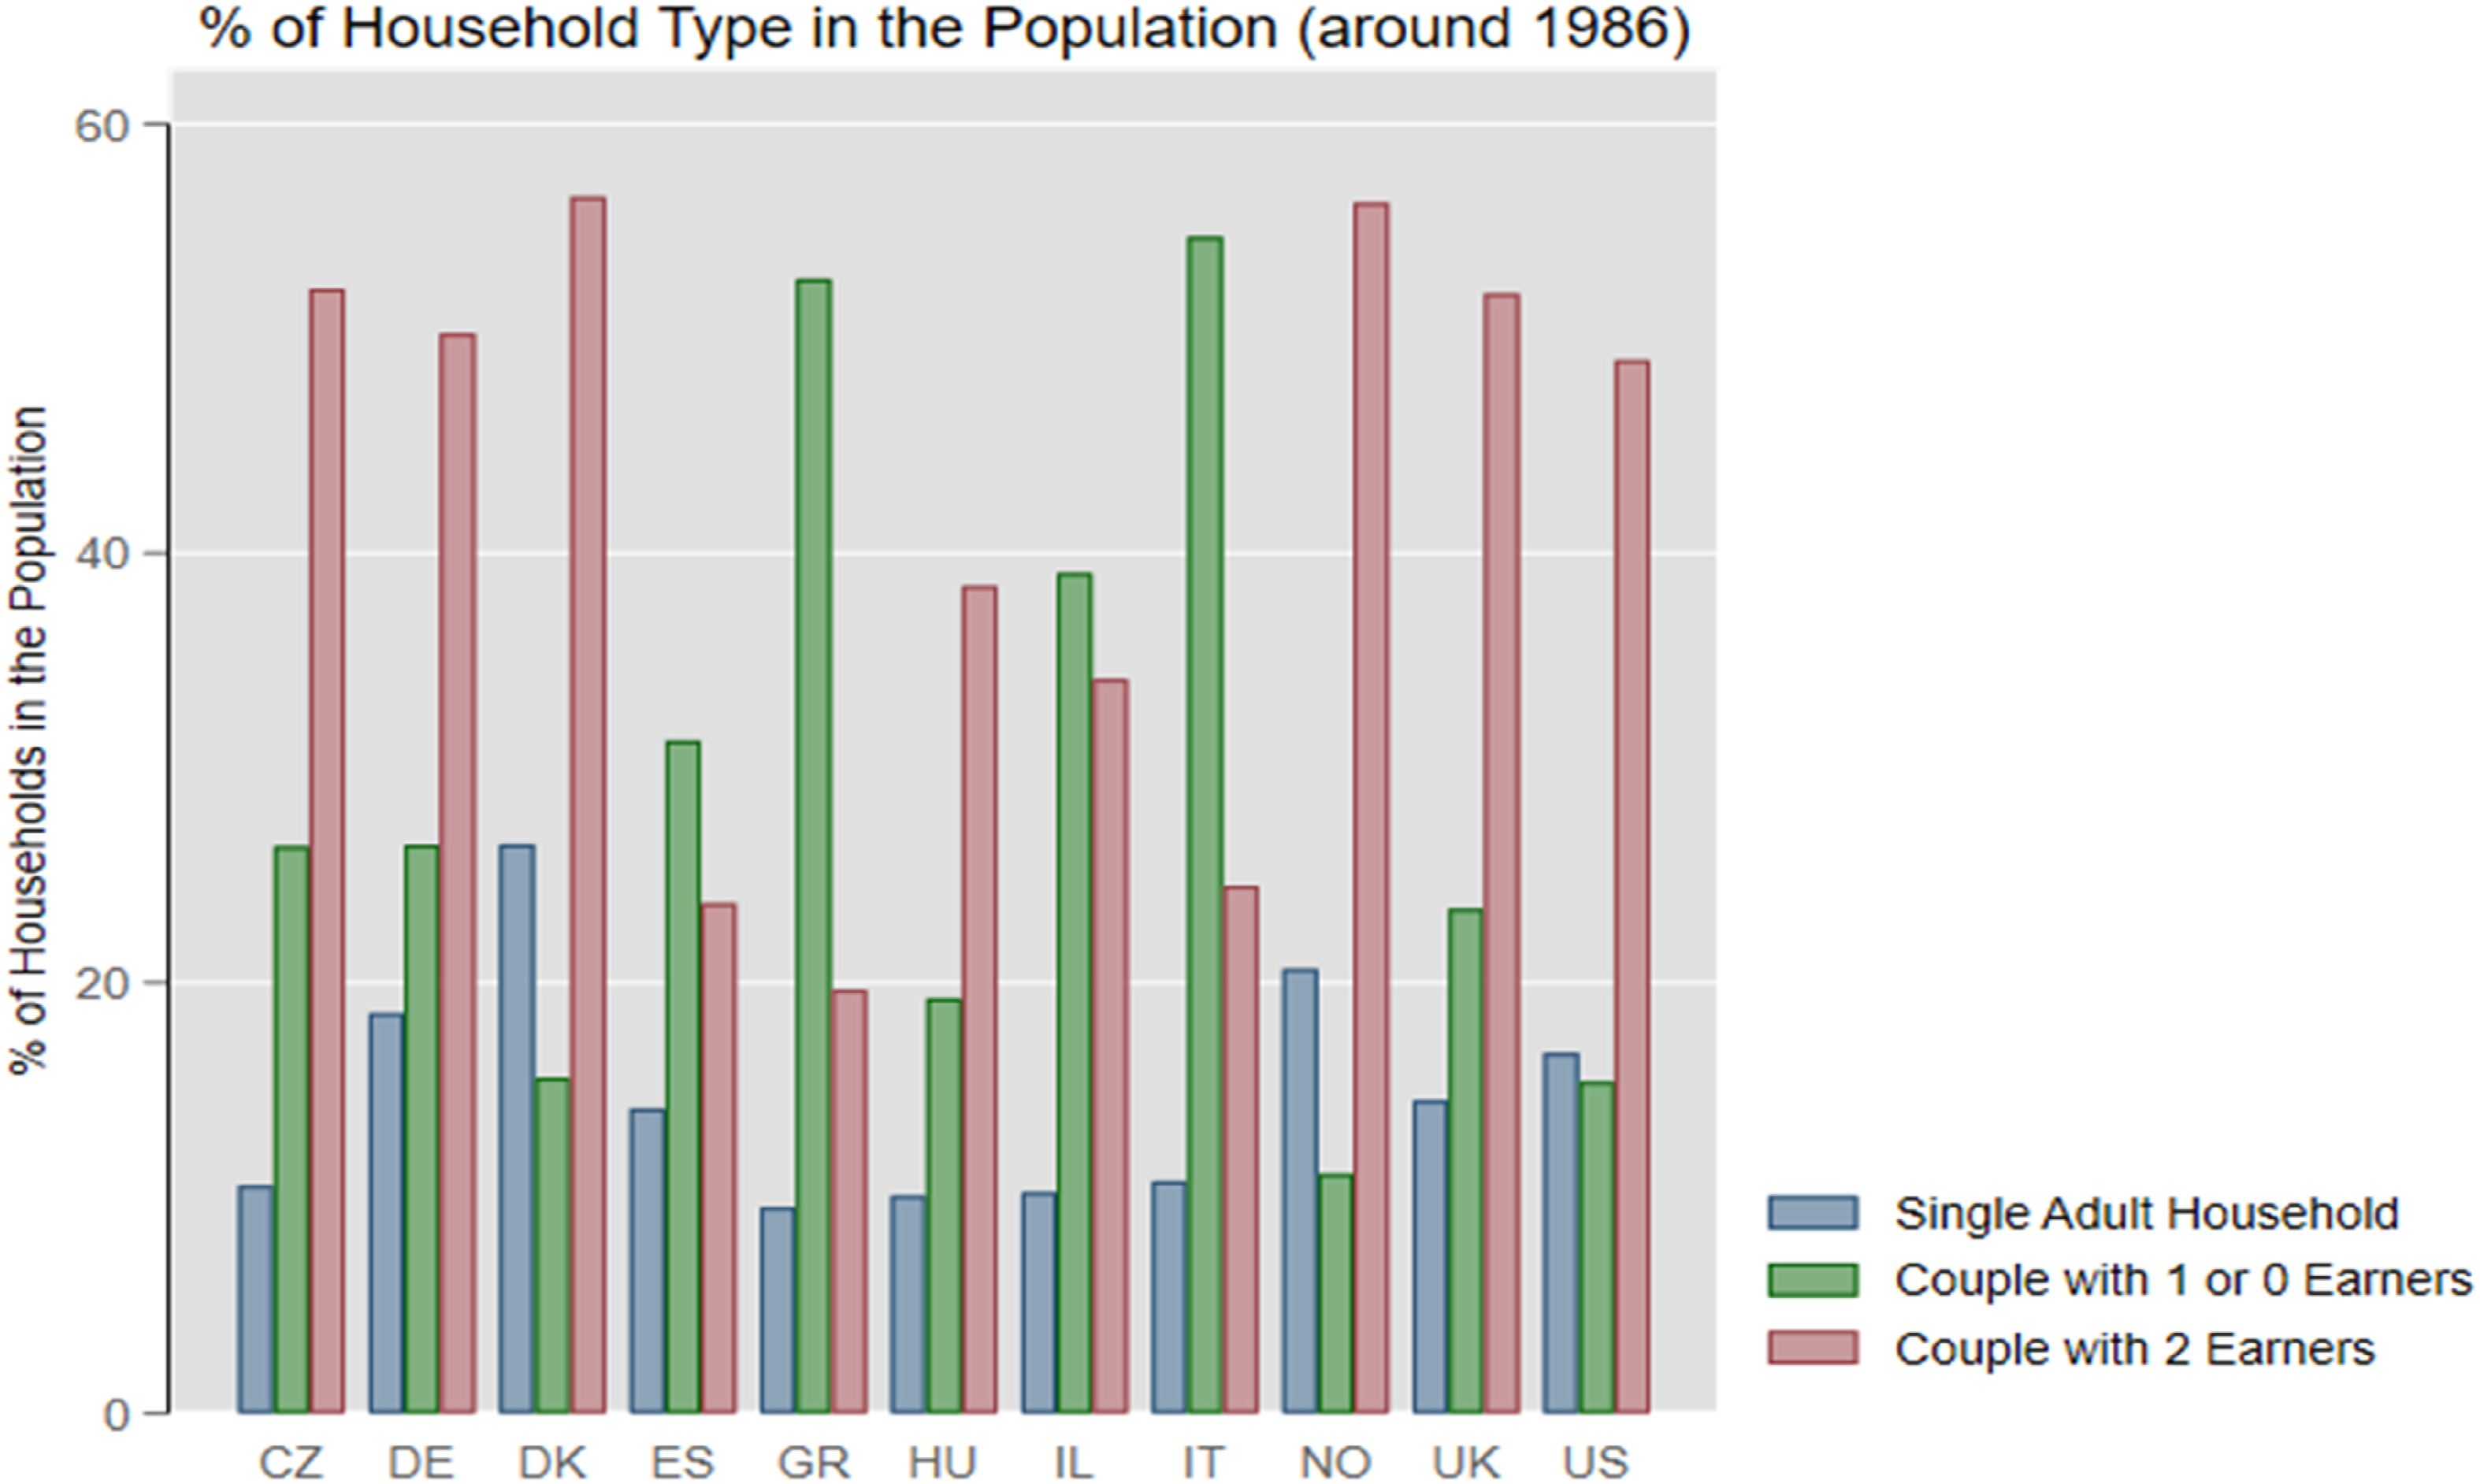
In 1986 the share of households with a single adult (with or without children) varied considerably across the countries covered, from a low of around 10% in Greece, Hungary, Israel and Italy to a high of over 20% in Denmark and Norway. The share of households comprising a couple with no-one or only one in work varied much more, from a low of about 10% in Norway up to more than half the sample in Greece and Italy. The share of couple households with 2 (or more) earners similarly ranged from around 20% in Greece, Italy and Spain up to 50% or more in Czechia, Denmark, Germany, Norway, the UK and the USA.
Given this wide divergence in initial composition, it is no surprise that the extent and nature of the changes from then to 2019 also varied widely. Figure 2 focuses first on households with a single adult. The share of these households without children and with an earner rose over the period everywhere except Denmark, especially in Italy and Norway. The share of single adult households with an earner and children also rose in most countries, now including Denmark but not Spain, Hungary, or Norway. The share of non-employed single parent households with children increased marginally in some countries but more often declined, including in the USA where it has been such a focus of attention (notably in the ‘diverging destinies’ highlighted by McLanahan, 2004). Overall, the share of single-adult only households rose in all countries except Denmark and increased particularly rapidly in Germany, Hungary, Italy, Norway and Spain, driven primarily by those without children. Changes in importance of one adult households, couple 0/1 earner, and couple 2 earner households without and with children, 1986-2010s.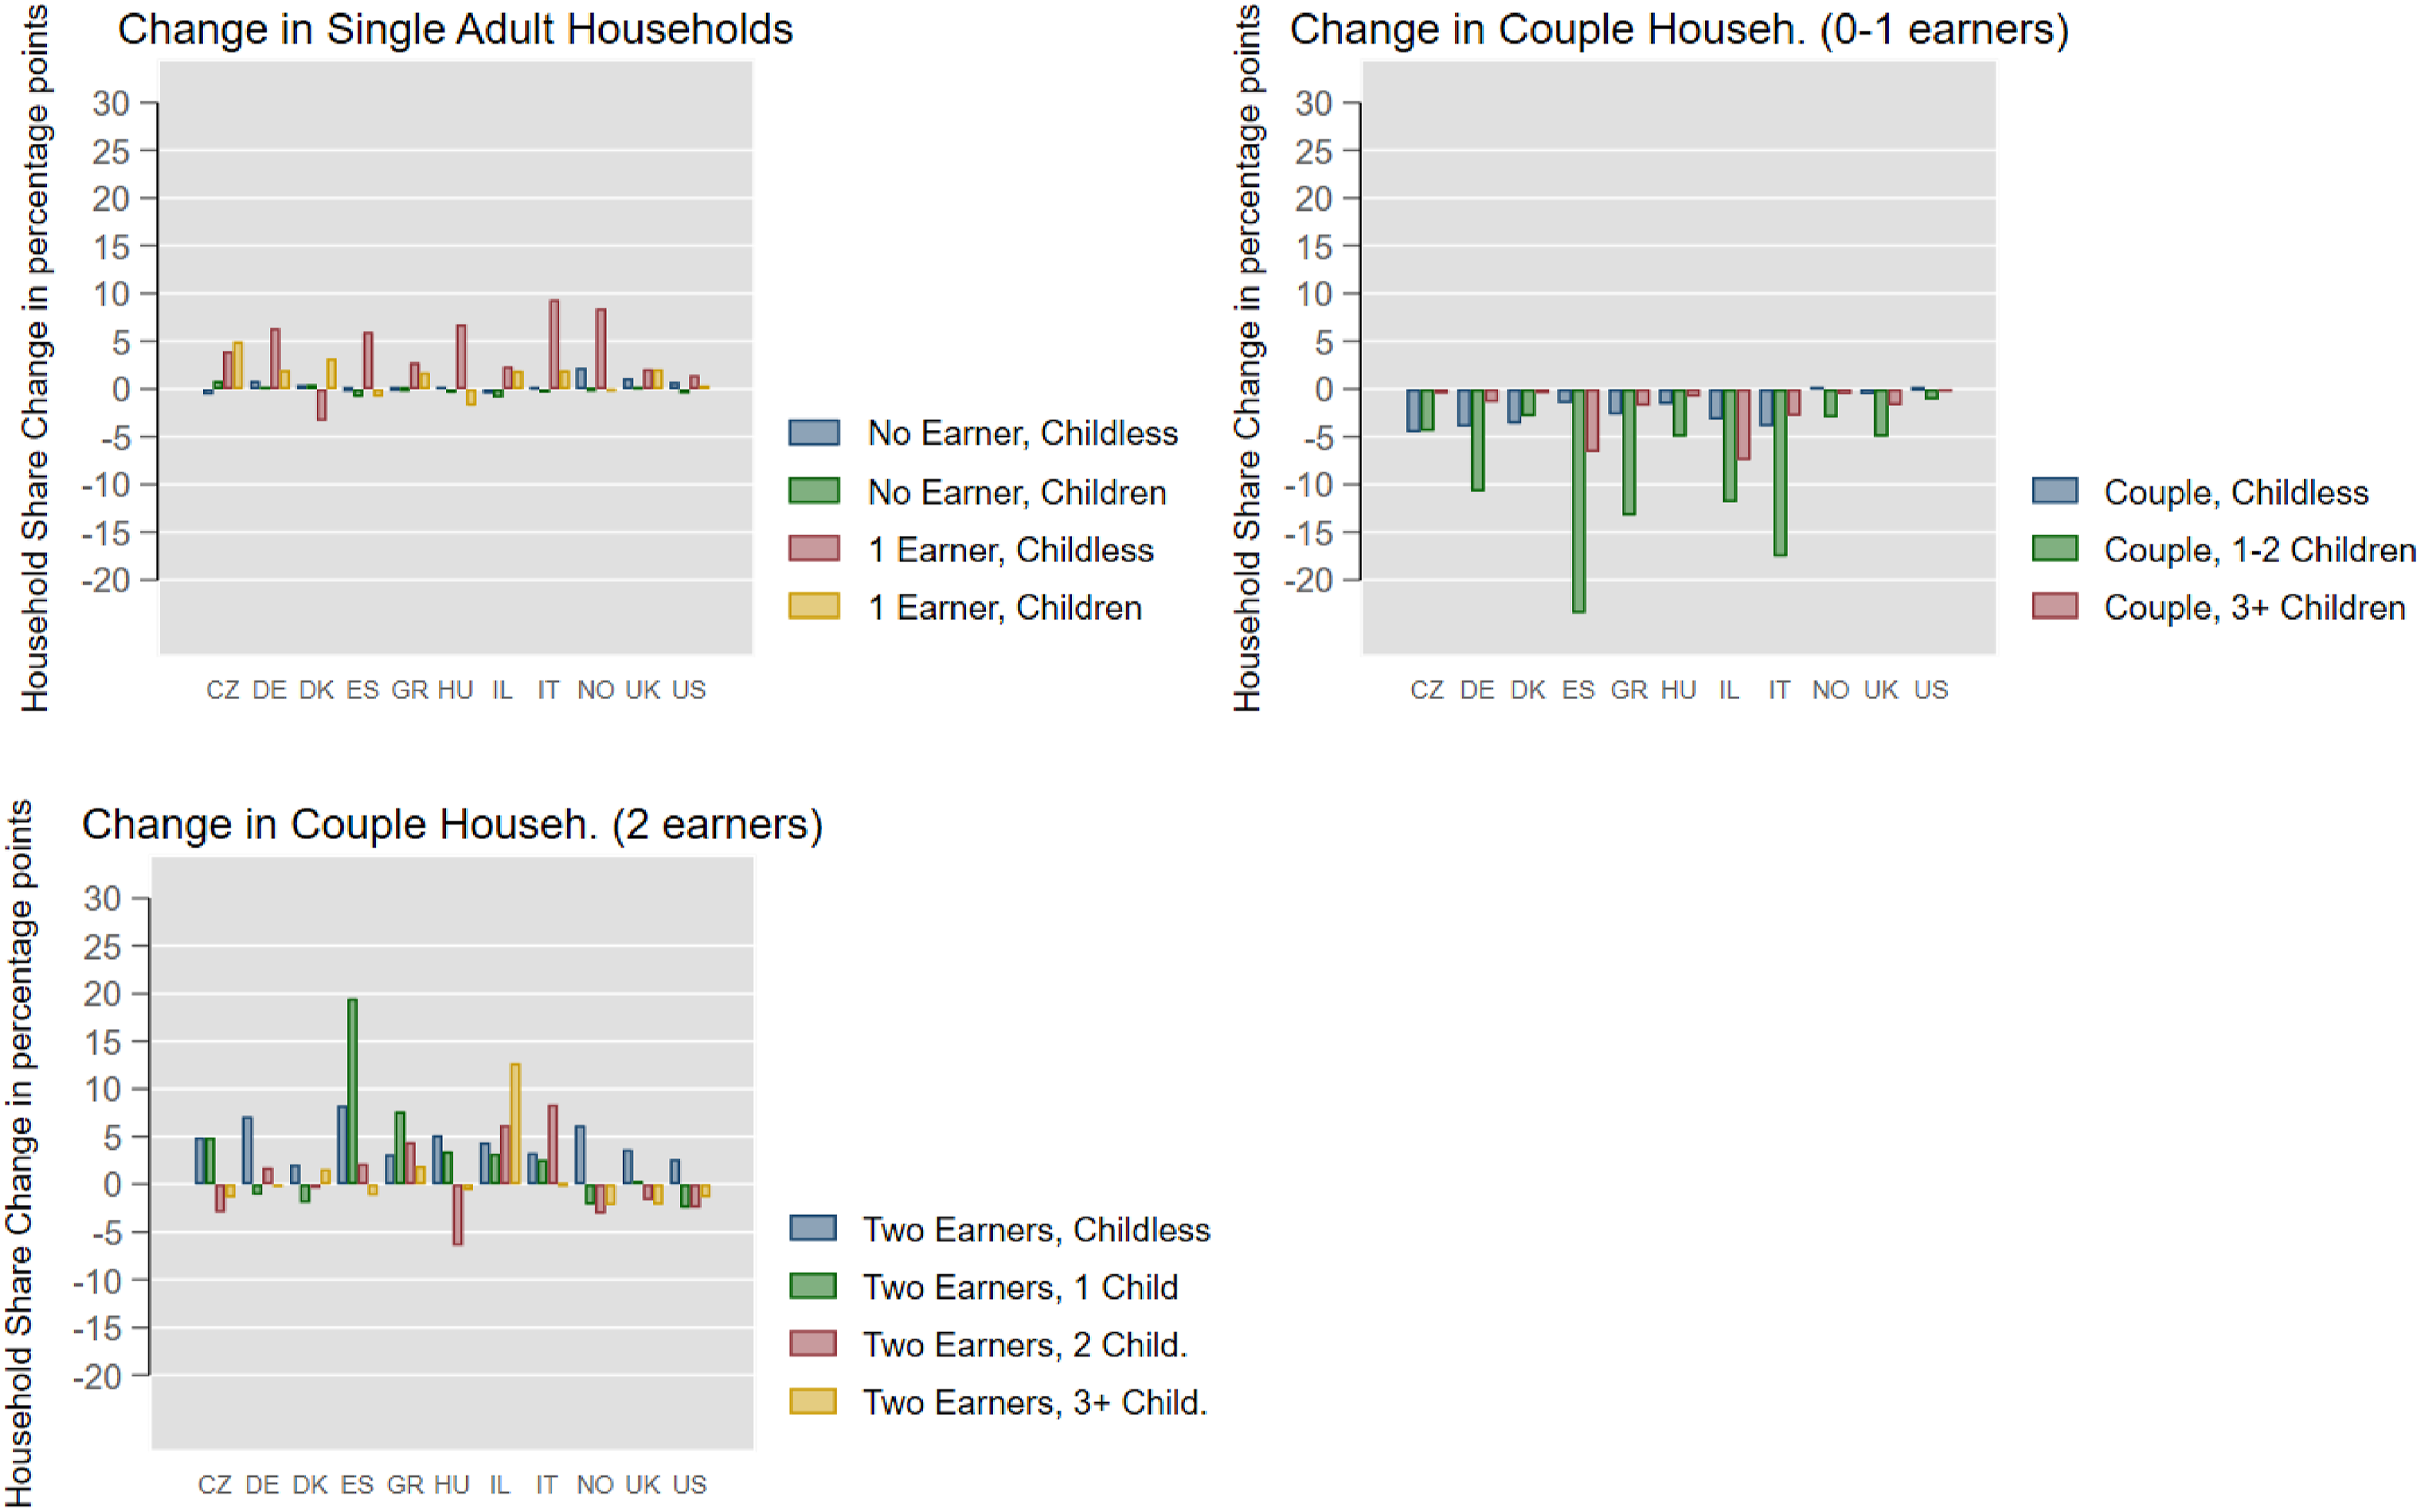
Turning to couple households, Figure 2 shows that for those with no or only one earner a decline in share was generally seen both among those without and with children, with the largest fall generally among families with 1 or 2 children, particularly pronounced in Germany, Greece, Israel, Italy and Spain. The share with 3 or more children also declined but this made much impact only in Israel, Spain, and to a lesser extent Italy. The USA stands out as having registered little change.
Finally, for couple households with two in work their share without children rose everywhere, especially in Germany and Spain. There was also a marked increase in the share of two-earner couple households with one child in Czechia, Greece and especially Spain, and in those with two children for Greece, Italy and Israel. Israel was the only country to see a marked increase for those with three or more children. Overall, Denmark, Hungary, Norway, the UK and the USA saw little or no increase in the importance of two-earner couple households because in those countries the increase in the share of such households without children was offset partially or entirely by a decline in the share with children. 2
While there are some common features, then, what is perhaps most striking is the extent of variation across these 11 countries in the extent and nature of changes in the profile of households in composition and employment taken together. At one end of the spectrum this was relatively stable in Denmark and the USA, and only modest change was seen in the UK. At the other end, Germany, Greece, Israel and Italy, and even more so Spain, saw marked change. This is consistent with the expected Nordic vs Mediterranean contrast flagged earlier, but both the very limited change seen in the UK and the USA and the large shifts in Germany are noteworthy. One would expect the impact of these changes on income poverty over the period to also vary widely, as we investigate in the next section.
Changing household structure/employment profiles and trends in poverty
We now assess the implications of these changes in household structure and employment patterns for the overall poverty rate by asking what the poverty rate in 2019 would have been if each of the household types we distinguish faced its actual poverty risk for that year, but the composition of the sample in terms of those types was the one observed in 1986. As explained in Section 3, to answer this question we reweight our 2019 samples to align their make-up with that observed in 1986, using the detailed household type categories set out in Table 2.
Relative income poverty actual versus counterfactual change, 1986-2019.
Notes: Derived from counterfactual change in poverty imposing 1986 composition in 2019 and recalculating threshold.
Derived from counterfactual change in poverty imposing 1986 composition in 2019 but leaving 2019 threshold unchanged.
Source: Authors’ analysis of LIS database.
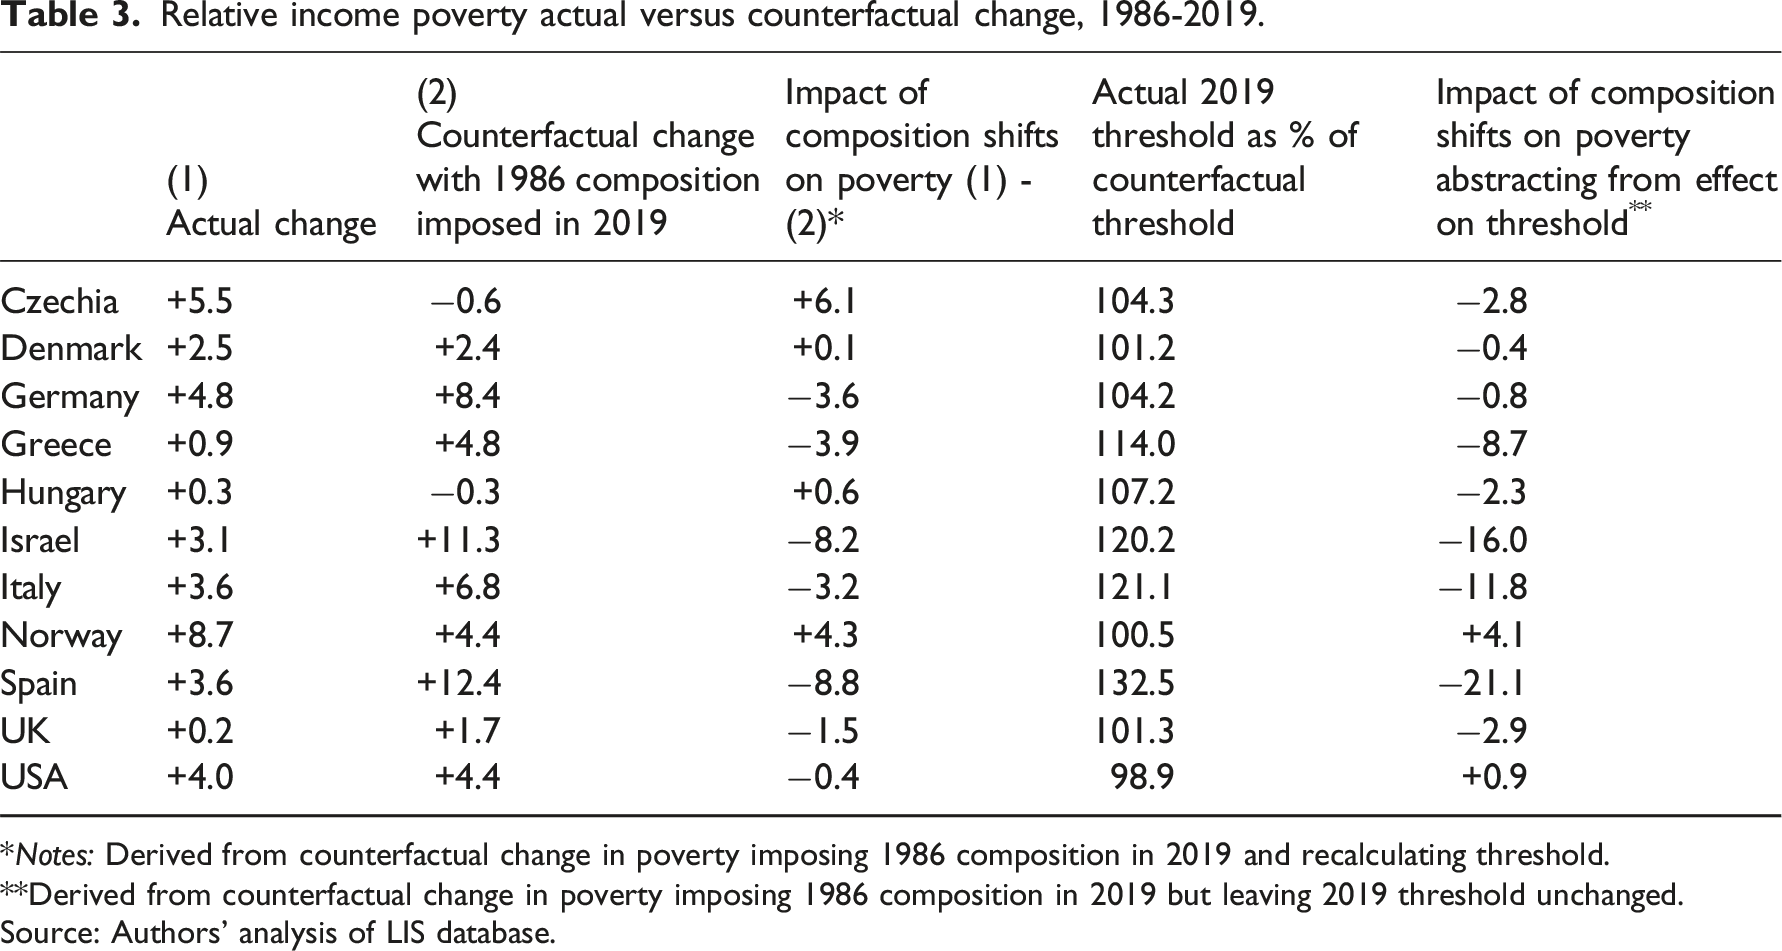
The role played by changes in the household composition/employment revealed by this counterfactual exercise is greatest in Spain, serving to bring out some of the dynamics involved. Spain saw particularly large increases in the prevalence of households comprising one employed adult or a couple with both partners employed, balanced by a decline in couples with neither or only one partner employed. This shifted the balance in the population towards household types with a below-average risk of poverty and away from ones with an above-average risk. Absent that shift, ceteris paribus, the increase in poverty would have been much greater than actually observed. By contrast, at the other end of the spectrum Denmark and the USA saw only quite limited changes in the profile of sample households over the period and no increase in the share of two-earner couple households, which is why the counterfactual exercise shows such little impact on the aggregate poverty rate.
As highlighted earlier, a potentially important aspect of the measured impact of changes in profile is that these affect mean income and thus the poverty threshold being applied in the counterfactual. Where the shift in composition increases the share of household types with below-average poverty rates this will tend to reduce poverty, but since such groups have above-average incomes it will also push up the relative poverty threshold working in the opposite direction. To assess how important a consideration this channel of influence actually is, for each country the fourth column of Table 3 shows the actual poverty threshold in 2019 as a proportion of the threshold produced by the counterfactual exercise where the 1986 composition profile is applied to 2019. The actual threshold is higher than the counterfactual one in every country except the USA – absent shifts in composition mean income would have been lower. That difference is slight in the cases of Denmark, Norway, the UK and the USA, where the change in composition was quite limited but in other countries the difference is more marked, with the actual threshold being 4% higher than the counterfactual one in Czechia and Germany, 7% higher in Hungary, 14% higher in Greece, 20% higher in Israel and Italy, and almost one-third higher for Spain.
This ‘threshold effect’ will thus have played a significant role in the counterfactual results, and an extension of the exercise to separate out that element is revealing. As outlined in Section 3, we can carry out the same reweighting exercise to impose the 1986 composition profile on the 2019 samples, but instead of re-calculating the poverty threshold we instead leave it unchanged at its observed 2019 level. This allows us to capture the impact of the composition shift over the period on poverty via the change it brought about in the share of higher versus lower poverty risk groups, abstracting from its effect on the poverty threshold itself. (Since we are using poverty thresholds set as a proportion of mean income we could derive the same results by simply applying the actual 2019 poverty rates for each household type to their 1986 shares and aggregating, as in equation (2) above, which would not be the case with median-based thresholds).
The results from this complementary counterfactual exercise presented in the final column of Table 3 show that if the effect on the poverty threshold is discounted, the composition shift over the period would have had a larger poverty reduction impact in most countries. (The alternative counterfactual poverty rates for 2019 from which these changes figures are derived are in the appendix). This difference is particularly pronounced in Israel, Italy and especially in Spain where the reduction in poverty would have been 21% compared with 9% in the main counterfactual. Thus in certain countries the use of a purely relative threshold will indeed make a substantial difference to the measured effects of changes in household composition and employment, though the extent of variation across countries in that regard is noteworthy.
Conclusions and implications for European social policy
Previous research has examined the impact of changes in household composition and employment patterns over time on overall income inequality, but their role in aggregate poverty trends across rich countries has been little studied. This is surprising given the extent to which poverty risk varies with household composition and employment. Here we examined 11 countries for which suitable microdata was available to assess the impact of changes in household composition and employment from the mid-1980s on relative income poverty rates for working-age households.
Our analysis showed first that patterns of change in household structure and employment exhibited some common features but also considerable variation across these countries. The share of households with only a single adult mostly rose while couple households with no or only one employed person fell but the scale of those changes varied widely. The share of dual-earner couples without children rose everywhere, especially strongly in Germany and Spain, but the overall importance of two-earner couple households did not increase in Denmark, Hungary, Norway, the UK and the USA because that was offset by a decline in the share of such households with children. These differences in the extent and nature of composition changes reflected very different ‘initial conditions’ in those terms in the 1980s. The rise in dual-earner households was most pronounced in the Mediterranean countries which embarked on the ‘gender revolution’ in women’s family and employment outcomes (Esping-Andersen and Billari, 2015; Goldin, 2006) much later than Nordic and Anglo-Saxon countries, while Germany has also followed a distinctive path.
We then examined the impact of these shifts in household structure and employment by applying counterfactual reweighting techniques similar to those used in studies of earnings and income inequality. Our principal counterfactual exercise found that in the absence of changes in composition the relative income poverty rate would have risen a good deal more from the mid-1980s than it actually did in Germany, Greece, Italy, and especially Israel and Spain. In contrast, changes in composition had little impact on the poverty rate in Denmark, Hungary, the UK or the USA, and contributed to increasing that rate modestly in Czechia and Norway.
A complementary counterfactual exercise to abstract from the impact that these composition changes had on the relative income poverty threshold itself showed that this ‘threshold effect’ played little role in Denmark, Norway, the UK and the USA whereas for Spain it was very important: when the compositional changes were not allowed to push up the poverty threshold, the positive impact of these changes on poverty there was more than twice as large.
The cross-national variation in the counterfactual results reflects the underlying variation in the shift towards more households with a) more earners and b) fewer dependents and away from ‘traditional’ couple-households with one earner and children - with Spain, for example, seeing the largest increase in dual-earner couples with one child and the largest decline in single-earner couples with one or two children. This in turn reflects both differences across countries in their initial household structure and employment profiles at the start of the period and in the pace of change, influenced by national tax, social security, labour market and family policies in ways which further research can usefully tease out.
These findings have significant implications for social policy at European and national levels. At the European level, performance vis-à-vis the employment and social targets of the European Pillar of Social Rights (EPSR) Action Plan is critical for the EU’s socio-economic policies. Performance with respect to the central poverty and social exclusion target, framed in terms of the ‘at risk of poverty and social inclusion measure’ (AROPE) incorporating relative income poverty, severe material deprivation and household worklessness, has not matched up to the success in increasing employment rates. As brought out in the recent study of the relationship between the two by Tóth et al. (2024) employment rates reached a peak before the outbreak of the COVID-19 pandemic but the EU AROPE 2020 target was not achieved, and the purely relative income-based at-risk-of-poverty (AROP) rate was stable or increasing in most member states from 2005. Influenced by US debates, the fragmentation of families and households and increasing polarisation into dual-earner versus workless households have been advanced as contributory factors, as has assigning too great a role to purely relative income poverty measures in assessing progress. Our findings bear directly on these claims.
They show first that such an over-arching narrative of fragmenting households and increasing dominance of dual-earner couples does not in fact apply to the countries studied. Their experiences varied widely, and even for the USA such a narrative applies only partially with dual-earner couples not becoming more dominant overall. We then saw that the changes in household structure and employment taken together were such as to have a positive or broadly neutral rather than negative impact on poverty, even employing a purely relative income measure. This highlights the importance of incorporating both household structure and employment patterns into analysis seeking to understand the forces driving trends in poverty and the challenges facing policy-makers: focusing on specific negative features, or on changes in either structure or employment alone, may obscure the overall implications of long-term composition trends.
While a negative perspective on structure/employment composition change is unwarranted, the way employment growth is distributed among households remains crucial to its impact on poverty. Simulations presented in Tóth et al. (2024) show that if job growth were to reach the unemployed and (quasi-)jobless households first, its impact on poverty rates could be significantly greater. Factors such as the quality of those jobs in pay terms and the capacity of the social protection system to reduce poverty among those out of work are also seen as important, but ways to target jobs more on these relatively hard-to-reach groups would contribute significantly to poverty reduction strategies at both European and national levels.
Finally, our findings have implications for reliance on purely relative income poverty thresholds in monitoring poverty. This is widely questioned in research and policy evaluation, as reflected in the widespread practice of also using complementary income poverty thresholds ‘anchored’ at a point in time as well as non-monetary deprivation indicators, both included in the EU’s suite of social inclusion indicators. The issues raised by the types of composition change discussed here can be seen within this broader context but are also distinctive. Having standards of adequacy/inclusion rising broadly in line with a generalised increase in living standards shared by different types of households is consistent with the core logic of seeing poverty as a relative concept. Where an increase in mean/median incomes is driven by an increase in the share of dual-earner households, though, assuming that standards of adequacy for other types of household rise ‘in lockstep’ is more open to question. A single adult household may not necessarily take a dual-earner couple as their reference point in assessing the adequacy of their own standard of living, though having more dual-earners could drive up certain costs for everyone, most obviously housing. Another consideration is that additional costs arise from having both partners in paid work, notably child-care and domestic services, so the increase in disposable income in moving from one to two earners (which is what affects relative poverty thresholds) may exaggerate the improvement in the household’s living standards. We found that relative thresholds were driven strongly upwards by composition change in only a few of the countries we studied, but these complexities reinforce the need for more research on how perceptions of income adequacy are formed and best reflected in measures of poverty.
Supplemental Material
Supplemental Material - Changing household structures, household employment, and poverty trends in rich countries
Supplemental Material for Changing household structures, household employment, and poverty trends in rich countries by Leo Azzollini, Richard Breen, Brian Nolan in Journal of European Social Policy
Footnotes
Declaration of conflicting interests
The author(s) declared no potential conflicts of interest with respect to the research, authorship, and/or publication of this article.
Funding
The author(s) disclosed receipt of the following financial support for the research, authorship, and/or publication of this article: This work was supported by the H2020 European Research Council, 856455 Synergy Project DINA.
Supplemental Material
Supplemental material for this article is available online.
Notes
References
Supplementary Material
Please find the following supplemental material available below.
For Open Access articles published under a Creative Commons License, all supplemental material carries the same license as the article it is associated with.
For non-Open Access articles published, all supplemental material carries a non-exclusive license, and permission requests for re-use of supplemental material or any part of supplemental material shall be sent directly to the copyright owner as specified in the copyright notice associated with the article.