
Abstract
Improved operational flexibility of gas turbines can play a major role in stabilising the electric power grid, by backing up intermittent renewable power. Gas turbines offer on-demand power and fast dispatch of power that is vital when renewable power reduces. This has brought about increasing demand to improve the ramp-up rate of gas turbines. One approach is through the injection of compressed air from energy storage or an auxiliary compressor. This method is the focus of the present work, which shows for the first time, the implications and limits of compressor air injection in a high-fidelity Computational Fluid Dynamics model (CFD). The 3D multi-stage model of the compressor was developed in ANSYS CFX v19.2, while the boundary conditions related to the injection cases have been obtained from a corresponding 0D engine model. The upper limits to air injection determine how much air can be injected into the engine, providing indicative values of power augmentation and ramp-up rate capabilities. These have been previously addressed by the authors using 0D models that do not consider the compressor aerodynamics in great detail. The CFD study has shown that for power augmentation, 16% of compressed air (based on compressor exit) is allowed based on the onset of stall. It also shows that increasing air injection amplifies losses, blockage factor and absolute velocity angle. Also, about 30% of the blade span from the hub is dominated by a rise in the total pressure loss coefficient, except the outlet guide vane for which separation occurs at the tip. For the ramp-up rate analysis, up to 10% air injection is shown to be sustainable. The work shows that the improvements in the 0D analytical engine model are plausible, in addition to demonstrating similar limits at different ambient temperatures.
Keywords
Introduction
National and international policies impose ambitious targets towards the decarbonisation of the energy industry. If the net-zero target is achieved by the EU, UK, Canada, Chile and New Zealand by 2050, and also China by 2060, the electric power grid will be dominated by renewable energy sources (RES). However, the intermittent nature of RES and the on-demand dispatch capability of gas turbines, makes the engine crucial to the sustenance of RES. As such, gas turbine (GT) engines may become a secondary power source, turned on when intermittent RES generation falls. Heavy-duty gas turbines could be adopted to operate under such conditions by coupling with compressed air energy storage (CAES) or with a large auxiliary compressor. The CAES system provides stored higher-pressure air than that of the GT maximum, to allow for air injection for power output augmentation or ramp-up rate increase. Existing research specifically on GT air injection includes1–3 that covers power augmentation, and3–5 that addresses the improvement of engine ramp-up rates. The previous study by Igie et al. 1 indicated that it is possible to elevate the GT power output by 36% through 17.5% air injection at the back of the compressor, keeping the combustor outlet temperature (COT) fixed. It also shows that the surge limit can be reached through air injection and can vary depending on the compressor design. In the analytical work by Quintero et al., 2 air injection was deployed at lower density conditions, to restore a GT power through compressed air injection. The works of Abudu et al.3,5 shows an analytical engine-level analysis of air injection behind the compressor, for heavy-duty GT and aero-derivative engines respectively. The former shows that up to 25% power augmentation is allowed without infringing on the surge margin. This was achieved with 15% air injection (with regards to the back of the compressor flow). For the ramp-up rate investigation, the referred study implemented different injection rates (between up to 2% and up to 10%). As such, obtained a range of potential ramp-up rates that forms the basis of the ramp-up rate schedule in this study. In the comparable work 5 on the aero-derivative engine-level analysis, the multi-spool configuration brings about different directions of change in the surge margin of the low-pressure compressor (LPC) when compared to the high-pressure compressor (HPC) in the LM6000-type arrangement (fixed LPC rotational speed and variable HPC speed). However, when both shaft rotational speeds vary (by design), the change in surge margin during air injection was in the same direction (reduced). The study showed that airflow injection of 8% augments the power output of aero-derivative engines up to 21%. Also, with up to 10% air injection, the ramp-up rate doubled. This, therefore, highlights the potentials of the aero-derivative engines in comparison to the heavy-duty GT engines. Nonetheless, there are more heavy-duty machines on the electric power grid, due to their size (related to the economy of scale) and their ability to provide inertia for grid stability. These large engines are often in combined cycle gas turbine (CCGT) mode, to increase the cycle thermal efficiency from 40% (stand-alone engine) to about 60%. Abudu et al. 6 show the benefit of air injection for the overall CCGT operation. The mentioned study proved that gains in power augmentation and ramp-up rate for the stand-alone GT (topping cycle) extend to the steam turbine in the bottoming cycle. However, the overall percentage increases for the CCGT are lesser than the stand-alone GT. Another related study in open literature includes the work of Kim and Kim 4 that focuses on a light-duty engine with variable speed. The study also highlights the ramp-up potentials of compressed air injection. Salvini 7 shows the performance improvement and power augmentation for a small GT engine. For the practical application of compressor air injection in the power sector, a relevant example is Powerphase 8 where this approach is utilised to boost the power output of an actual aero-derivative engine.
The open literature shows limited studies on compressed air injection for gas turbine power augmentation and ramp-up rate improvement. A related area includes rotor tip air injection for surge margin improvement. However, this typically involves a small amount of air around 1–3% of the main flow9–11 and typically through recirculation of bleed air from the same compressor. Nonetheless, existing works on power augmentation and ramp-up rate improvement through air injection are based on analytical thermodynamic studies with low-fidelity models. Hence little is known about the aerodynamic implications of compressed air injection in this context. This is crucial, given that complex aerodynamic behaviour that leads to stall is not captured in low fidelity models. Crucially, the onset of stall is a limiting factor in the amount of air injected. This makes the investigations into the compressor aerodynamics, important for power augmentation and ramp-up capability. Currently, no study in the published literature presents the aerodynamic effects of compressed air injection, relevant to power augmentation and ramp-up rate improvements. The present study for the first time has demonstrated this with a 3D multi-stage compressor using Computational Fluid Dynamics (CFD). This high-fidelity model is that of the last three stages of a heavy-duty gas turbine engine. A 0D analytical engine model presented in Abudu et al.
3
has also been implemented as a way of providing inlet and outlet boundary conditions for the 3D analysis. In addition to this, the analytical engine model is used to establish the ramp-up rate flow injection scheme adopted in this study. The key contributions of this work are: • demonstration of the aerodynamic implications of compressed air injection at the back of the compressor, showing the physical phenomenon and flow details that influence the limit of the maximum amount of air injection • comparative assessment of a 0D low-fidelity model and a 3D high-fidelity model • verification of 0D engine ramp-up rate improvements using 3D CFD component analysis
The 3D CFD compressor analysis can be considered as a zooming approach of the 0D engine model. This, therefore, provides a lot of details of the compressor flow field, while relating that to an overall engine behaviour/performance. A 3D CFD study on the compressor component at high volume air injection has not been investigated in much detail in the public domain. The related experimental work is blade tip air injection for turbofan compressor configurations.
0D analytical engine model and performance
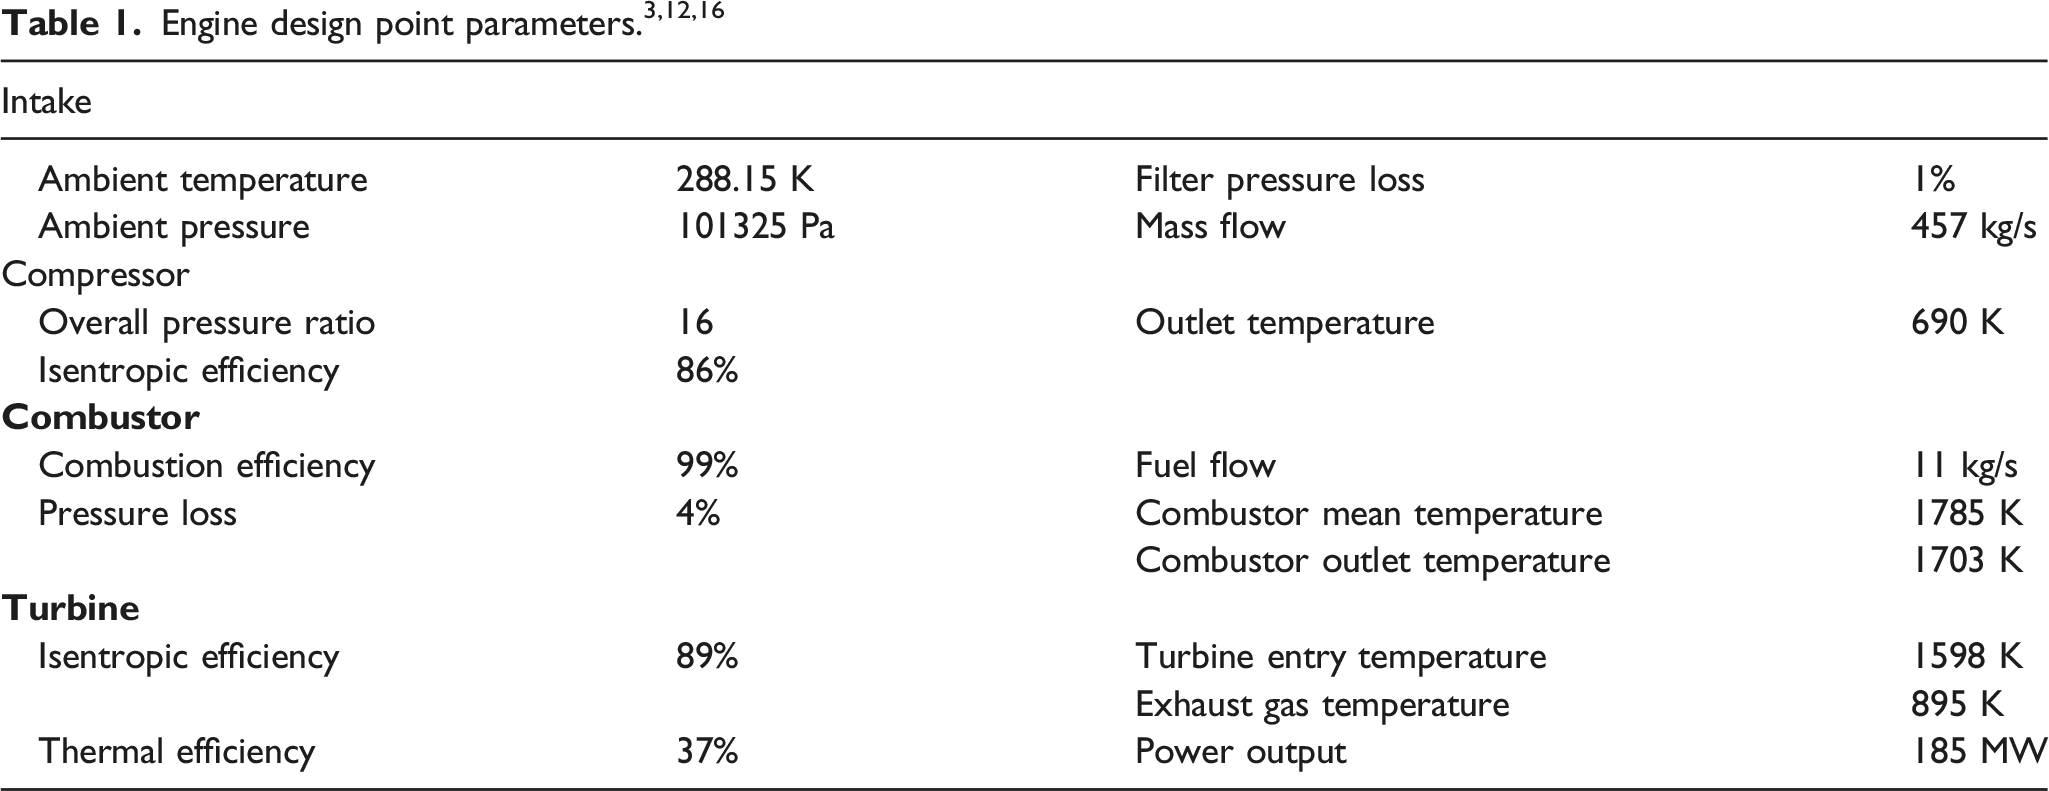
The details of the analytical engine model used for the investigation are presented in this section. This engine model is also shown in Abudu et al. 3 which presents detailed information of the engine performance at the design point and is validated with the Original Equipment Manufacturer (OEM) data. The simulation cases of power augmentation and ramp-up rates are also described in the work from an engine-level thermodynamic analysis perspective. Similarly, some of the engine performance details are presented in Szymanski et al. 12 that is related to the present study, though with a different context (air extraction).
The engine model of a heavy-duty gas turbine was developed with TURBOMATCH software, an in-house Cranfield University gas turbine performance simulation code. It has been proven in a variety of cases, including jet engines13,14 and other stationary gas turbines configurations.5,15 The tool uses the Newton-Raphson method in solving the non-linearity problem of various rotating components (compressor and turbine) matching. The turbomachinery components are defined by generalised/standard component maps that are embedded in the software. These maps are further adjusted or scaled based on user-defined inputs like mass flow, component efficiency, surge margin and pressure ratio. The formulation for these is presented in Abudu et al.
16
and MacMillan.
17
Figure 1 presents the engine layout, which consists of four lumped compressor stages, a combustor section, and the turbine section. All cooling ports (for combustor and turbine cooling) are included in the model. As indicated in the figure, air injection takes place at the back of the compressor (behind compressor 4). It should be noted that compressor 4 is equivalent to the 3D multi-stage compressor, and the inlet and outlet boundary conditions are used for the analysis of the numerical model. Figure 1 also shows a dummy CAES and auxiliary compressor that can be used as a source of air injection in practice. The CAES may utilise compressed air extracted from the same engine (though will have to be further pressurised) or an auxiliary compressor with larger operating pressure than the GT. Engine model layout and schematic showing possible sources of compressed air.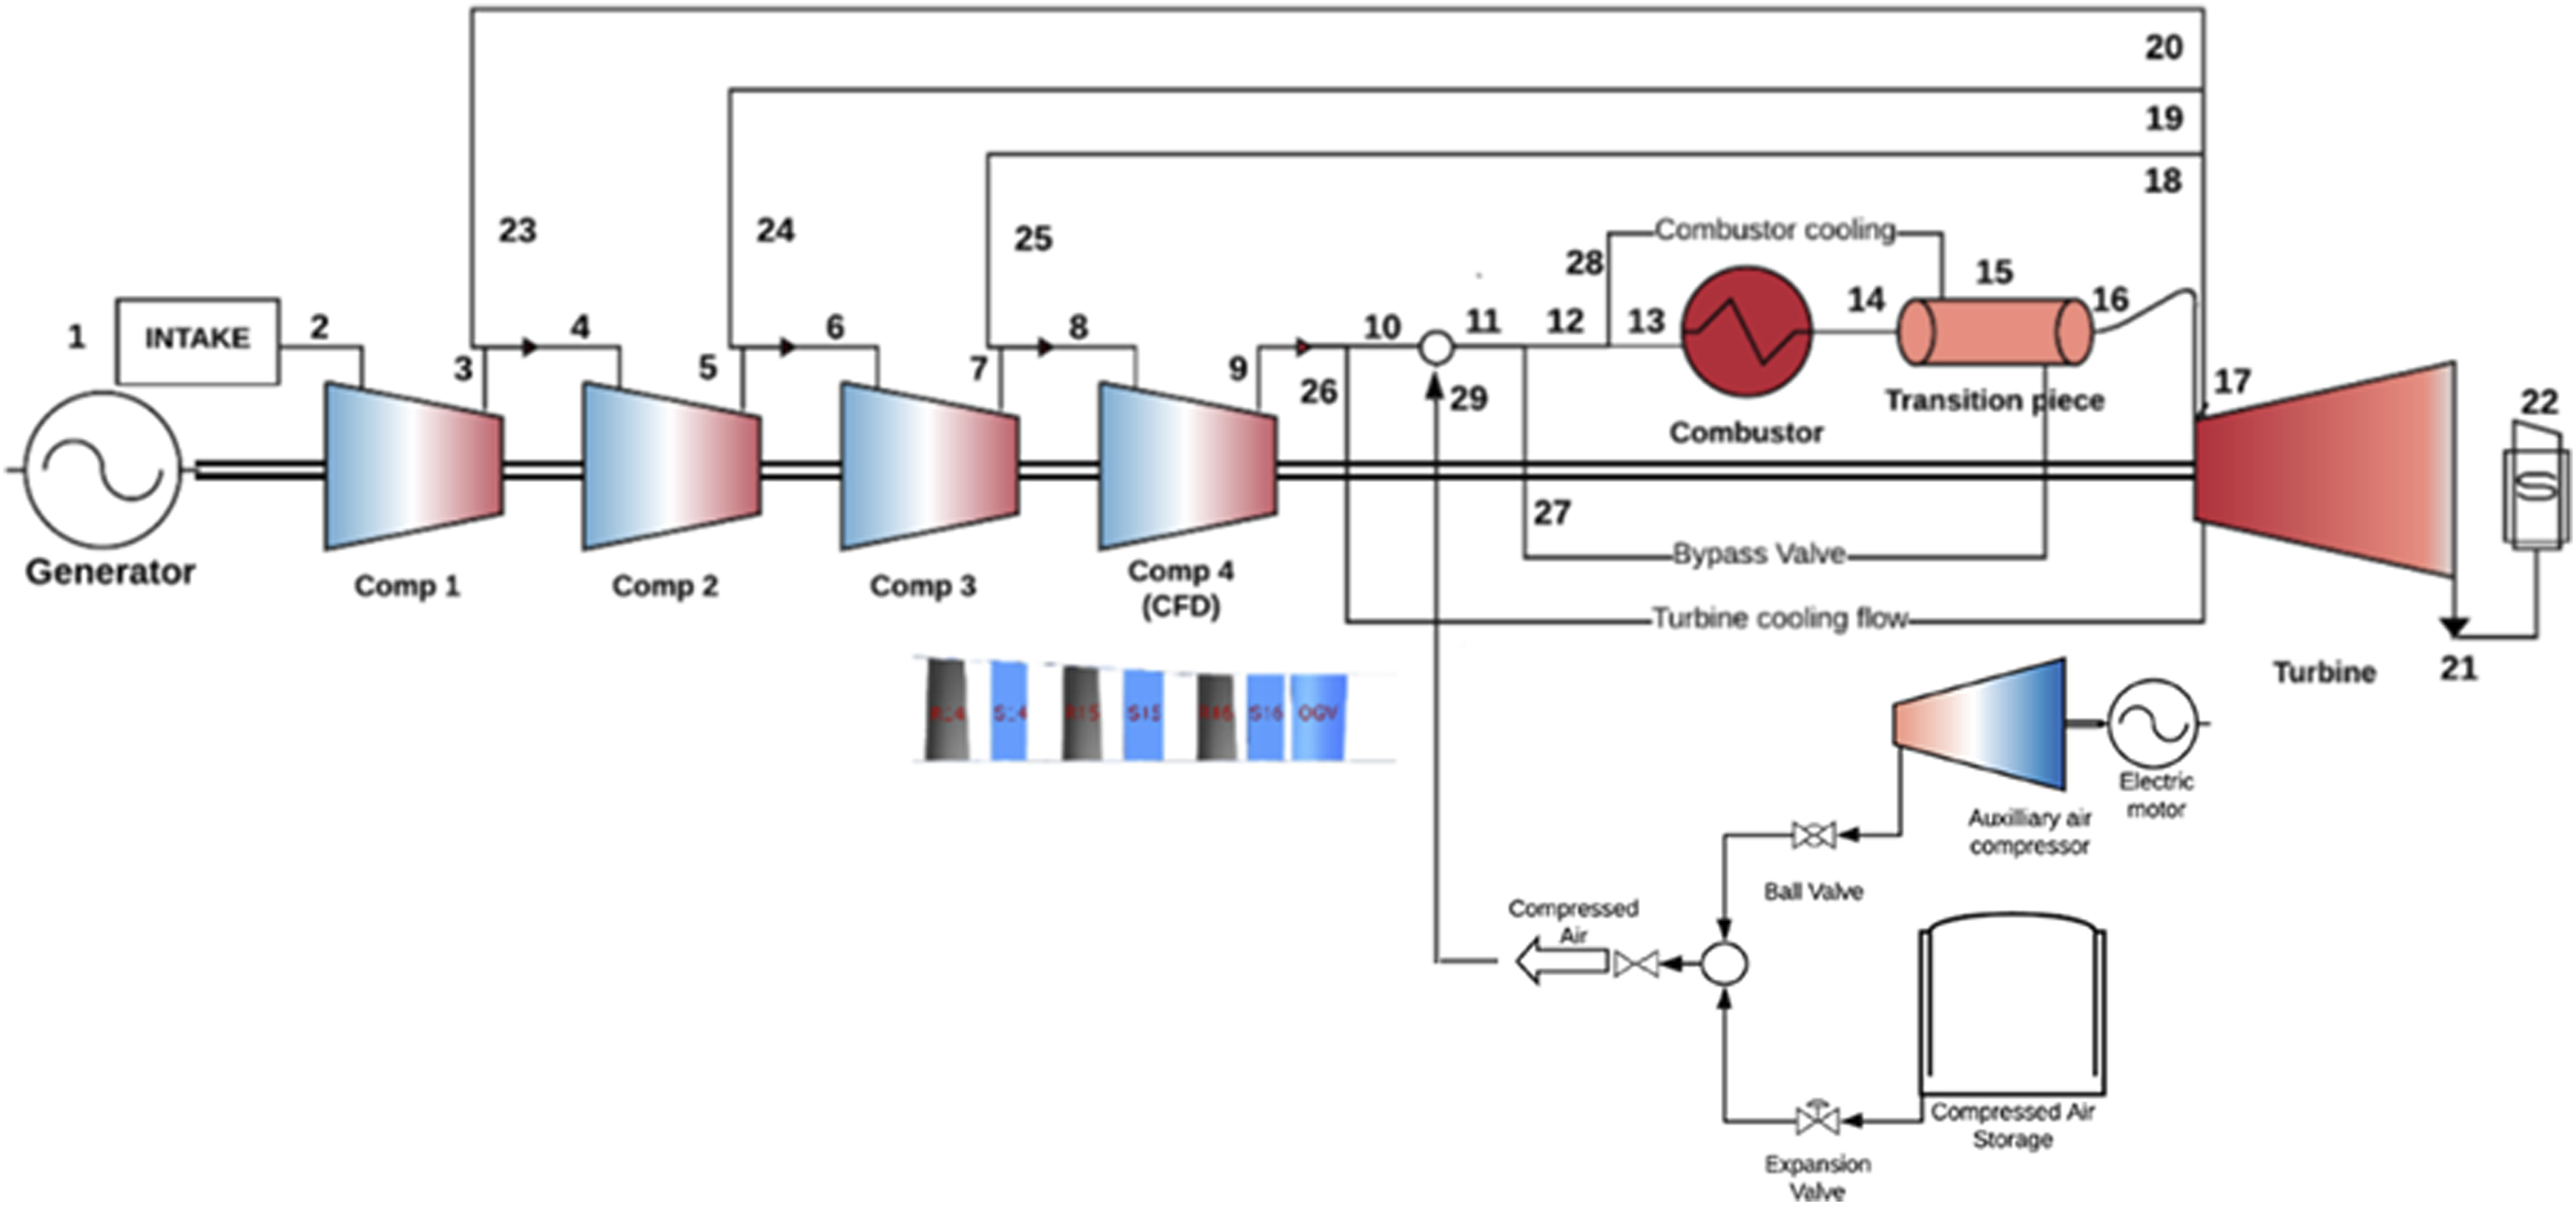
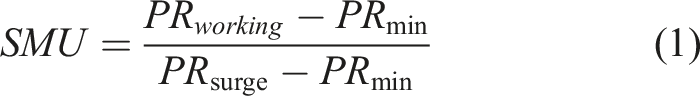
For sufficient context and introduction to the 3D CFD analysis, simulations of the engine performance are presented in Figure 2. This shows the effect of air injection for power augmentation when COT is fixed. For this case, different ambient temperatures (−5°C, 15°C and 30°C) are considered, with an interest in the low and high ambient temperature that is typically characterised by high and low SMU respectively. The injection rate considered is up to 22% of the compressor discharge flow. The high values of injections are only applicable to high ambient temperatures and not at ISO conditions (ambient temperature of 288.15 K, pressure of 1 bar and relative humidity 60%). Firstly, the impact of ambient temperatures on the power output, exhaust gas temperature (EGT) and thermal efficiency are typical. Power output increase (towards the right of the figure) for the low ambient temperature, due to increased density and air mass flow, related to higher compressor pressure ratio. With a fixed COT, the fuel flow increases with the increased mass flow, to maintain the temperature constraint. At lower ambient temperatures, the increased mass flow (air plus fuel) in the turbine is such that more work is done in the turbine that is greater than the additional work of the compressor. This consequently leads to higher network output or power output. The higher work done in the turbine brings about greater expansion, leading to lower EGT as shown in the figure. The opposite is the case for higher ambient temperature, which also explains that for the same COT, the turbine work is less and hence a higher EGT. The higher thermal efficiency at low ambient temperature is prevalent given that the power output increases, also in greater magnitude than the rise in the fuel flow (heat input). Similarly, the injection of compressed air at fixed COT has a similar effect as a low ambient temperature operation. The figure also shows that the increase in injection brings about higher power output and thermal efficiency but lower EGT. As such, the lowest EGT in all the cases is at the lowest ambient temperatures with the highest injection rate. It also shows that the range of injection (and hence maximum) for the higher ambient temperature is wider than for the low ambient condition. This is limited by surge margin, discussed subsequently. Engine performance with air injection at various ambient temperatures.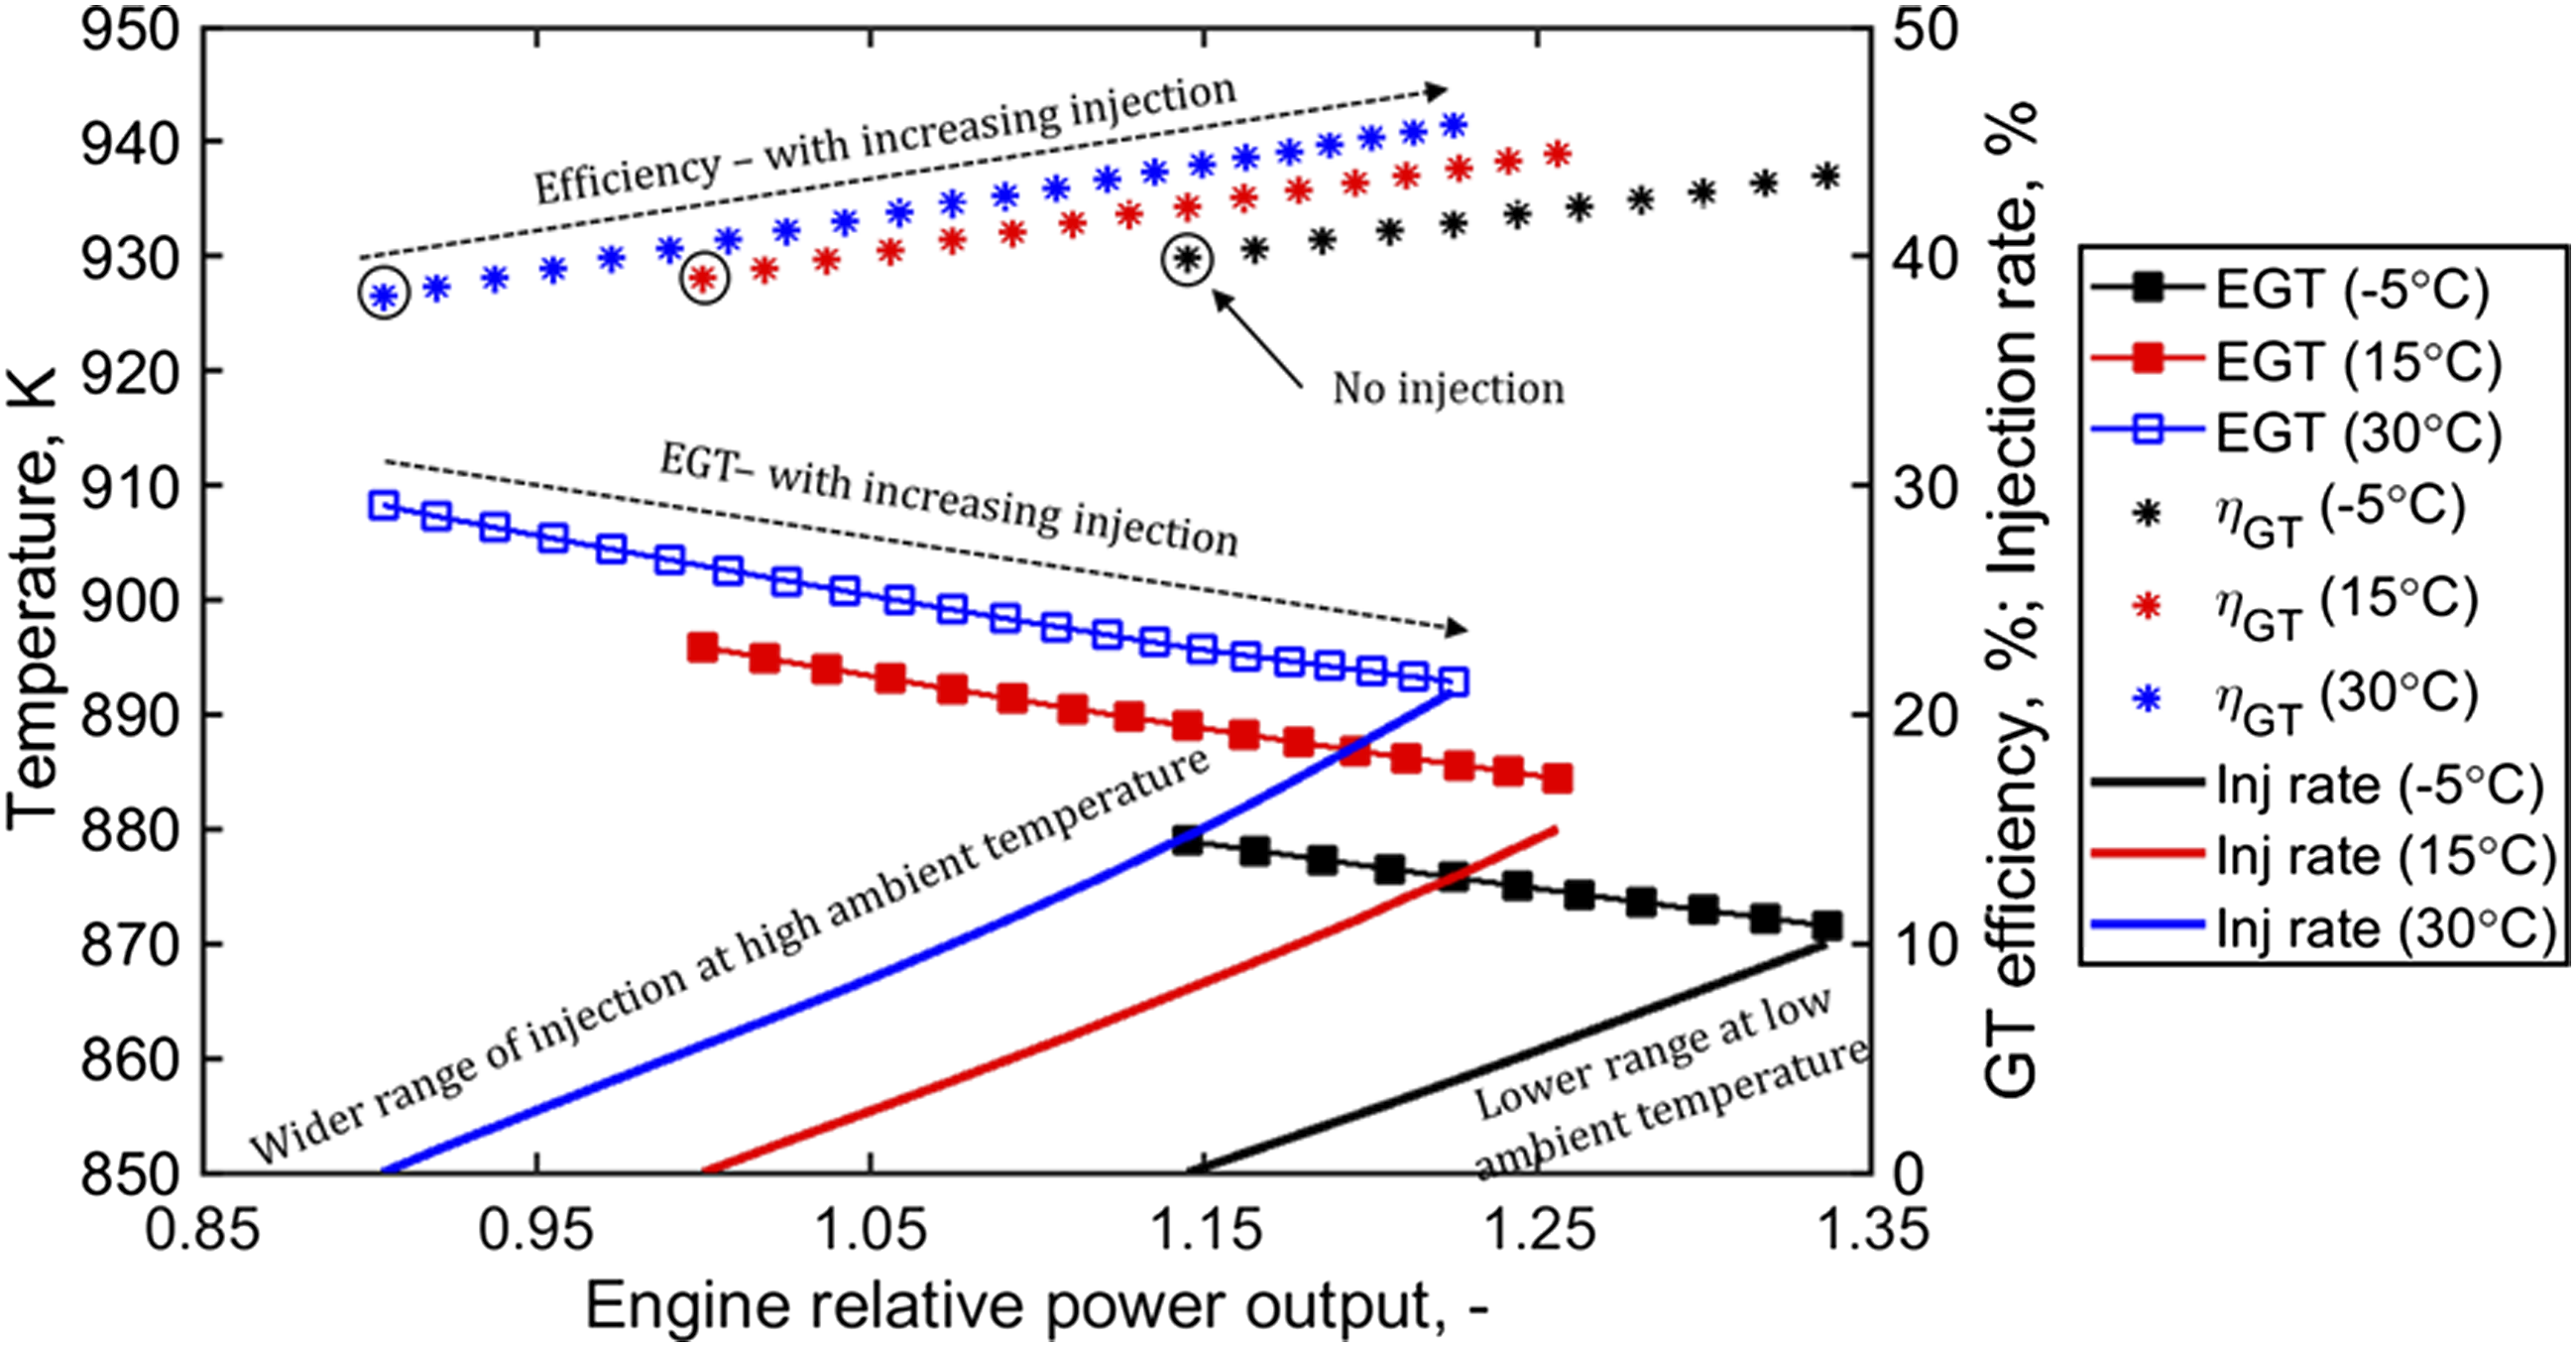
The implications of air injection rates and various ambient temperatures on the SMU is presented in Figure 3. This figure also presents the variation for the different lumped compressor stages (compressor 1–4) described in Figure 1 SMU of lumped compressor stages with air injection rate and various ambient temperature.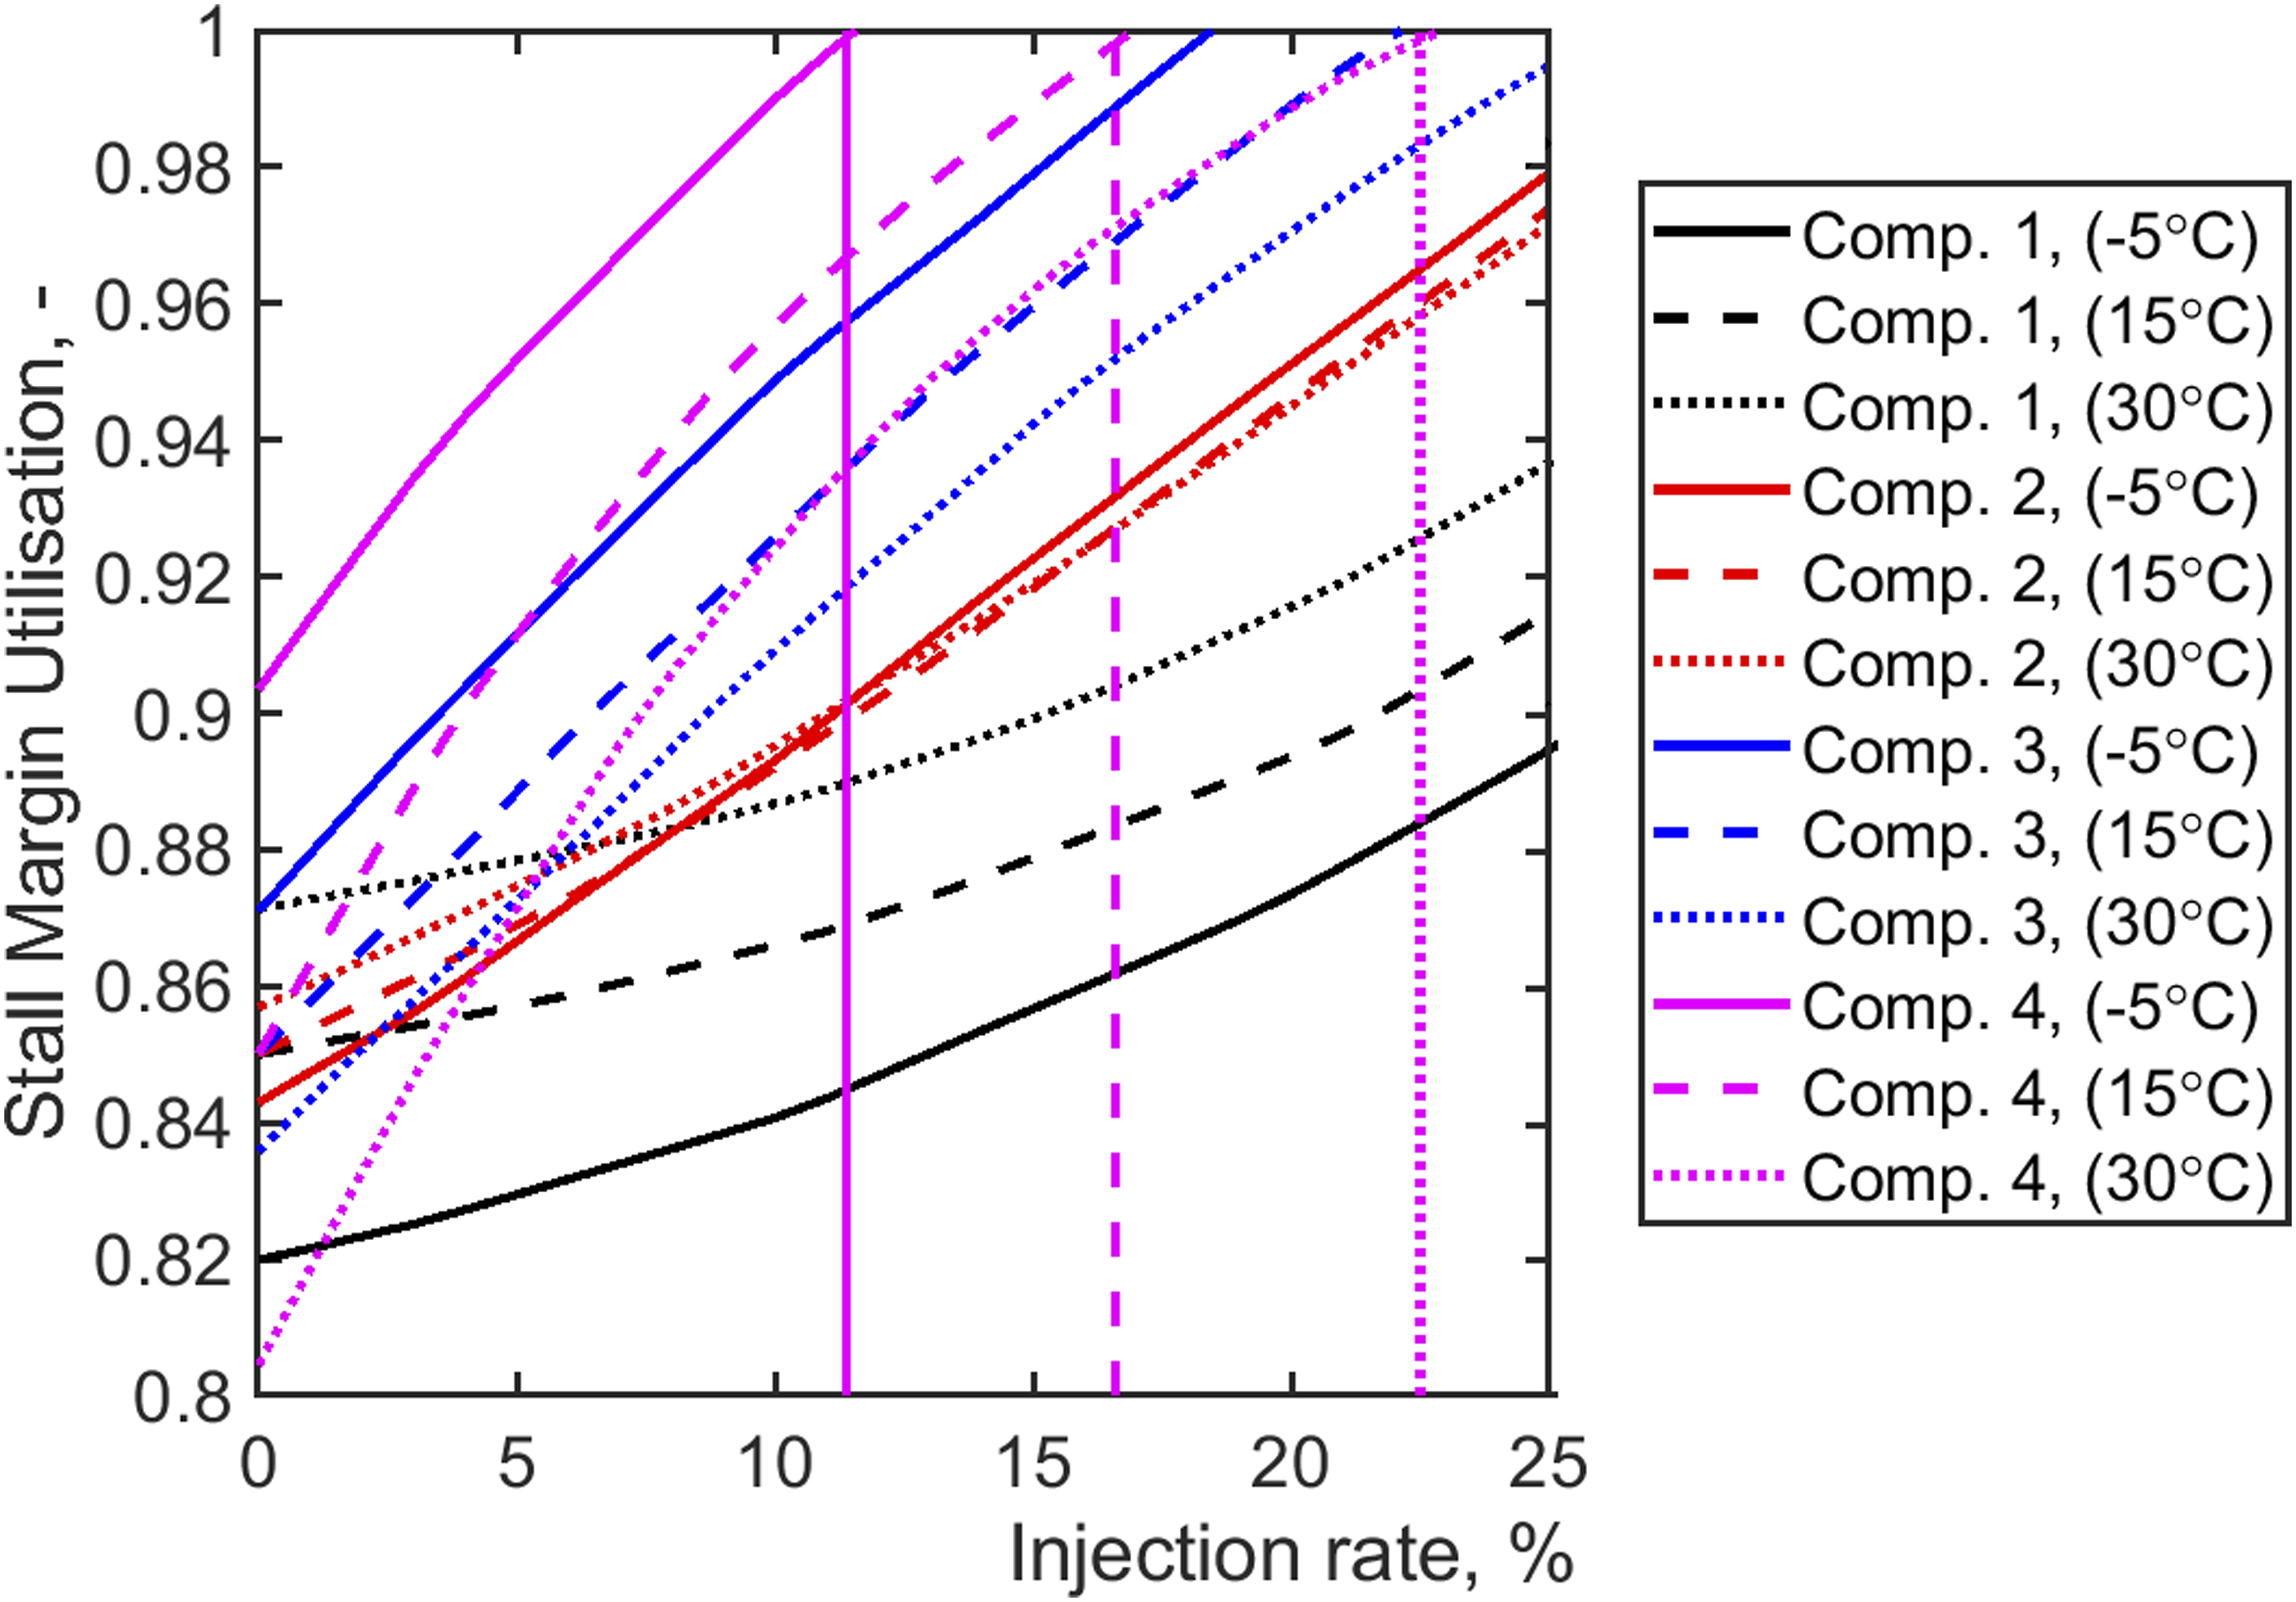
3D CFD multi-stage compressor model and assessment metrics
The back lumped compressor stage – compressor 4 was the subject of the CFD study. The inlet and outlet boundary conditions were provided from the 0D analytical model, and they varied for different operations (power outputs). The investigated geometry is presented in Figure 4 and consists of the last three stages and an OGV. The injection port is located downstream of the OGV, within 10 mm from the blade. The rotor’s tip gap was assumed to be 1% of the blade height, with cantilevered stators and no hub or interstage leakages. The CFD setup and verification, including mesh and turbulence model sensitivity for the design case, are presented in Szymanski et al.
12
that is related to this study. The referred work shows that the model meets compressor aerodynamic requirements based on parameters such as the diffusion factor, total pressure loss coefficient, axial velocity ratio and flow coefficient. It also shows the outcomes of the grid independency evaluation alongside the comparison for different turbulence models, all simulated on ANSYS CFX v19.2 solver. In the 3D CFD model, RANS approach with k-omega SST-RM model was selected. The working fluid was dry air, with Sutherland’s formula used for the air viscosity treatment. The compressor inlet parameters (as indicated on the right of Figure 4) were total pressure and temperature. The inlet flow angle distribution was assumed based on the flow outlet angle from the stator of stage 13 upstream, not presented in the study. The condition at the diffuser outlet (downstream of the domain) and the inlet condition at the injection port determined the injection ratio. For the injection total pressure, it is an outcome of the numerical simulations and depends on the required injection mass flow and port shape. The values were close and greater than the compressor discharge pressure, between 1.586–1.826 MPa for injection rates between 3–16% (at Tamb = 288 K) for the power augmentation scenario. The effect of injection temperature was explored in the range of 690–897 K; however, the impact was negligible for the stand-alone compressor. 3D multi-stage CFD compressor model (left) and domains indicated (right).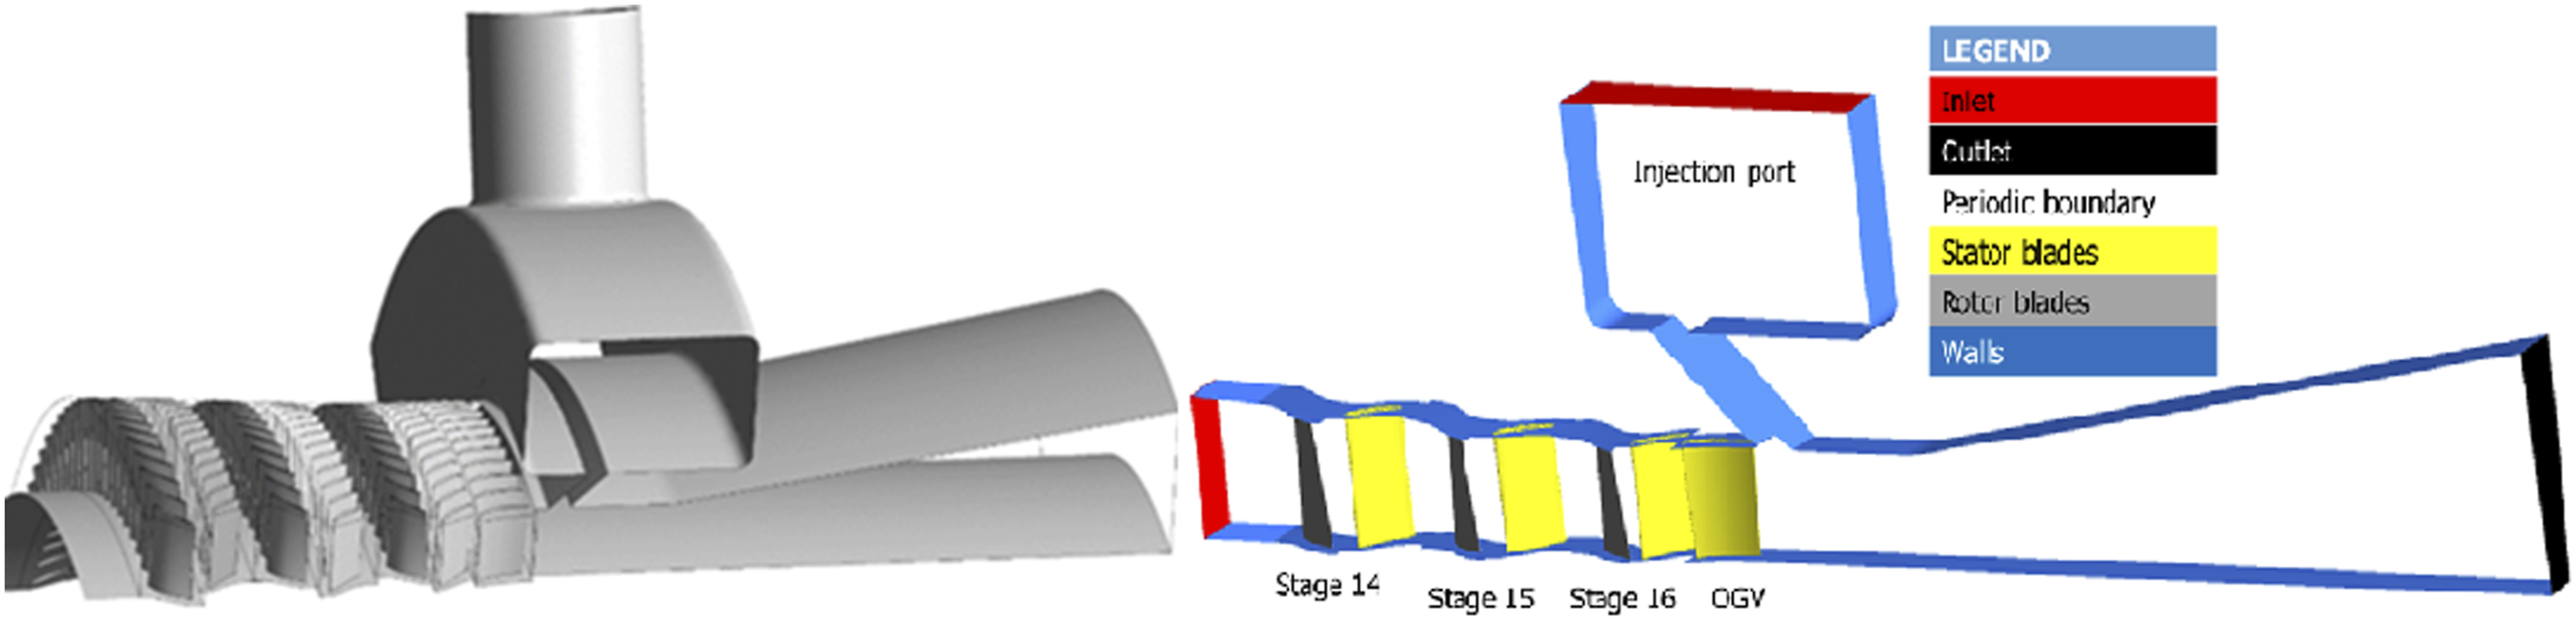
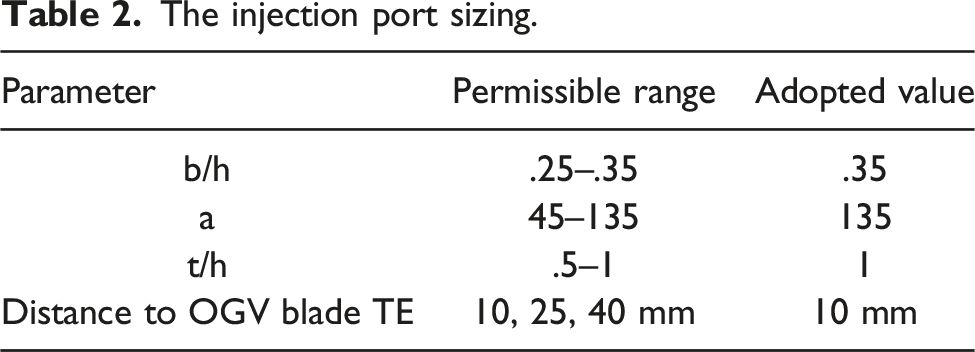
For the injection port shape, 63 design case geometries were explored based on existing extraction ports in engines of similar technology and the literature.19,20 For the port design with air injection, the main goal was to minimise the pressure losses behind the OGV, which arises with a high-speed jet concurrent to the main flow. Also, this pushes the compressor further to stall. Hence, the optimal design case was chosen with the details provided in Figure 5 and Table 2. This case is characterised by port inclination angle (a) to the flow and sufficient injection duct width (b) to reduce the injection velocity for favourable mixing. The distance of the injection port to the OGV blade had a negligible effect on the flow stability. The injection port and storage sizing. The injection port sizing.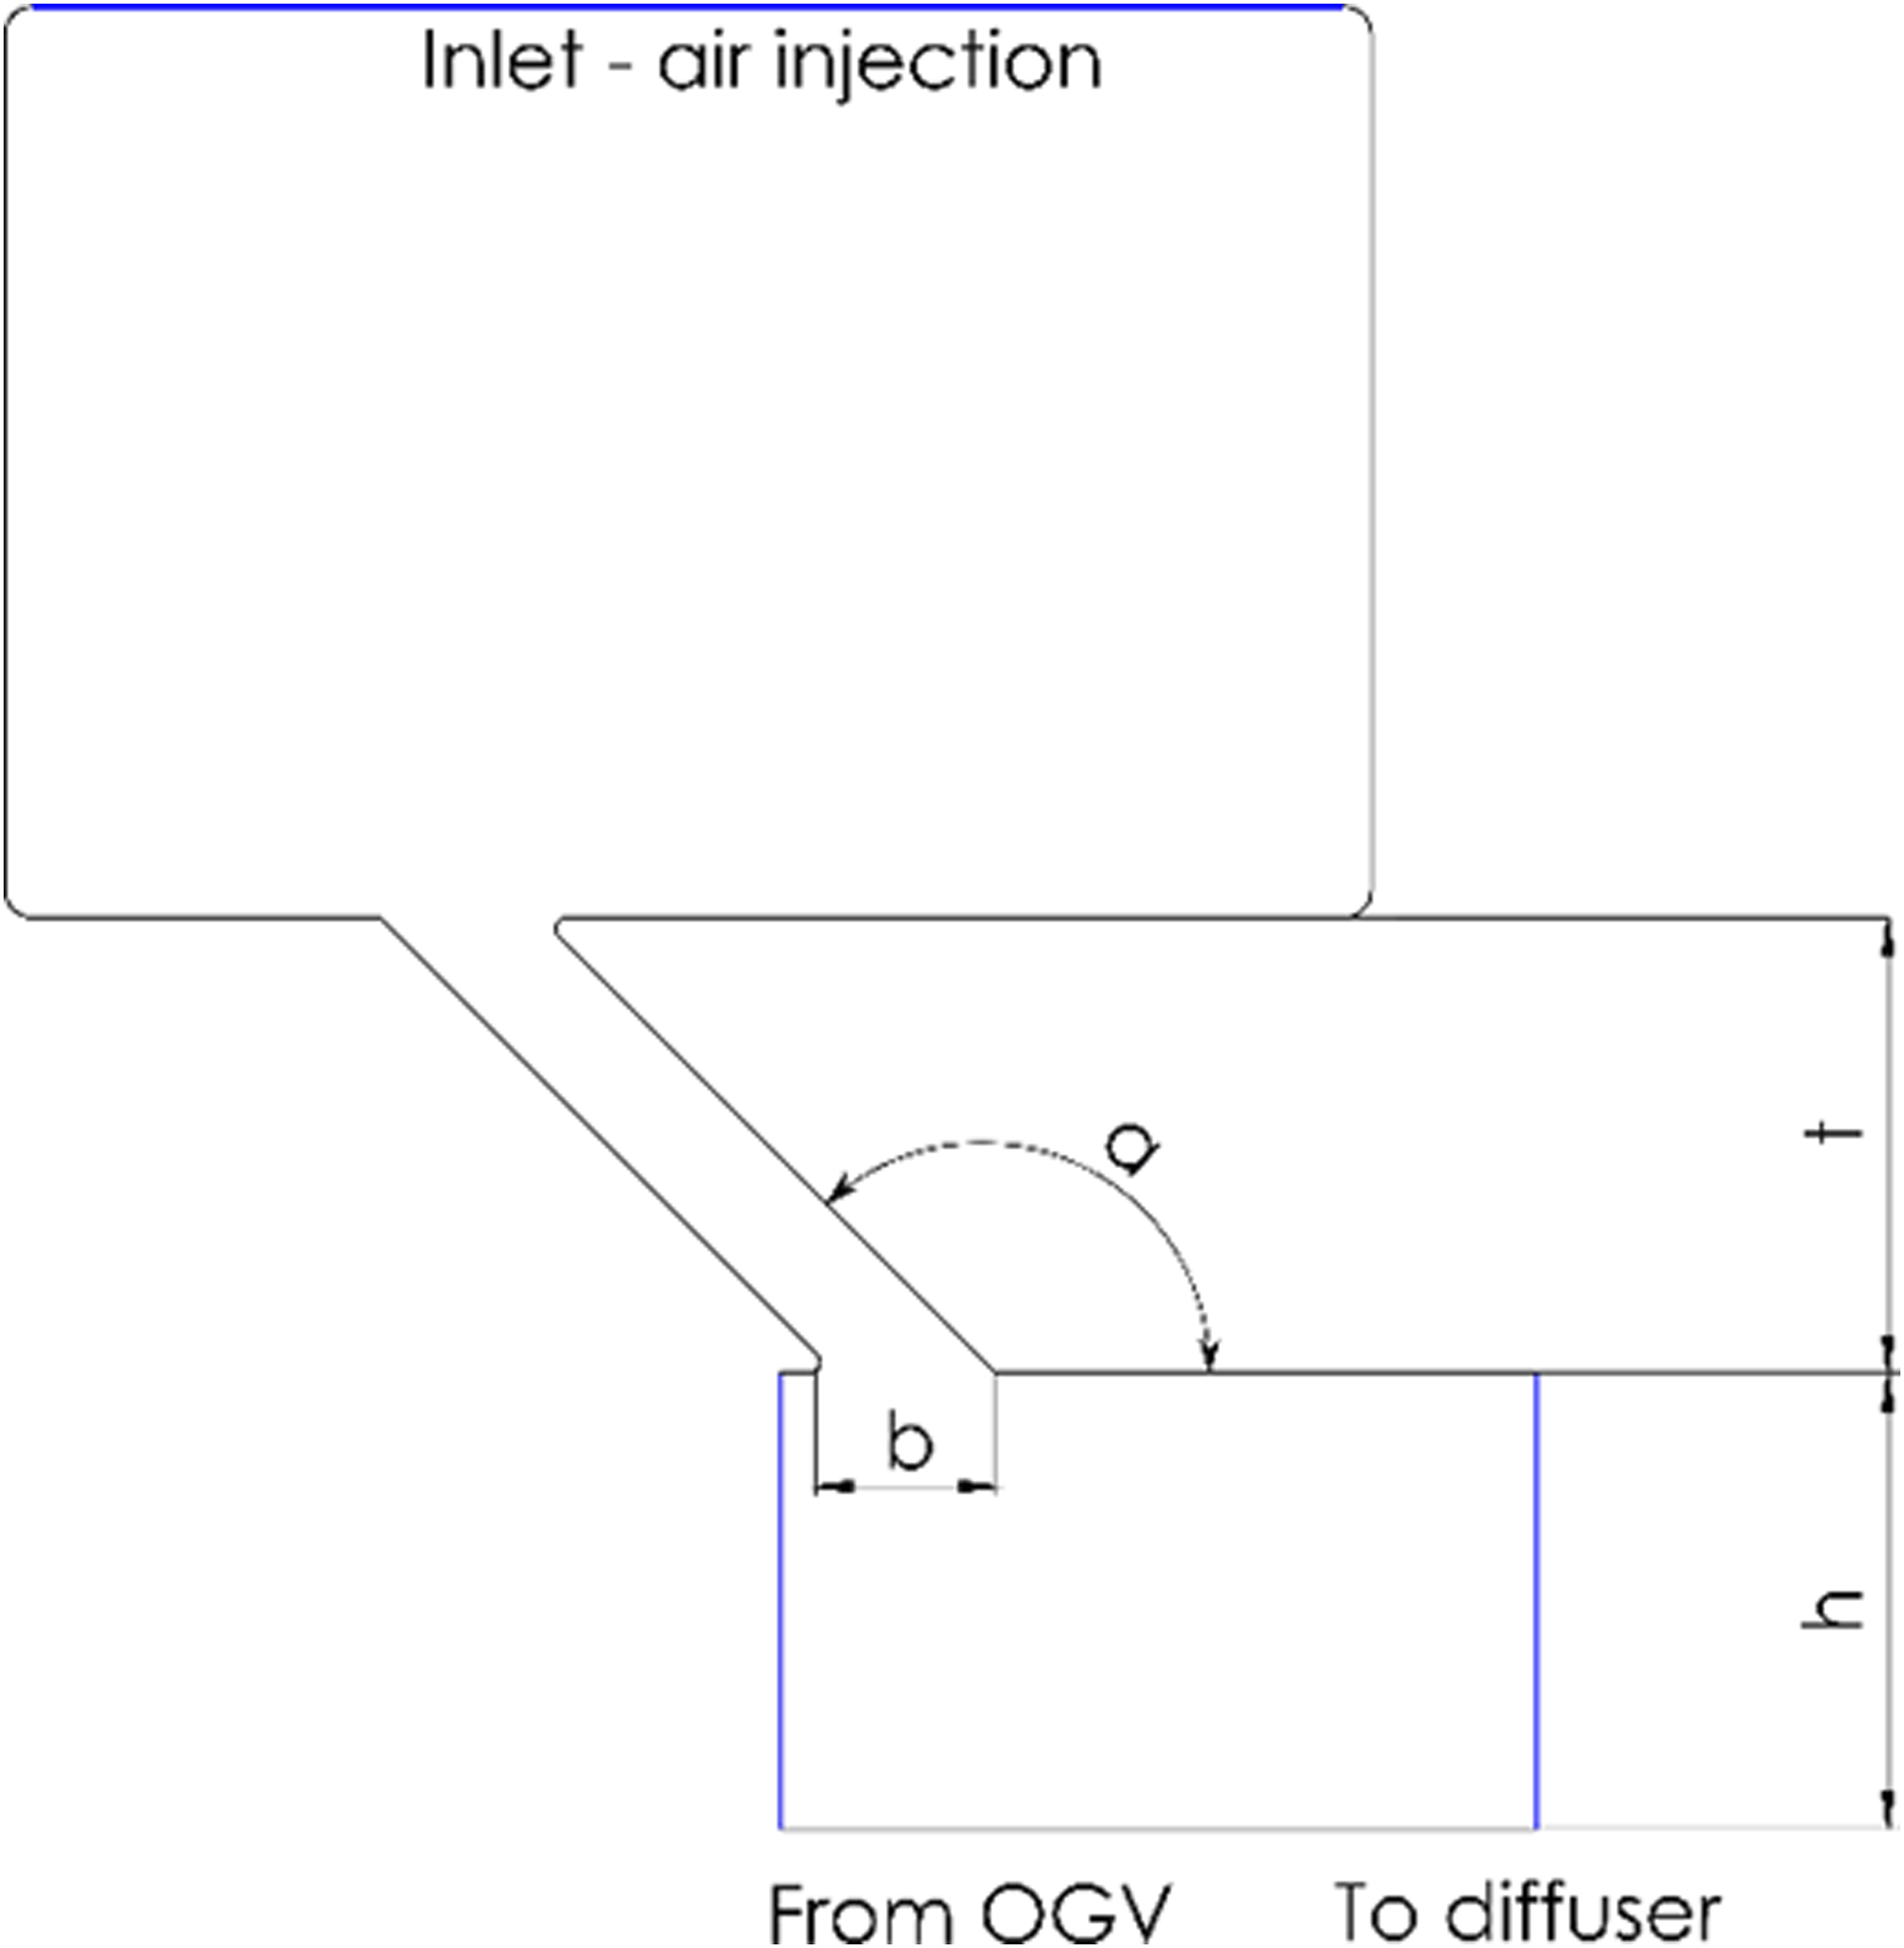
To analyse the 3D CFD results of compressor operation during the air injection, selected metrics have been used. The performance has been estimated using equations (2)–(5). The locally mass-averaged flow parameters were extracted to calculate the given metrics. The mass averaging took place at planes located in the direction normal to the main flow component (axial).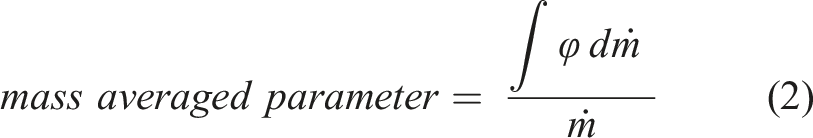
All the parameters that describe the flow were obtained in the same relative position to a blade. As the injection port is located downstream of the OGV, it becomes unnecessary to correct the presented values due to the changing mass flow rate across the compressor. The metrics used for the compressor evaluation are:
Mass averaged total pressure ratio: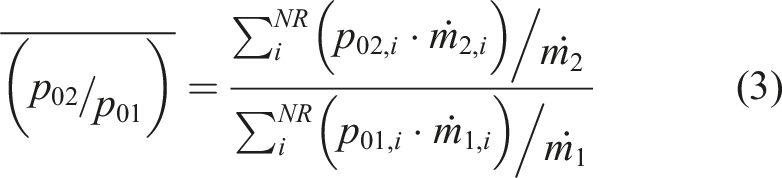
Mass averaged total temperature ratio: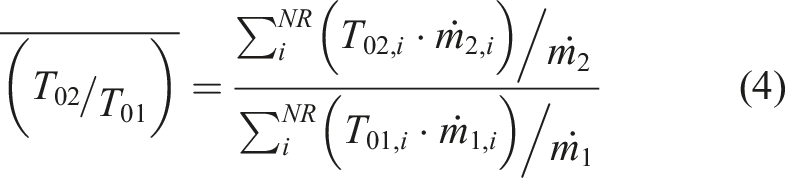
Adiabatic efficiency: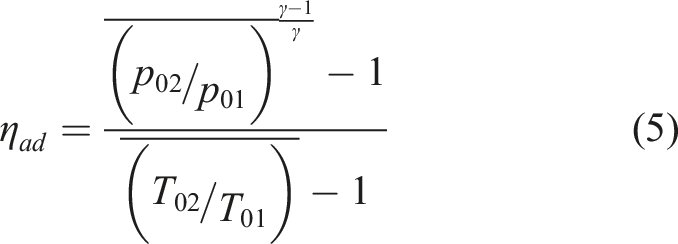
The mentioned metrics can be used to describe both the rotor and stator. In addition to the performance indicators, the aerodynamics metrics capturing local flow characteristics were estimated, allowing for a sufficient description of the flow behaviour at various operations. Consistent with accepted turbomachinery aerodynamics principles, they are:
Diffusion factor (DF) relates the peak velocity on the suction surface to the velocity at the trailing edge, with components defining the flow deceleration and turning in equation (6). The term describing turning also includes the blade solidity. DF values vary across the blade span (local value of 0.6 indicates stall onset, while span-average typically should not exceed 0.45–0.5 to keep the operation safe and efficient).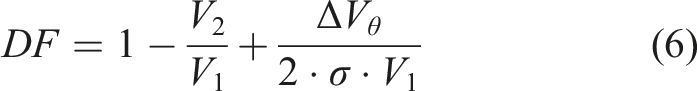
Total pressure loss coefficient: of stagnation pressure is given as ω. In optimal operation of rotating compressors blades, this parameter should not exceed the range of 0.02–0.03 at design conditions. It depends on the incidence angle, inflow Mach and Reynolds numbers (7).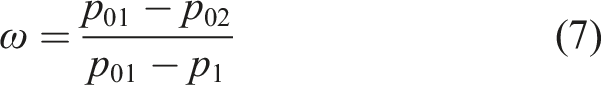
Axial velocity ratio (8) relates the blade outlet axial velocity component to the inlet. This change in axial velocity directly impacts the blade boundary layer thickness. If the value exceeds unity, the flow conditions are correct. However, if the ratio is below unity, it indicates that the conditions are worsened, and increased losses are likely to occur. A typical axial velocity increase at moderately loaded axial compressors is approximately between 1–2%.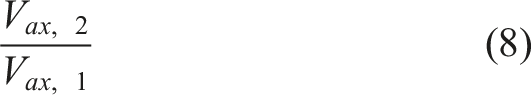
The ratio of local axial velocity value to the tangential velocity of the blade is defined as the flow coefficient in equation (9). Its value indicates the local air swirl propensity due to the contact of air with the rotating component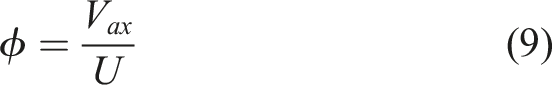
The blockage factor (BF) in equation (10) is utilised to evaluate the effect of air injection on compressor operability due to reduced flow area. For this study, it was defined as follows: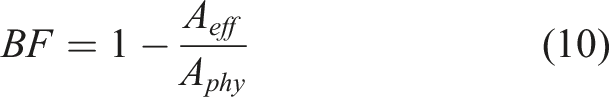
3D compressor aerodynamic analysis of air injection
This section presents the main outcomes of the study focused on the aerodynamic limits of compressed air injection for power augmentation and ramp-up rate improvement. The operating conditions have been established by the 0D engine model presented earlier. The first objective is to establish whether the 3D high fidelity component model conforms with the limit identified in the engine model. Also, it is of importance to examine the prevailing aerodynamic characteristics of the compressor flow in such operations.
Power augmentation
Section 0D analytical engine model and performance shows how the injection rate improves the power output and thermal efficiency of the engine system, also highlighting the implications of the SMU for different ambient temperatures. Before presenting the implications of this mostly based on aerodynamic terms, it is useful to compare the pressure ratios of both models, as a function of the injection rate. This is presented in Figure 6 which shows compressor 4 values of the OD model and the combined values of stages 14, 15 and 16 of the 3D model. It shows that with an injection rate increase, there is a rise in pressure ratio to the peak values (surge point-where SMU is 1) followed by a gradual decrease in the pressure ratio. The vertical lines apply to the 0D model, located where SMU is 1 and consistent with Figure 3, for different ambient temperatures. The 3D component model shows similar characteristics trends; however, the injection rates are shown to be limited at the high values, due to lack of convergence in the simulation. This is also more pessimistic for low ambient temperatures with typically higher pressure ratios as shown. Beyond these points of lack of convergence, substantial fluctuations of pressure and mass flow occurred that suggests numerical stall was taking place. It is therefore important to realise that the 0D model allows for simulations beyond the stall point (with respect to the 3D), as its numerical convergence is achieved. Effect of air injection on pressure ratio for power augmentation – 3D (stages 14–16) and 0D (compressor 4).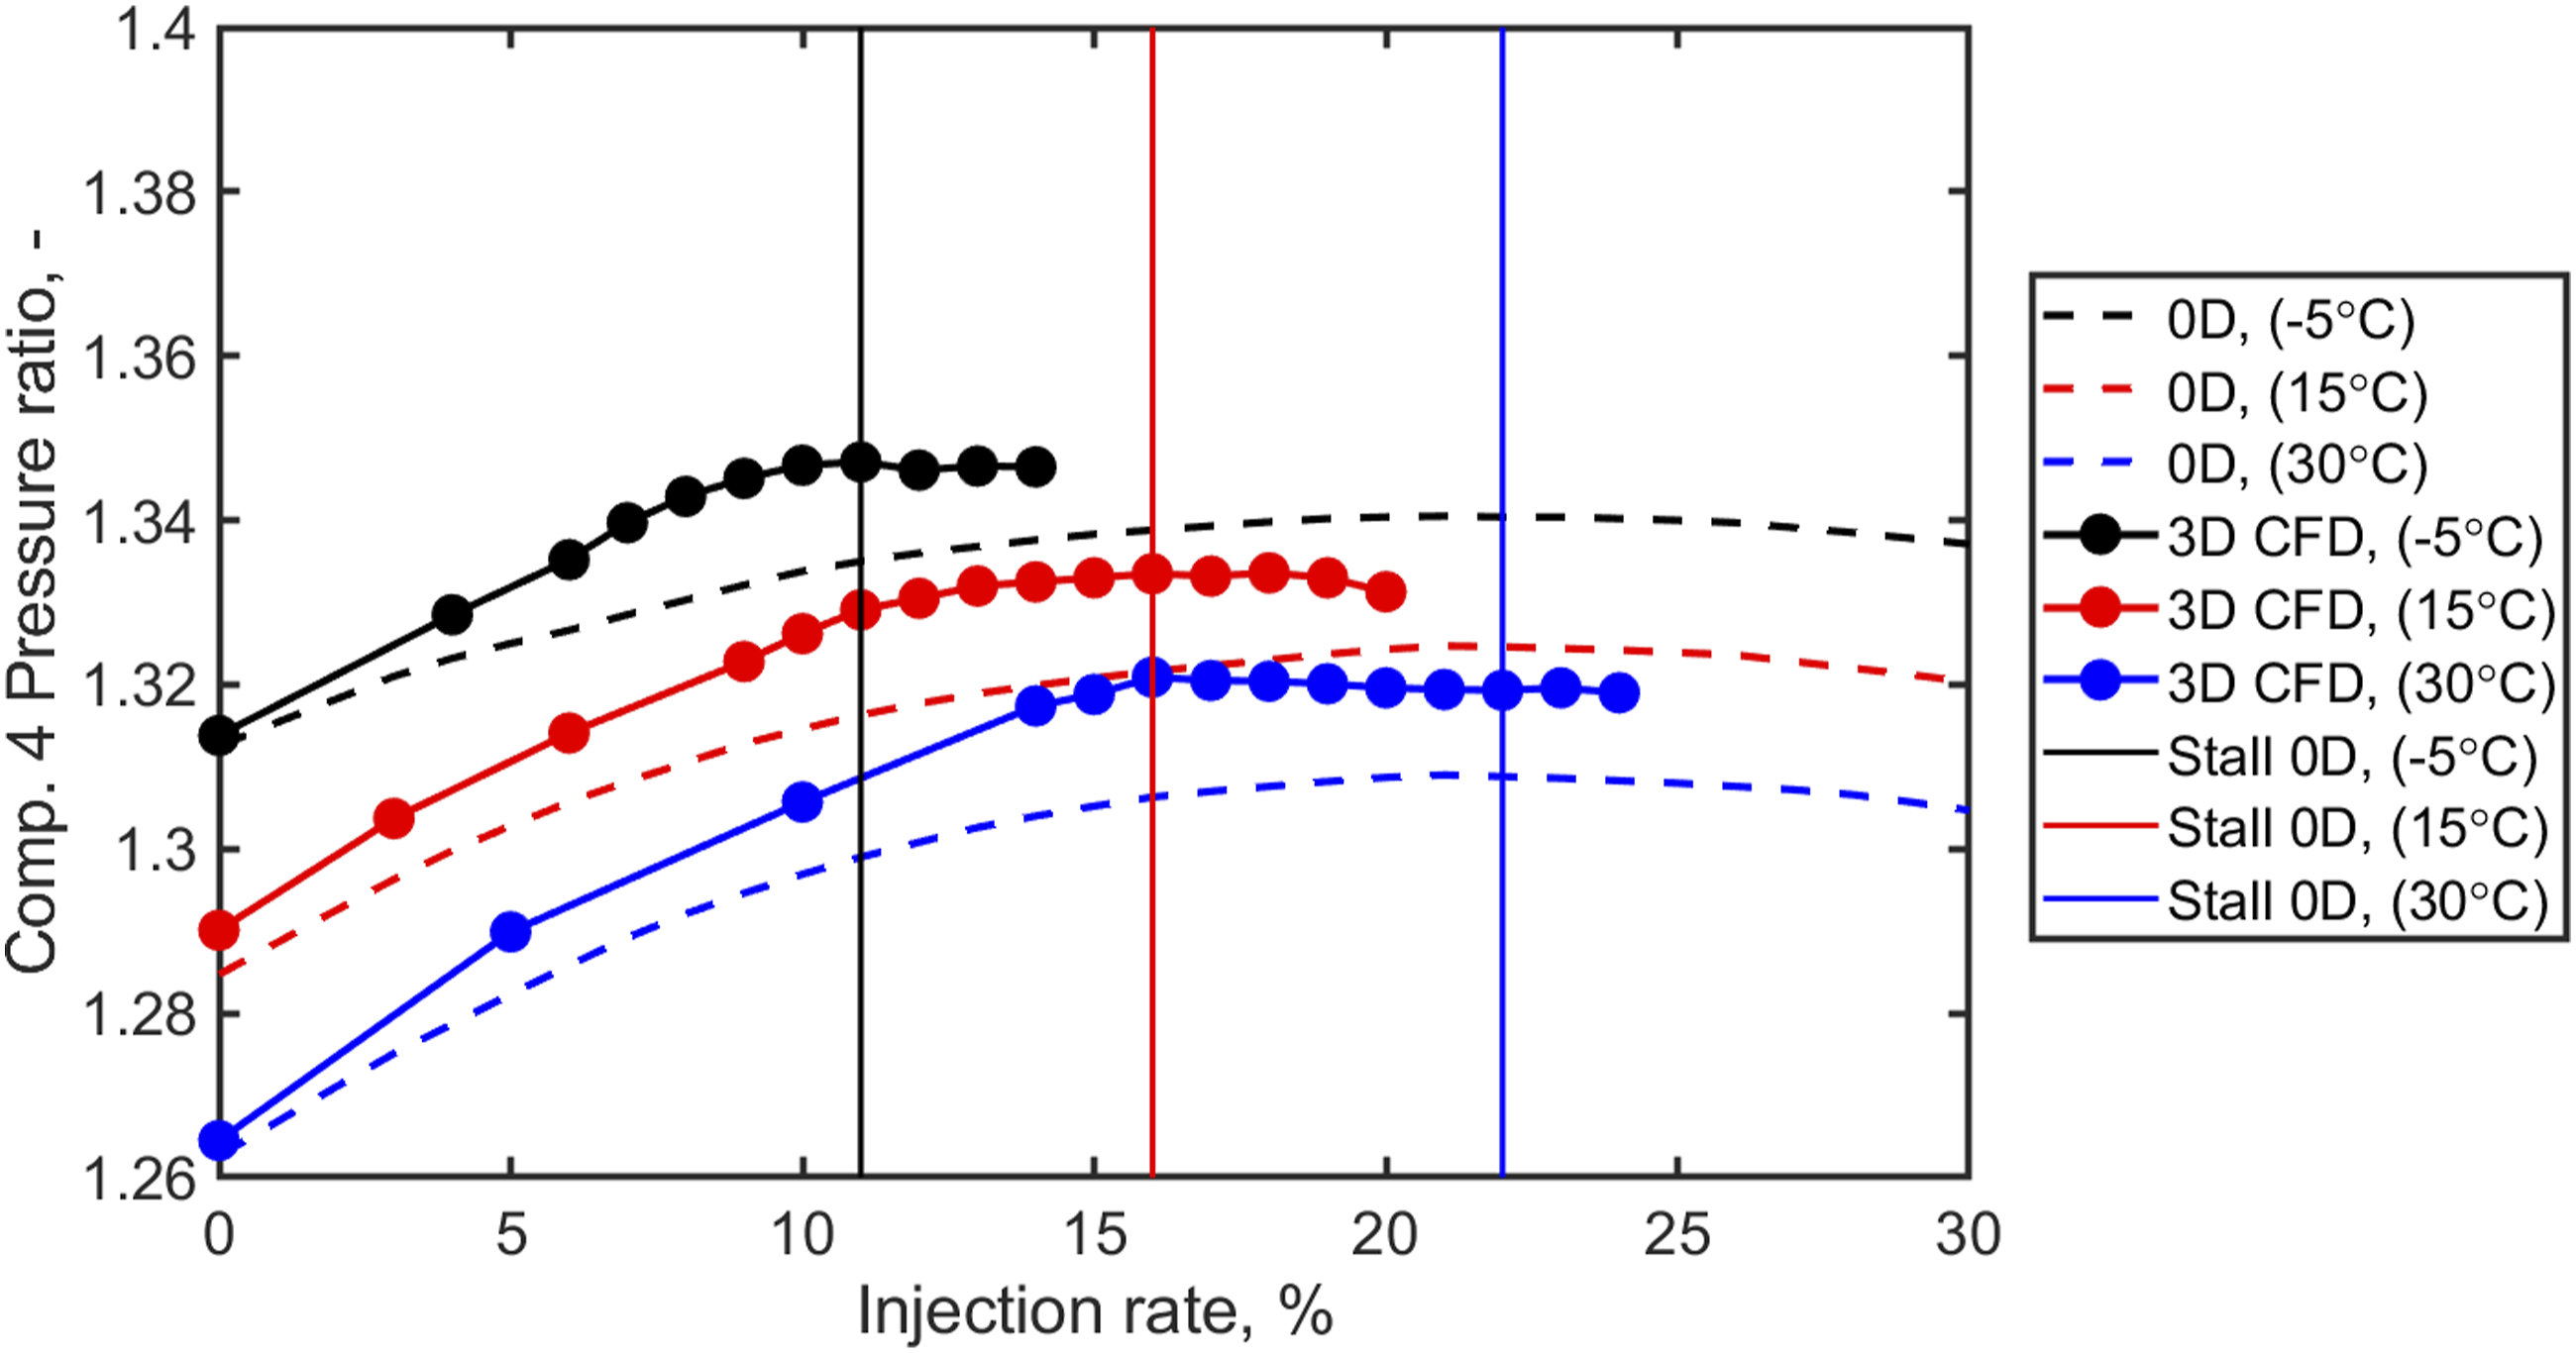
For the 3D model, the criteria to decide the stall point was the flattening pressure ratio, an increase in blockage factor and incidence angle. Also, the aerodynamics indicators, such as the diffusion factor helped to inform the decisions on the injection limitations. At near stall conditions, the pressure ratio of the back of the compressor almost plateau. The onset of this (peak pressure ratio) is used for the limit of air injection, while subsequent injections cases are shown up to the last simulated point that indicated periodic convergence. Beyond this point, no further injection was possible to simulate.
The air injection limits at 15°C, coincide with the 0D predictions and occur at an injection rate of 16%. At −5°C, the limits are 11% (0D) and 12% (3D), while at 30°C they are 22% (0D) and 20% (3D) respectively. It is important to state that the evaluation of multi-stage axial compressor working limits with CFD, using limited experimental data, is not straightforward. Simulations using a limited number of blade passages 22 with the RANS method often overestimate the compressor stability.23–25 To estimate the critical flow characterisation responsible for operational limitations, advanced URANS or LES simulations are more appropriate to precisely determine the onset of stall.26,27 However, they require significant computational resources thus are time-consuming. Due to the necessity to simulate a vast number of cases, a RANS approach was prudent, also providing detailed results and crucially, the propensity to stall.
To evaluate the aerodynamic effects, one of the used parameters to quantify the risk of stall was the BF distribution. The BF is the ratio of the area occupied by the reversed flow (where the axial velocity component is negative) to the overall flow area at the considered location. This metric was averaged at planar locations normal to the flow direction and was estimated at one thousand equally distanced axial locations, to evaluate its distribution across the compressor.
Figure 7 shows the BF distribution across the compressor section considered at 15°C ambient temperature; it also includes cases of different injection rate. At the design point operation (i.e. 0% -no injection), some areas in stages 14–15 already exist with blockages of up to 2.35%, which is shown to be amplified with air injection. Stage 16 and the front part of the OGV have reduced areas of reversed flows and blockages. Stator 16 and the OGV show better flow conditions at the design point and off-design conditions, compared to the upstream blades. In contrast to upstream stages, they are characterised by lower losses near the hub, which is the critical region for the overall losses. At the maximum injection rate of 16% (the pre stall condition), the blockage factor is 4.8 and 4.7% in the stator of stages 14 and 15 respectively. At a higher injection rate of 18% (excluded for brevity), the compressor showed signs of stall and the BF of 5.1 and 5.4% were present in stage 14 and 15. Blockage factor across the compressor for different injection rate.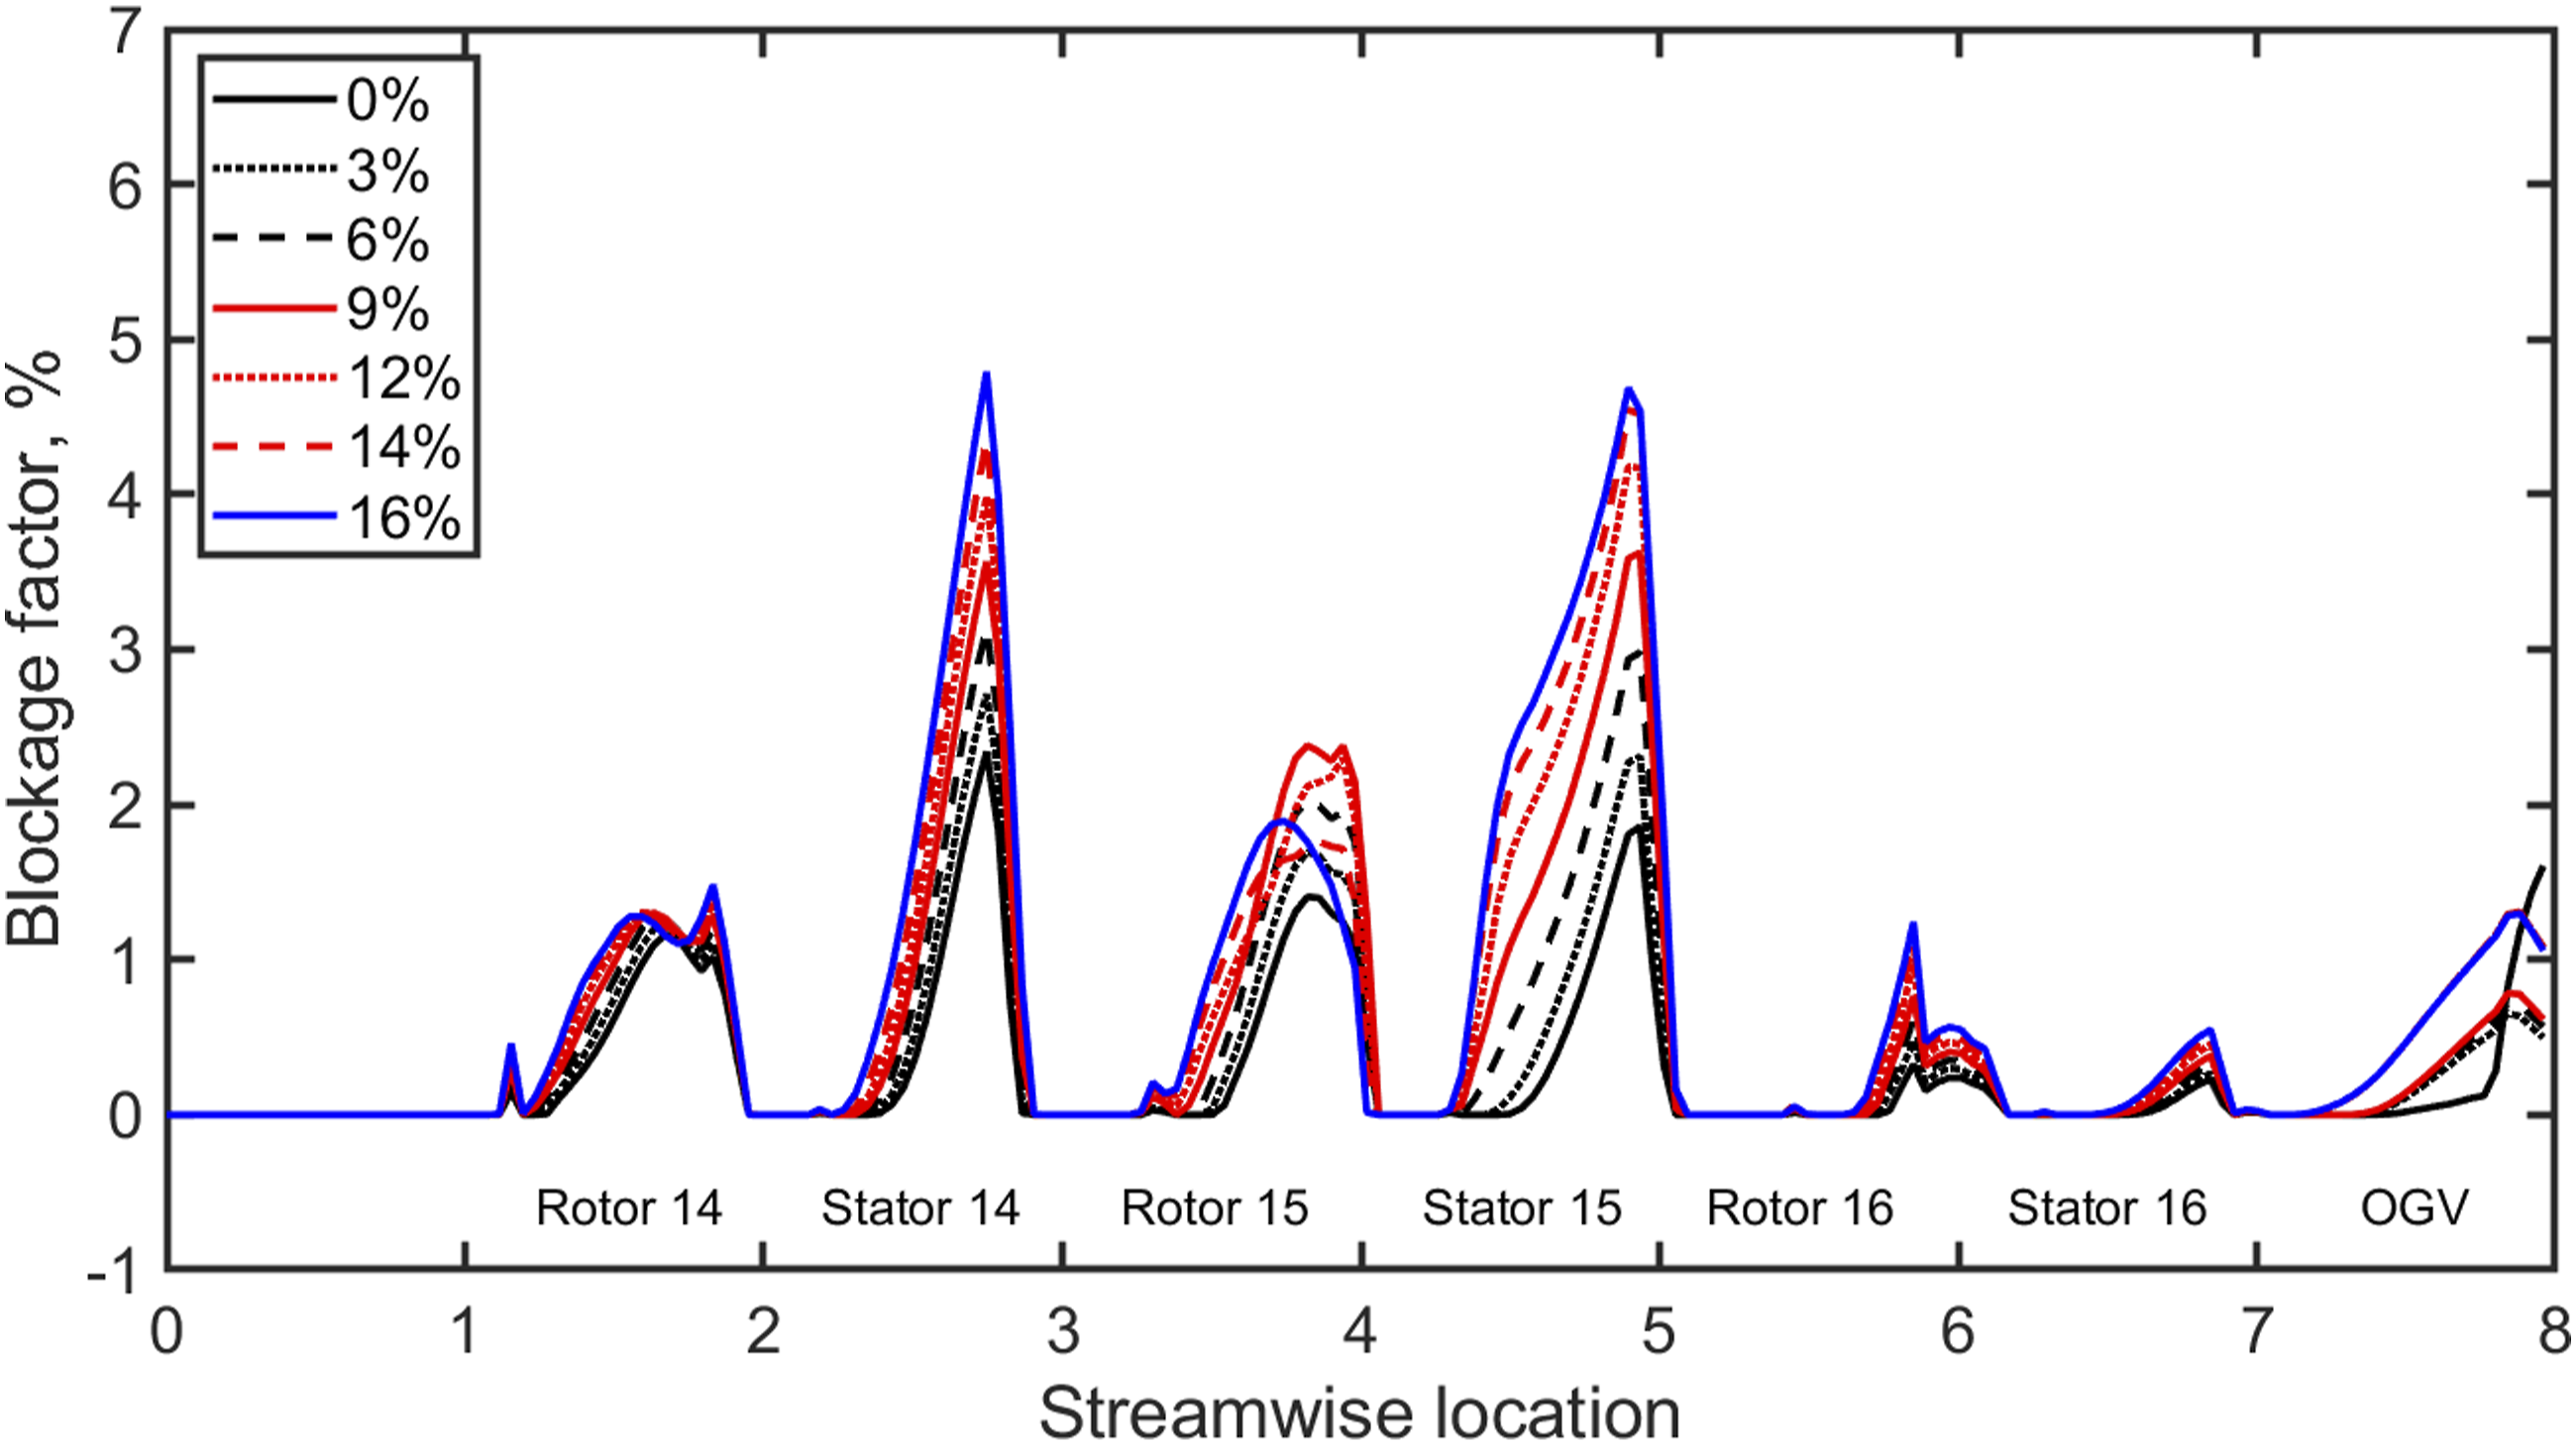
The corresponding locally averaged velocity flow angle distribution is presented in Figure 8. It shows that air injection has a substantial effect on the velocity flow angle across the compressor. This is due to the rise in the pressure ratio of the stage that increases the incidence angle. As shown in the figure, the increments in incidence angle were more in the rotors than for the stators, which straightened out the flow. At near stall conditions (16% injection), the incidence angle increase reached 5.05° and 5.10° for rotors 14 and 16, respectively, while 4.40° for rotor 15. Velocity angle across the compressor for different injection rate.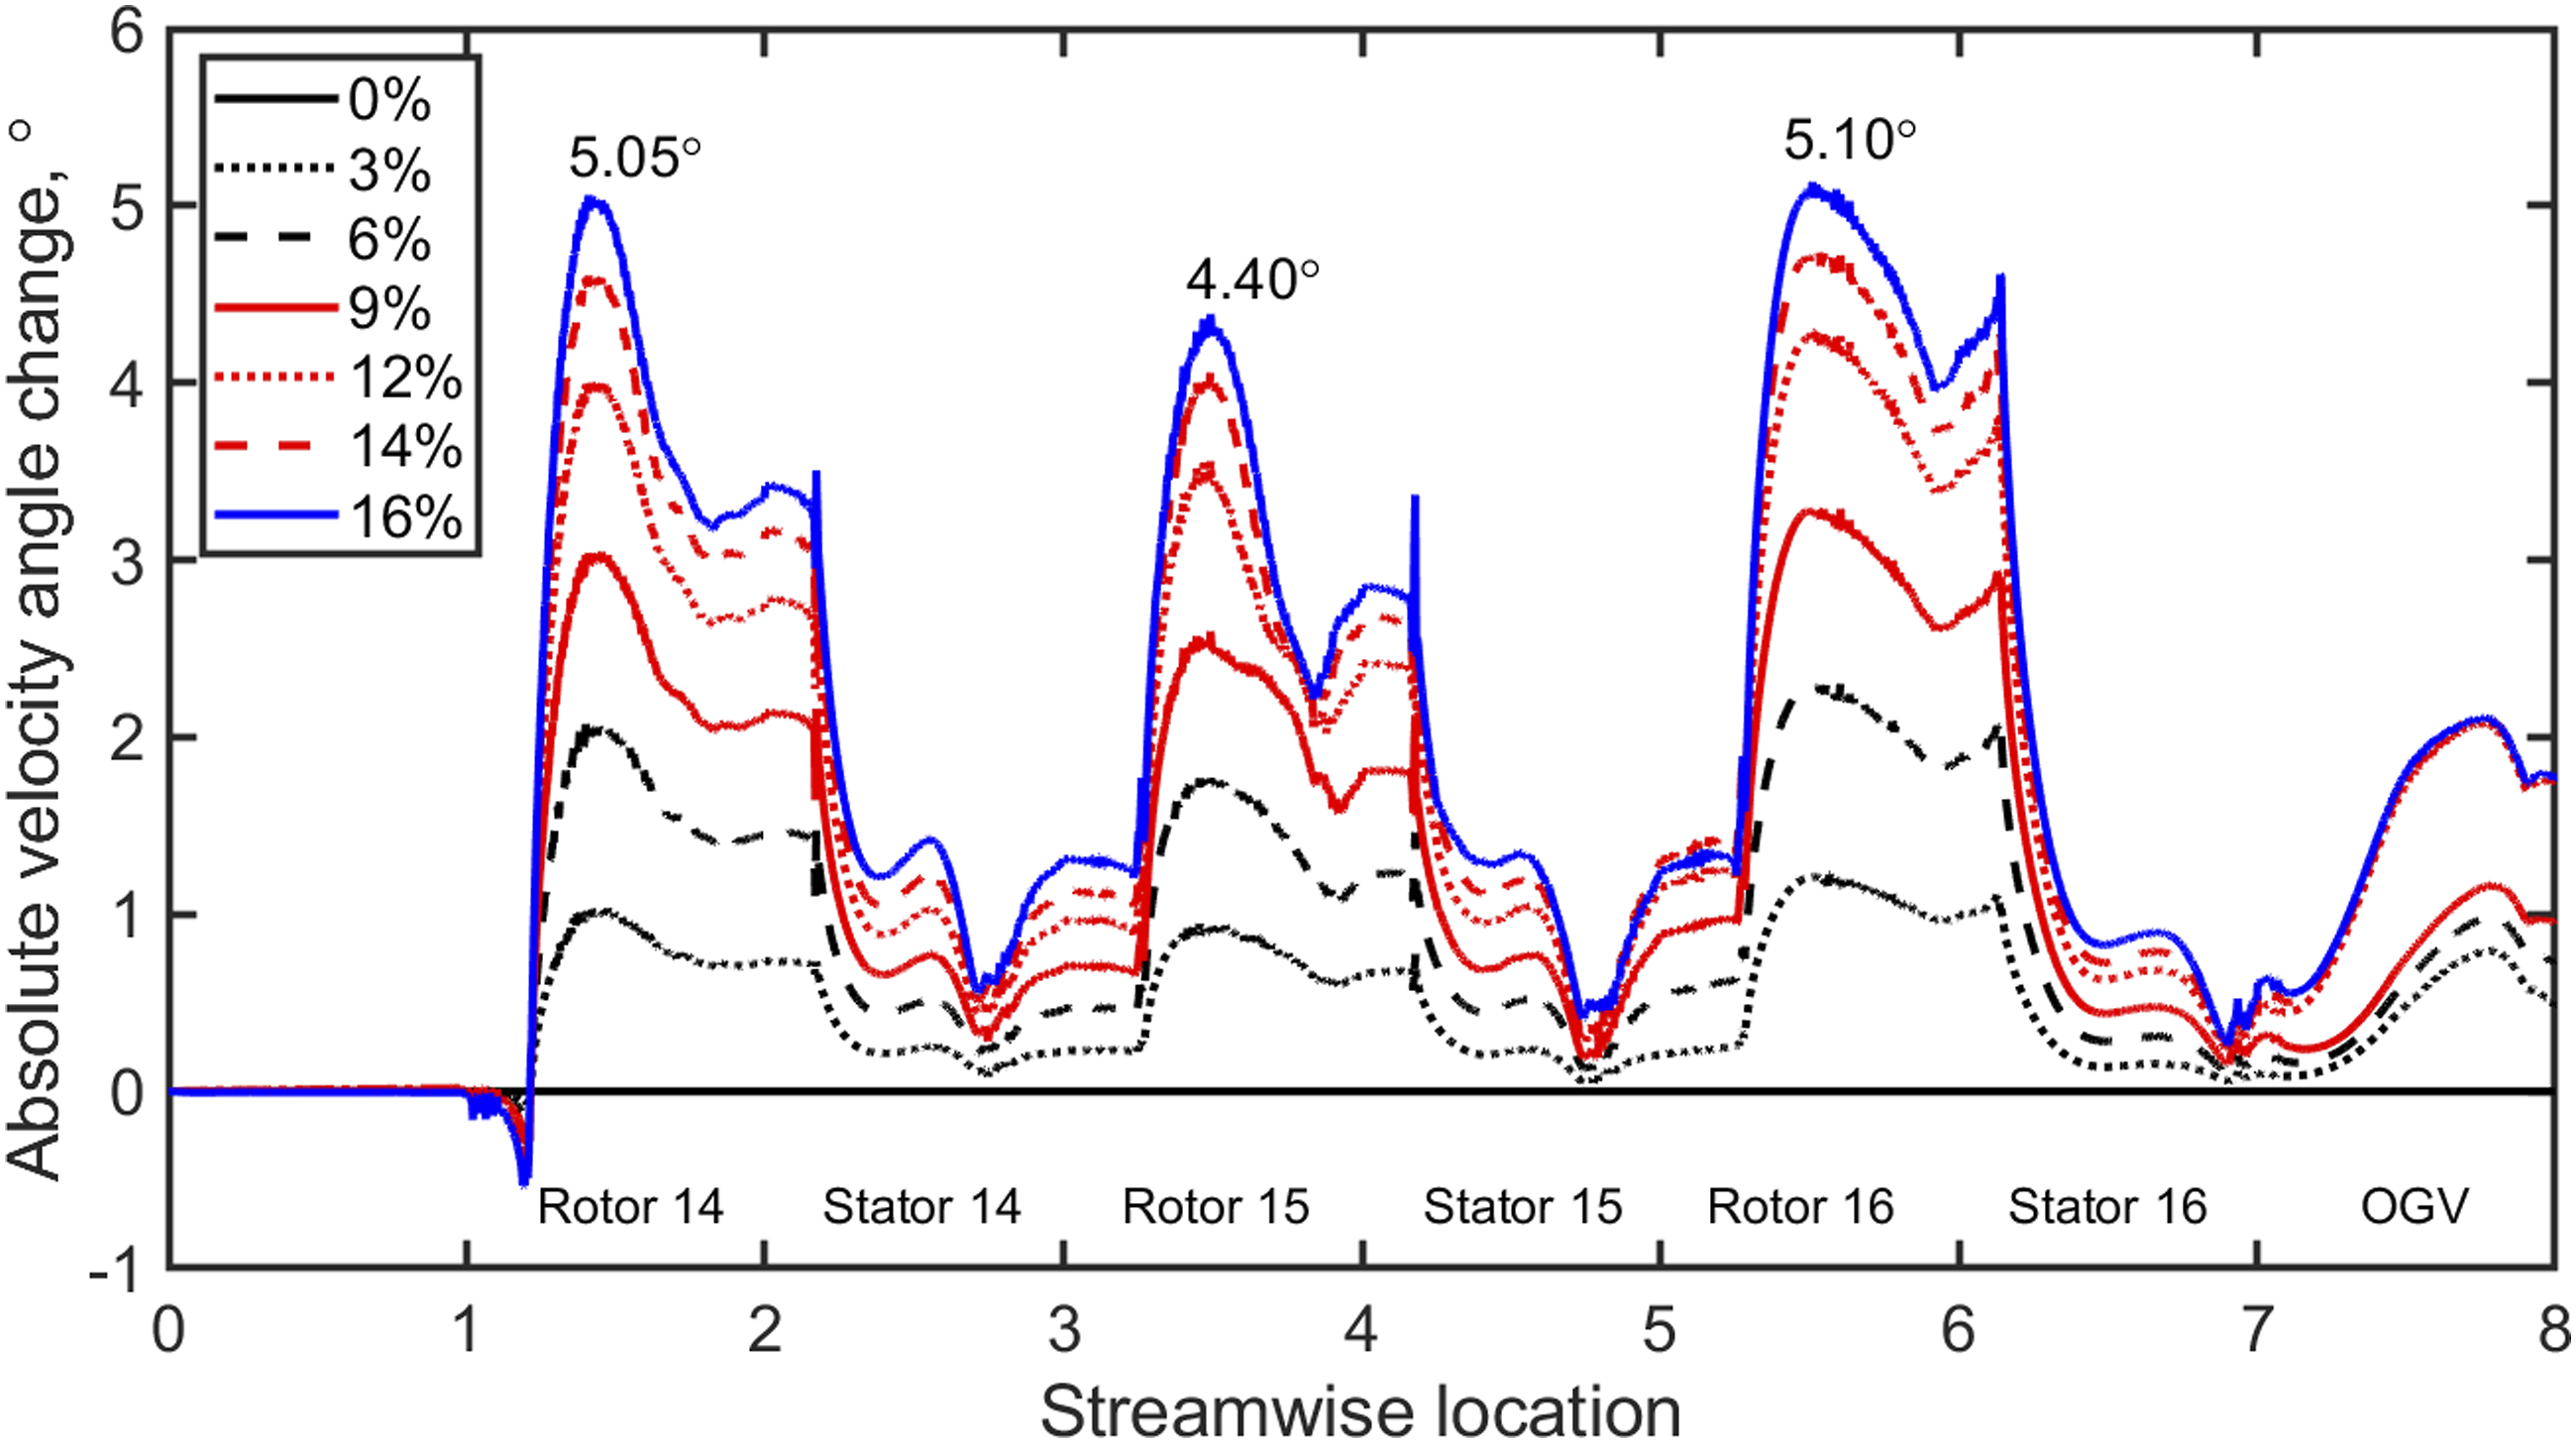
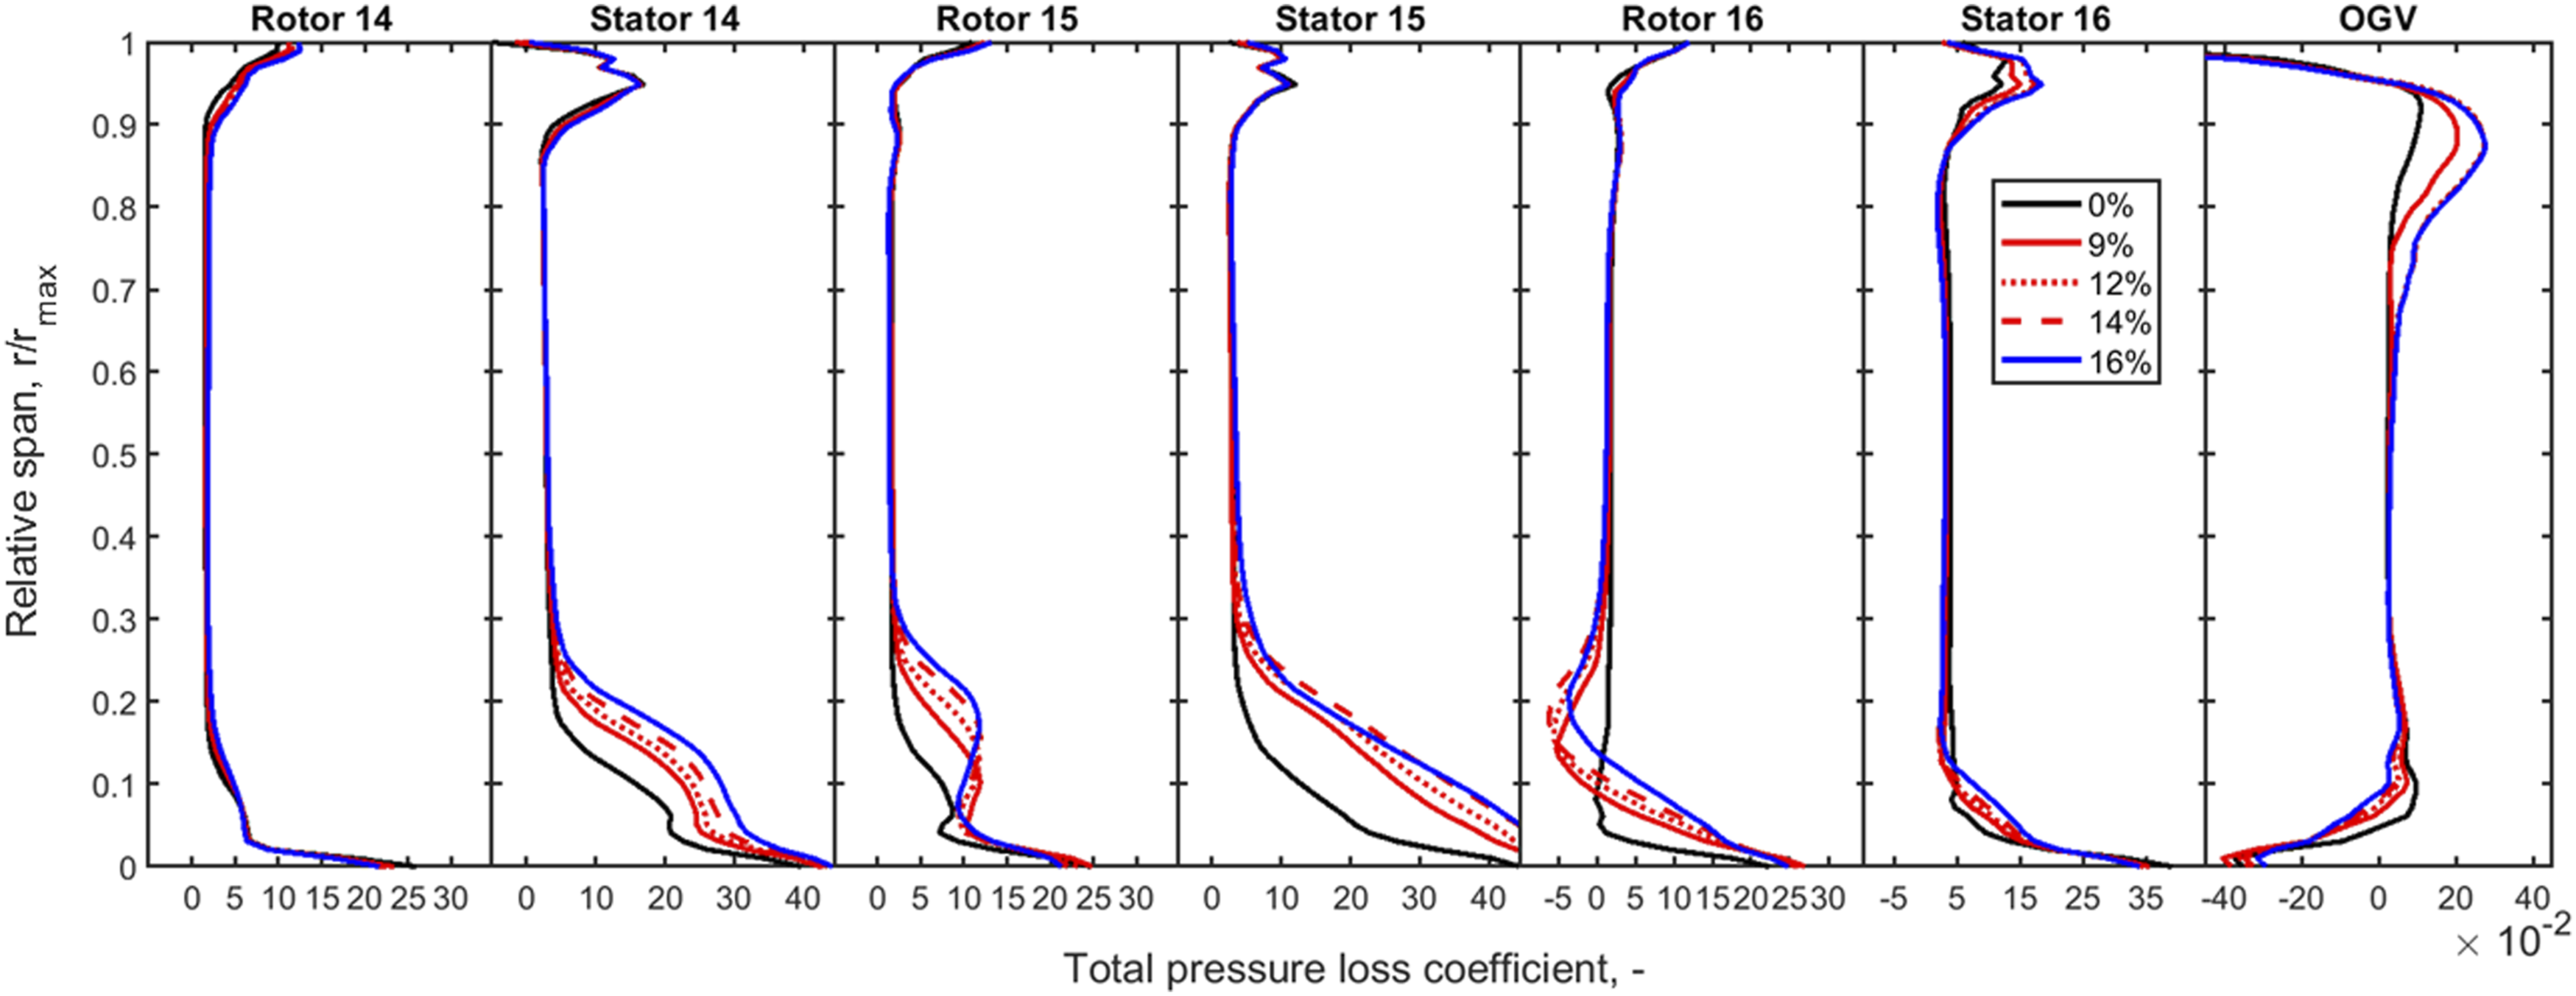
The previous figures show the parameter variations in the axial direction; that of the radial variations as shown subsequently in Figures 9 and 10, from the hub to shroud and traverse downstream of the blade, behind the trailing edge. This format helps evaluate the local implications of the blade flow due to air injection, with respect to the absolute flow angle distribution and total pressure loss coefficient. Flow angle distribution for different injection rate – from hub to shroud. Total pressure loss coefficient for different injection rates – from hub to shroud.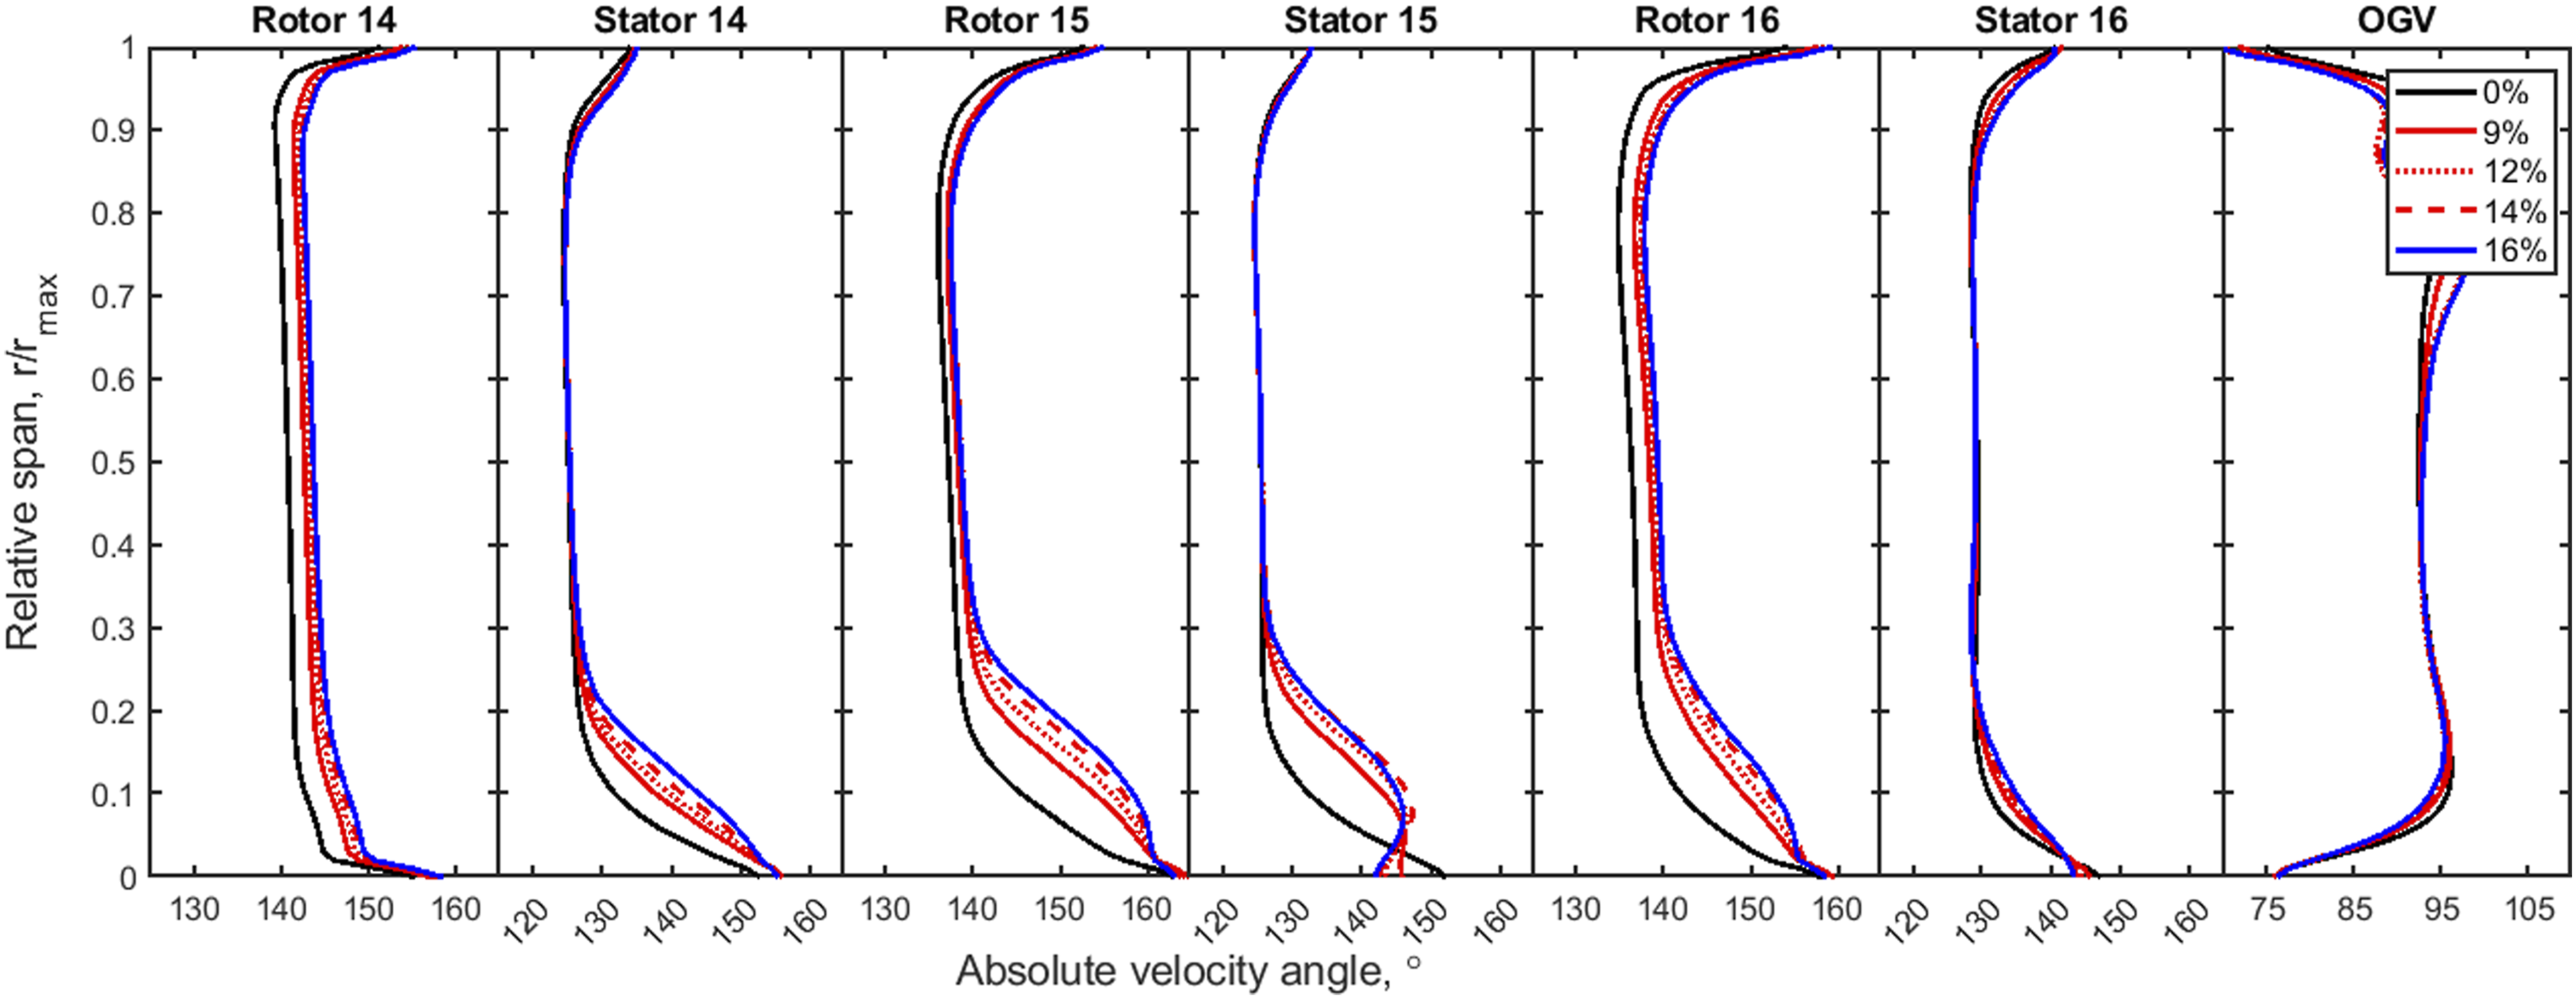
The absolute velocity angle distributions in Figure 9 shows the regions mainly responsible for the flow separation/distortion for the design and injection cases. The most affected regions are: the hubs of stator 14, rotor 15, stator 15 and rotor 16, around 0–30% of the spanwise. Apart from these, around the tip of the OGV (located the closest to the injection port) also exhibited strong flow separation. As well, the circumferential velocity component increased considerably, signifying a substantial swirl development in the area.
The total pressure loss coefficient is presented in Figure 10, which confirms the previous findings. This means that the areas with the high velocity angles are dominated by the peak total pressure losses. In some cases, the losses have more than doubled at the maximum injection rate. The negative total pressure loss coefficient observed at the hub location of rotor 16 and the OGV is a result of reversed flow taking place and reduces the averaged total pressure loss coefficient. This has to be taken into account when comparing the averaged values for the entire stage/blade row.
Figure 11 shows the stage-by-stage overall aerodynamic indicators for different injection rates. The left of the figure indicates the diffusion factor and total pressure loss coefficient for all the rotors and stators. The right of the figure is the velocity ratio and flow coefficient for the respective stages. As shown, the diffusion factor increases with air injection rate, indicating the growing loading of the compressor stages and the risk of approaching the stall induced limits. The highest value was noted for rotor and stator 14, while the highest increase was observed for rotor 14 and stator 16. In the case of rotor 14, the average value approached the threshold of 0.45, which is an upper limit for axial compressor before stall condition.
28
With lower values for stage 16 that is closer to the injection port, the risk is shown to be less. This is contrary to the observation with the 0D analytical engine model and Igie et al.
1
that shows more risk of stall at the last stage. The plot of the total pressure loss coefficient conforms with Figure 10 and indicates that the highest increase of pressures losses takes place in stators 14 and 15, with rotors and stage 16 relatively unaffected. Stage-by-stage overall aerodynamic indicators for different air injection rate.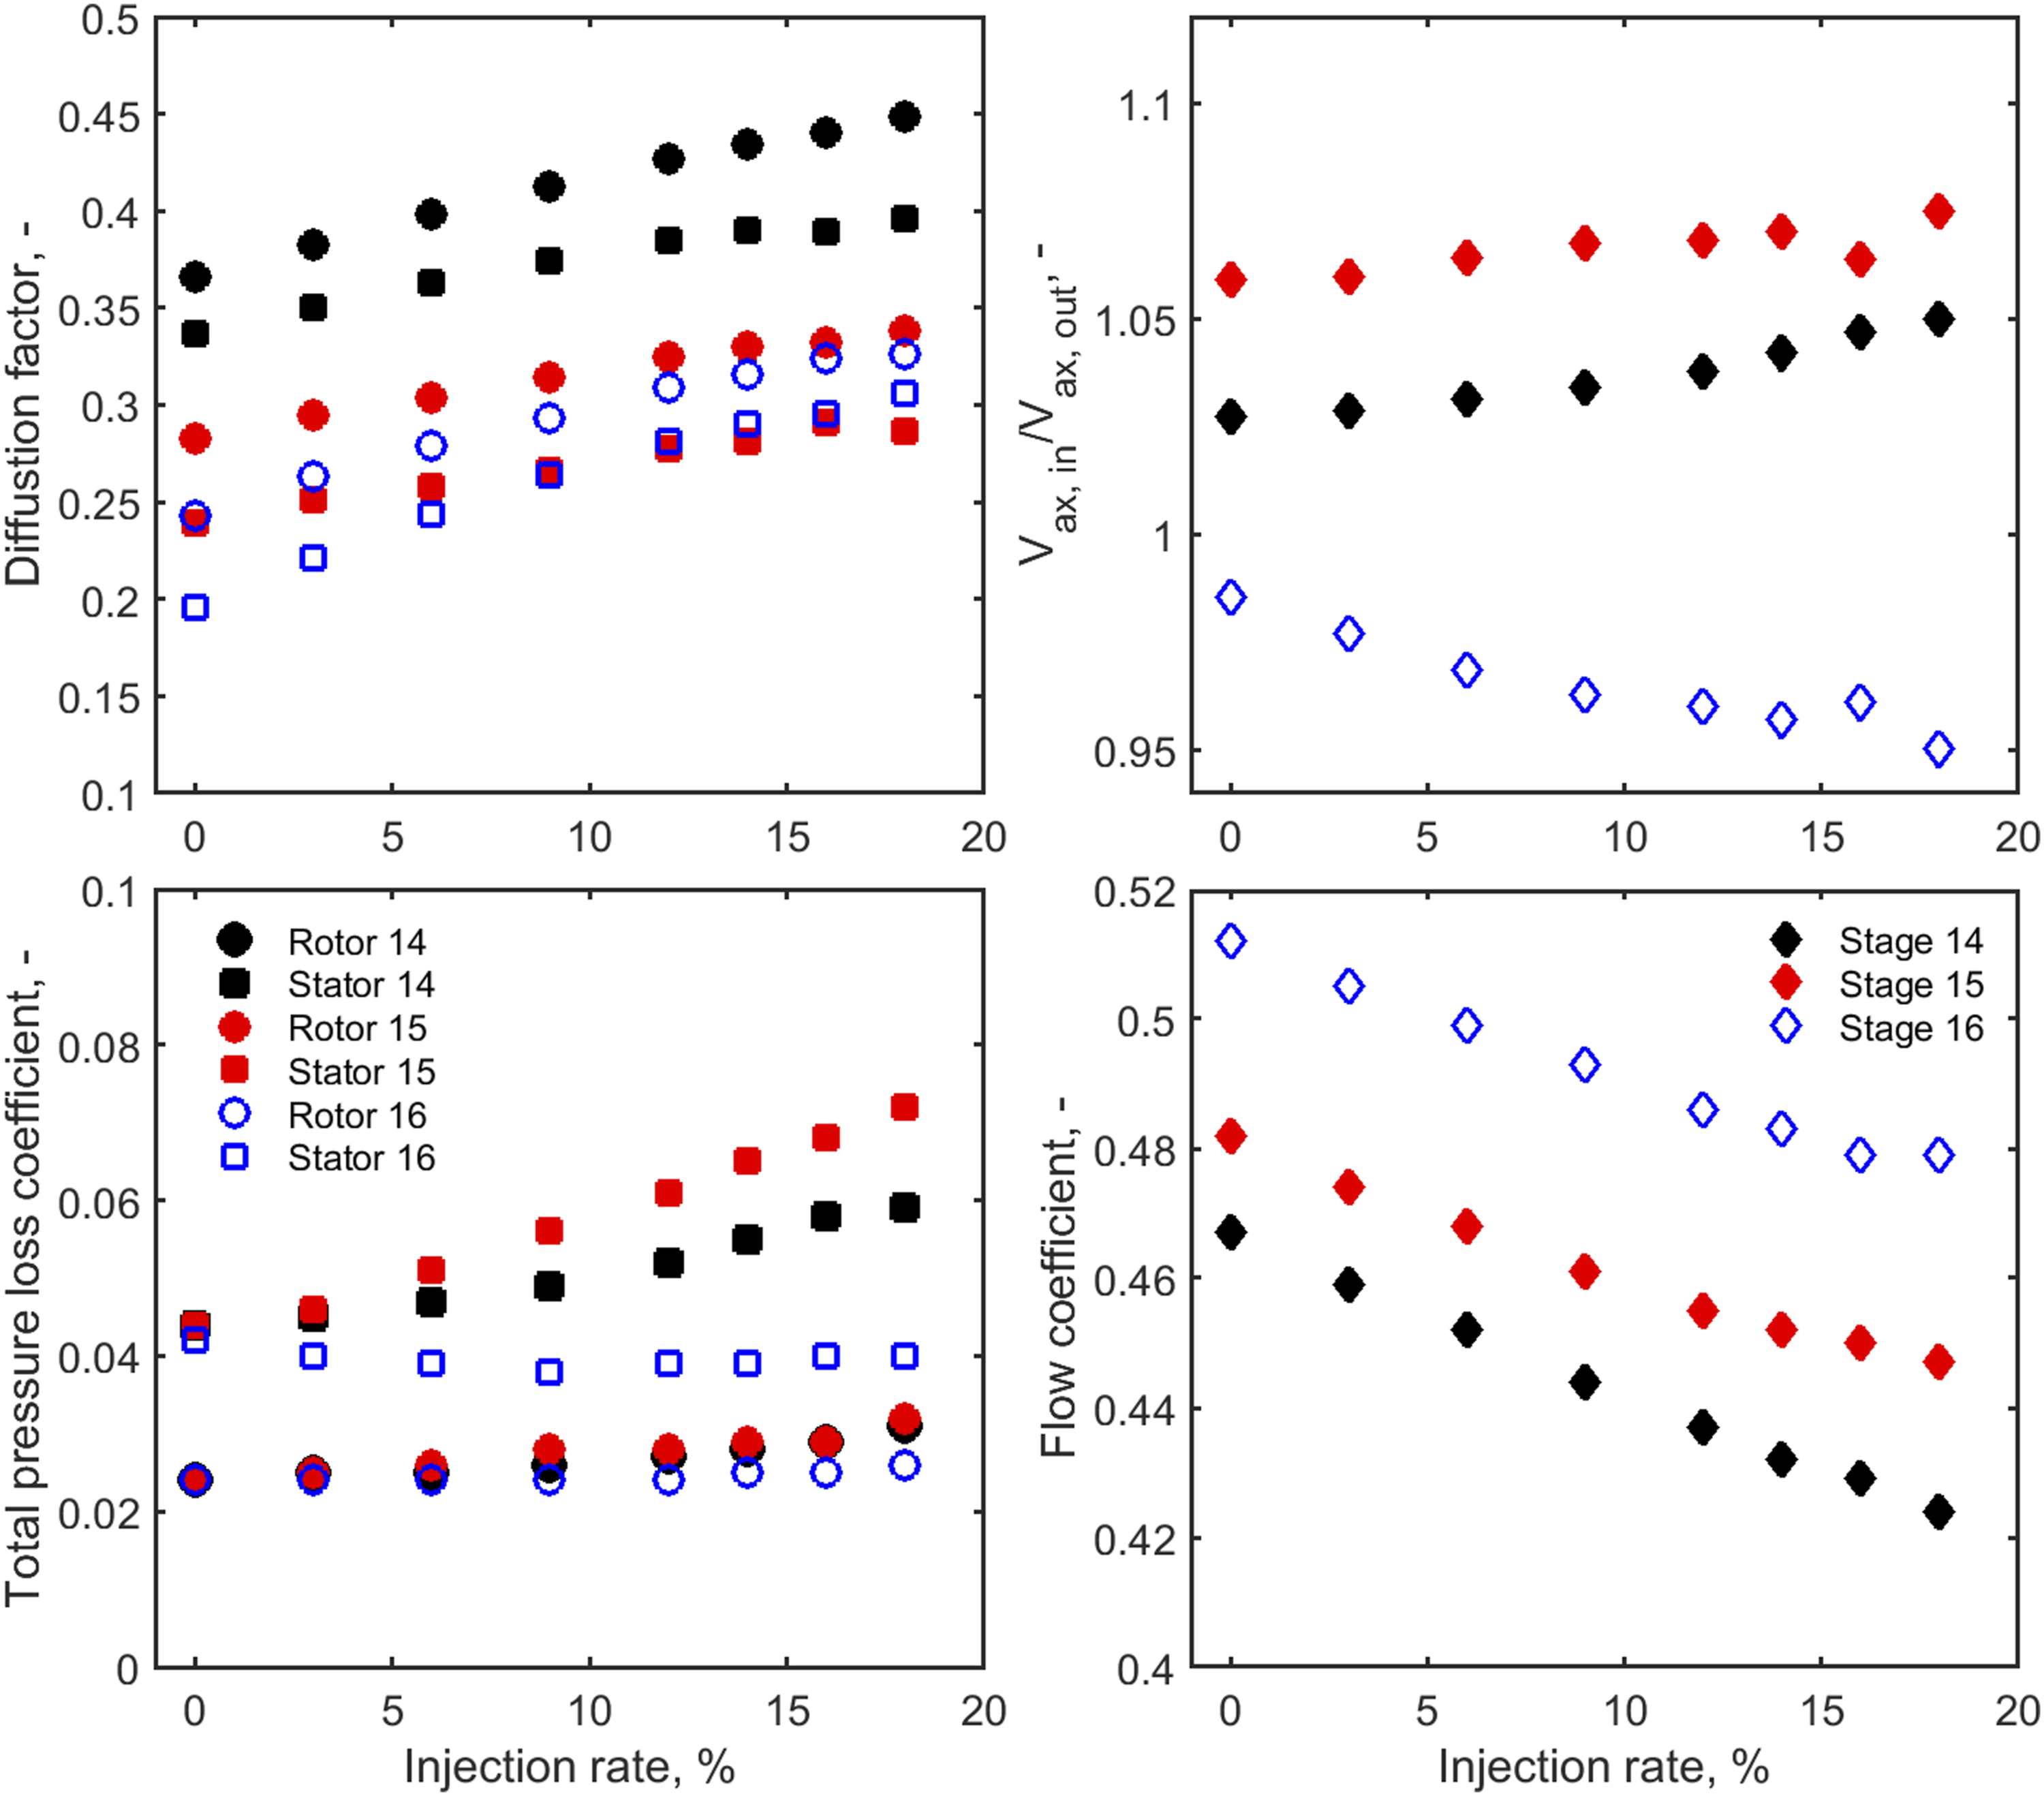
For the axial velocity ratio, stages 14 and 15 are shown to be greater than one in all the cases. These values generally increase with the injection rate; however, the opposite is the case for stage 16. For this stage, the velocity ratio is below unity and reduces with more air injection. This results from the fact that stator 16 is closely followed by the OGV and by design, allows for a smoother change of flow direction, that continues in the OGV section. However, to keep the comparison consistent, the average value of axial velocity was taken from the plane just after the stator 16 trailing edge. For the flow coefficient, the highest values are at the design condition for all the stages. The decreasing value with air injection means that the flow is less axially oriented towards the compressor outlet, and the circumferential component is elevated.
Ramp-up rate enhancement
The study of the ramp-up rate improvement presented here has been informed by Kamal et al.
3
that established the ramp-up schedule (with and without air injection) using a 0D engine model. The work presented here is to further ascertain the aerodynamic feasibility using a higher fidelity model in the same TURBO-REFLEX project. The 0D model used here is identical to the referred study and shows an air injection scheme for a ramp-up in Figure 12. Details of the percentage improvements in the ramp-up with and without air injection are also presented in the referred study that explains the scheme in more detail. However, the general description is provided subsequently. Air injection ramp-up scheme of the 0D engine model implemented.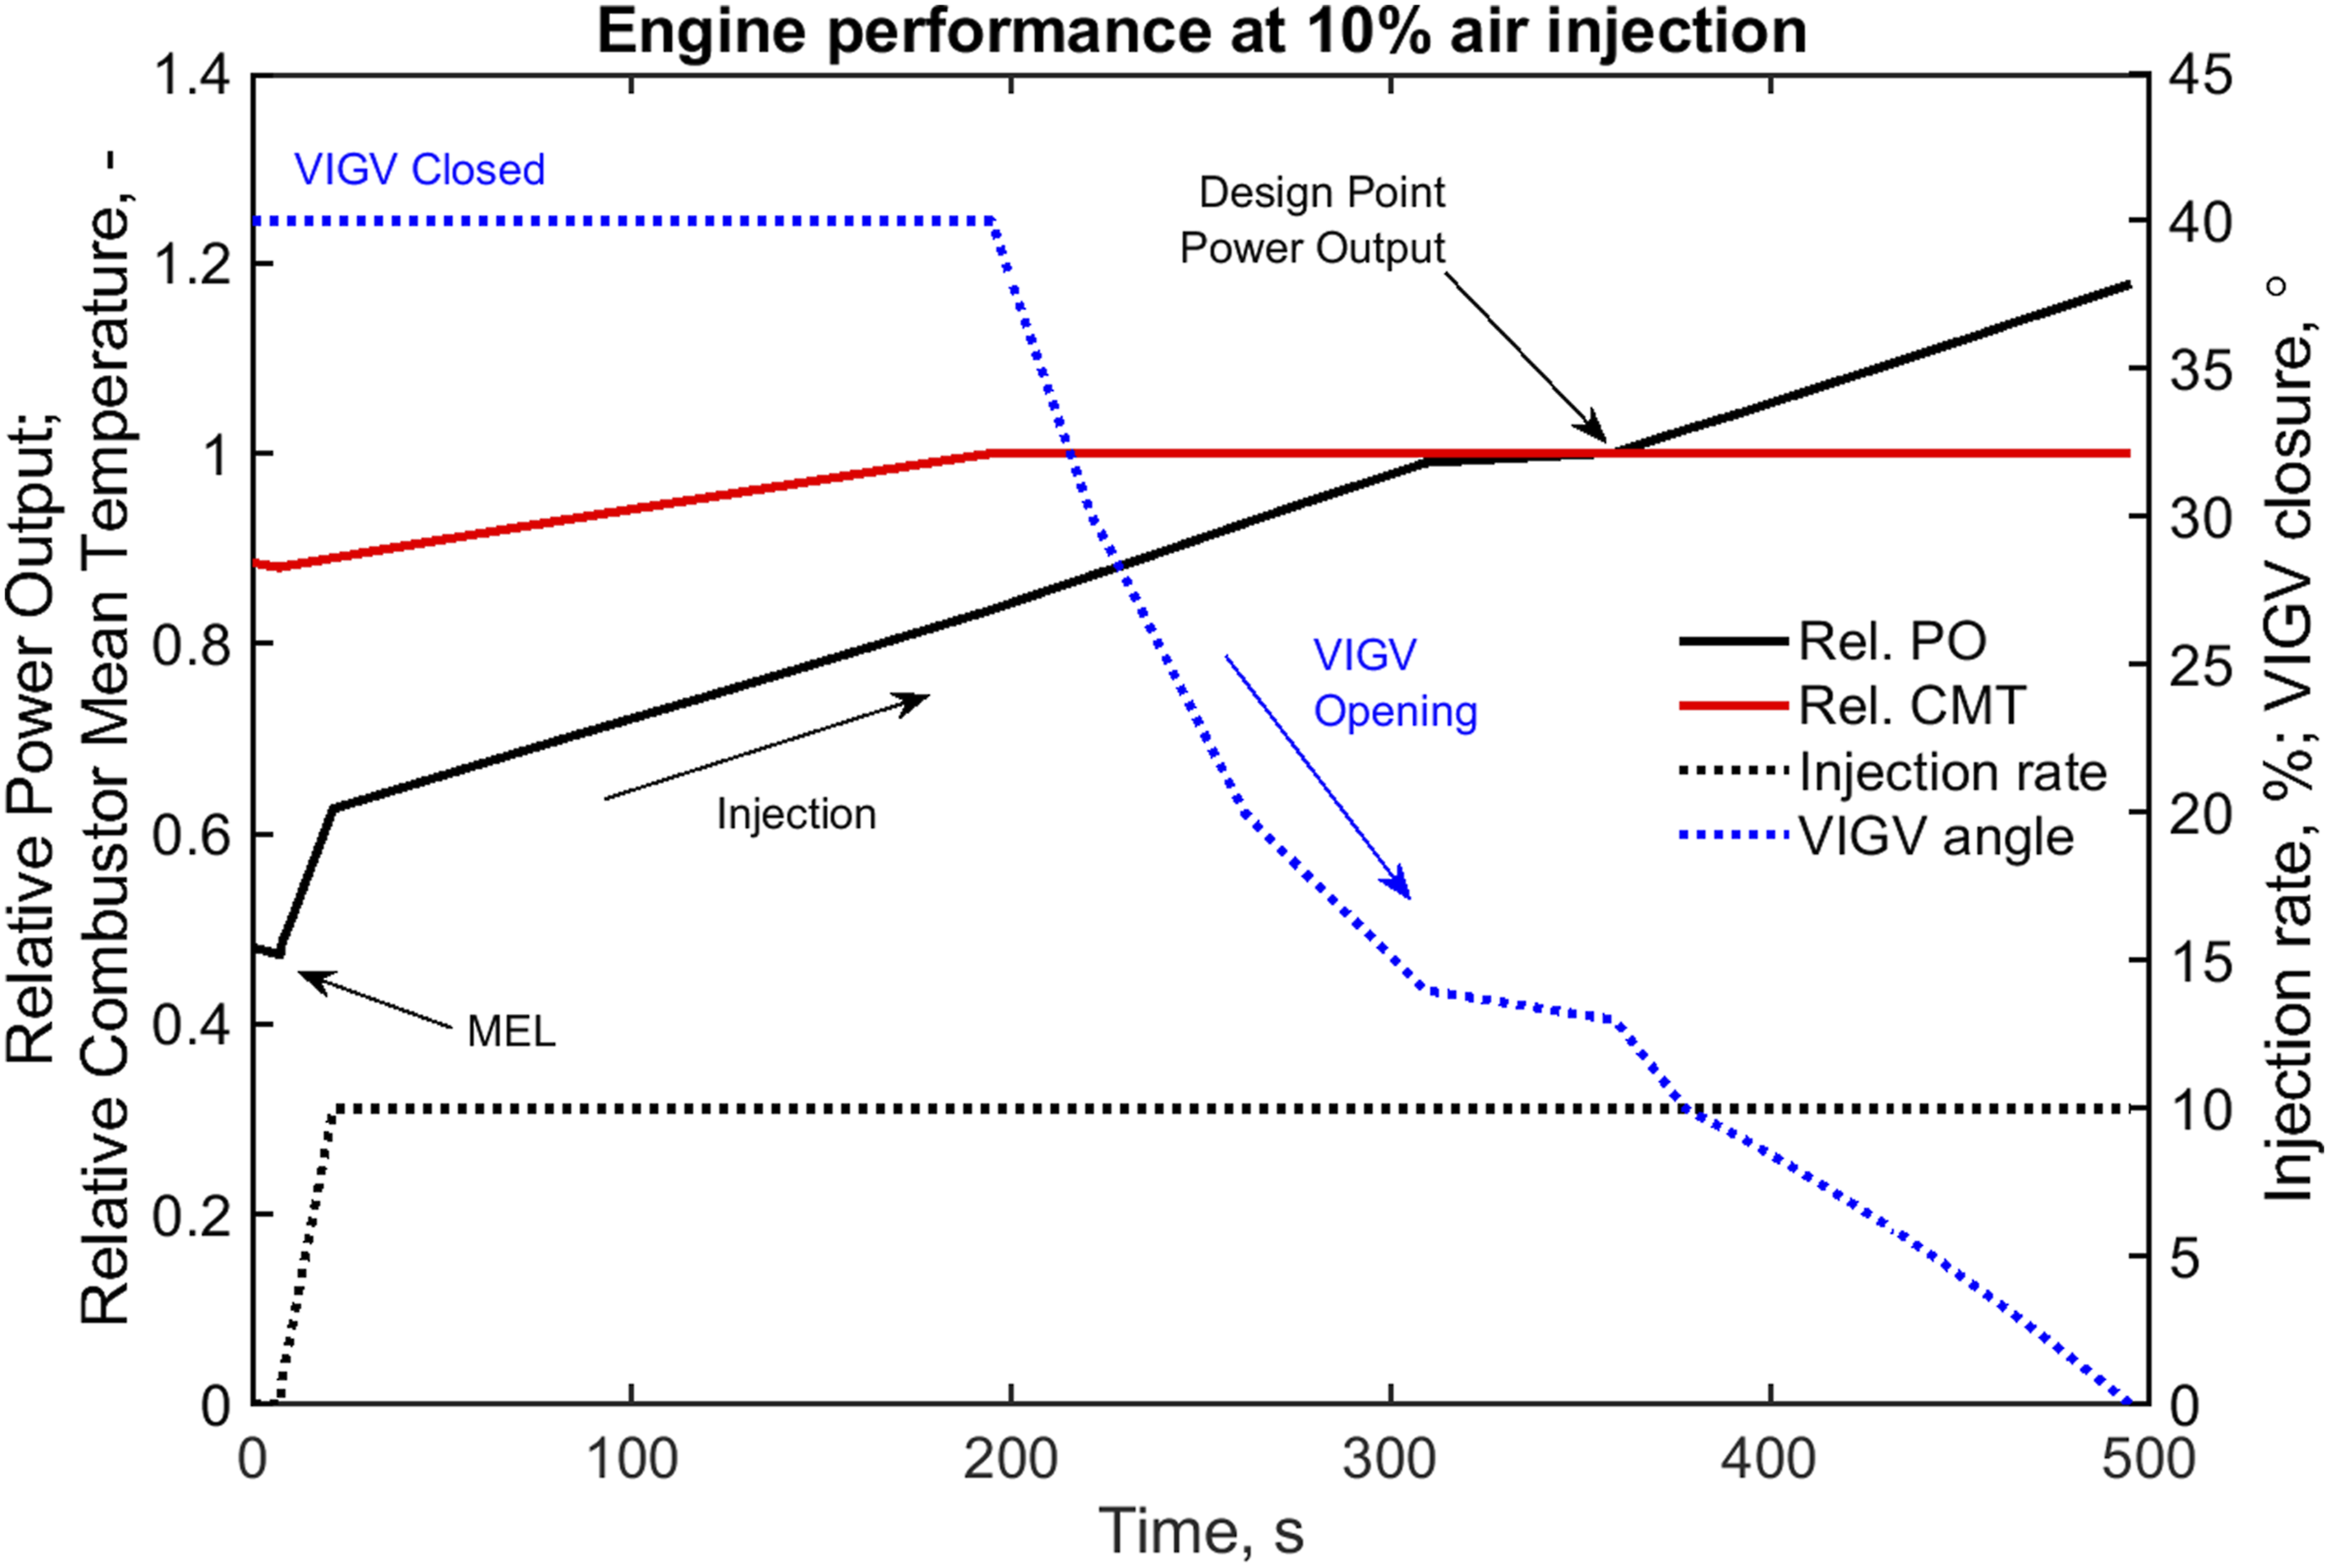
Figure 12 shows that air injection is initiated at 7 s, which is the default minimum environmental load (MEL) of the engine at 0.473 relative power. 16 Prior to this time, the engine is made to ramp down. The main operation is characterised by a closing of the variable inlet guide vane (VIGV) and reductions of the combustor mean temperature (CMT). From 7 s where the ramp-up begins, it can be observed that there is an incremental rise (∼0.7% per second) in the compressed air injected, which is accompanied by a smaller incremental rise in the CMT in the early stages. At 21 s, the maximum air injection of 10% is reached, after which the value is kept constant throughout the operation. In this following period, the CMT is increased with the constant air injection that also steadily increases the power output. The CMT is increased to the point of 193 s where it reaches its design peak value (also where the VIGV begins to open to increase the mass flow). Like the constant air injection, the CMT is kept constant here, with the gradual opening of the VIGV until the default full power is reached at 309 s. The key advantage of the presented operation is that the CMT does not exceed its design point value, reducing the risk of component life consumption. The work of Abudu et al. 3 shows that the duration to reach the default power output is reduced by 171 s.
The corresponding variation in the SMU at the given operation for the various lumped compressor stages (compressor 1–4) of the 0D model is available in Abudu et al.
3
This shows that the SMU of comp 4 peaks where the pressure ratios in the compressor are higher. Comp 4 is prone to stall, however, does not reach an SMU of one; the maximum value observed was 0.99. The CFD simulations were performed at points where compressor 4 operated close to an SMU of one (close to stall condition); this is from 61 to 309 s. Individual operating points across this period are compared with the 3D model, with regards to the pressure ratio of the combined stages in Figure 13. The results show close predictions between both models, with a maximum absolute error of 0.5%. As for the pressure ratios of the individual stages of the 3D model, the results show the expected variation as previously presented. Pressure ratio variation during the ramp-up – 3D (stages 14–16) and 0D (compressor 4).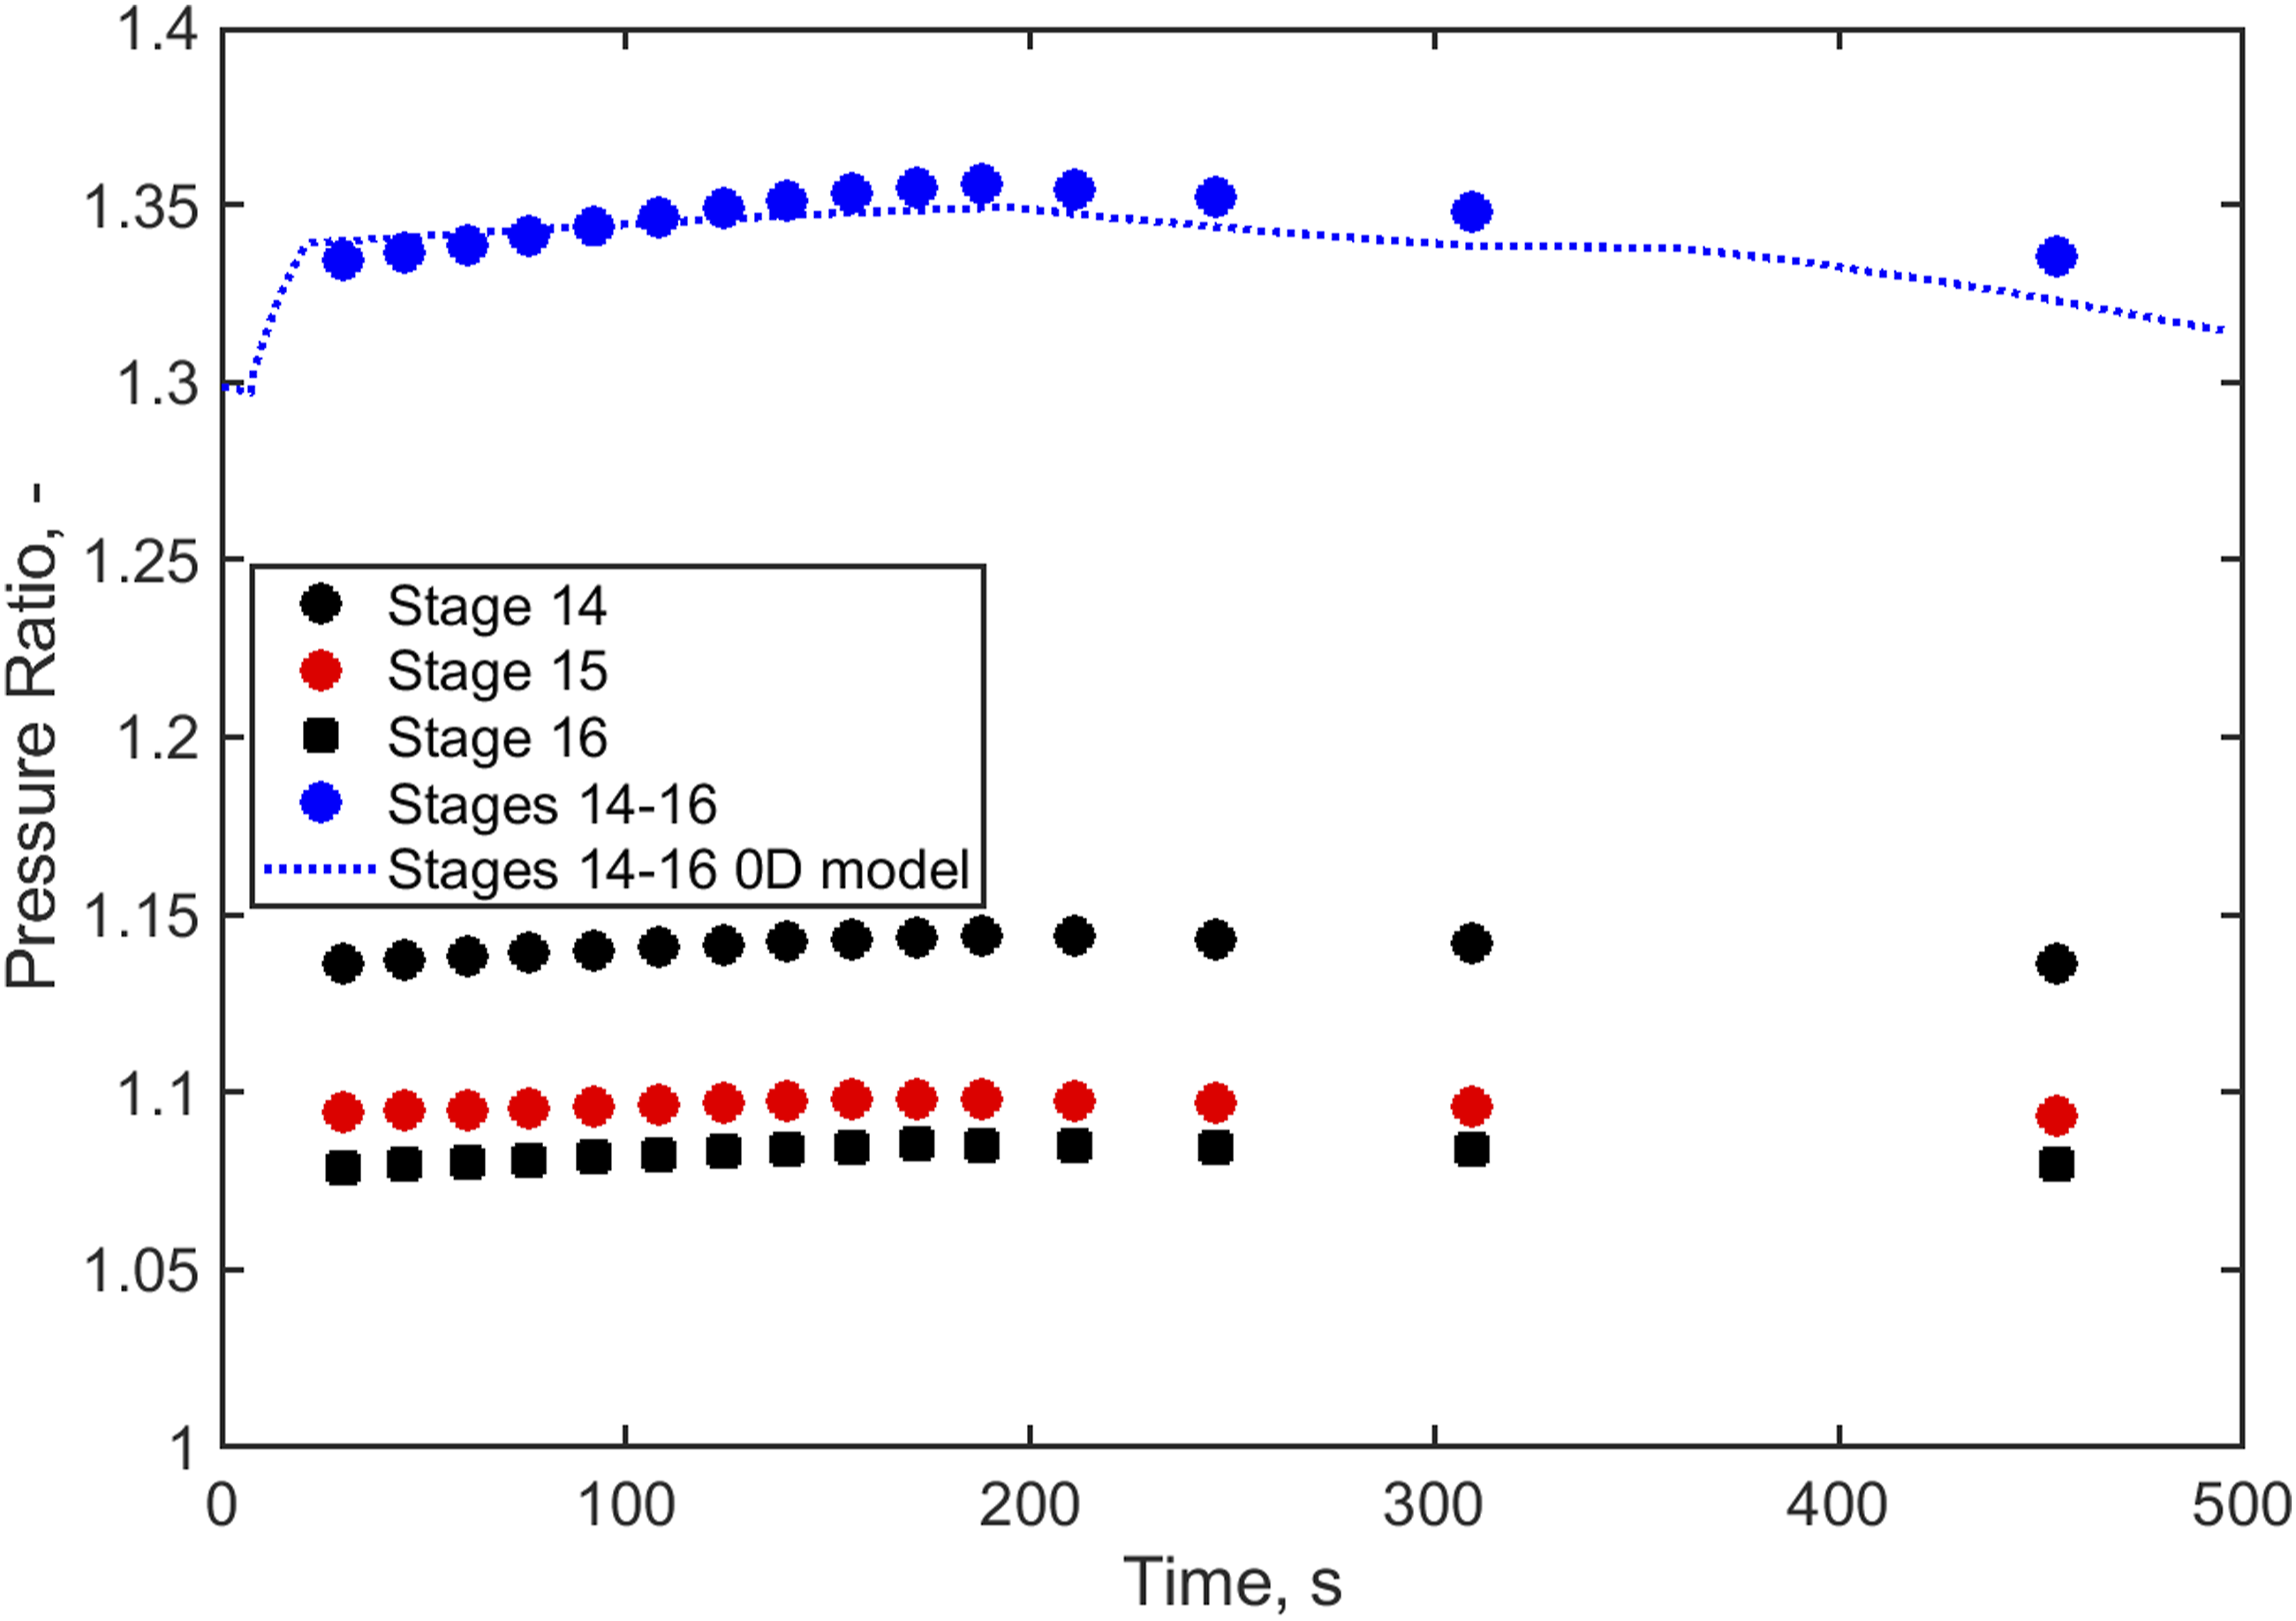
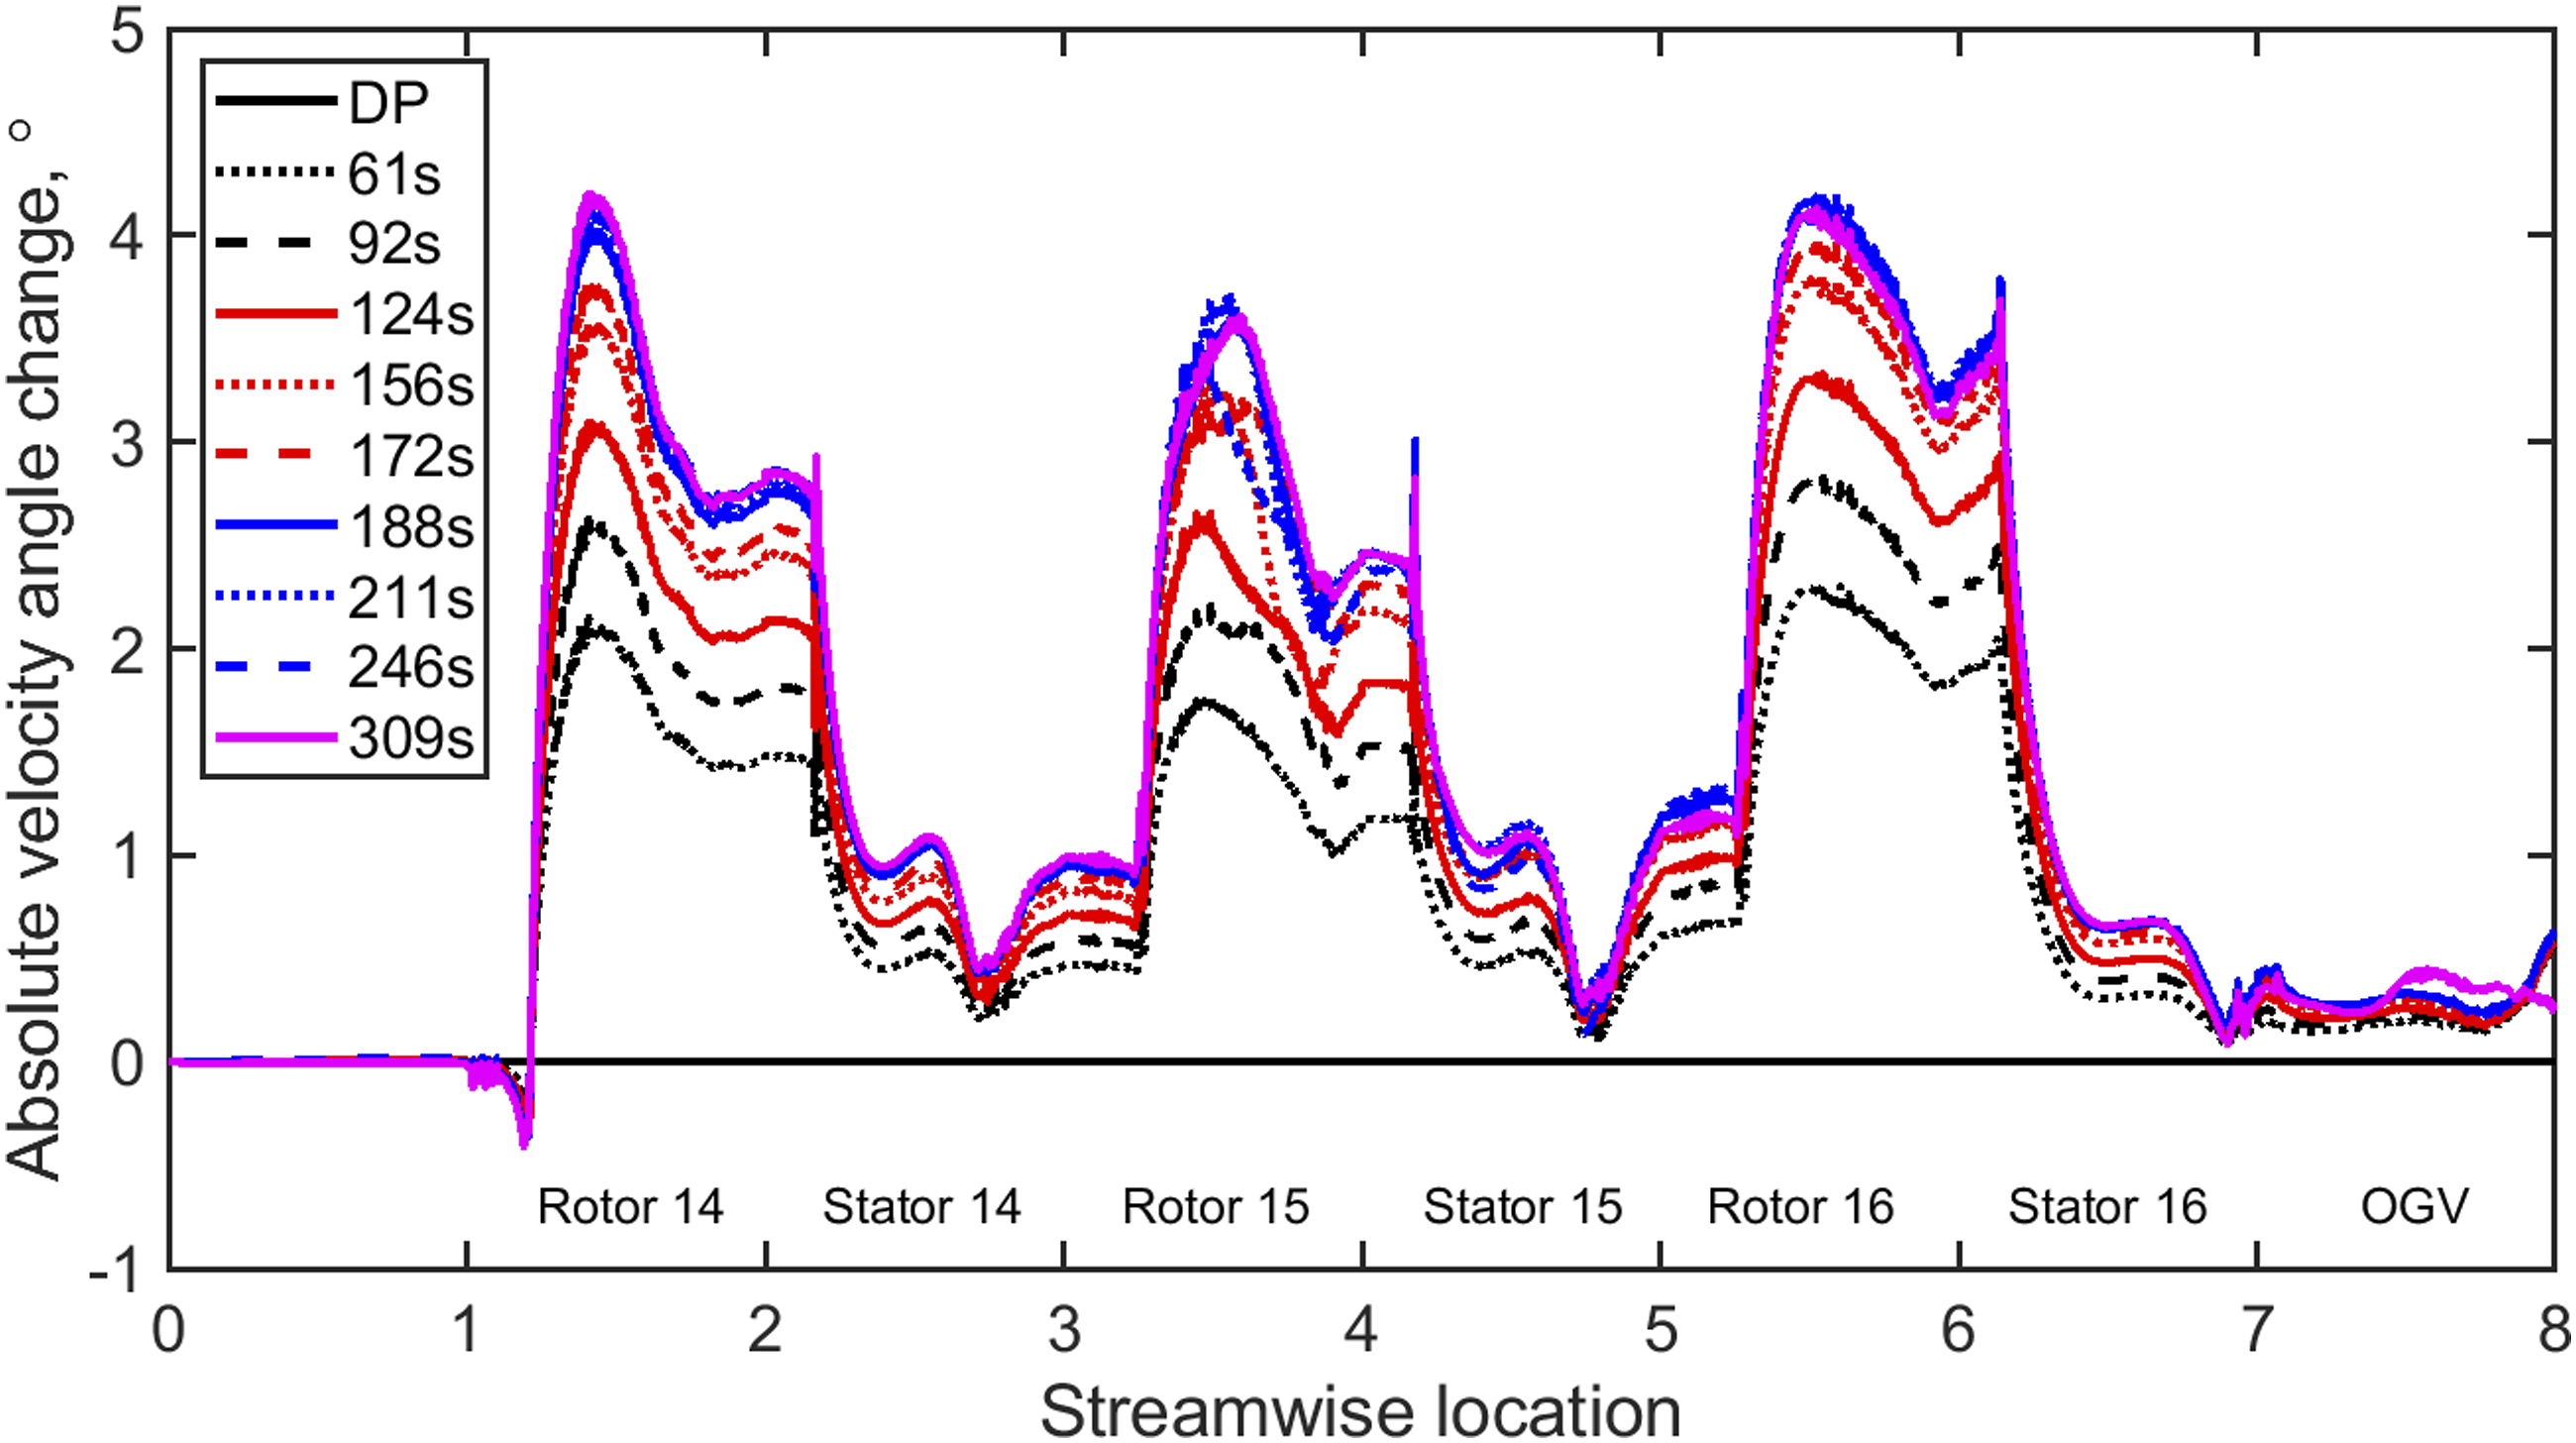
The 3D aerodynamic characteristics (blockage factor, velocity angle, diffusion factor and total pressure loss coefficient) for the ramp-up rate are shown for the given instances between 61 and 309 s. Figure 14 shows the blockage factor at the different instances in the operation, across the stages of the compressor. This shows a maximum blockage factor of 4.8 and 4.7% in the stator 14 and 15 respectively, at 309 s. The distribution indicates that such an operation is possible; however, it is close to the established limits. In relation to the flow angle change in Figure 15, this instance also shows the maximum values. As previously shown in Figure 8, the values for rotors are also greater than those of the stators. Blockage factor across the stages at specific timesteps. Velocity flow angle distribution across the back of the compressor at specific timesteps.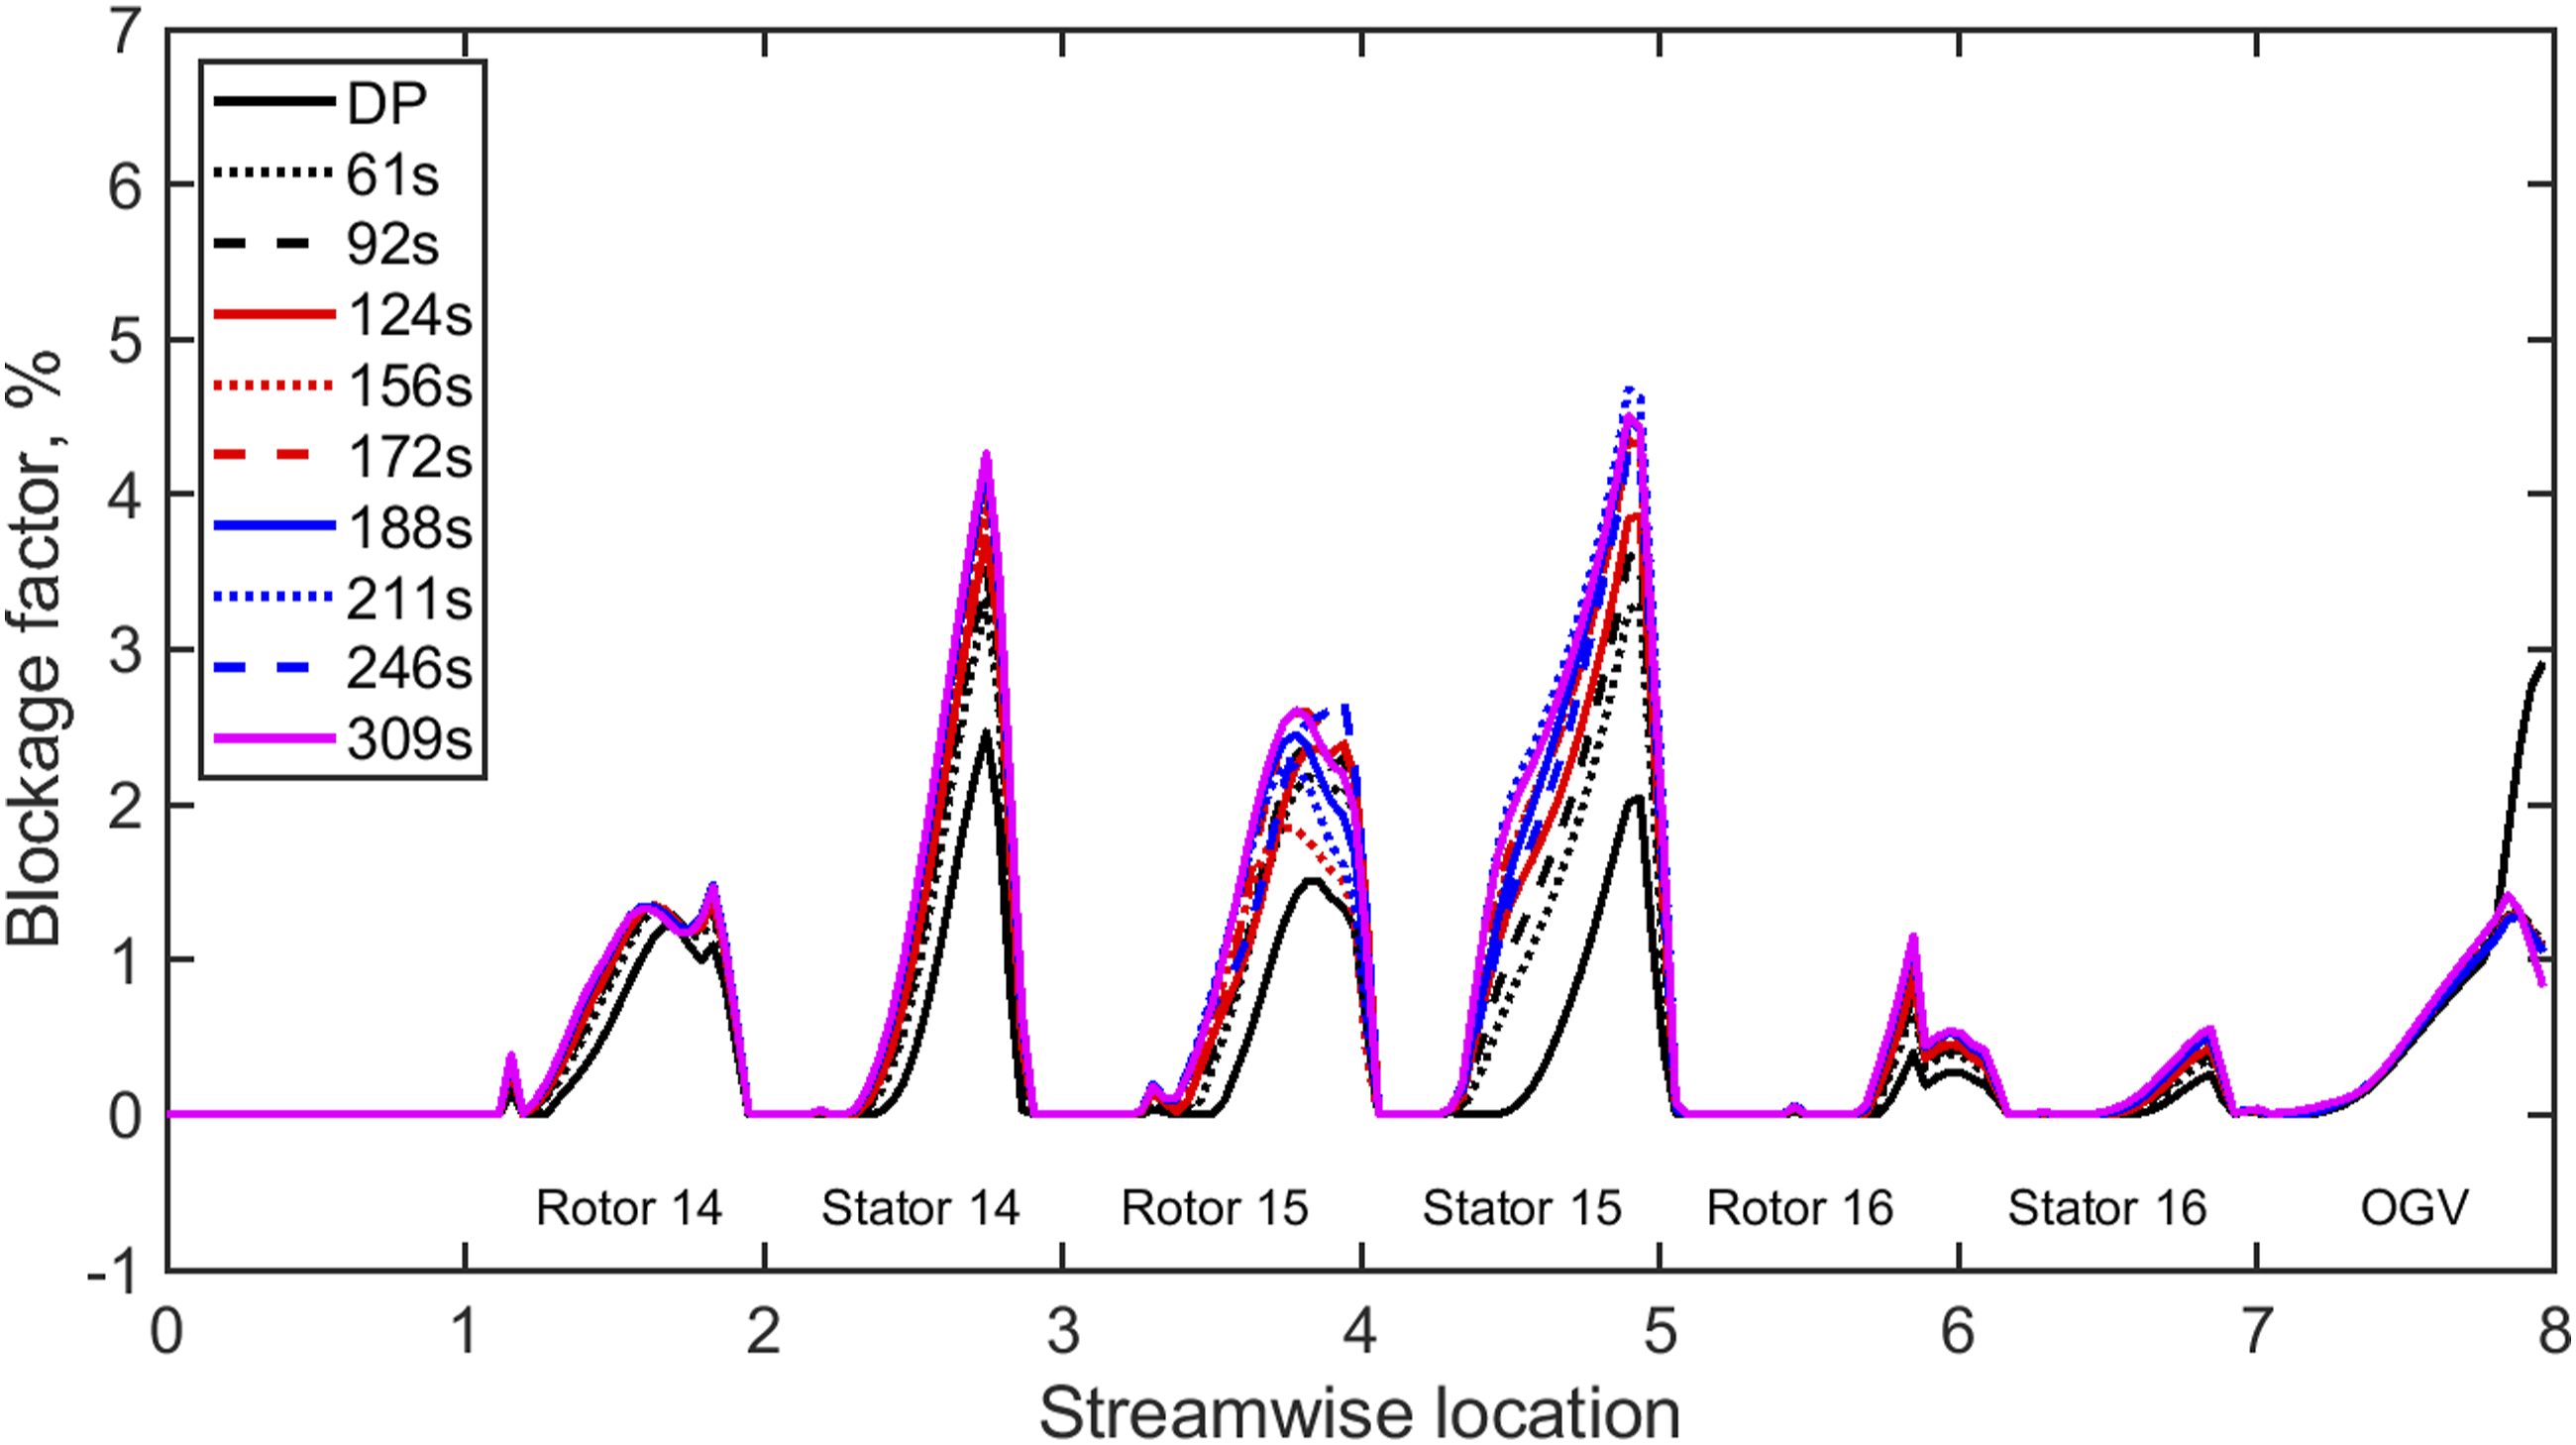
The diffusion factor and total pressure loss coefficient are presented in Figure 16. It shows that the value of diffusion factor approaches the 0.45 threshold for rotor 14 only. As for the total pressure loss coefficient, the stators show more pessimistic values than their corresponding rotors. The pattern shown here is comparable to the case for power augmentation and indicates that the aerodynamic losses increase with compressed air injection. Diffusion factor and total pressure loss coefficient (3D model) related to the engine model timesteps.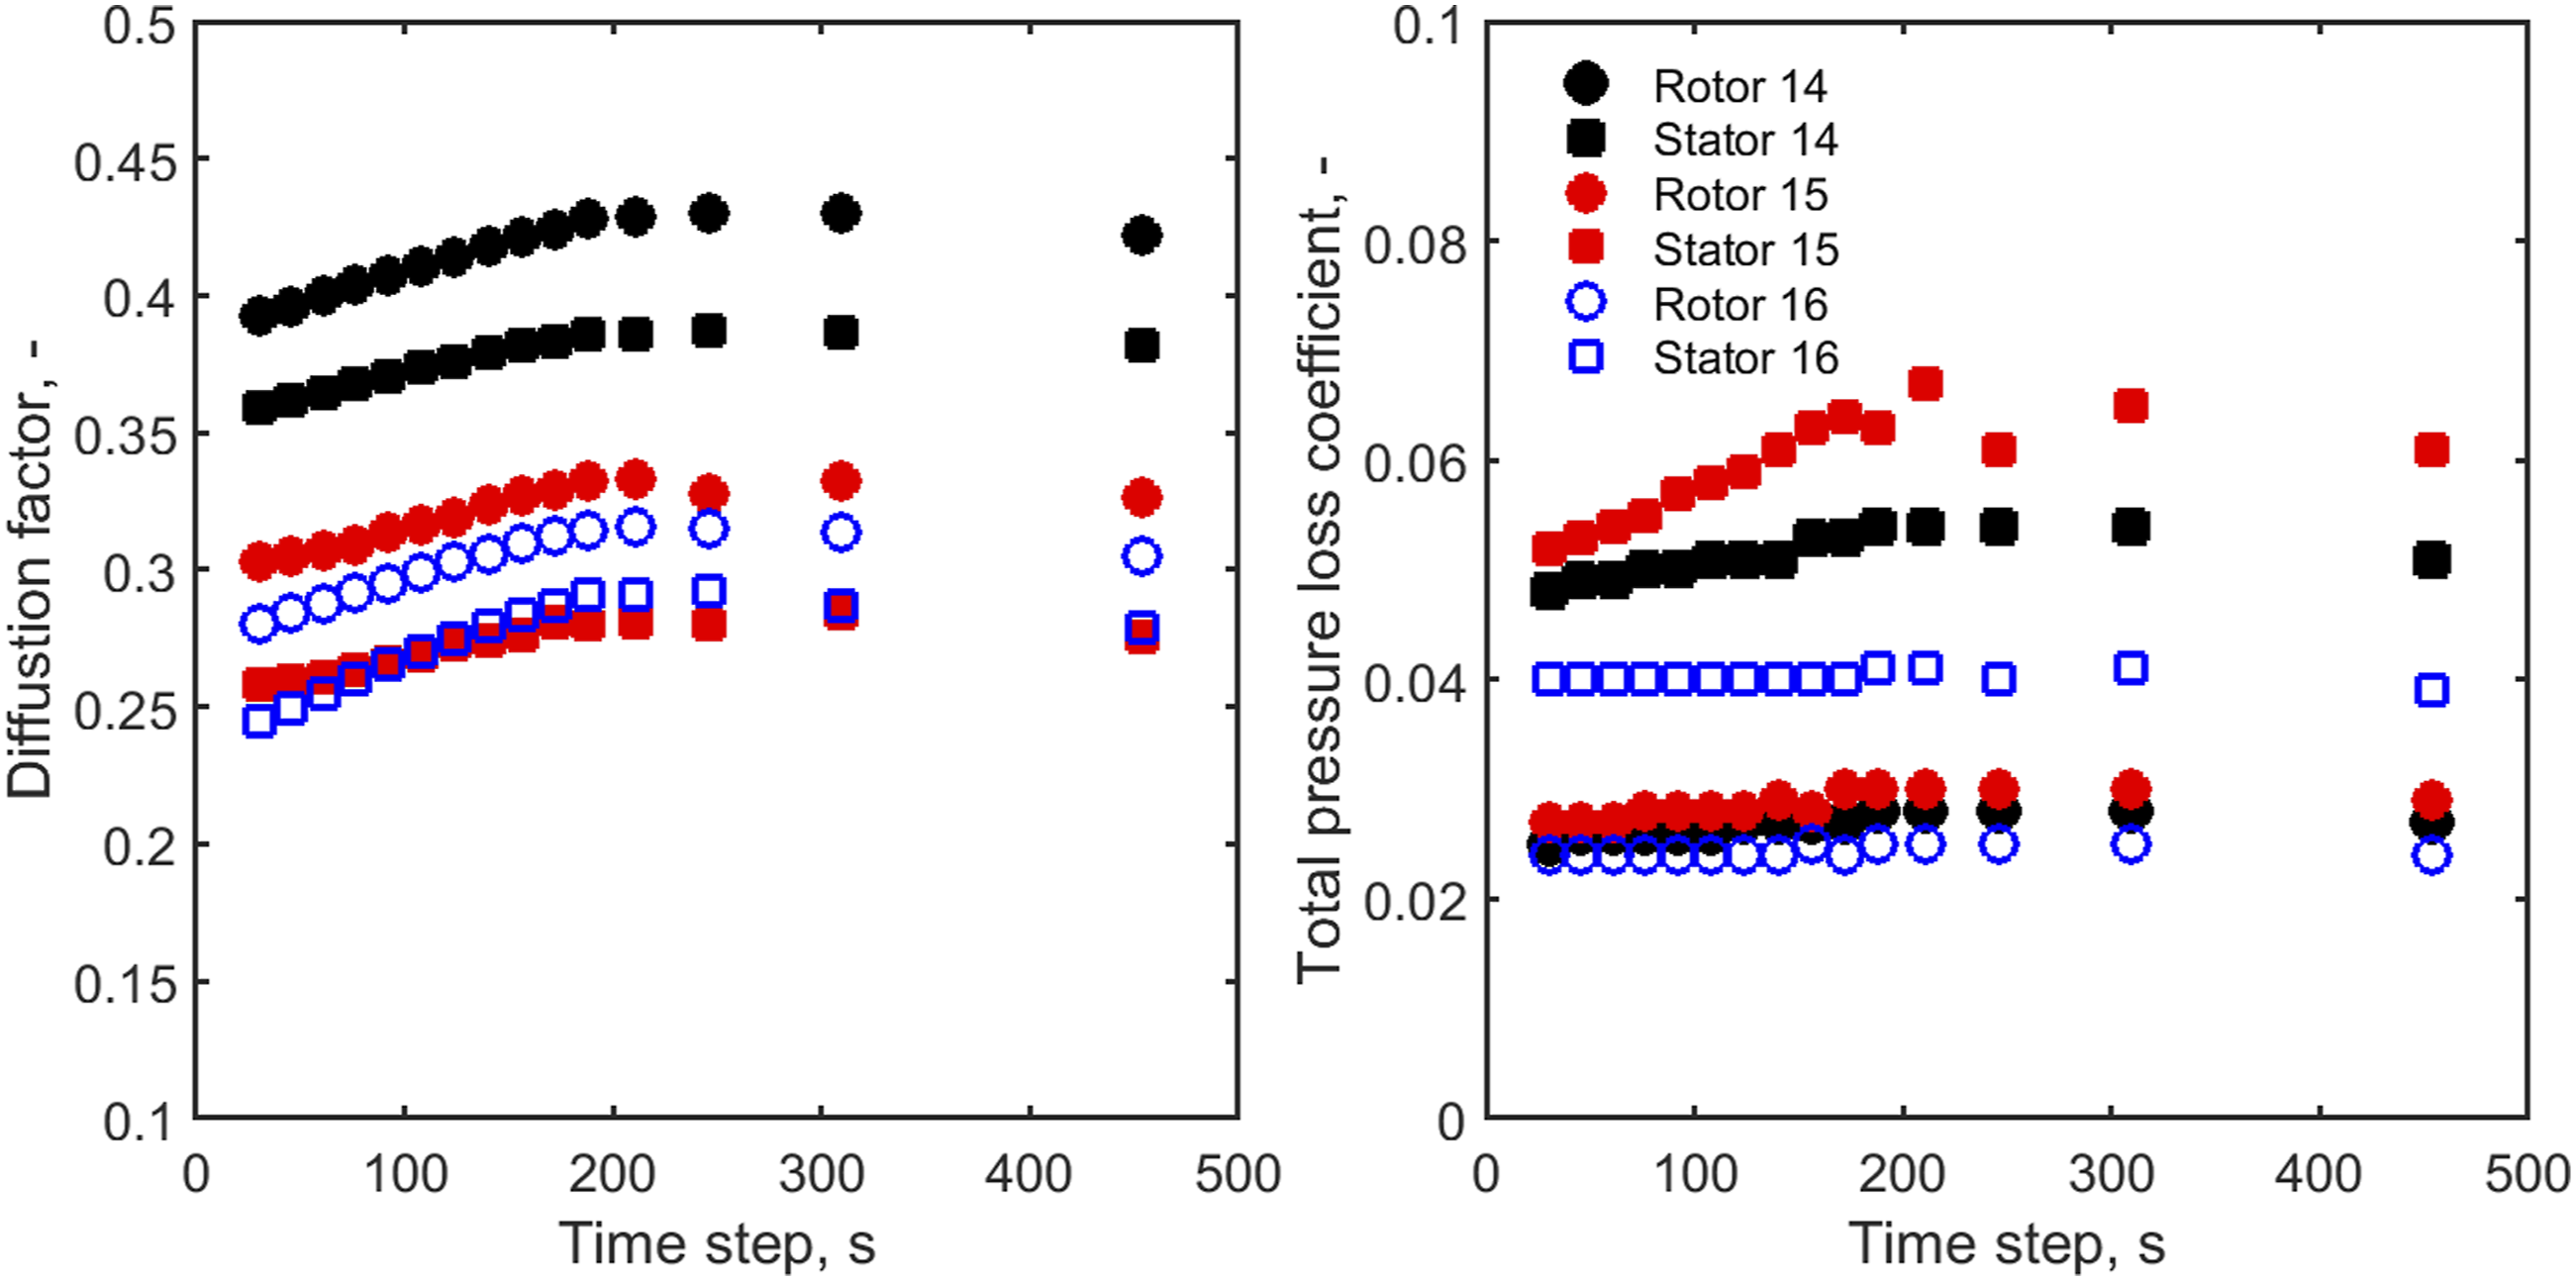
Conclusions
The study investigated compressed air injection at the back of an industrial gas turbine engine compressor, for power augmentation and ramp-up rate improvement. Previously, no study showed the aerodynamic feasibility of this approach in the context of a high-fidelity CFD model. Previously published works of the authors on 0D modelling of the problem with an analytical engine model have been used to establish the boundary conditions for the multi-stage 3D CFD aerodynamic analysis.
The work shows that for the compressor aerodynamic analysis – 3D model: • for power augmentation, up to 16% (with respect to the back of compressor flow) of compressed air injection is allowed based on the metrics used for the identification of stall onset. The compressor air injection worsens the diffusion factor and velocity angle, with the peak values in the stator and rotor respectively. Flow separation occurs and is signified by the increases in the absolute velocity angle and total pressure losses at the tip of the OGV and up to 30% of the hubs (for stator 14, rotor 15, stator 15 and rotor 16). The higher air injection rate increased the velocity angle in all the rotors. The rise was up to 5.1% at the maximum injection rate for the 15°C ambient temperature. Nevertheless, the flow behaviour at the maximum injection rate was the same, regardless of the ambient temperature • for ramp-up rate improvements, up to 10% of compressed air injection is allowable based on the engine-level ramp-up scheme used. Similar aerodynamic behaviour as in the augmentation case was observed. Also, the aerodynamic limits of air injection are attributed to different locations/stages and not a particular one
Engine-level analysis – 0D model and comparative analysis with 3D: • At −5°C, 15°C and 30°C, the maximum compressed air injection limits are 11, 16, and 22% respectively. These estimates are close to that of the 3D analysis with limits of 12, 16, and 20% respectively • the 0D model shows that the stage closest to the injection location is most prone to stall/surge. This is characterised by the highest pressure ratio rise and SMU than the front lumped stages. This is contrary to the 3D model for which the last stage closest to the injection wasn’t the most affected. It is, however, important to state that stages 14 and 15 with high values of diffusion factor and absolute velocity angle already showed high values at the design point, therefore indicating the influence of design performance on the injection cases
The work explored the potential of compressed air injection for power augmentation and gas turbine flexibility improvement, specifically ramp-up rate capability. It has demonstrated the maximum amount of air that can be injected to achieve improved power output and ramp-up rate.
Footnotes
Declaration of Conflicting Interests
The author(s) declared no potential conflicts of interest with respect to the research, authorship, and/or publication of this article.
Funding
The author(s) disclosed receipt of the following financial support for the research, authorship, and/or publication of this article: This study is part of the TURBO-REFLEX project that has received funding from the European Union’s Horizon 2020 research and innovation programme, under grant agreement No. 764545.