
Abstract
Accurate assessment of nozzle guide vane (NGV) capacity is essential for understanding engine performance data, and to achieve accurate turbine stage matching. In accelerated engine development programmes in particular, accurate and early assessment of NGV capacity is a significant advantage. Whilst the capabilities of computational methods have improved rapidly in recent years, the accuracy of absolute capacity prediction capability is lower than experimental techniques by some margin. Thus, experimental measurement of NGV capacity is still regarded as an essential part of many engine programmes. The semi-transient capacity measurement technique, developed and refined at the University of Oxford over the last 10 years, allows rapid and accurate measurement of engine component (typically fully cooled NGVs) capacity at engine-representative conditions of Mach and Reynolds numbers and coolant-to-mainstream pressure ratio. The technique has been demonstrated to offer considerable advantages over traditional (industrial steady-state) techniques in terms of accuracy, time and operating cost. Since the original facility was constructed, the facility has been modularised to allow for rapid interchange of test vane modules, and the instrumentation has been optimised to drive down the uncertainty in NGV capacity. In this paper, these improvements are described in detail, and a detailed uncertainty analysis is presented of the original facility, the current facility, and a proposed future facility in which the uncertainty of the measurement has been driven down to a practical limit. The bias errors of the three facilities are determined to be ±0.535%, ± 0.495% and ±0.301%, respectively (to 95% confidence). The corresponding precision uncertainties are ±0.028%, ±0.025% and ±0.025%, respectively. The extremely low precision uncertainty in particular allows very small changes in capacity to be resolved. This, combined with rapid interchangeability of test modules, allows studies of the sensitivity of capacity to secondary influences with much greater flexibility than was previously possible. Consideration is also given to the definition of vane capacity in systems with several streams at different conditions of inlet total pressure and temperature. A typical high pressure (HP) NGV has three distinct streams: a mainstream flow; coolant flow ejected from film cooling holes (distributed over the vane surface); and trailing edge coolant ejection. Whilst it is helpful for the coolant mass flow rates and inlet temperatures to be included in the definition, only a relatively small difference arises from the way in which this is achieved. Several definitions appear to share similar usefulness in terms of their robustness to changing inlet conditions of individual streams, but the favoured definition offers the possibility of isolating sensitivities to key effects such as trailing edge coolant ejection. This is achieved by explicitly expressing vane capacity as a function of two controlling pressure ratios. The overall purpose of this paper is to review and analyse in detail the current state-of-the-art in gas turbine flow capacity measurement.
Keywords
Introduction
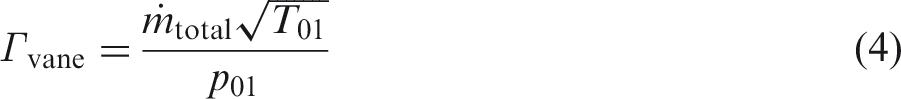
Capacity is commonly defined as
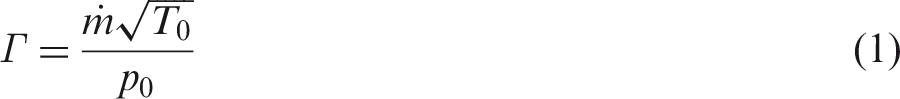
Although this is not a non-dimensional quantity, the formulation is useful because it removes the primary sensitivities of mass flow rate to total pressure and temperature, and gives a parameter which at choked conditions can be thought of as a crude proxy for effective area. In this formulation, capacity is a function of gas properties, γ and R, and the pressure ratio across the vane,
Accurate assessment of NGV capacity (here we refer loosely to the capacity characteristic of the part, but note that most engines operate on the relatively flat part of the curve at near-choked conditions) is important for both performance (stage matching implications) and power (overall core mass flow rate). The exchange rate between capacity and efficiency can be as high as 0.2. Likewise the exchange rate between capacity and engine power is close to unity.
Although high fidelity numerical methods are now deployed routinely for capacity evaluation (fully featured NGV part geometries, with finely resolved meshes), it remains difficult to evaluate vane capacity numerically to high accuracy (better than 1–2%). This is due to the strong dependence of the aerodynamics on features which are at the limit of the process capability to geometrically resolve, and due to inadequacies in the numerical methods.
Errors in the CFD geometry can arise either due to manufacturing variation (real part differs from the casting definition), where the CFD geometry is based on the design CAD, or due to limitations of the scanning process (e.g. by structured light scanning techniques, for example), where the CFD geometry is based on cast parts. Even for processes which use scans of real parts, questions arise regarding how best to clean the geometry (to take it from a cloud of scan points to a clean CAD geometry) and how best to create a part (or parts) from a statistical distribution of geometries. In a high accuracy process, this becomes significant.
Regardless of the method of geometry and mesh generation, elimination of deviations from the real part geometry at a relevant scale for high accuracy capacity evaluation is difficult. To justify this, consider two specific cases. First, the width of the slot formed near the region of minimum area in a modern civil engine is typically of order 10 mm. Hence a 0.1 mm deviation of the numerical mesh from the real part geometry will equate to a capacity discrepancy of order 1%.
Second, consider coolant ejection from a trailing edge slot—either a centred slot, or a slot with a suction side trailing edge overhang. Both configurations are common, with coolant flows up to 2.50% of the mainstream flow. 1 HP NGVs generally operate transonically in this region of the flow path (local Mach number typically in the range 0.8–1.1). The aerodynamic flow field is therefore strongly influenced by the introduction of coolant flow. In particular, the computational method must establish appropriate boundary conditions for the trailing edge coolant slot, and reproduce the geometry with sufficient accuracy. For example, the radius of the trailing edge lands—often dressed by hand—and internal geometry features which define the distribution of coolant flow within the slot. Further, the numerical solver is required to establish the base pressure correctly in a region with three converging high momentum streams (pressure surface, suction surface and trailing edge-coolant jet) separated by four shear layers, in a situation where the underlying flow field is transonic and highly unsteady. Numerical prediction of unsteady flow phenomena considerably increases the computational cost and requires accurate modelling of turbulent dissipation effects.
It is perhaps unsurprising that, even with rapid advances in computational capabilities in recent years, first-time prediction of capacity to high accuracy is extremely challenging. The purpose of ultra-high accuracy experiments is therefore twofold. First, such experiments can be used for direct capacity evaluation of a particular vane, for engine optimisation during a development programme. Second, building up a bank of ultra-high accuracy experimental measurements provides a reference source for continual development and calibration of numerical capacity prediction processes (both the generation of input geometry, and the CFD solution method).
A minimum requirement for ultra-high accuracy experimental evaluation of vane capacity is a fully annular facility with real engine NGVs, operated at appropriate non-dimensional conditions of Mach and Reynolds numbers. For this reason, capacity measurement has generally been the domain of the OEM due to the prohibitive expense of high-TRL (technology readiness level) facility operation. Much of the effort on the part of the OEM has been aimed at direct validation of capacity for engine design optimisation. Experiments to understand particular sensitivities (e.g. film cooling configuration, trailing edge coolant ejection, coolant-to-mainstream pressure ratio, platform gaps and leakages, etc.) have therefore been rather limited, as have efforts to minimise uncertainty—by whatever means—in the experimental method. Indeed, other than two early papers (referenced below) the only sustained effort towards low-uncertainty capacity measurement and understanding is from the group involved in this paper.
In 1984, Fielding 2 examined the relationship between downstream energy loss coefficients and boundary layer characteristics at the trailing edge, and defined a parameter which he called restriction factor, to account for viscous effects in the vane passage. It can be thought of as a fraction of passage area ‘lost’ due to momentum deficit in the boundary layer regions. Accounting for losses in this way, as opposed to a basic irreversible 1D estimation, was found to give a change in the estimated capacity value for a typical turbine vane of around 2.4%. In 2004, Afanasiev et al. 3 showed computationally that vanes with identical minimum geometric area but different loading distributions can have differences between their capacity characteristics of up to 10%. The difference arises due to a shift in position of the controlling minimum area in relation to the passage. Although retrospectively unsurprising, the importance of this result is highlighted by the persistence, even today, of over-simplistic attempts to reconcile capacity differences between different vanes by ultra-high accuracy measurement of geometric throat area. With improved understanding of the aerodynamic sensitivities (to small design features) of typical HP NGVs, it rapidly becomes apparent that such attempts are unlikely to be successful. Even defining a geometric throat for a highly 3D modern part presents its own challenges.
So far as the published work from the current group is concerned, in 2010, Povey 4 presented an analytical model for estimating the impact of film cooling on capacity based on fundamental cooling performance parameters. This work can be thought of as an extension of Fielding 2 to include film cooling. A control volume mixing approach was employed, in which, importantly, the free-stream static pressure was allowed to vary in the flow direction, in line with the models of, for example, Kollen and Koschel. 5 The conclusions from this work are summarised later in this paper.
In a related 2011 paper, Povey et al. 6 described for the first time a novel semi-transient experimental technique for NGV capacity measurement. By careful experimental design, the semi-transient technique offered a shorter test duration (approximately 60 s), reduced operating cost, and improved precision and bias uncertainty relative to the conventional (continuously running) industrial method. A fully annular cascade of engine components was operated at non-dimensionally engine representative conditions of Mach number, Reynolds number and coolant-to-mainstream pressure ratio. Precision and bias uncertainties in vane capacity of ±0.028% and ±0.546%, respectively, were achieved (to 95% confidence). Of the ±0.546%, ±0.500% was inherited from the primary mass flow metering nozzle. This is the bias error in the nozzle calibration, traceable to an international standard. The method was designed to minimise the small additional uncertainty (+0.046%) arising from the experimental measurement process. In the same paper, the impact of the definition of the vane exit static pressure on the capacity characteristic was considered. Simplified 1D, 2D (radial pressure profile) and 3D (radial and circumferential pressure profiles) analytical models were compared to experimental data for a modern HP NGV. A poor match between the shape of the experimental characteristic and any of the analytical models demonstrated the complexity of the flow environment. This highlights the pitfalls of applying simplified logic based on 1D isentropic equations (e.g. the simplistic—in this context—concept of a throat). The disagreement (between models and experiment) in both shape and absolute level were taken to be partly due to total pressure loss, but primarily due to the difficulty in establishing a pressure measurement at a point of well-defined area. This latter point is interesting: the most robust measurement location for static pressure (see later discussion) is on the vane downstream platform, but this is reasonably far from the controlling region where the area is smallest (however defined). In contrast, at locations of well-defined area it would be hard to measure pressure boundary conditions adequately with any practical instrumentation (indeed, an integration across a plane would be required to measure capacity directly).
In 2012, Hambidge and Povey 7 investigated the impact of a typical film cooling arrangement on HP NGV capacity using a 2D numerical method. This is can be thought of as a computational extension of Povey. 4 For a typical vane operating at unit Mach number, introducing film cooling was found to cause a 0.125% fall in capacity. This was compared against the analytical model of Povey, 4 which predicted a corresponding capacity drop of 0.144%. It was demonstrated that the effects of multiple rows blowing simultaneously can be closely approximated by superposition of each row blowing in isolation. The errors incurred in making this simplification were of order 0.01% of overall vane capacity. It was therefore concluded that the impact of film cooling typically depends primarily on coolant mass flow, and to a much lesser degree on the actual film cooling arrangement. The impact can likely be adequately accounted for via analytical methods, correlations based on single-row experiments or simulations, or simple 2D CFD.
Since 2011, the semi-transient technique reported by Povey et al. 6 has been used to support a number of engine programmes, and has been the subject of continuous validation and improvement over a series of more than 10 major test campaigns. This facility (Povey et al. 6 ) is referred to as the original facility. The semi-transient method has been demonstrated to have equivalent or higher accuracy (made possible by more accurate control of experimental conditions) than continuous running facilities, but offers very significant savings in both time and cost. In 2014, the Oxford capacity facility was upgraded to become part of the Oxford Engine Component Aerothermal (ECAT) test bed, offering significantly enhanced capability including metal effectiveness and downstream traverse measurements. 8 This facility (Kirollos et al. 8 ) is referred to as the current facility.
With the maturation of the test technique, and the desire for ever-greater accuracy in capacity evaluation, there has been a drive to further optimise the accuracy of the technique, to allow for ultra-low uncertainty (primarily bias error) measurements. This has become particularly relevant in recent years, as the calibration uncertainty of primary nozzles can now be as low as ±0.250% (half the typical lowest uncertainty possible when the original facility was built). This paper concerns key improvements to the test methodology which lower the overall uncertainty of the measurement technique. In particular, improvements in experimental hardware and instrumentation, test methodology, and processing. The impact of each improvement on the additional bias uncertainty in the final capacity measurement is evaluated, and the precision error in the mean is evaluated from a series of repeat experiments. The improvements to the test technique and working section are:
Modular construction of the working section and NGV cascade module. This offers improved test efficiency, rapid interchanging of NGV modules, and reduced bias error between repeat test campaigns using the same cascade. Reduced uncertainty in cascade inlet conditions of stagnation pressure and temperature due to increased quantity of measurements. Reduced uncertainty in cascade exit conditions of static pressure distribution due to increased quantity and density of measurements. Independently metered coolant supply streams, allowing for improved benchmarking of coolant mass flow rates. This allows studies of, for example, sensitivity of capacity to coolant-to-mainstream pressure ratio and mass flow rate. Because the bias uncertainty in the measurement of coolant stream mass flow rates is uncorrelated to that in the mainstream mass flow rate, independent metering offers a small reduction in overall bias error.
Each of these aspects—and the associated impacts on the measurement process uncertainty—will be discussed and analysed in turn. The overall uncertainty in the measurement of vane capacity is discussed in detail and compared between the current 8 and original 6 facilities. A proposed upgraded facility is also considered. This would take advantage of improvements in nozzle calibration to reduce the primary nozzle calibration uncertainty from ±0.500% to ±0.250%. This improvement derives from advances in the accuracy of the techniques employed at the primary calibration station (a gravimetric method is used, and instrumentation has improved in recent years.). The facility would then represent state-of-the-art in every respect, and defines a practical limit for uncertainty in such facilities. The paper concludes with a detailed comparison of bias, precision, and overall uncertainty in vane capacity measurement in each of the original, current, and proposed upgraded facilities.
Achieving ultra-low uncertainty in the measurement technique makes it possible to examine and understand the impact on capacity of secondary influences such as film cooling, trailing edge coolant ejection, surface deterioration, vane inlet conditions of swirl and turbulence, and small geometry features such as discontinuities and irregularities from casting and installation.
Experimental facility
The Oxford ECAT facility is an engine-scale, semi-transient blowdown facility. Air is stored at 400 psi (27.6 bar) in 60 m3 tanks, allowing tests at very high energy density for sustained periods (up to 100 s) at relatively low installed plant cost. During a test, the air is discharged through an annular cascade of HP NGVs. The facility is typically used to investigate engine parts from current civil engines. Thus the parts typically have heavy film cooling and coolant ejection from a trailing edge slot. A high degree of non-dimensional similarity (to engine operating conditions) is achieved in the facility, with Mach number, Reynolds number and coolant-to-mainstream pressure ratio being matched. A schematic diagram of the test bed layout is shown in Figure 1.
Schematic diagram of the capacity test core installed in the Oxford ECAT test bed.
The facility can be built with a variety of working sections dedicated to metal effectiveness, downstream loss, capacity measurements, or any combination of these. The facility has the capability to replicate both rich-burn and lean-burn inlet conditions, including swirl and temperature profiles. Further details of the ECAT facility capabilities for aerodynamic and heat transfer measurements can be found in Kirollos et al. 8 The facility has a unique modular construction which allows different vane modules to be rapidly interchanged without compromising the sealing integrity. The vane module is built as a stand-alone assembly. Because of the variability in engine parts, wet-seals are required to make up gaps at the platform interfaces. Module components are held in place by a steel fixture during the sealing process to ensure precise alignment of the built module, with gaps to accommodate sealant and allow for slight part variability. Cassettes around the annulus allow easy insertion and reconfiguration of upstream instrumentation. The construction, sealing and testing of the vane module is described in the following section.
The ECAT facility can operate in two modes: blowdown mode or regulated mode. Blowdown mode is used for measuring capacity over a wide range of operating conditions. In this mode, total temperature and pressure at the cascade inlet steadily drop over the course of a test as the supply air tanks are slowly depleted. Pressure and temperature characteristics from a typical run (blowdown mode) are shown in Figure 2. The blue line represents the inlet total pressure of the mainstream feed. After an initial transient of approximately 15 s, the pressure settles to a stable characteristic (between 20 and 85 s) during which time the capacity measurement is performed. The yellow and green lines (which overlay almost exactly) represent coolant total pressures measured in the hub and case feed plena respectively. The ratio of hub and case coolant-to-mainstream mass flow rates are carefully set to match the coolant-to-mainstream total pressure ratios to the engine design condition during the period of stable operation.
Pressure (a), temperature (b) and vane pressure ratio (c) characteristics during a typical blowdown run.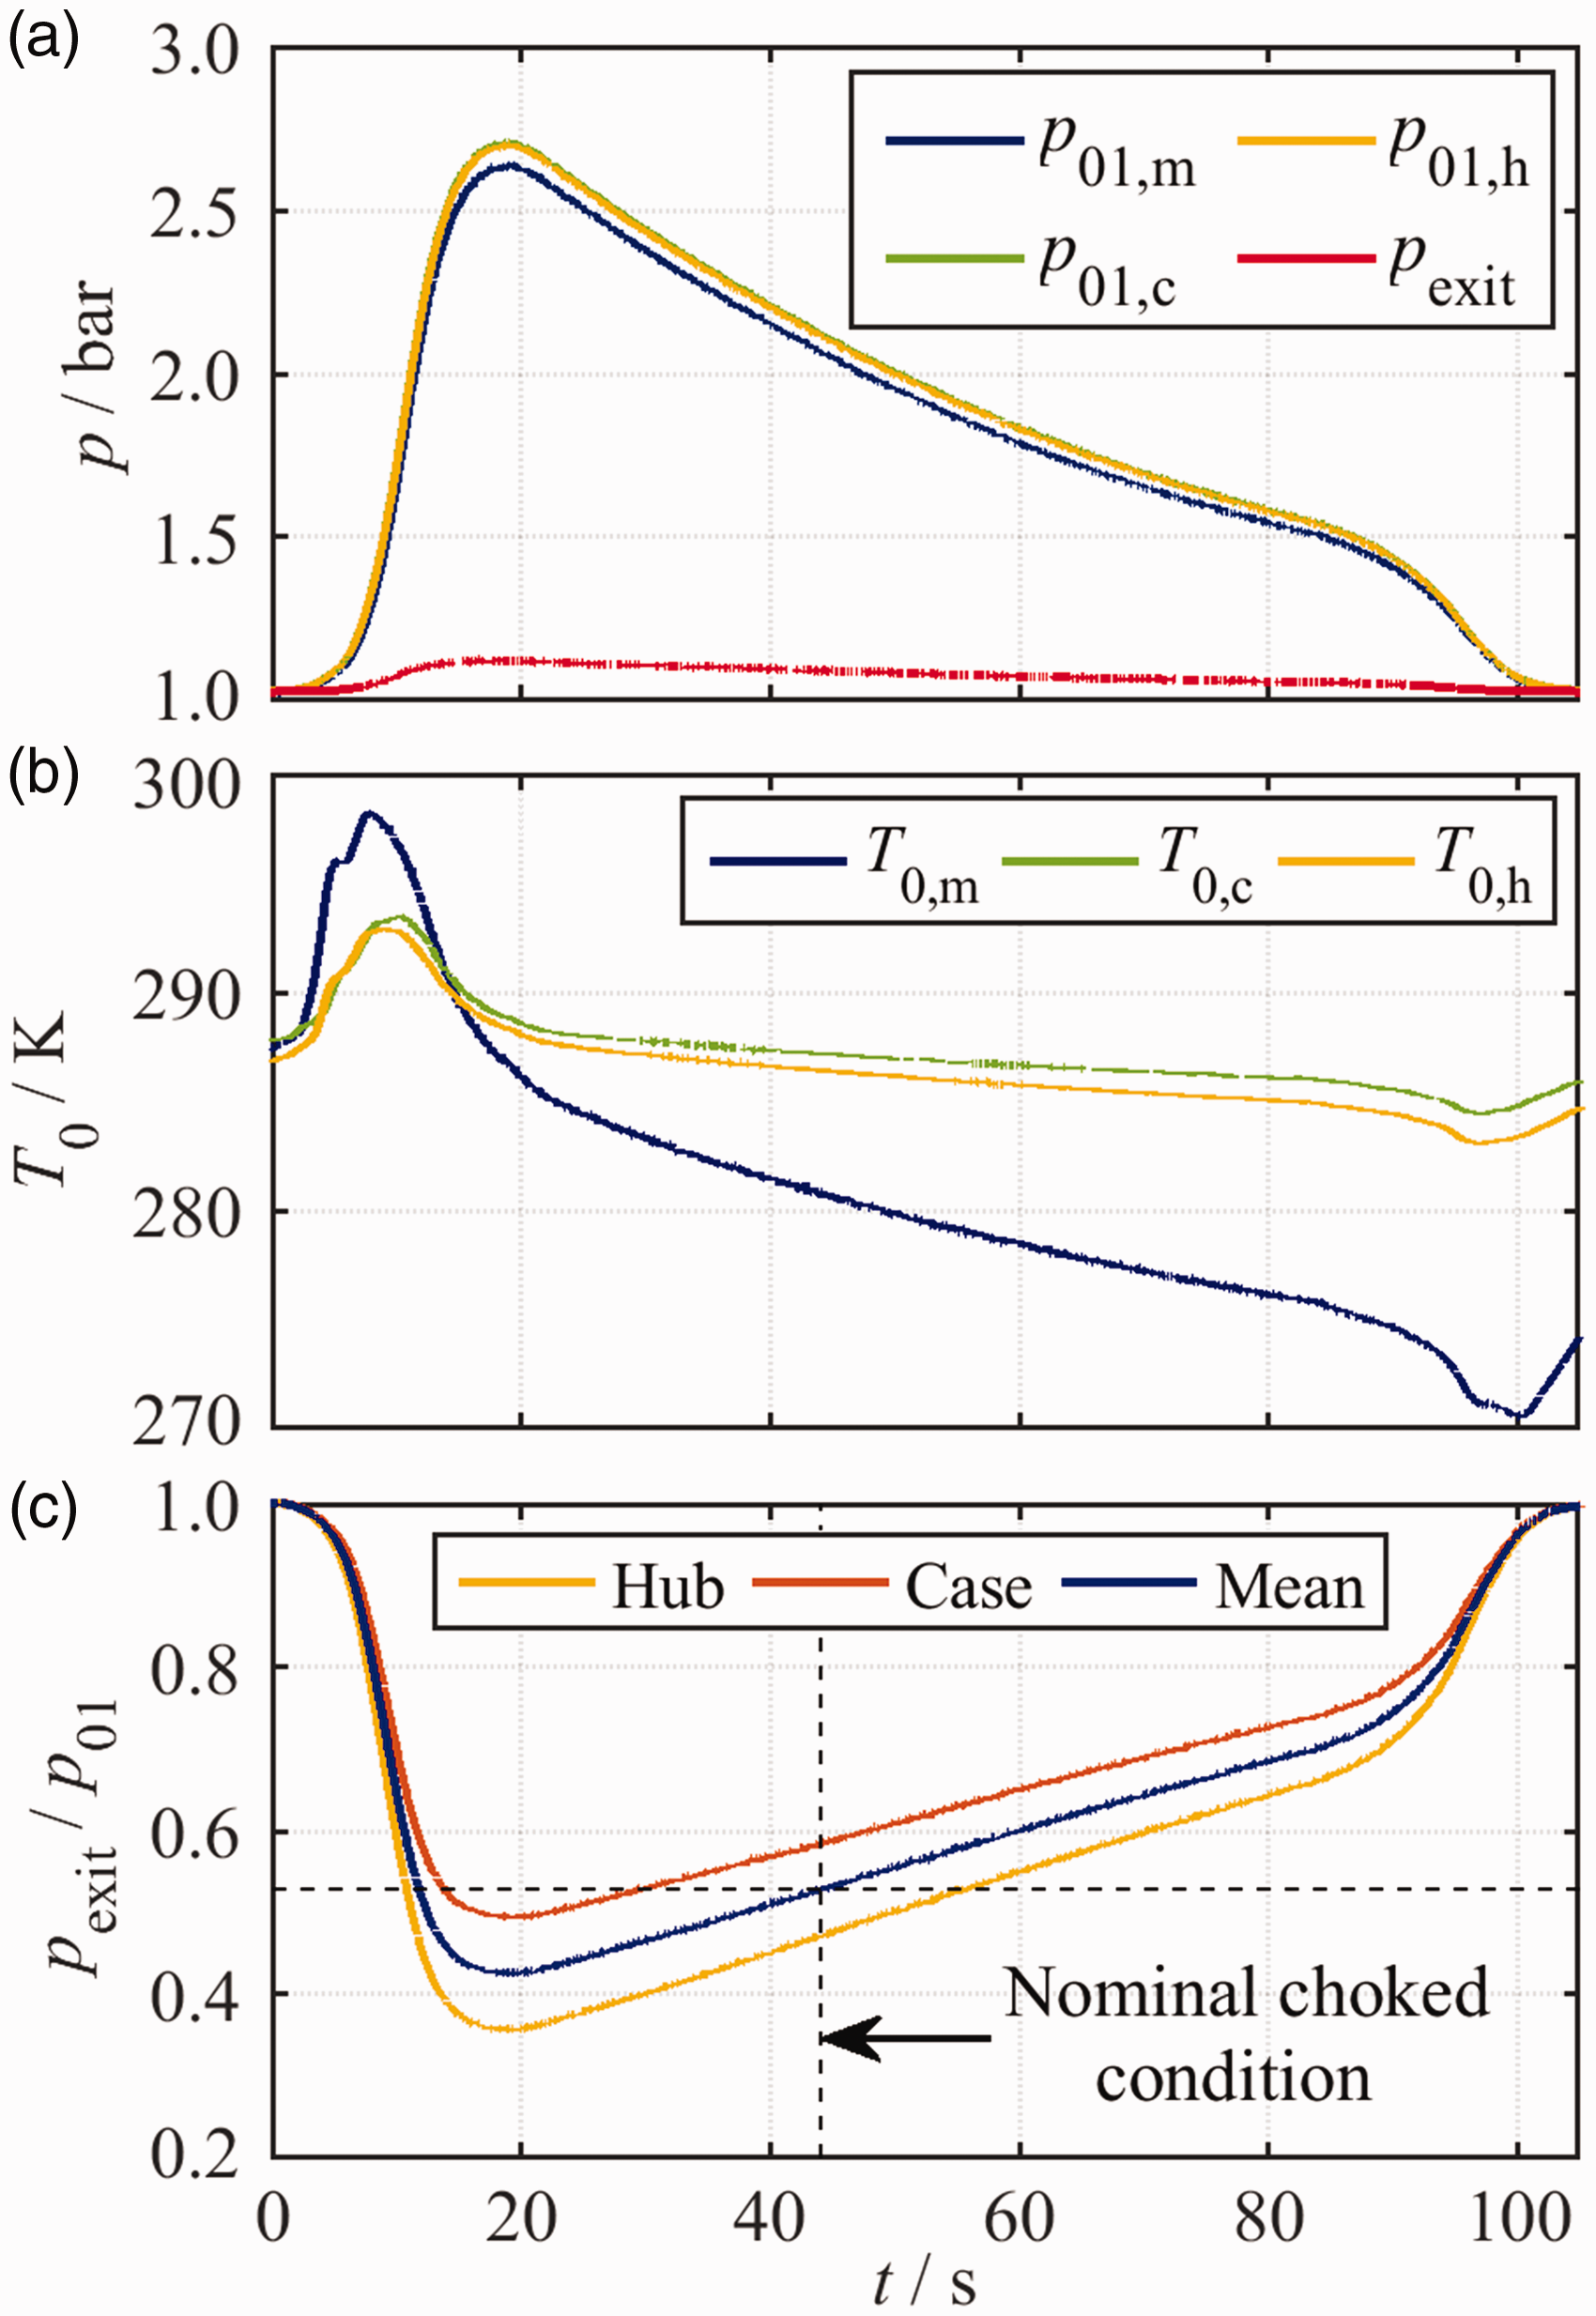
During the period of quasi-steady operation, the vane pressure ratio (and Mach number) passes slowly down a characteristic, traversing a range through the design value. The vane pressure ratio trend from a typical run is shown in Figure 2(c). The mean vane pressure ratio varies between 0.43 <
Regulated mode is used for measuring capacity at a fixed condition and for cross-checks against the semi-transient blowdown measurement technique, as well as performing traverse measurements of the flow field downstream of the NGV cascade at steady-state condition. An inline high-flow pressure regulator is installed in the upstream pipework (with bypass loop, see Figure 1), allowing the cascade inlet conditions to be held at steady-state for a period of up to 60 s.
Vane module construction and sealing
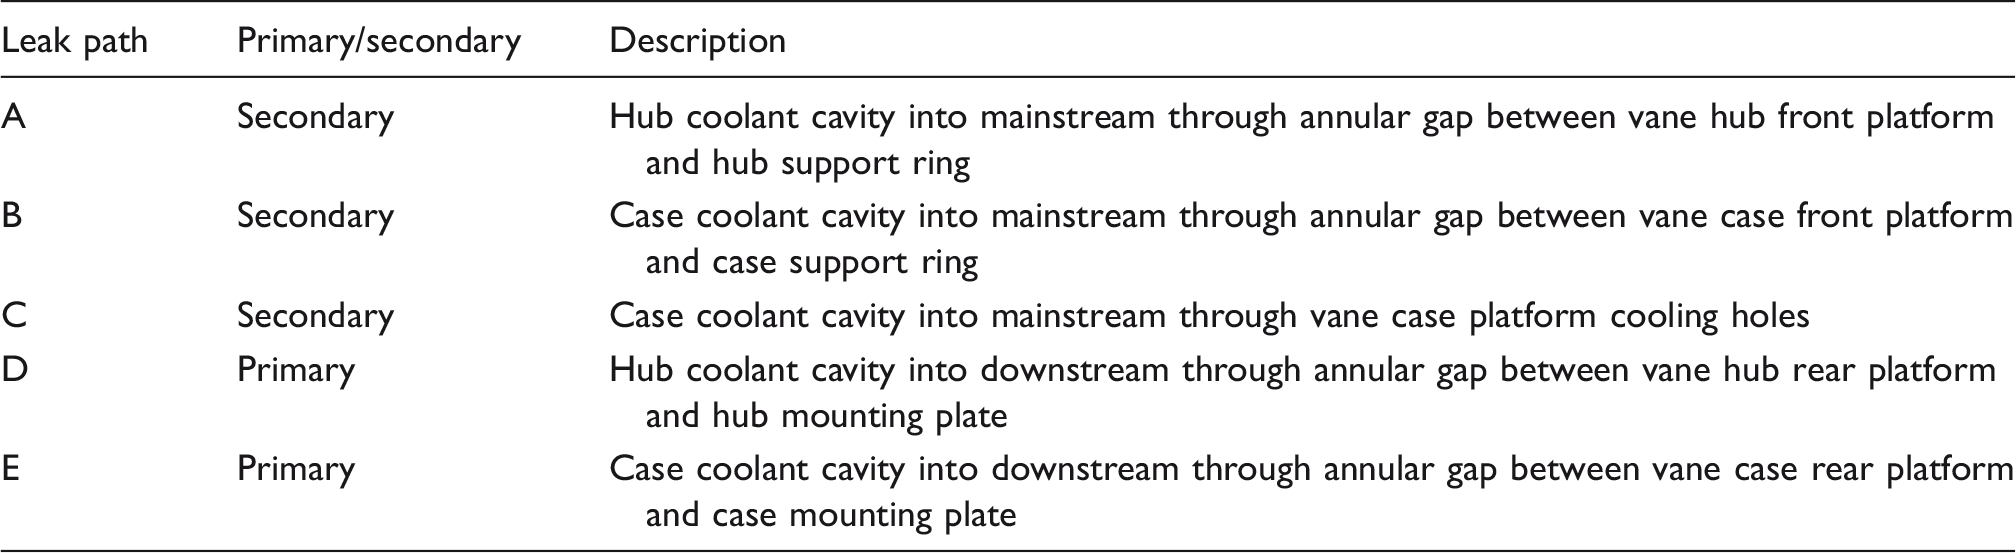
The vane module has a clamshell-style design, shown schematically in Figure 3. The four principal components—(1) to (4)—and the five potential leak paths—A to E—are marked in the figure.
De-featured section schematic of the vane module assembly showing potential leak paths and associated wet seal locations. The main components are: (1) case front support ring; (2) case rear mount ring; (3) hub front support ring; (4) hub rear mount plate.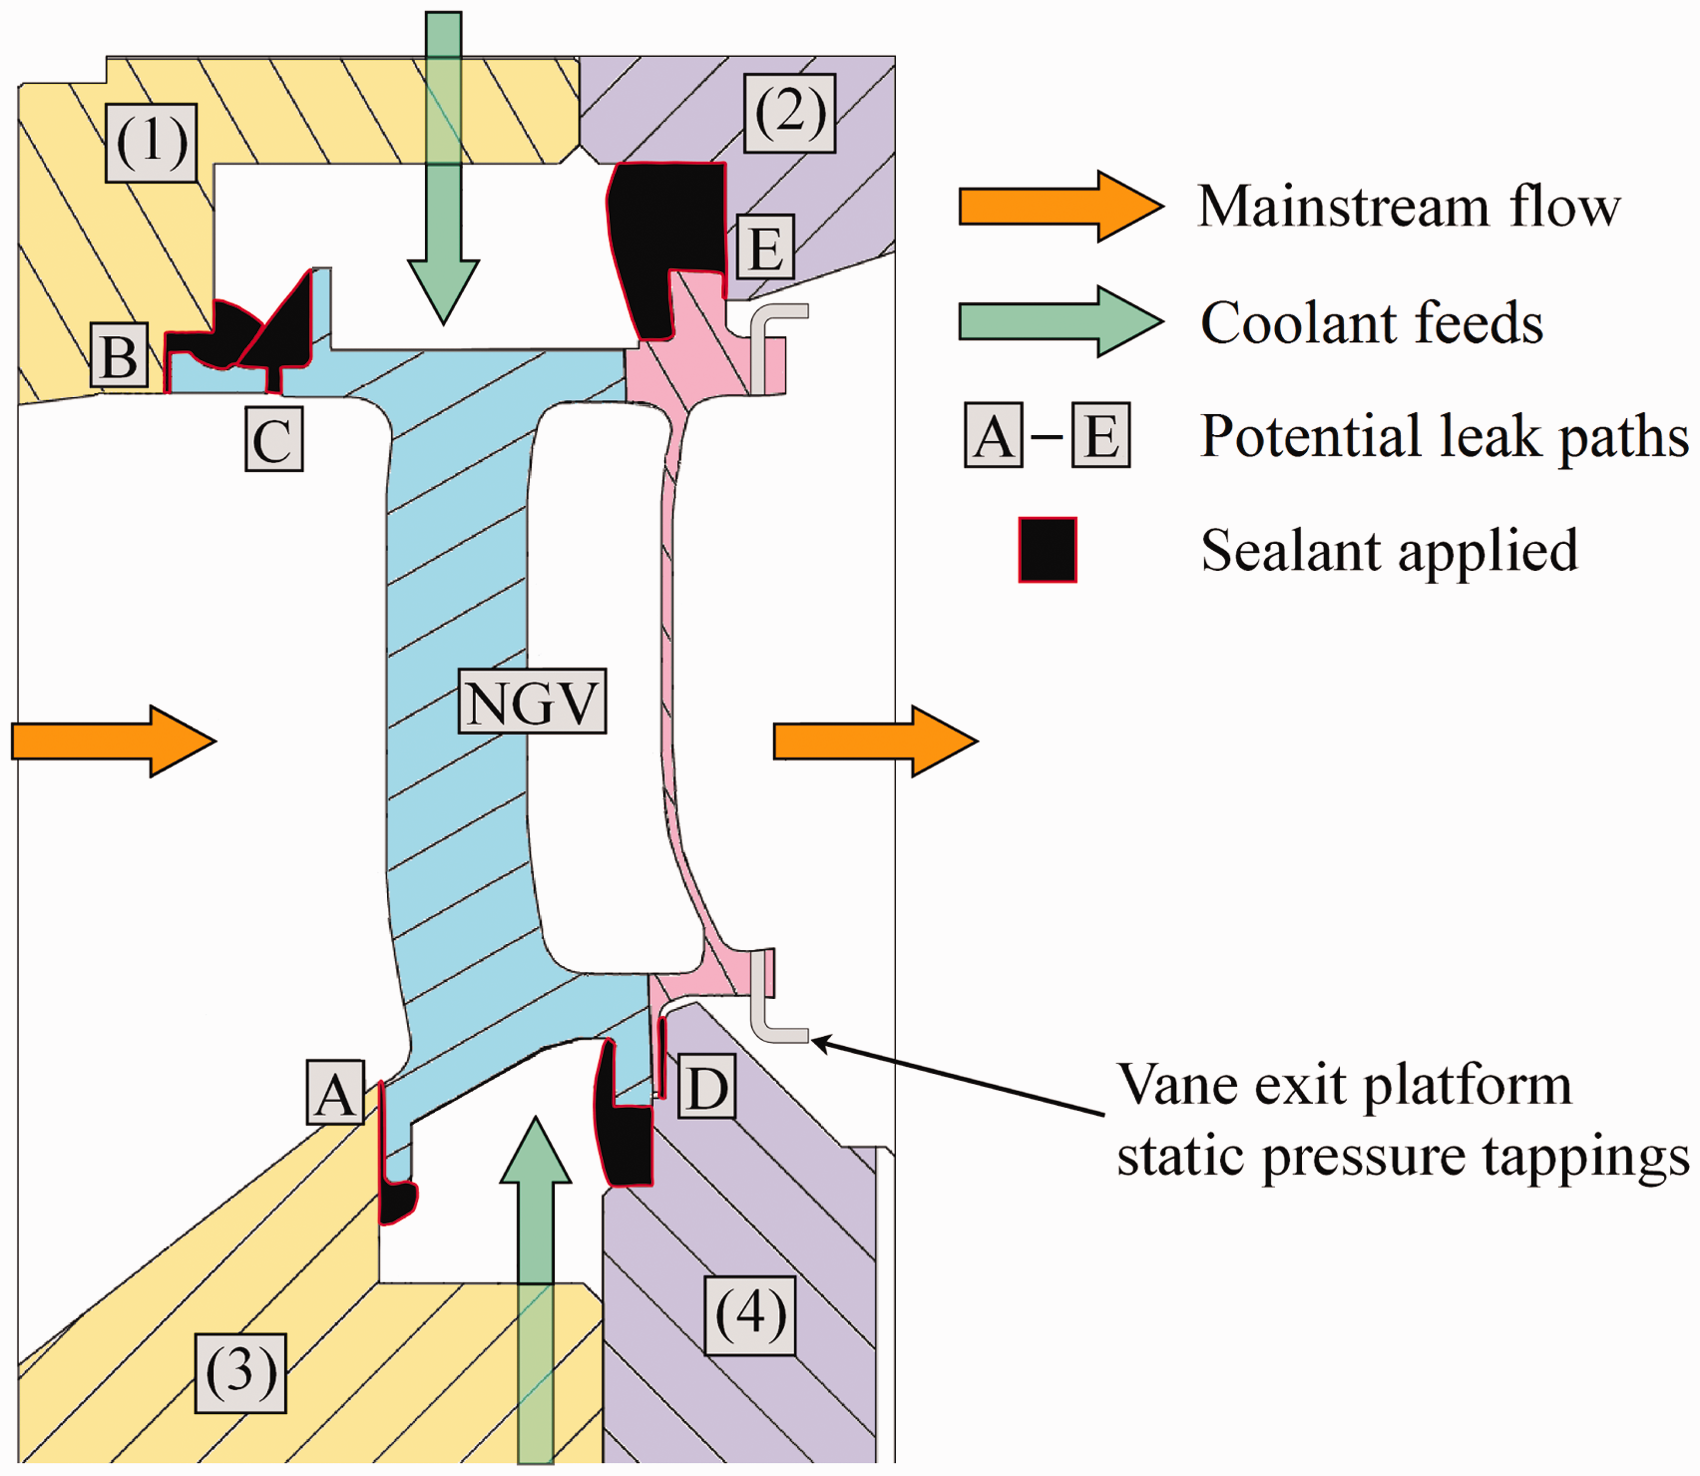
To ensure precise alignment of the components, the vane pairs (typically 20) are located with dowels on the hub rear mounting plate, and sealed with a wet seal (aerospace grade silicone sealant) to avoid leaks. The location of the seal is marked ‘D’ in the figure. At the same stage, seal E is made with the case rear mount ring, and the components are bolted to the hub rear mount plate. During this process, the case rear mount ring and hub rear mount plate are held in place with respect to each other using a ground steel fixture. This ensures precise concentricity and axial alignment while the seals are wet.
Upstream hub and case support rings are then fitted over the vane front platforms and bolted to the hub rear mount plate and case rear mount ring respectively. The components are doweled to ensure precise alignment, and clearance spaces are allowed at locations A and B, designed to account for variability in the cast engine components, and sealed with wet sealant during assembly. The upstream hub and case support rings also form part of the annulus line of the working section.
After assembly, the module dimensions are carefully checked. All mating surfaces are machined (as opposed to cast) to achieve high build accuracy. The vane module seals to the working section components using O-rings, allowing rapid interchange of vane modules without disturbing the wet seals. The ground steel fixture remains attached to the components during assembly (and bolting) into the working section, after which it is removed. This ensures that the components remain in a fixed position during assembly, and therefore that no stress can be imparted to the wet seals during the process.
There are two further advantages of the clam-shell module design. First, a vane module can be stored separate from the main working section, and in a particular build configuration, and re-tested at a future date. For studies of vane capacity targeting deltas of order 0.1%, this capability is extremely useful as it removes an additional source of uncertainty between repeat tests (variability in the precise installation of the vanes in the module). Second, the removable vane module opens the way for back-to-back testing of NGVs with small geometric changes introduced sequentially to the module—e.g. studies of damage to leading or trailing edges, which can be simulated by sequential machining of the components. The ability to make such changes without dismantling the vane module or disturbing the wet seals makes it possible to detect very small shifts in vane capacity.
Summary of working section leak paths.
Prior to an experimental test campaign, a series of tests are conducted to check the integrity of the working section seals. This is required to ensure that leaks do not influence the measured capacity result. The process is now described.
The tests involve feeding only the two coolant streams (not the mainstream feed) and accurately measuring the total coolant flow capacity characteristic (up to approximately ten times a typical design coolant-to-mainstream pressure ratio) in the ex-situ environment (no aerodynamic field due to the main flow). The measured capacity characteristic is then compared to a second set of measurements performed on a statistically large sample of vanes (10–20 vane pairs from the cascade) in individual bench-test experiments. In the bench-test experiment, coolant is supplied from both hub and case feeds (pressure balanced), and coolant flow capacity is measured at a number of coolant-to-downstream pressure ratios. Agreement between the two coolant capacity data (good overlap of the uncertainty bounds) is taken as indication of good build integrity. These tests are referred to as dynamic leak tests. As the coolant capacity is only a small fraction of the overall capacity (typically < 10%), and because high accuracy can be achieved in the dynamic leak tests, they provide an accurate method of diagnosing unintended leak paths.
Figure 4(a) shows typical coolant capacity characteristics (solid lines) from four separate sets of tests of the same parts, taken at intervals during a 12-month period. Between each set of tests, the vane module was removed from the facility working section and reinstalled. In this particular example, an external machining operation was performed on the vane ring between each test, to study the effect of trailing edge cut-back on capacity. This operation was external to the trailing edge slot, and not expected to affect the coolant capacity in the absence of mainstream flow.
(a) Coolant capacity characteristics measured in dynamic leak tests in four ECAT test campaigns over a 12-month period, compared against bench-test data; (b) percentage standard deviation between different ECAT test sets, and percentage difference between ECAT and bench-test data.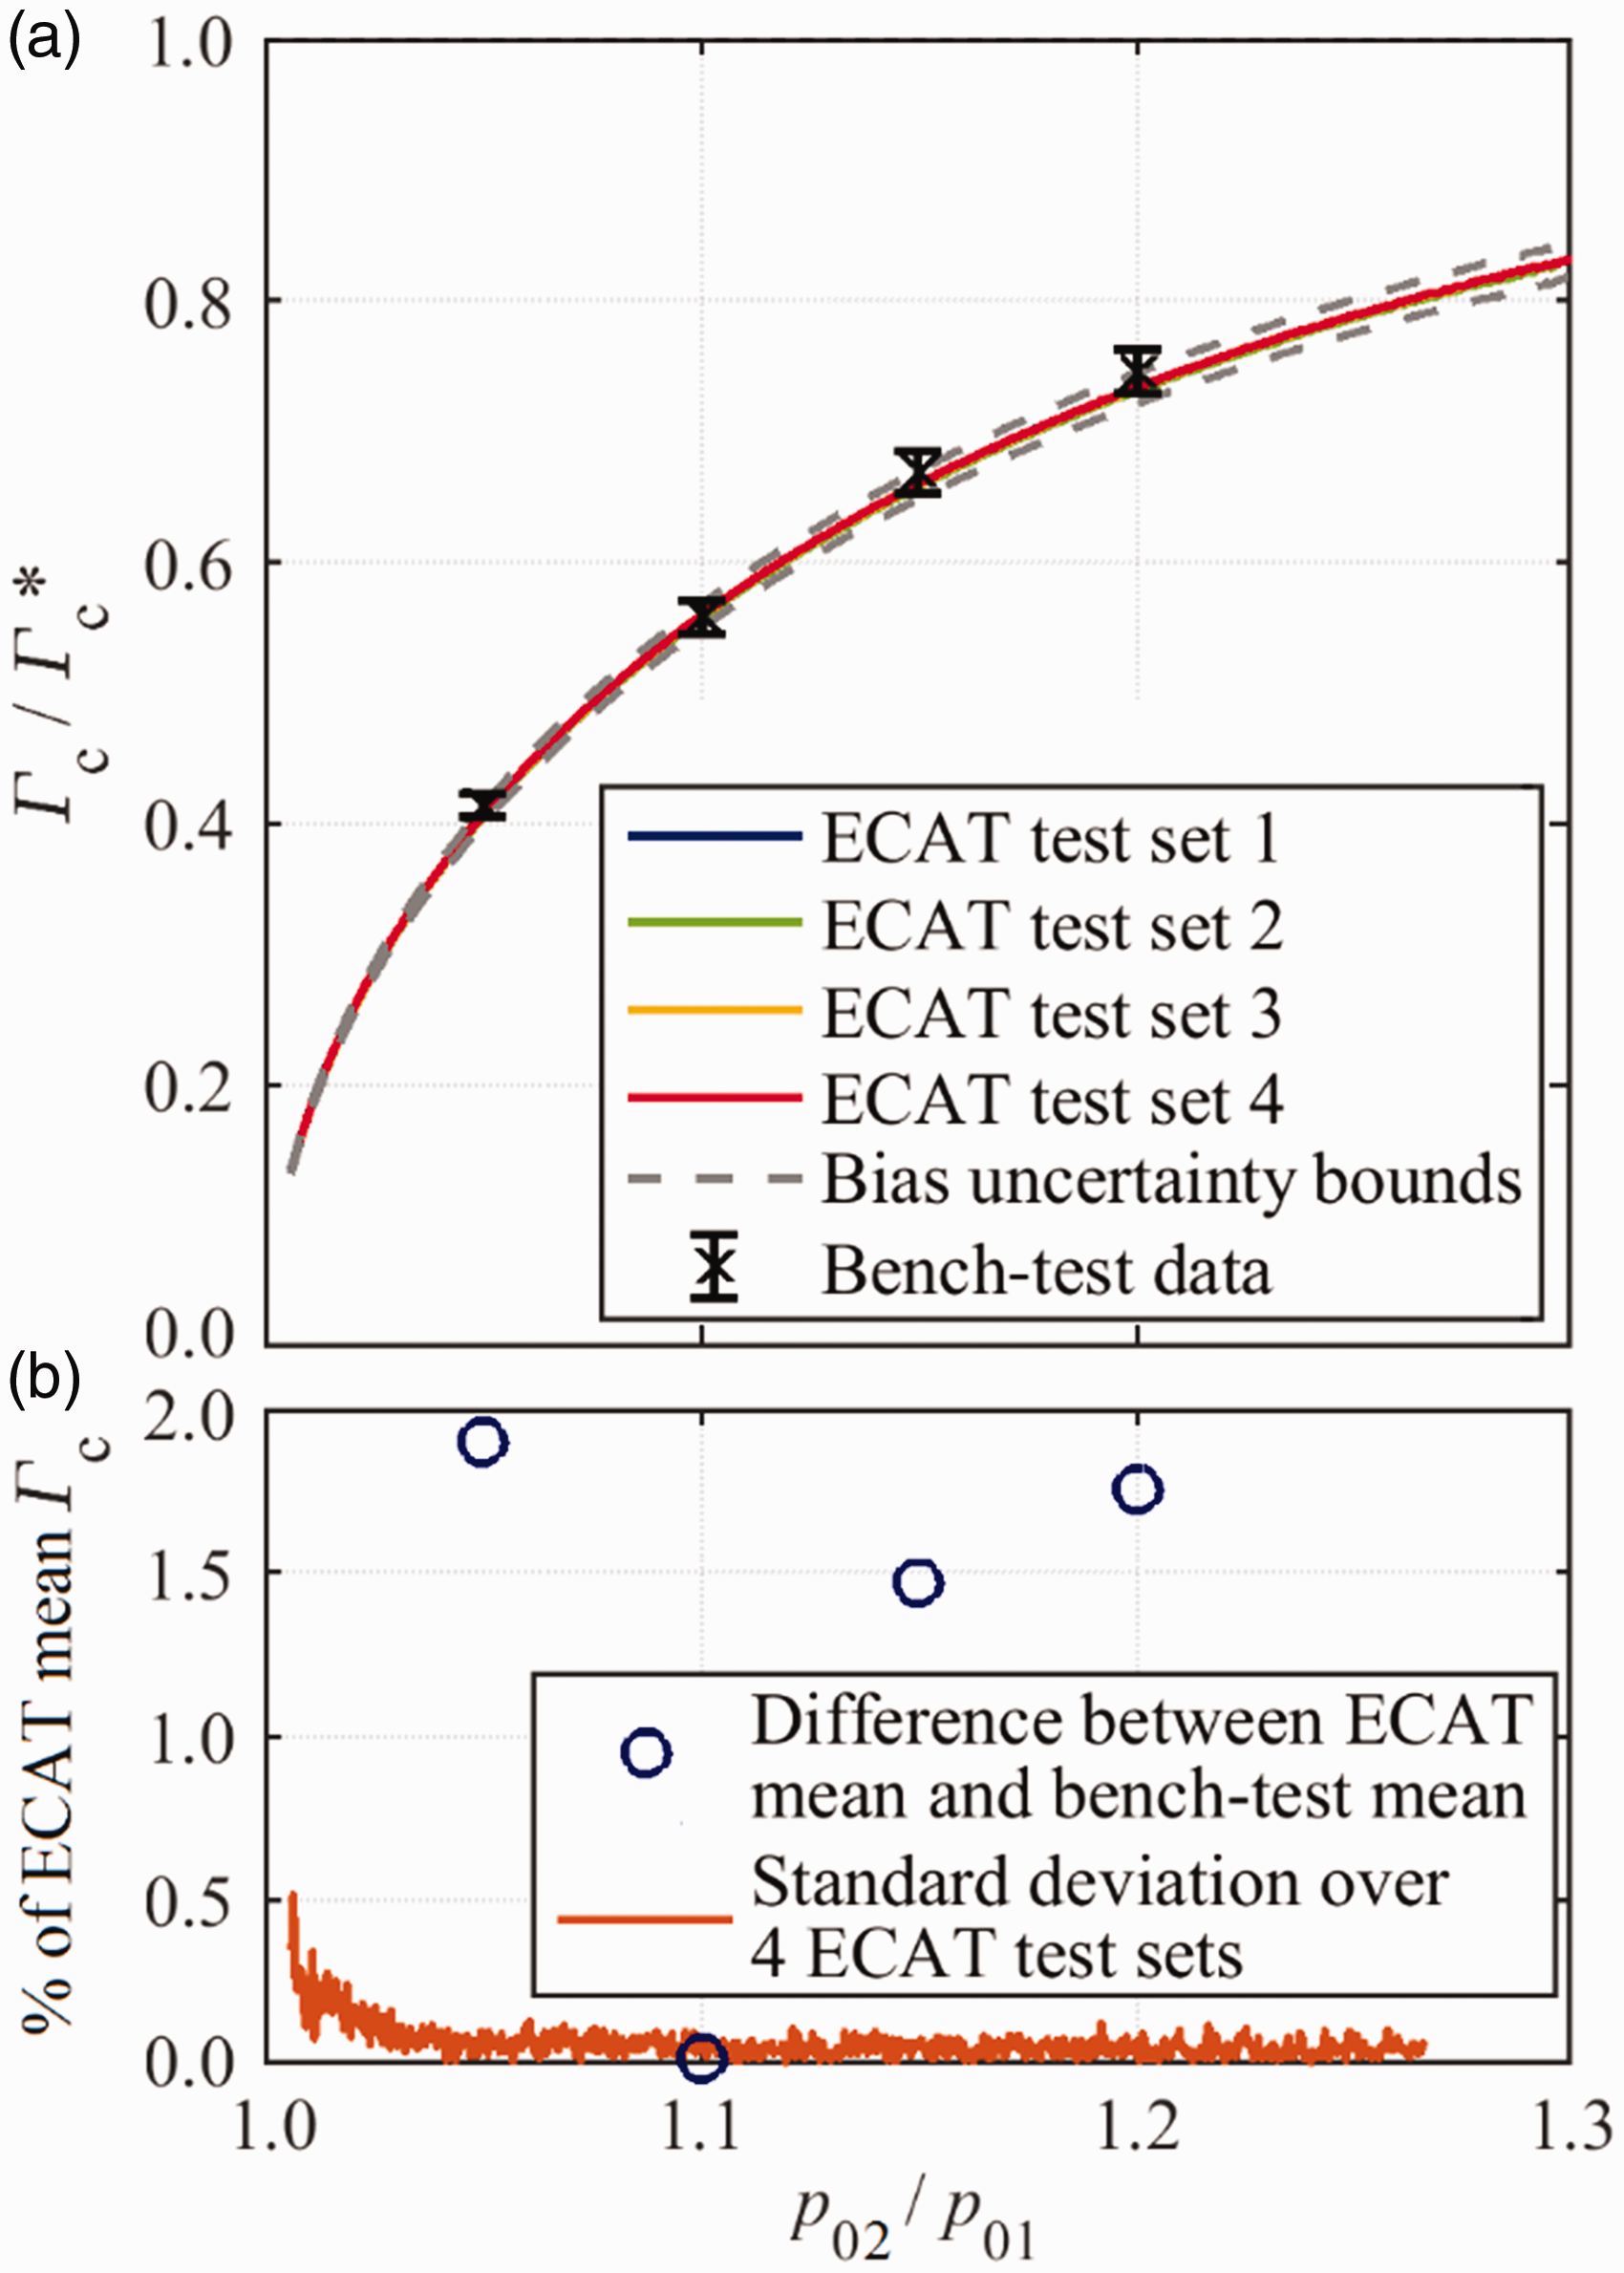
A typical test set is composed of six runs, allowing both the mean characteristic and the precision error in the mean to be calculated. We see that the four data sets overlay so closely that the individual lines are indistinguishable. The average standard deviations within each of the four data sets, averaged over the range 1.01 <
The standard deviation between the four data sets is shown in Figure 4(b) (orange line). Over the pressure ratio range 1.05 <
The black crosses in Figure 4(a) represent the average from bench test capacity measurements (i.e. individual vane pairs measured in a separate facility) of 14 vanes, conducted at four discrete pressure ratios. The error bars on the bench-test data points (Figure 4(a)) represent two standard deviations for the distribution of coolant capacity values for the set of 14 vane pairs tested. The average (across four operating conditions) standard deviation was 4.58% of the mean capacity value, corresponding to a standard error in the mean (of 14 vanes) of ±2.45% to 95% confidence. The bias uncertainty was evaluated (in separate uncertainty analysis) as ±0.40% (95% confidence). Mass flow rate measurements in the bench test were made using a sonic Venturi nozzle calibrated by CEESI, with calibration traceable to a national standard. The difference between the mean ECAT data (across four test sets) and the bench-test data, taken at the four discrete pressure ratios is marked in Figure 4(b) (blue circles). The average across these four points was 1.28%. The two data have overlapping uncertainty bands indicating this is a likely result for a build with no leaks.
Coolant capacity data (dynamic leak tests) are typically collected over a range of coolant-to-mainstream pressure ratio 1.0 <
The coolant capacity characteristic in Figure 4(a) can be extrapolated to a choked condition by fitting an isentropic capacity curve. This allows the ratio of the estimated choked coolant capacity, Γc*, to the choked vane capacity, Γvane*, to be estimated. This gives Γc*/Γvane* = 0.152. In the worst-case scenario in which a leak in an incompletely sealed vane module was entirely a primary flow leak, a leak with a capacity equivalent to the difference between the mean of the four ECAT datasets and the bench-test data (1.29% of Γc*) would equate to 0.20% of Γvane*. The dynamic leak check is a robust way of reducing the risk of leaks affecting NGV capacity measurement.
Mass flow rate measurement
Flow into the facility is split into three separate streams: mainstream flow, and hub and case coolant supply flows. Each stream is controlled and metered by an independent choked nozzle. The mainstream flow is fed by a 3″ diameter sonic Venturi nozzle (labelled A2 in Figure 1). The nozzle was calibrated to a National Institute of Standards and Technology (NIST) traceable standard at Colorado Engineering Experiment Station Inc. (CEESI) and installed according to ISO 9300. 9 The bias uncertainty associated with the measurement is ±0.500% (to 95% confidence).
The NGV coolant feeds are supplied with air via separate hub and case supply streams. The coolant stream mass flows are controlled and metered using sonic Venturi nozzles. These are labelled A3 and A4 in Figure 1. The air feeds are drawn off downstream of the regulator and bypass line, but upstream of the main nozzle. This ensures (instantaneously) essentially identical feed pressure to all three nozzles (mainstream, hub and case coolant) giving ratiometric mass flow rates, even during blowdown mode operation in which the facility passes down a characteristic. The coolant metering nozzles are interchangeable, allowing precise adjustment of coolant-to-mainstream mass flow rates and pressure ratios at the NGV. The overall NGV capacity accounts for both mainstream and coolant flows. This is discussed in a later section.
Mass flow rate unsteady correction
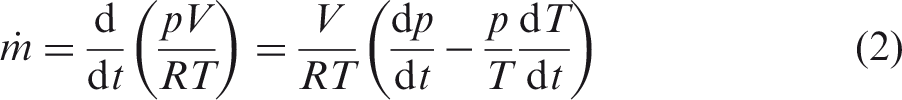
During a blowdown test, the pressure and temperature in the main tank decay as the tank is emptied, following an approximately isentropic expansion. Likewise, the pipework system and working section pass down a pressure characteristic as seen in Figure 2. During this process, the mass stored in each of the pipework volumes reduces over time. This effect causes a small discrepancy between the mass flow rates passing through the metering nozzles, and those delivered at the test vane. The rate at which the mass stored in the intermediate plena (those volumes located between the metering nozzles and points of delivery to the vane) is depleted must be accounted for. This correction is considered now.
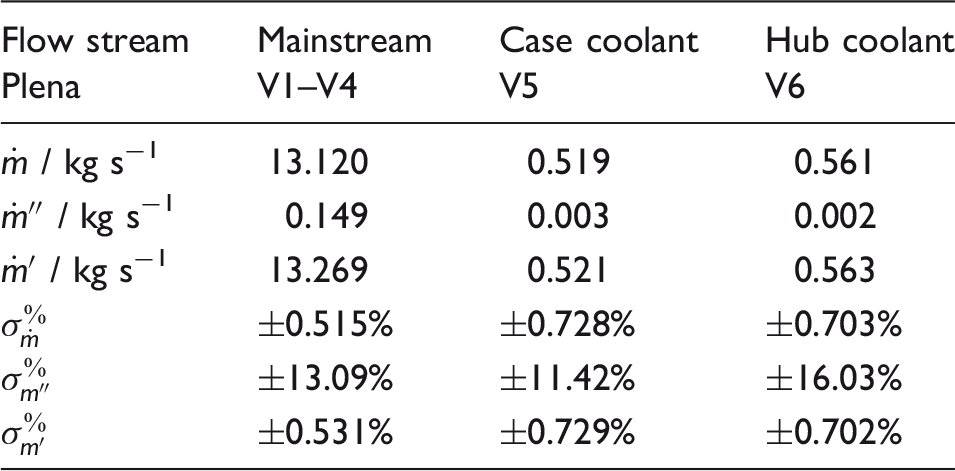
The intermediate plena are indicated schematically in Figure 1, and labelled V1–V6. V1–V4 are intermediate plena on the mainstream flow path. V5 and V6 are the intermediate plena on the case and hub coolant flow paths, respectively. Assuming ideal gas behaviour, the rate of change of stored mass in an individual plenum is given by
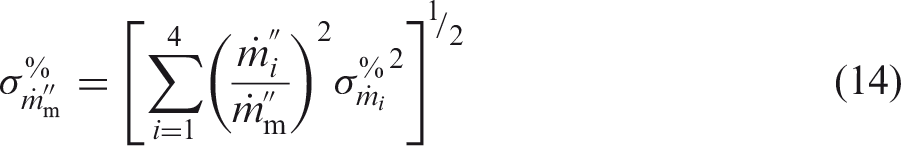
The total mainstream unsteady correction mass flow is therefore given by the sum
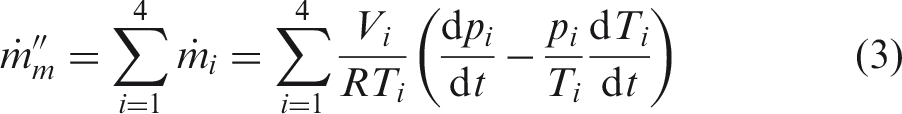
Corrections for the coolant stream plena, V5 and V6, follow the same form.
Overall mass flow rate for a typical blowdown run (same run as Figure 2) is plotted in Figure 5(a). The mass flow rate characteristics are truncated at the beginning and end of the test when the pressure ratio across the metering nozzle fails to reach the critical choked condition. Outside of this range, the nozzle is out of its calibration range, and mass flow rate is not computed. During the pressurisation of the working section, the total mass flow rate through the vane lags behind the combined mass flow rate measured through the three feed nozzles. This effect results from mass accumulation in the intermediate plena. Positive mass accumulation is associated with the increase in pressure during pressurisation of the facility. For completeness, it is noted that the increase in pressure is accompanied by an increase in temperature (below the isentropic compression rate, due to heat transfer), which reduces the accumulation rate due to a density decrease with temperature.
(a) Overall mass flow rate characteristics for a typical blowdown test (rescaled to an arbitrary maximum of 19.0 kg s−1); (b) overall mass accumulation rate in intermediate plena.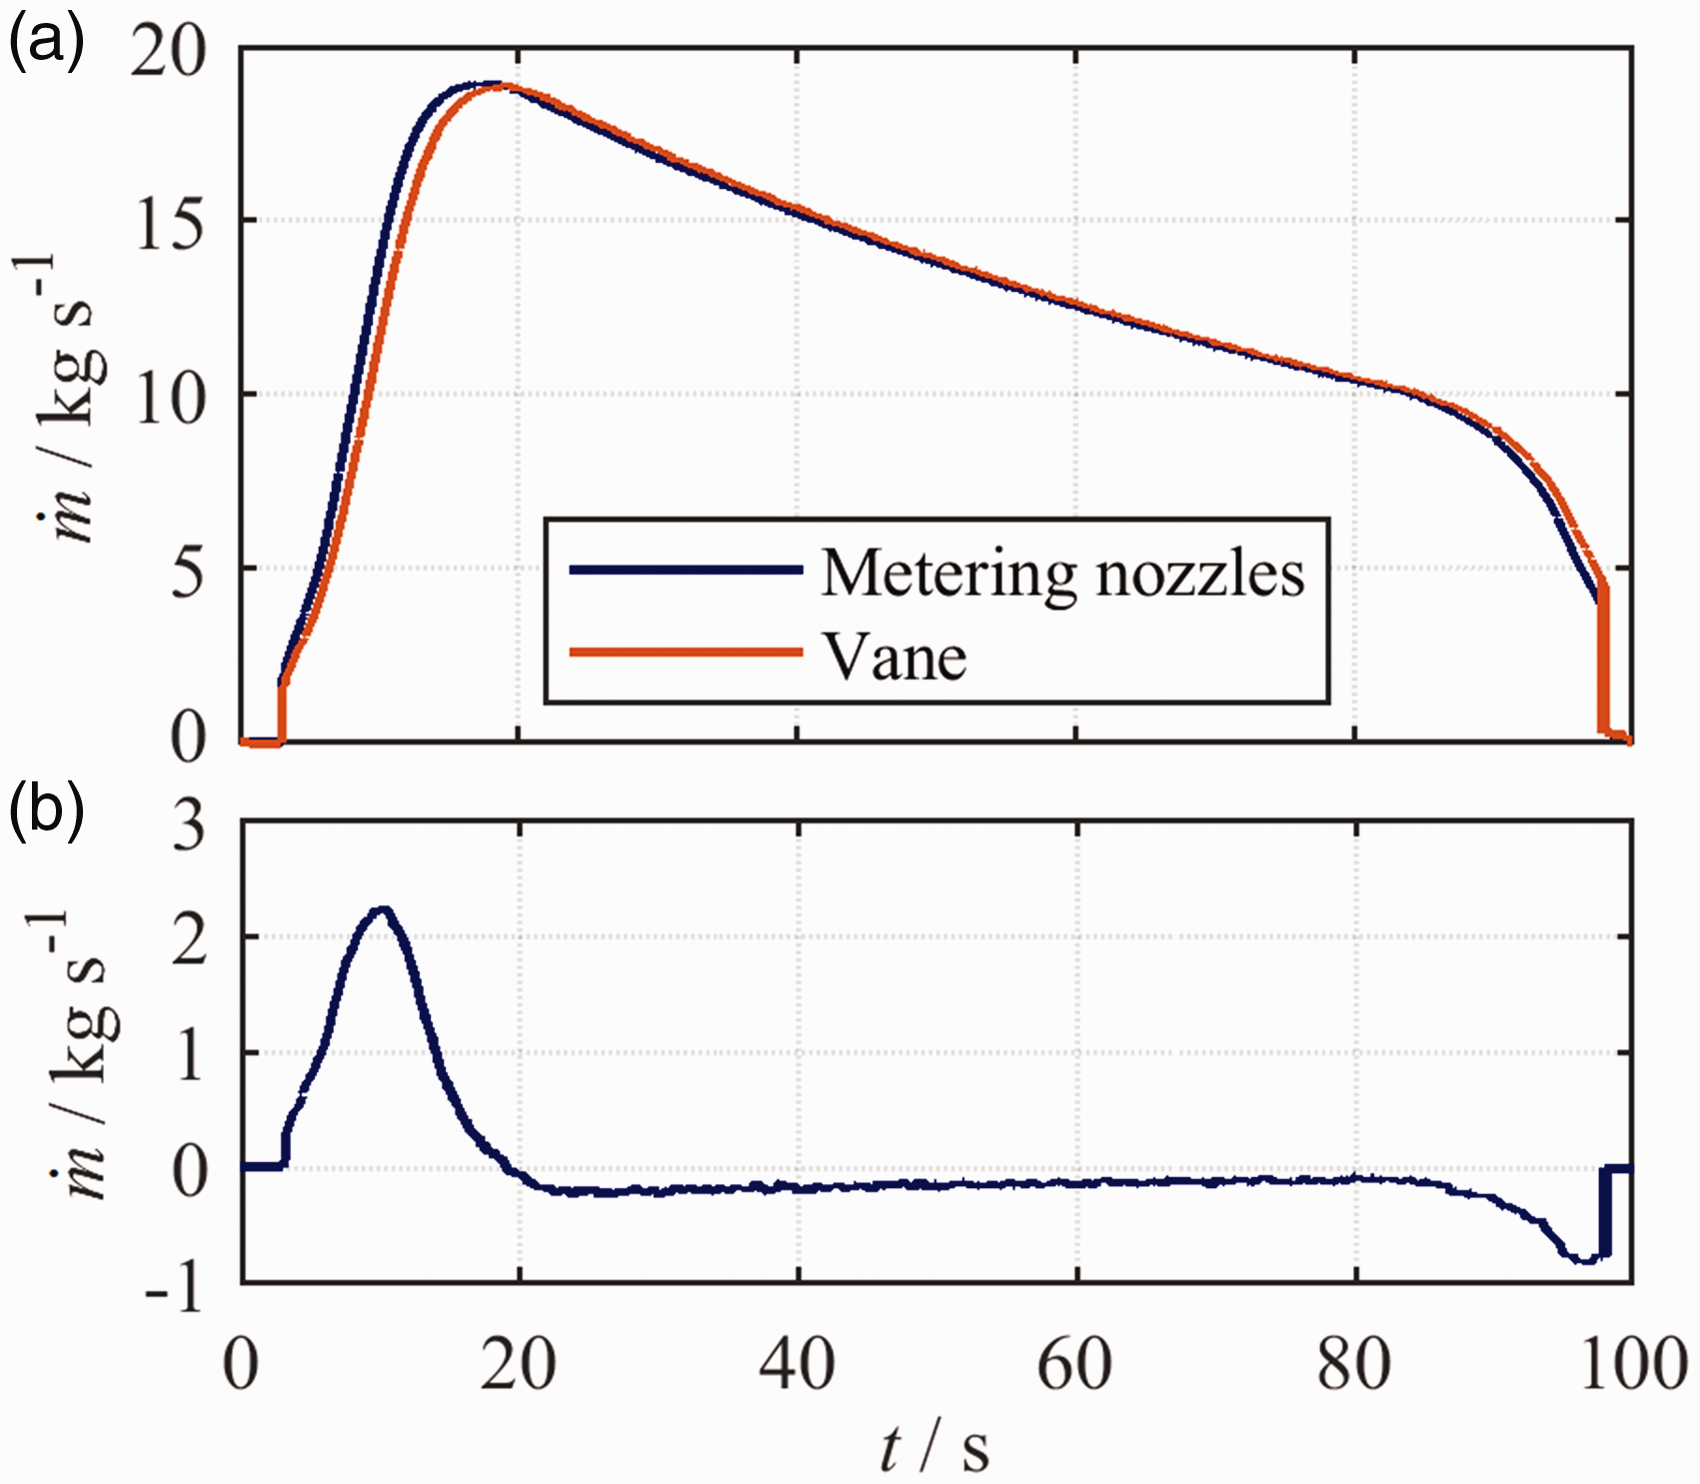
The overall mass accumulation rate is plotted in Figure 5(b). The rate of mass accumulation has a maximum value of around 2 kg s−1 (at approximately t = 10 s) during the initial pressurisation of the facility working section. During the period of quasi-steady operation (20–80 s), the quantity of mass stored in the plena reduces as the pressure falls. The maximum depletion rate (at t ≈ 20 s) is 0.26 kg s−1 and steadily decays over the course of the test period. The vane mass flow rate at the same time is 19.0 kg s−1, giving a maximum correction during the quasi-steady period of approximately 1.37%.
As will be discussed in detail later, the bias uncertainty in the correction mass flow rate is approximately ±13.1% (to 95% confidence), leading to an increase in the bias uncertainty in the vane mass flow rate measurement (over that at the main metering nozzle) of approximately 0.015%. Performing the unsteady correction therefore contributes only a small amount to the overall uncertainty.
Inlet total pressure and temperature measurement
Measurements of total pressure and temperature at vane inlet are performed with cassette-mounted probes just upstream of the vane module in the mainstream flow, and in the coolant supply plena for the hub and case coolant flows. Measurement locations are shown in the section diagram of Figure 6.
Locations of inlet condition measurements for mainstream and coolant flows, viewed from downstream.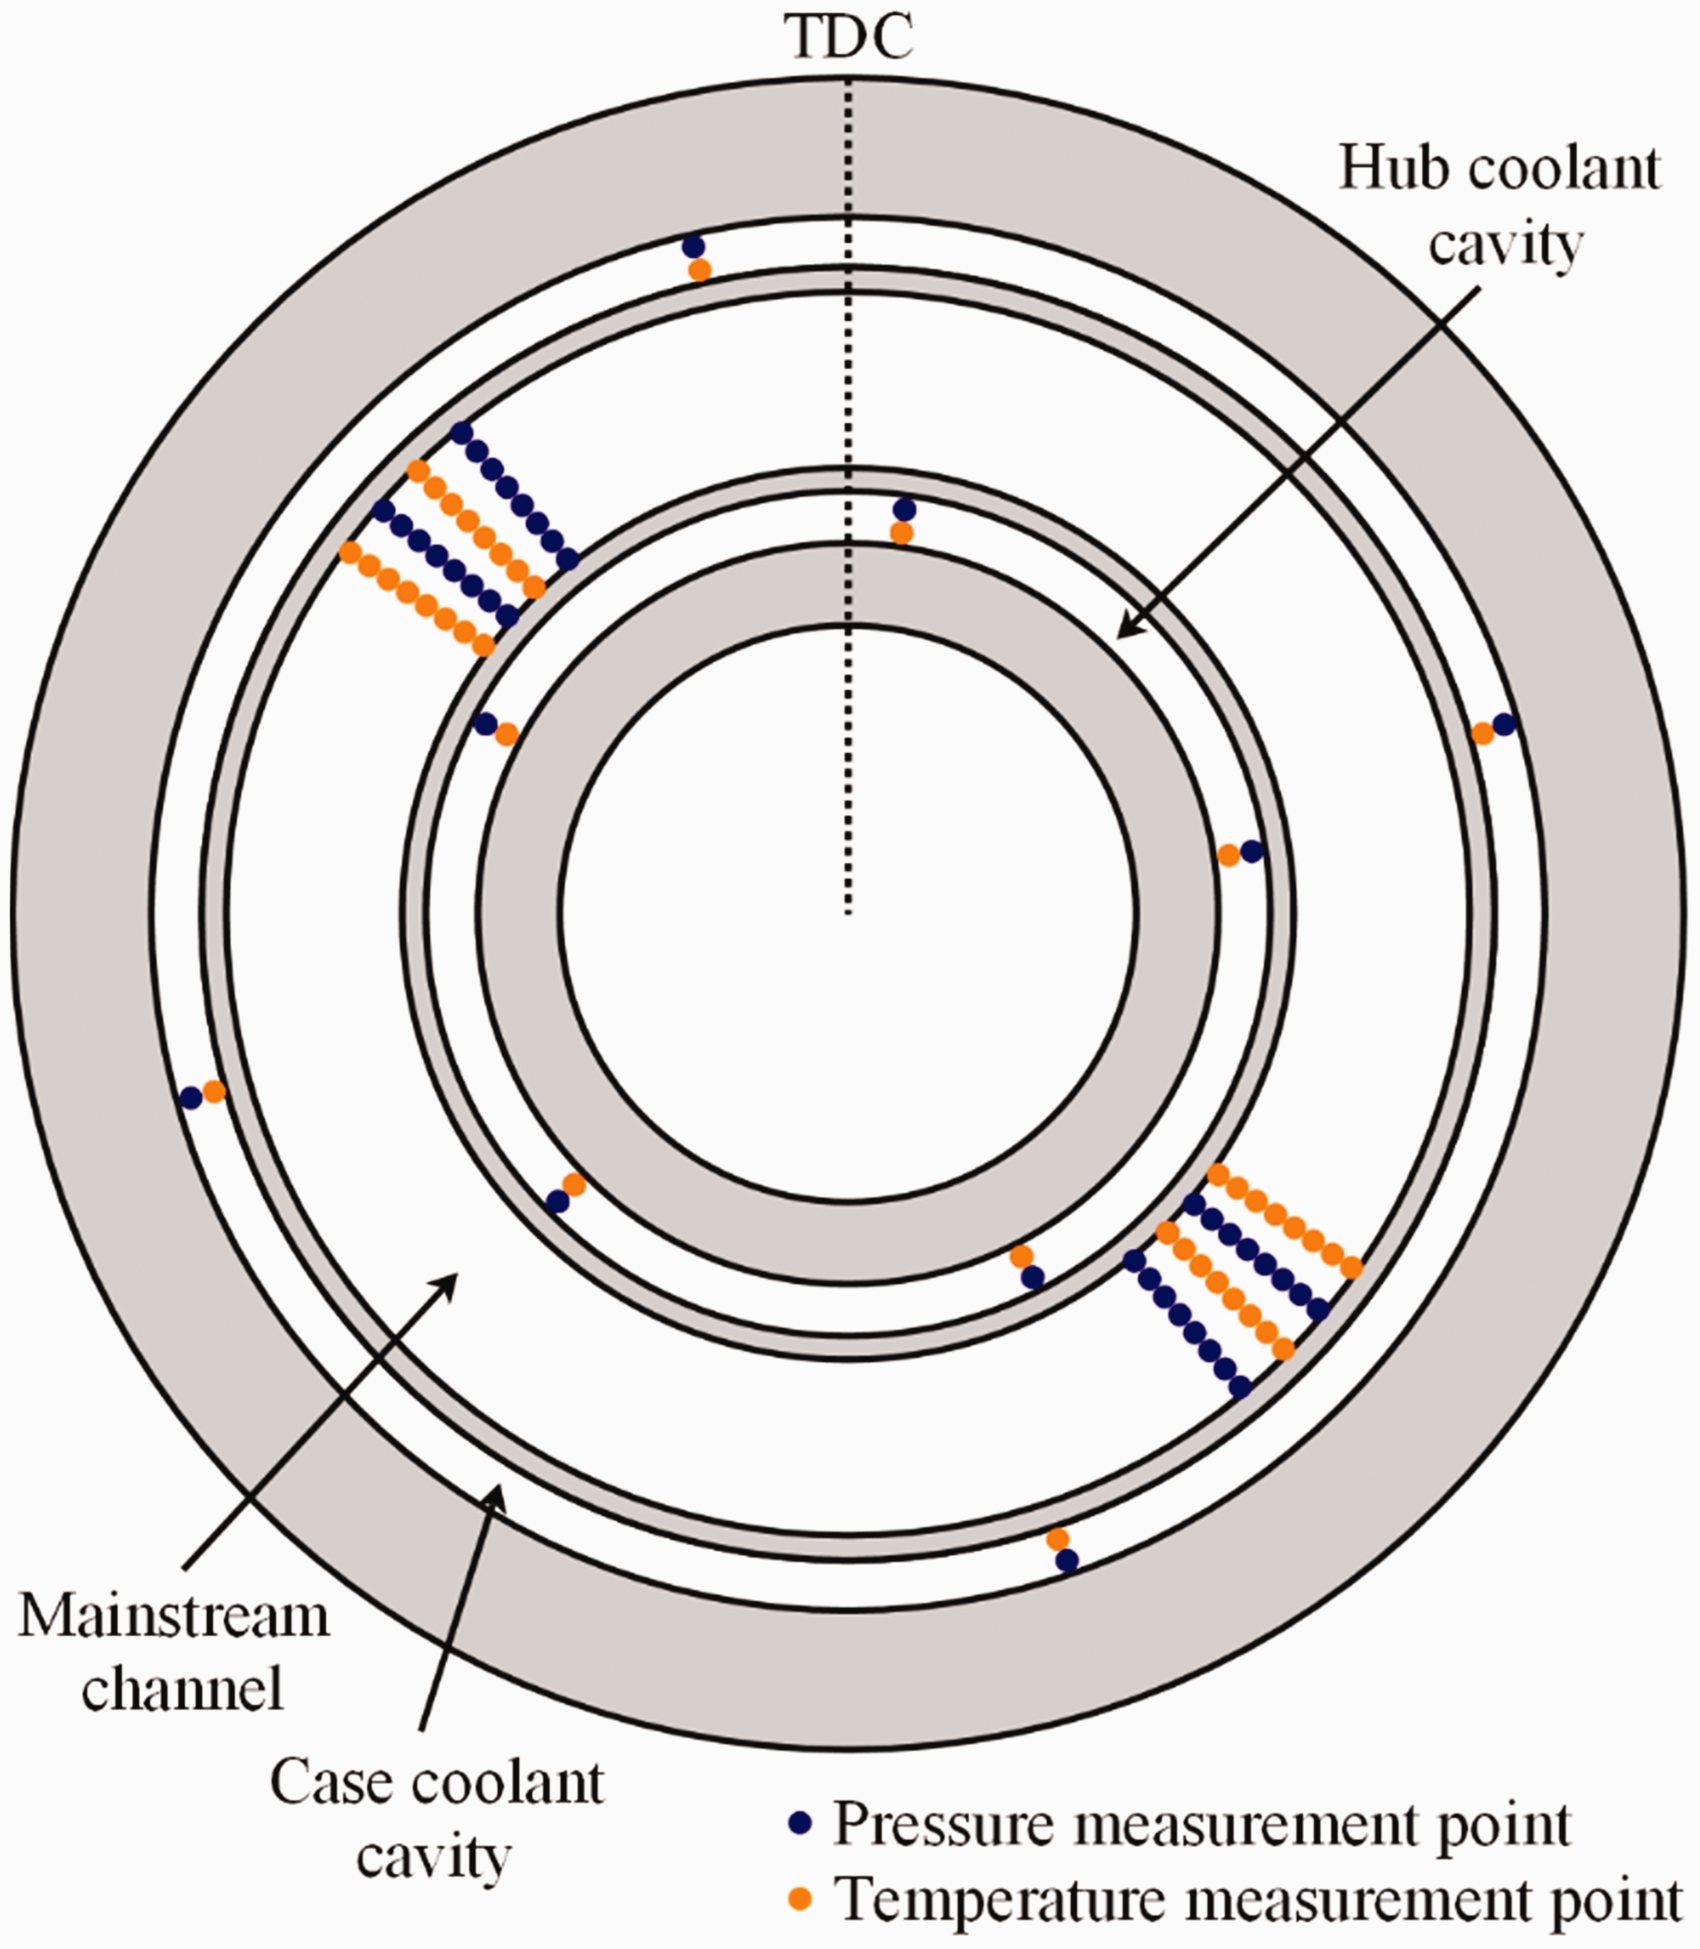
Inlet total pressure and temperature to the cascade were each measured at 32 locations, each using four probes at separate circumferential locations. On each probe, the measurement locations were distributed evenly across the span. The measurement plane was located four axial chords upstream of the cascade leading edge. The cassettes are interchangeable and reconfigurable, allowing optimisation of the instrumentation according to the test requirements. There are four cassette locations around the annulus, and each cassette can accommodate up to six probes. Hub and case coolant inlet total pressure and temperature were each measured at five and four evenly spaced locations around the annulus, respectively. These measurement points are located in the hub and case coolant cavities of the vane module, which feed coolant flow into the vane internal cooling systems.
Exit static pressure measurement
Static pressure at vane exit is measured on the hub and case downstream platforms of three instrumented vane pairs (six vanes from a typical total of 40). Figure 7 shows a simplified diagram of the locations of static pressure tappings on a typical instrumented vane pair platform. The location of a tapping on the vane platforms is illustrated in Figure 3. The three instrumented vane pairs are spaced 120° apart around the annulus. A typical test campaign uses eight tappings per vane pitch at hub and case. For a total of 12 instrumented platforms (six at the hub and six at the case), this gives 96 tappings. The significance of the number of tappings to the bias uncertainty in the vane exit static pressure condition is discussed later in this paper.
Simplified view of a vane pair exit platform instrumented with eight static pressure tappings per passage.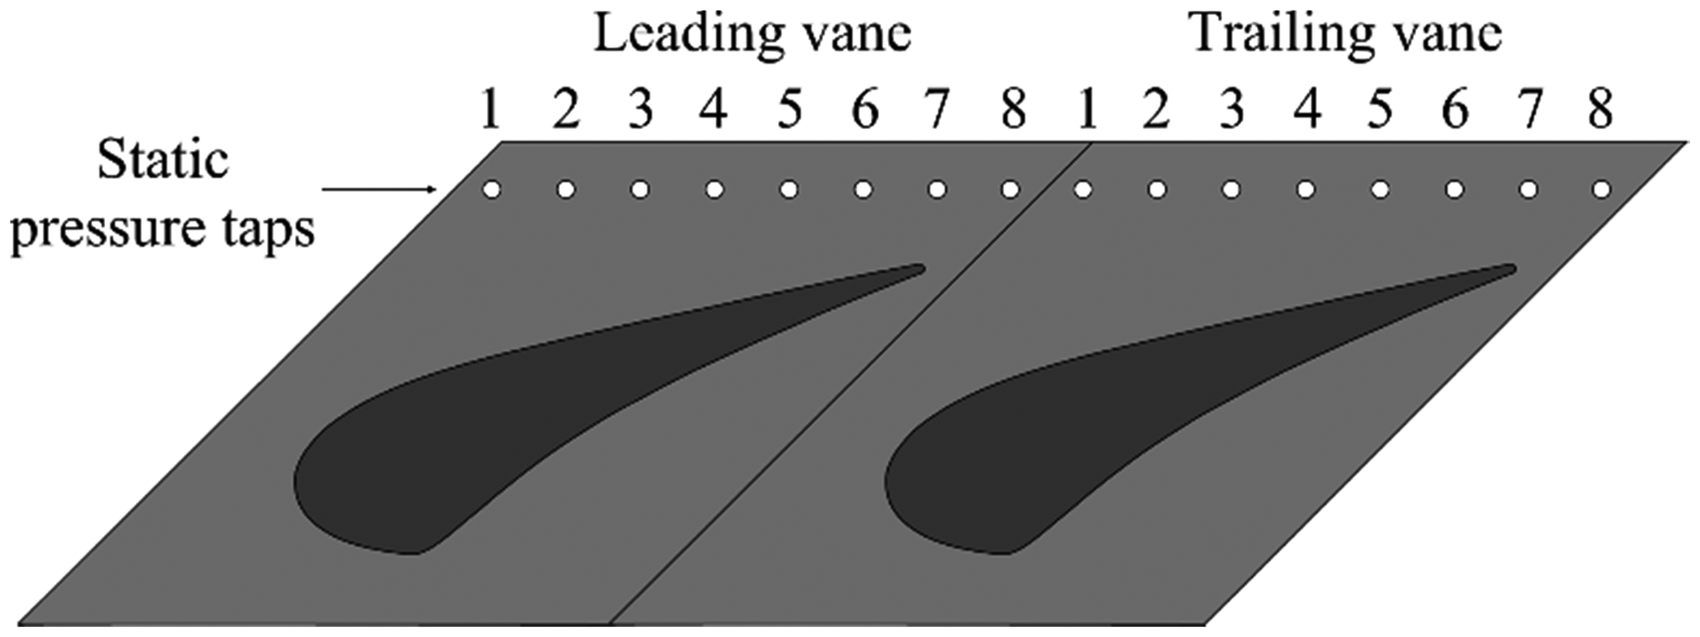
Example circumferential static pressure profiles measured on three vane pair platforms from a typical experiment are plotted in Figure 8 for an arbitrary mean operating pressure ratio of 0.46 (note the measured static pressures are offset from the nominal mean value due to the radial pressure gradient). The three instrumented vane pairs are distinguished as VP1, VP2 and VP3. The three vane pairs give very similar trends, with average standard deviation between measurements of 3.5%. Small differences arise due to repeatability in the cast part geometry. Run-to-run repeatability was excellent, with an average standard deviation of 0.10% between data (at the same measurement location and mean pressure ratio) from 17 repeat tests. In a later section, the sensitivity of vane capacity measurement to tapping number, axial location, and positional accuracy is analysed.
Example of a typical measured circumferential static pressure profile on three instrumented vane pair platforms. The x-axis represents the tapping locations shown in Figure 7.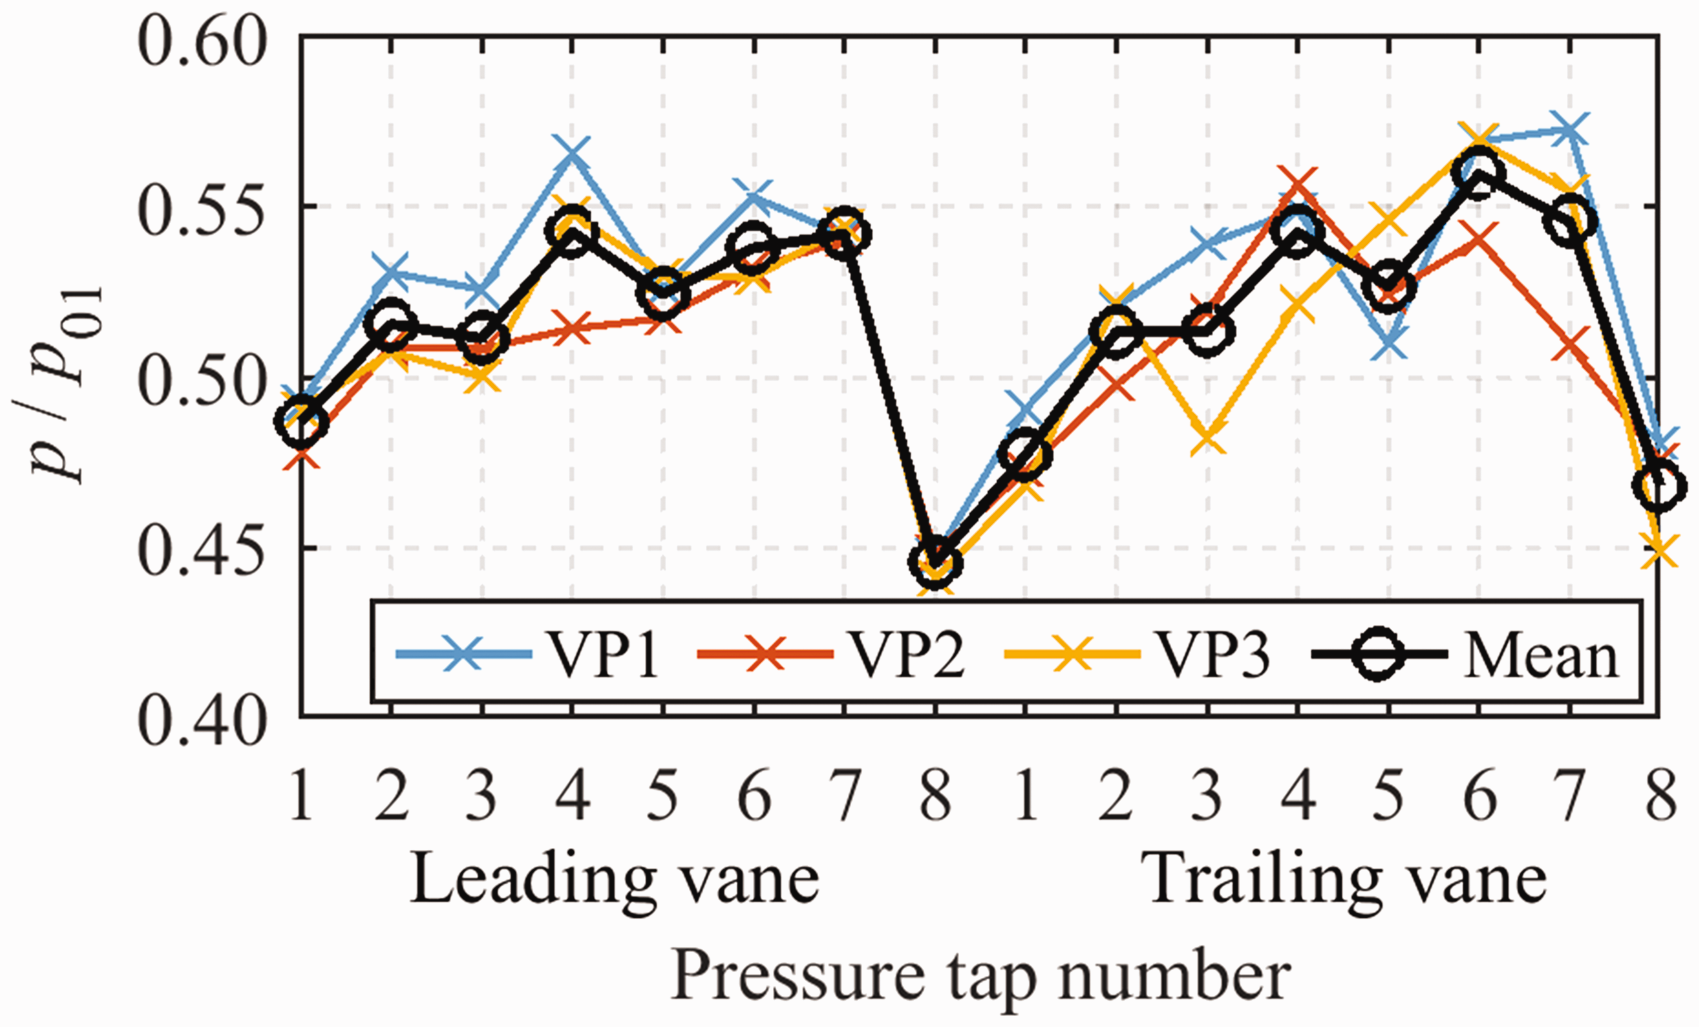
Capacity definition for fully cooled NGVS
Consideration is now given to the definition of capacity in a system with several streams at different conditions of inlet total pressure and temperature. This is relevant to an HP NGV because a typical vane has a mainstream flow, coolant flow ejected from film cooling holes (often distributed over the vane surface) and coolant ejection from the trailing edge.
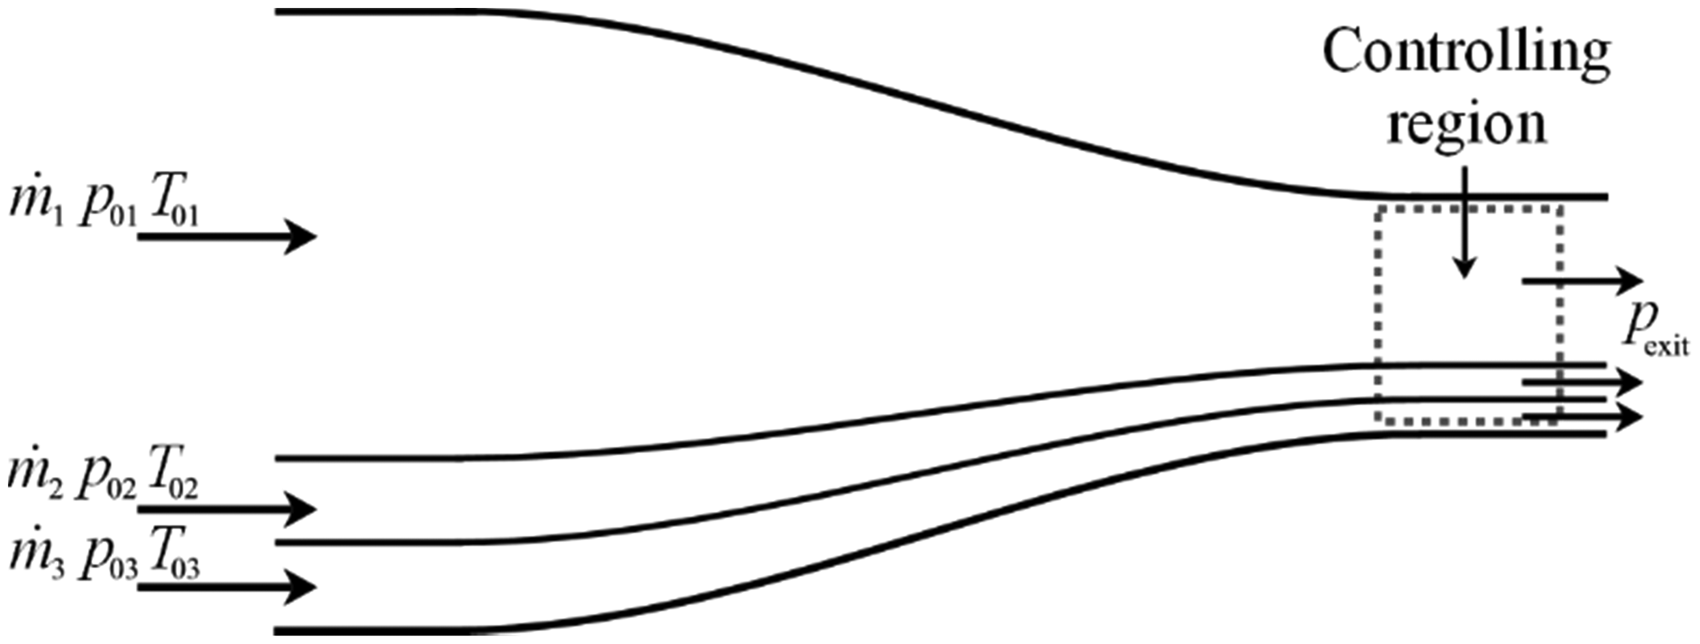
A schematic representation of a typical HP vane cooling system is presented in Figure 9. The flow system can be characterised by a mainstream flow (subscripted 1), a film cooling system (subscripted 2), simplified to a single stream for the purpose of this analysis, and a trailing edge coolant outlet (subscripted 3). At engine conditions the two coolant flows generally enter at significantly lower total temperature than the mainstream, and marginally higher total pressure. Comparisons between systems therefore depend on the particular definition of capacity used. In this system, film cooling flow (2) enters the mainstream in a low Mach number region and partially mixes before passing through the controlling region (this terminology is discussed below) of the passage. Trailing edge coolant (3) enters the domain within the (loosely defined) controlling region.
Schematic of a typical HP vane cooling system showing mainstream flow (1), film cooling flow (2), and trailing edge coolant flow (3).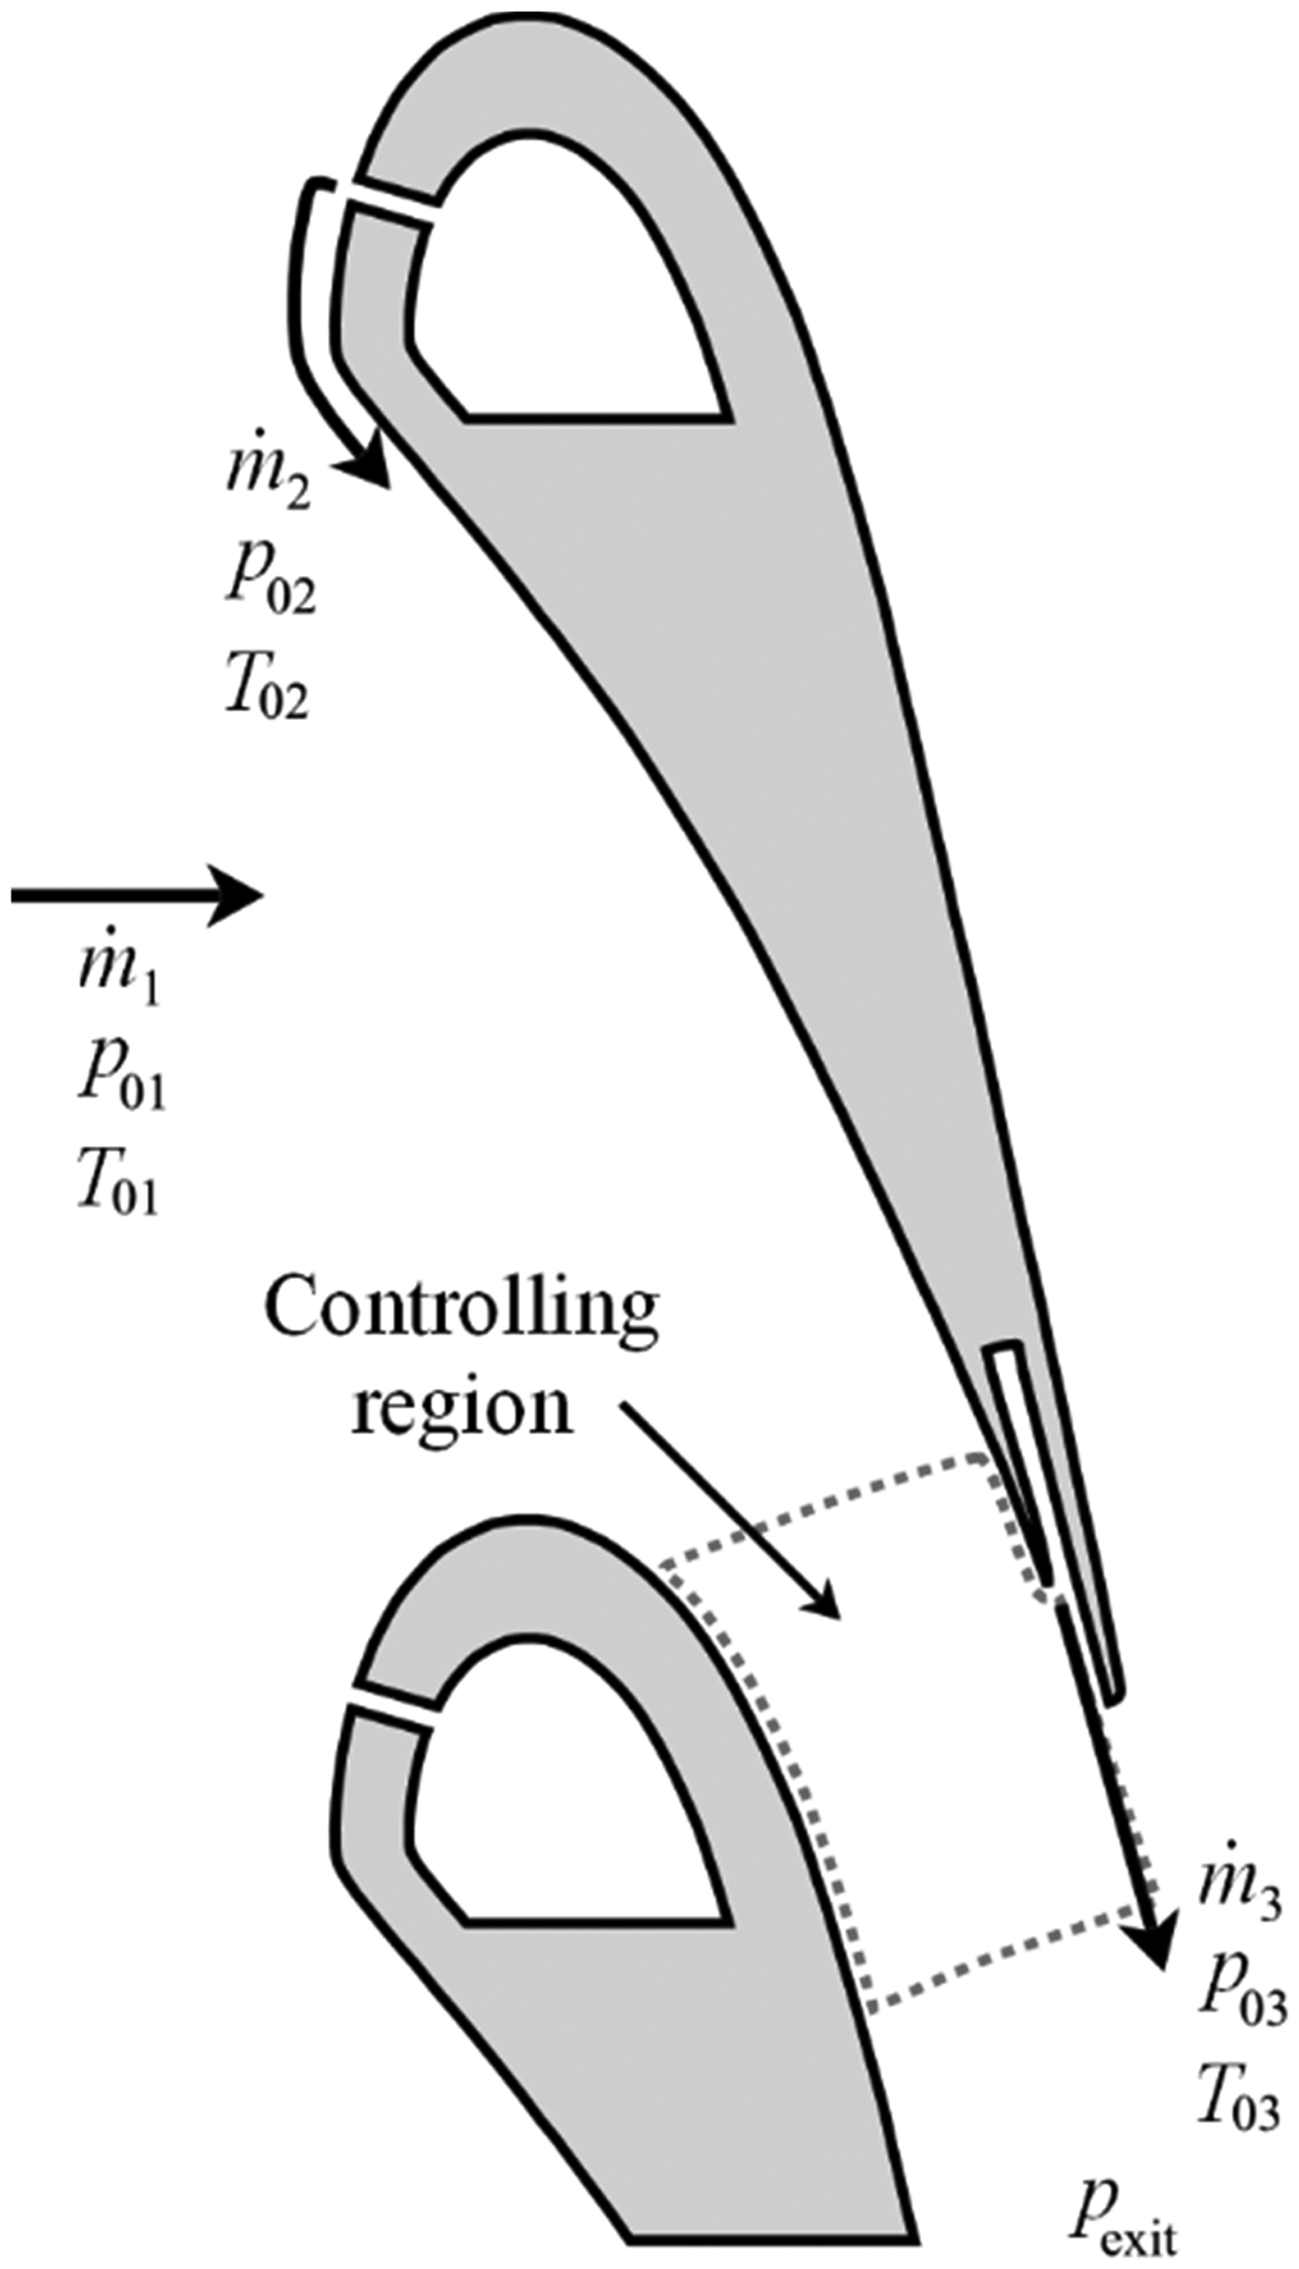
In the description above, the traditional terminology of a vane throat was avoided, as it gives rise to misleading notions which are only applicable to 1D systems. The minimum geometric passage area can be determined by reference to CAD drawings of the part or by using techniques such as structured light scanning to directly measure the part geometry. The complex 3D geometry of some parts further complicates even the practical definition of a minimum physical area. Should the definition be restricted to a flat plane or should the area be defined as that integrated across projections normal to the local streamlines? However, this alone gives poor insight into the vane capacity.
It is well established that NGVs with the same geometric minimum area can have capacity characteristics that differ by 10% or more. 3 Indeed, a typical HP vane has a large region of fairly complex flow in the transonic Mach number range. At the point of minimal physical area (defined either by a plane or a more complex surface), the flow is generally found to be either sub-or super-critical over most of this ‘throat’, often by a significant margin. Indeed, for a vane operating at a nominally choked (based on 1D assumptions) pressure ratio, the sonic surface can pass through the minimum physical area with quite a high angle of intersection (i.e. the sonic surface and the surface of minimum physical area are poorly aligned). In some cases, the sonic surface is not bounded by the vane passage, but extends out into the wake region downstream. This rather fundamental observation brings into question the usefulness of concepts of minimum geometric area.
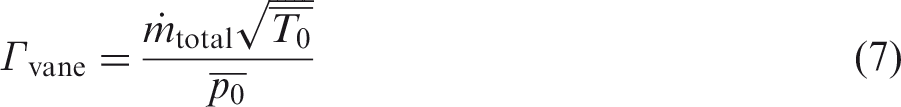
The question therefore arises as to the most appropriate way to define vane capacity in a multi-stream system. The simplest definition might be to base the capacity definition on the overall mass flow, and the mainstream total temperature and pressure:
One objective in evaluating the suitability of a capacity definition, however, might be that it be as independent as possible of the individual stream flow properties (in the simplest case this means the inlet total pressure and temperature for each stream)—i.e. the capacity should change as little as possible when the individual stream properties change. Three simplified representations of the system in Figure 9 are now considered.
Model 1
In the first model, three initially independent streams fully mix at low Mach number before being accelerated to uniform exit conditions at a single controlling area. This model is referred to as the fully mixed, multi-stream, single controlling area model. It is illustrated schematically in Figure 10.
Schematic diagram of the fully mixed, multi-stream, single controlling area model.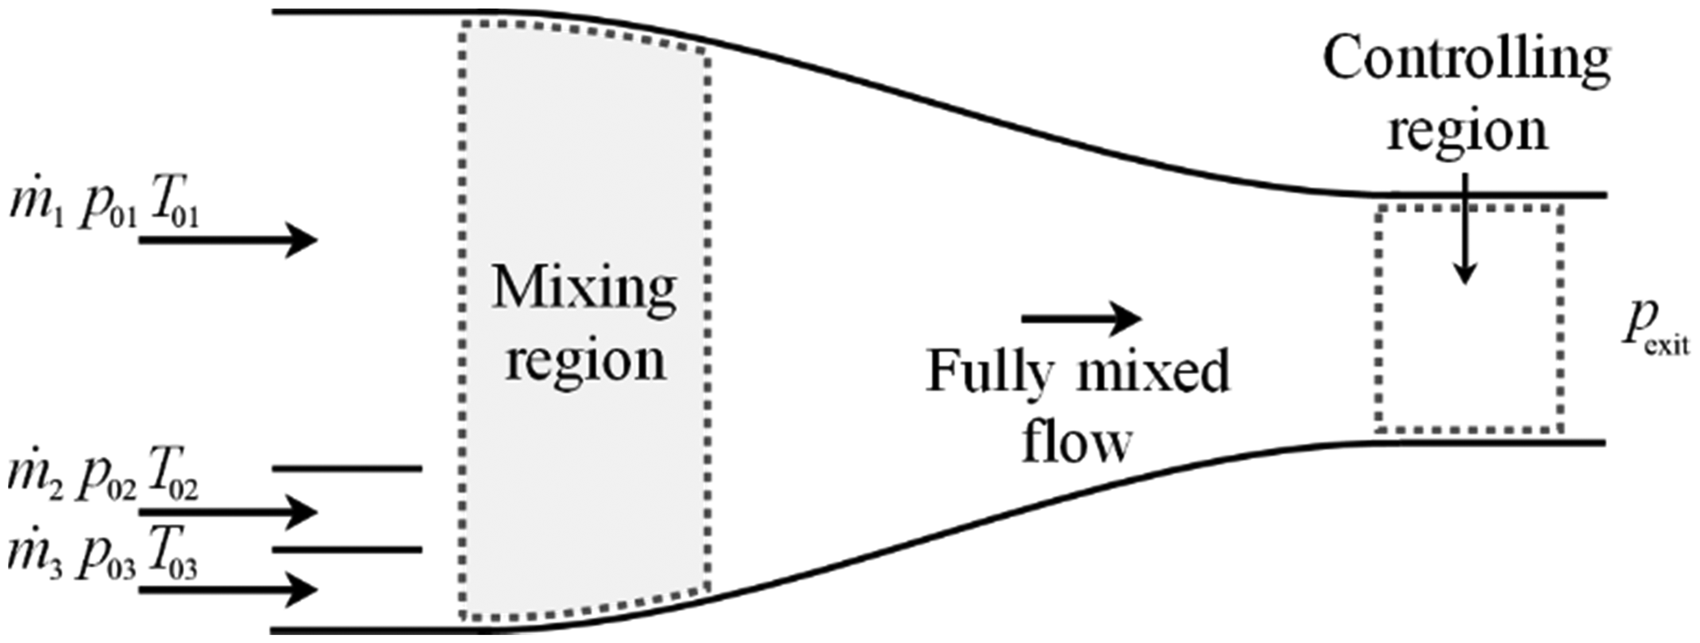
In this system, the mass flow rate through the controlling area depends only on the flow conditions of the fully mixed flow stream and the downstream static pressure (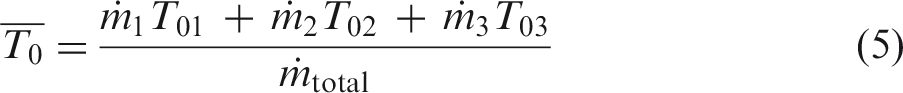
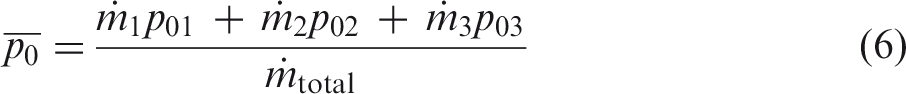
This leads directly to the following definition of capacity
For completeness, it should be noted that a difference in cp between the streams (e.g. that seen between mainstream and coolant flows in the engine situation) would require equation (5) to be adapted. It may also be necessary to consider the variation in gas properties (γ and R) between the streams.
In systems which can be approximated by the model of Figure 10, the definition in equation (7) should be relatively insensitive to the individual stream properties. Recalling the caveats regarding the evaluation of the average flow properties passing through the controlling area, effects leading to incorrect averaging would cause capacity differences between systems that, in the framework of this model, would be considered nominally identical (same controlling area). That is, whilst definition (
Model 2
In the second model, the streams are considered to be entirely independent of one other. That is, they each have independent controlling areas which do not interact. This model is illustrated in Figure 11. This system is referred to as the unmixed, multi-stream, multiple controlling area model, and represents the opposing extreme to Model 1. The capacity of this system is represented by the sum of the three individual stream capacities
Schematic diagram of the unmixed, multi-stream, multiple controlling area model.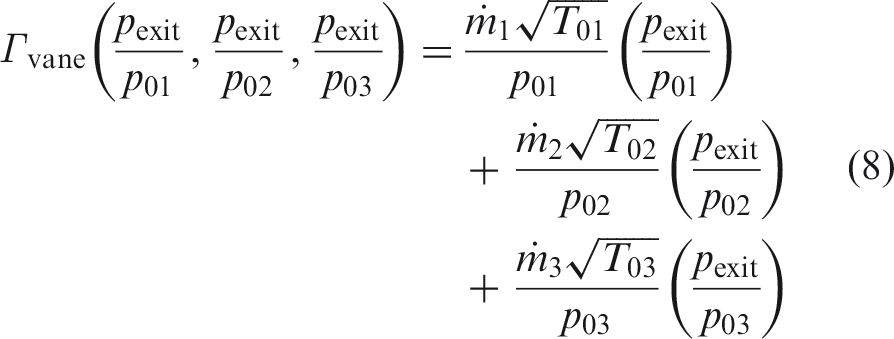
In a typical cooling system (represented in Figure 9), the ratios of the downstream pressure to the coolant stream pressures, 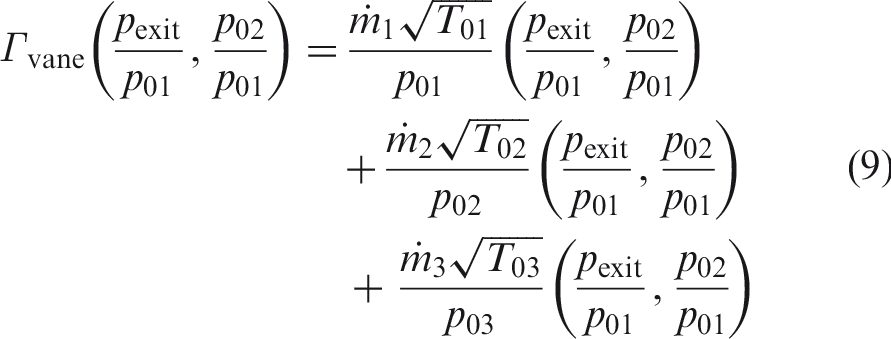
Each of the three terms on the right hand side of equation (9) are surfaces of capacity. The term on the left-hand side, total capacity, is a surface which is simply the summation of those three terms. Two variables are sufficient to define a position on the surface: the vane pressure ratio ( Surface of capacity, as a function of both vane pressure ratio, 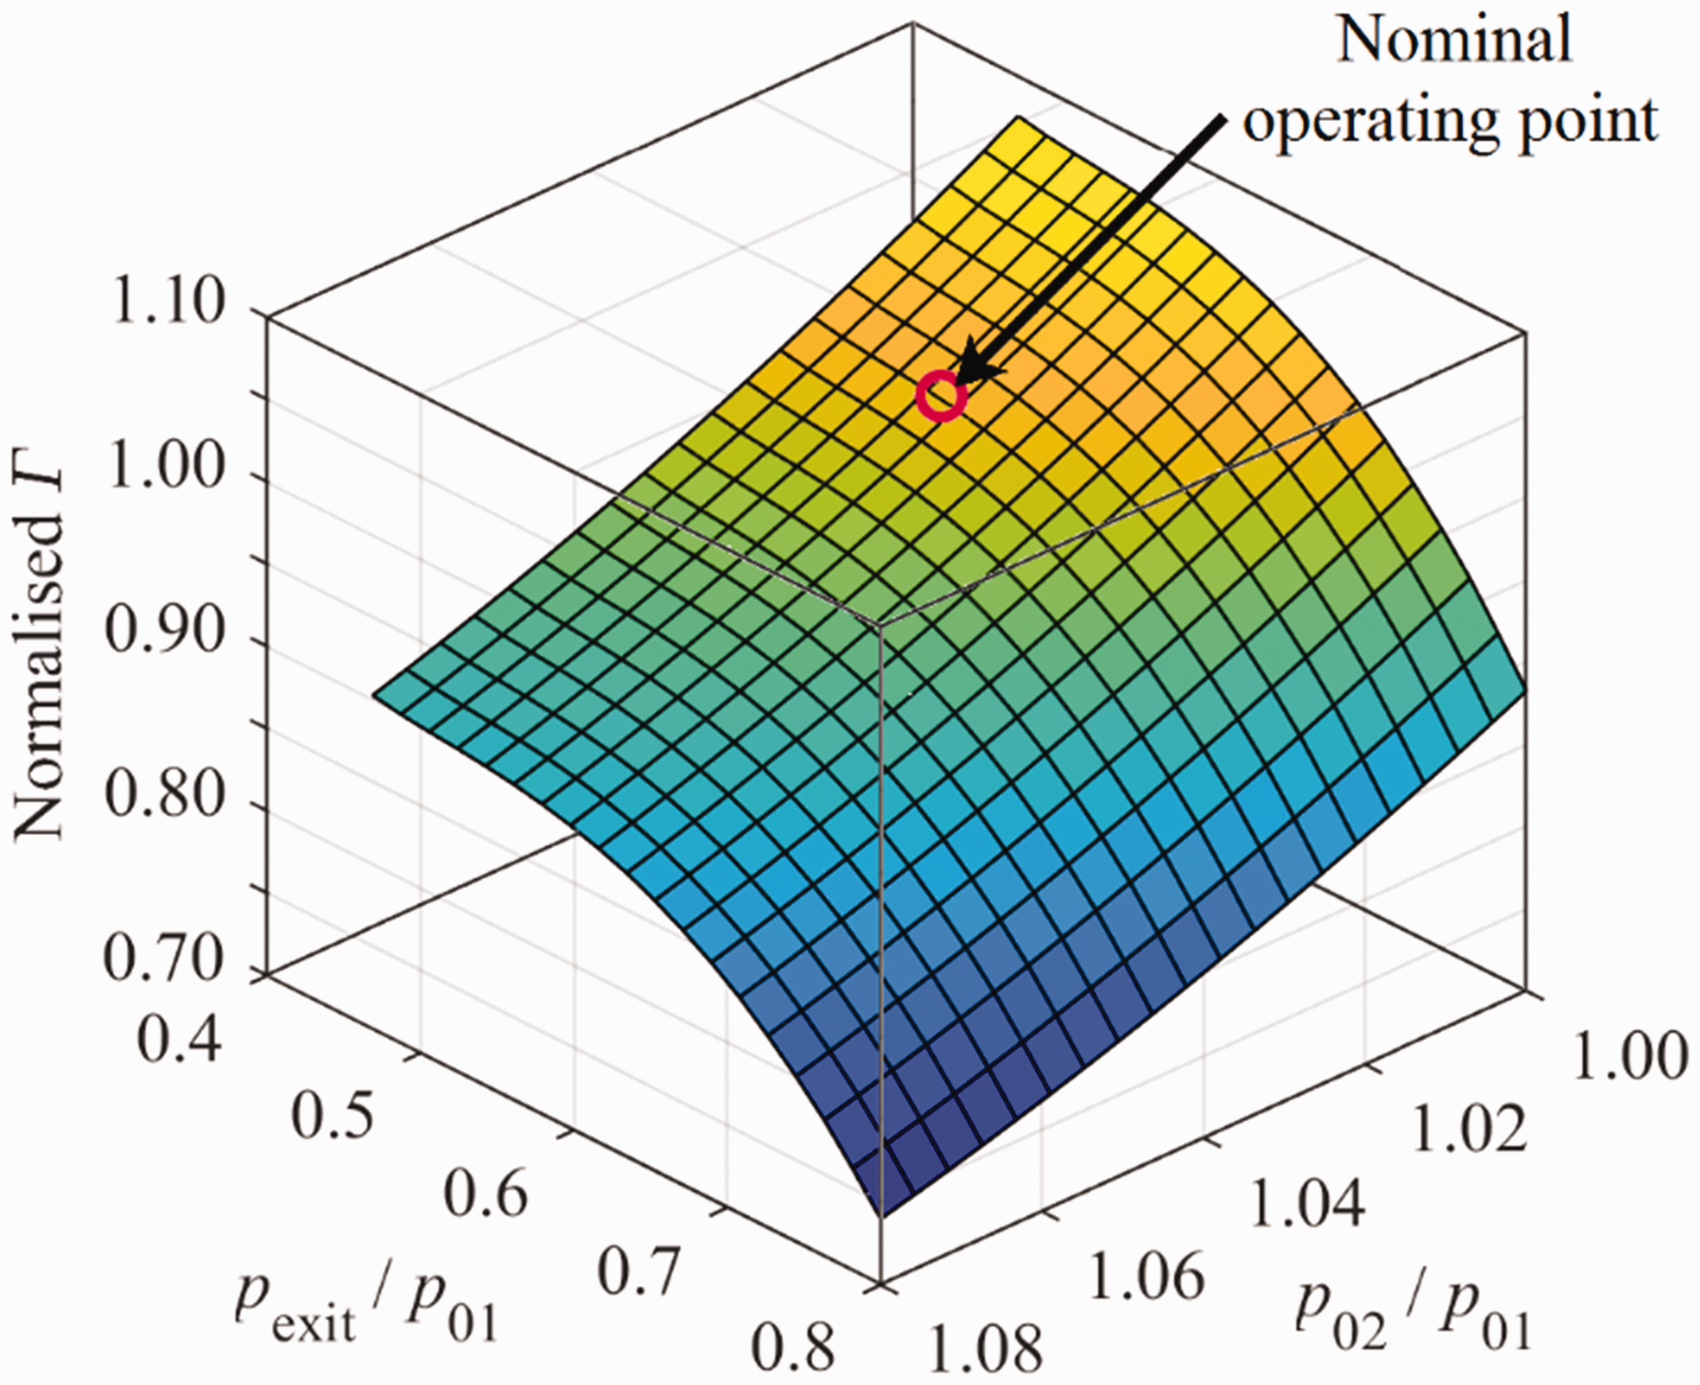
It is well established that one of the prime sensitivities in setting HP NGV capacity (at the design or manufacture stage) is the interaction of trailing edge coolant flow with the mainstream. The effect is typically greater by at least an order of magnitude than the sensitivity to particular film cooling arrangements. The trailing edge sensitivity is a function of both the detailed shape of the part in this region, and coolant-to-mainstream pressure ratio. An advantage of definition (
Model 3
It is possible to construct a hybrid model in which the mainstream and film cooling flows mix fully before passing through a single controlling area, and in which there is an independent controlling area for the trailing edge cooling flow. This model is shown schematically in Figure 13.
Schematic diagram of a hybrid model involving fully mixed mainstream and film cooling flows (1, 2) and unmixed trailing edge coolant (3).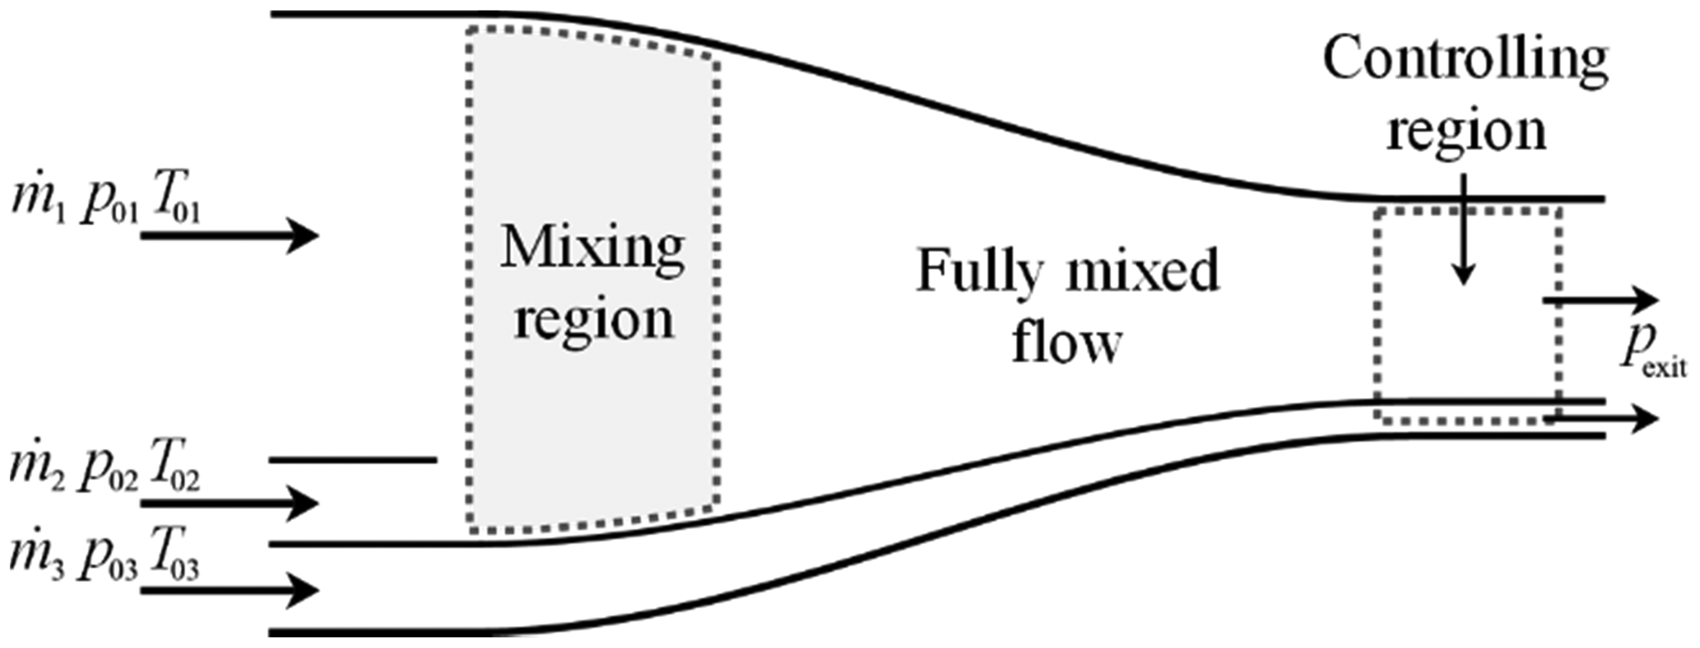
A related system to this hybrid model was studied analytically by Povey.
4
Although this study
4
was restricted to only two streams (mainstream and film coolant), a more sophisticated treatment of mixing was developed (by means of a full control-volume approach, accounting for pressure losses in the partially mixed layer and changes in gas properties) allowing for both partial mixing (to a defined film cooling effectiveness) and a particular acceleration (to a defined ‘throat’ Mach number). In Povey,
4
the difference in capacity between experimental rig and engine conditions for typical boundary conditions was evaluated as a correction parameter. It was concluded
4
that there are unacceptable (of order 1.88%) sensitivities (differences between rig and engine situations) when definition (
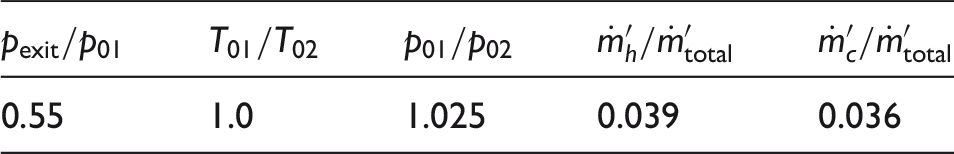
Summary of simplified rig and engine conditions.
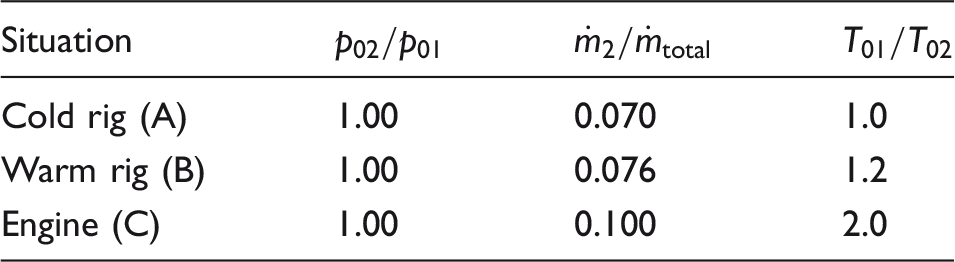
The current experiments in the ECAT facility are closest to the cold rig situation (A). In all situations, the system has been simplified to a single cooling feed (i.e.
The sensitivity of capacity—according to these definitions—to variations in the coolant mass flows is also considered. Conditions A′ and A″ are defined to represent variations of −10% and +10% of Contours of percentage difference in capacity defined according to equations (4) and (9), as a function of coolant-to-mainstream mass flow ratio and temperature ratio. Contours of percentage difference in capacity defined according to equations (7) and (9), as a function of coolant-to-mainstream mass-flow ratio and mainstream-to-coolant temperature ratio.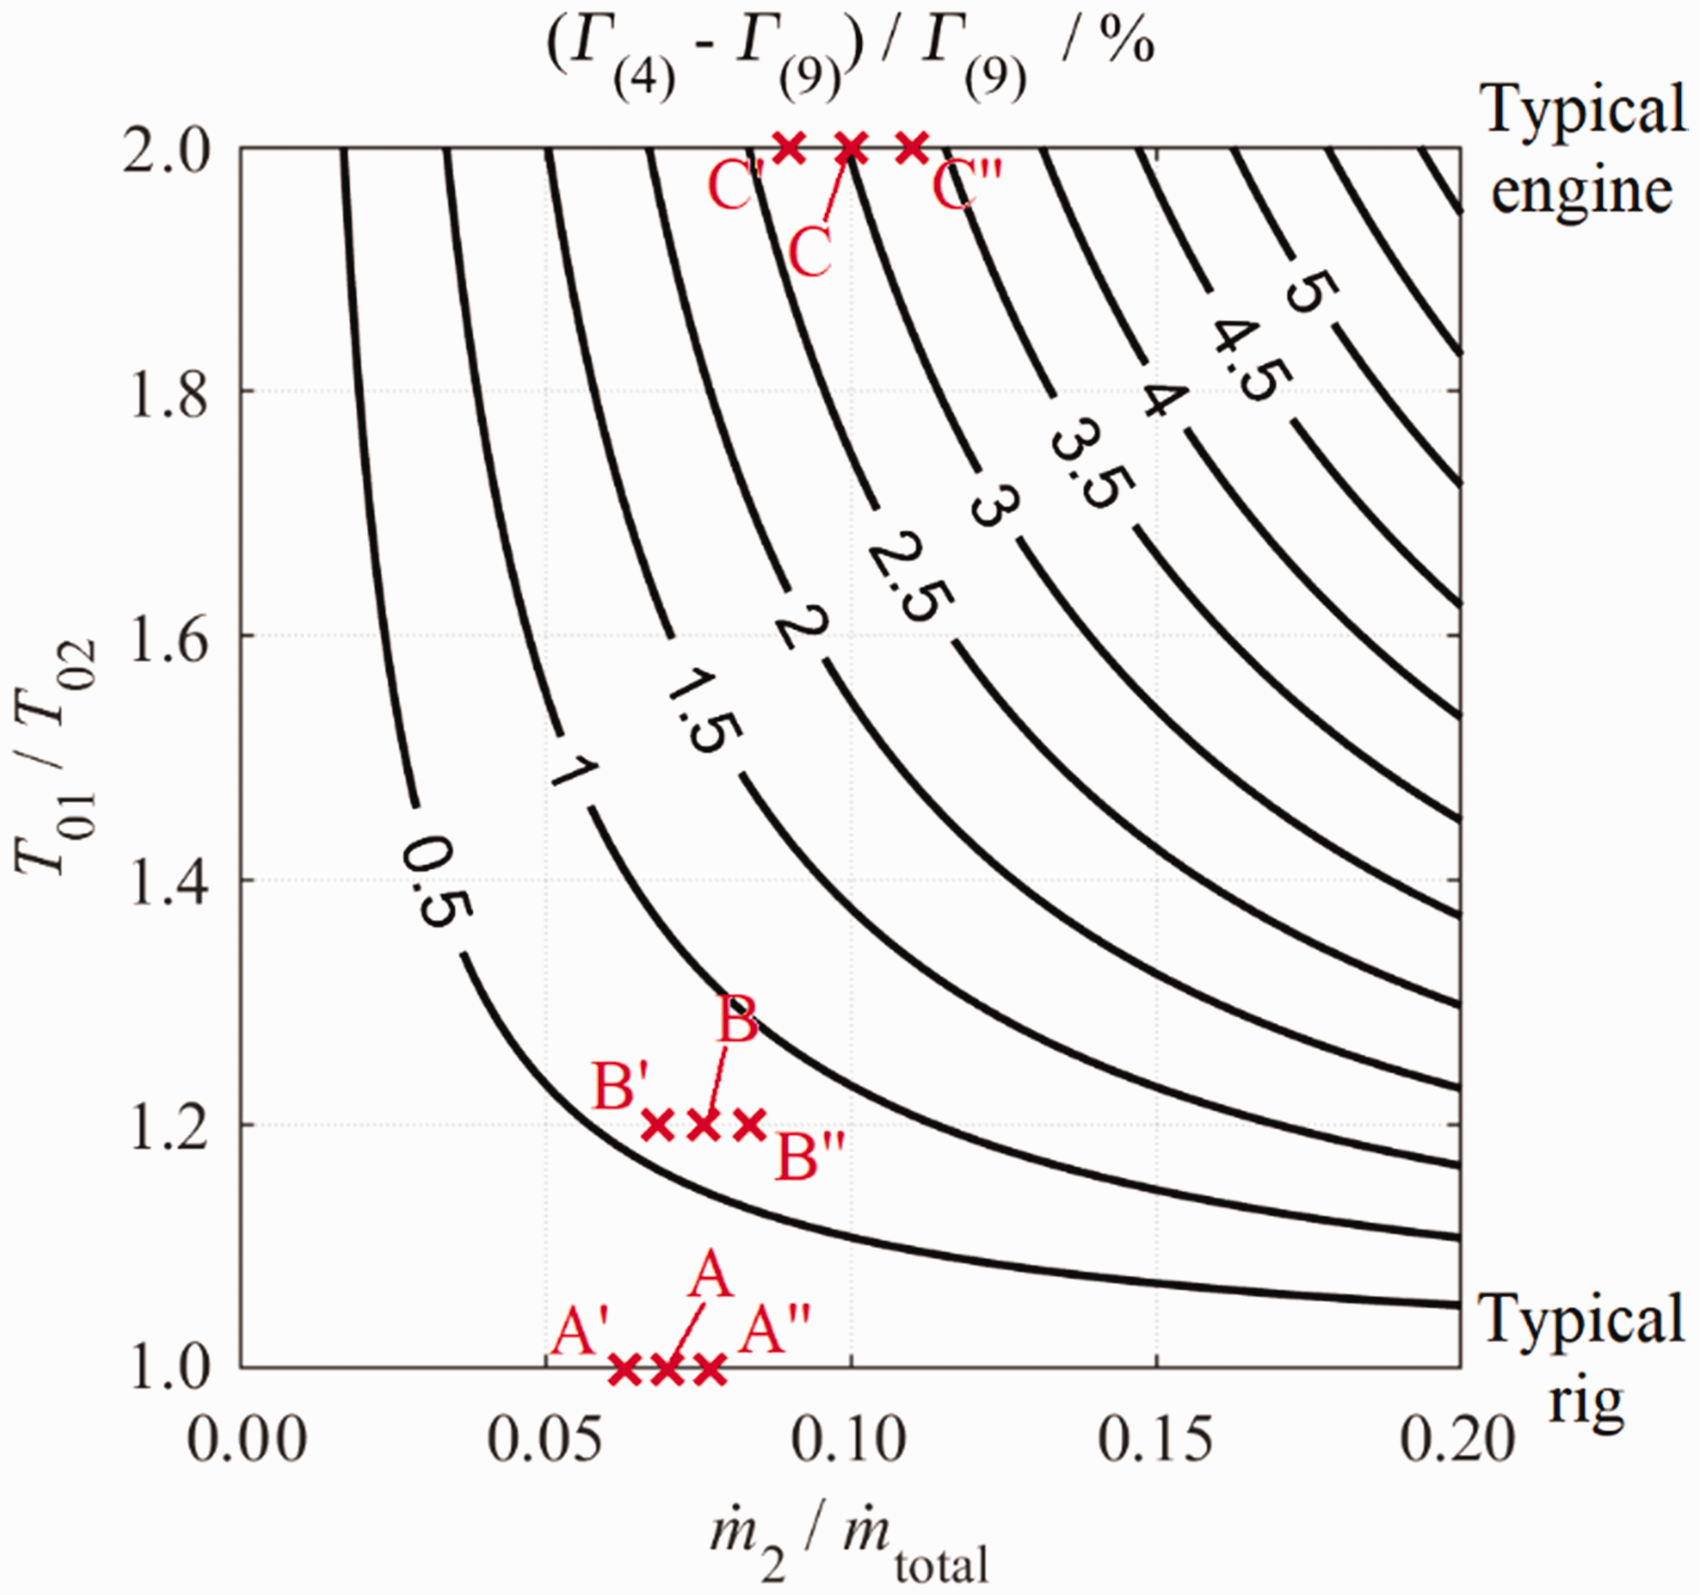
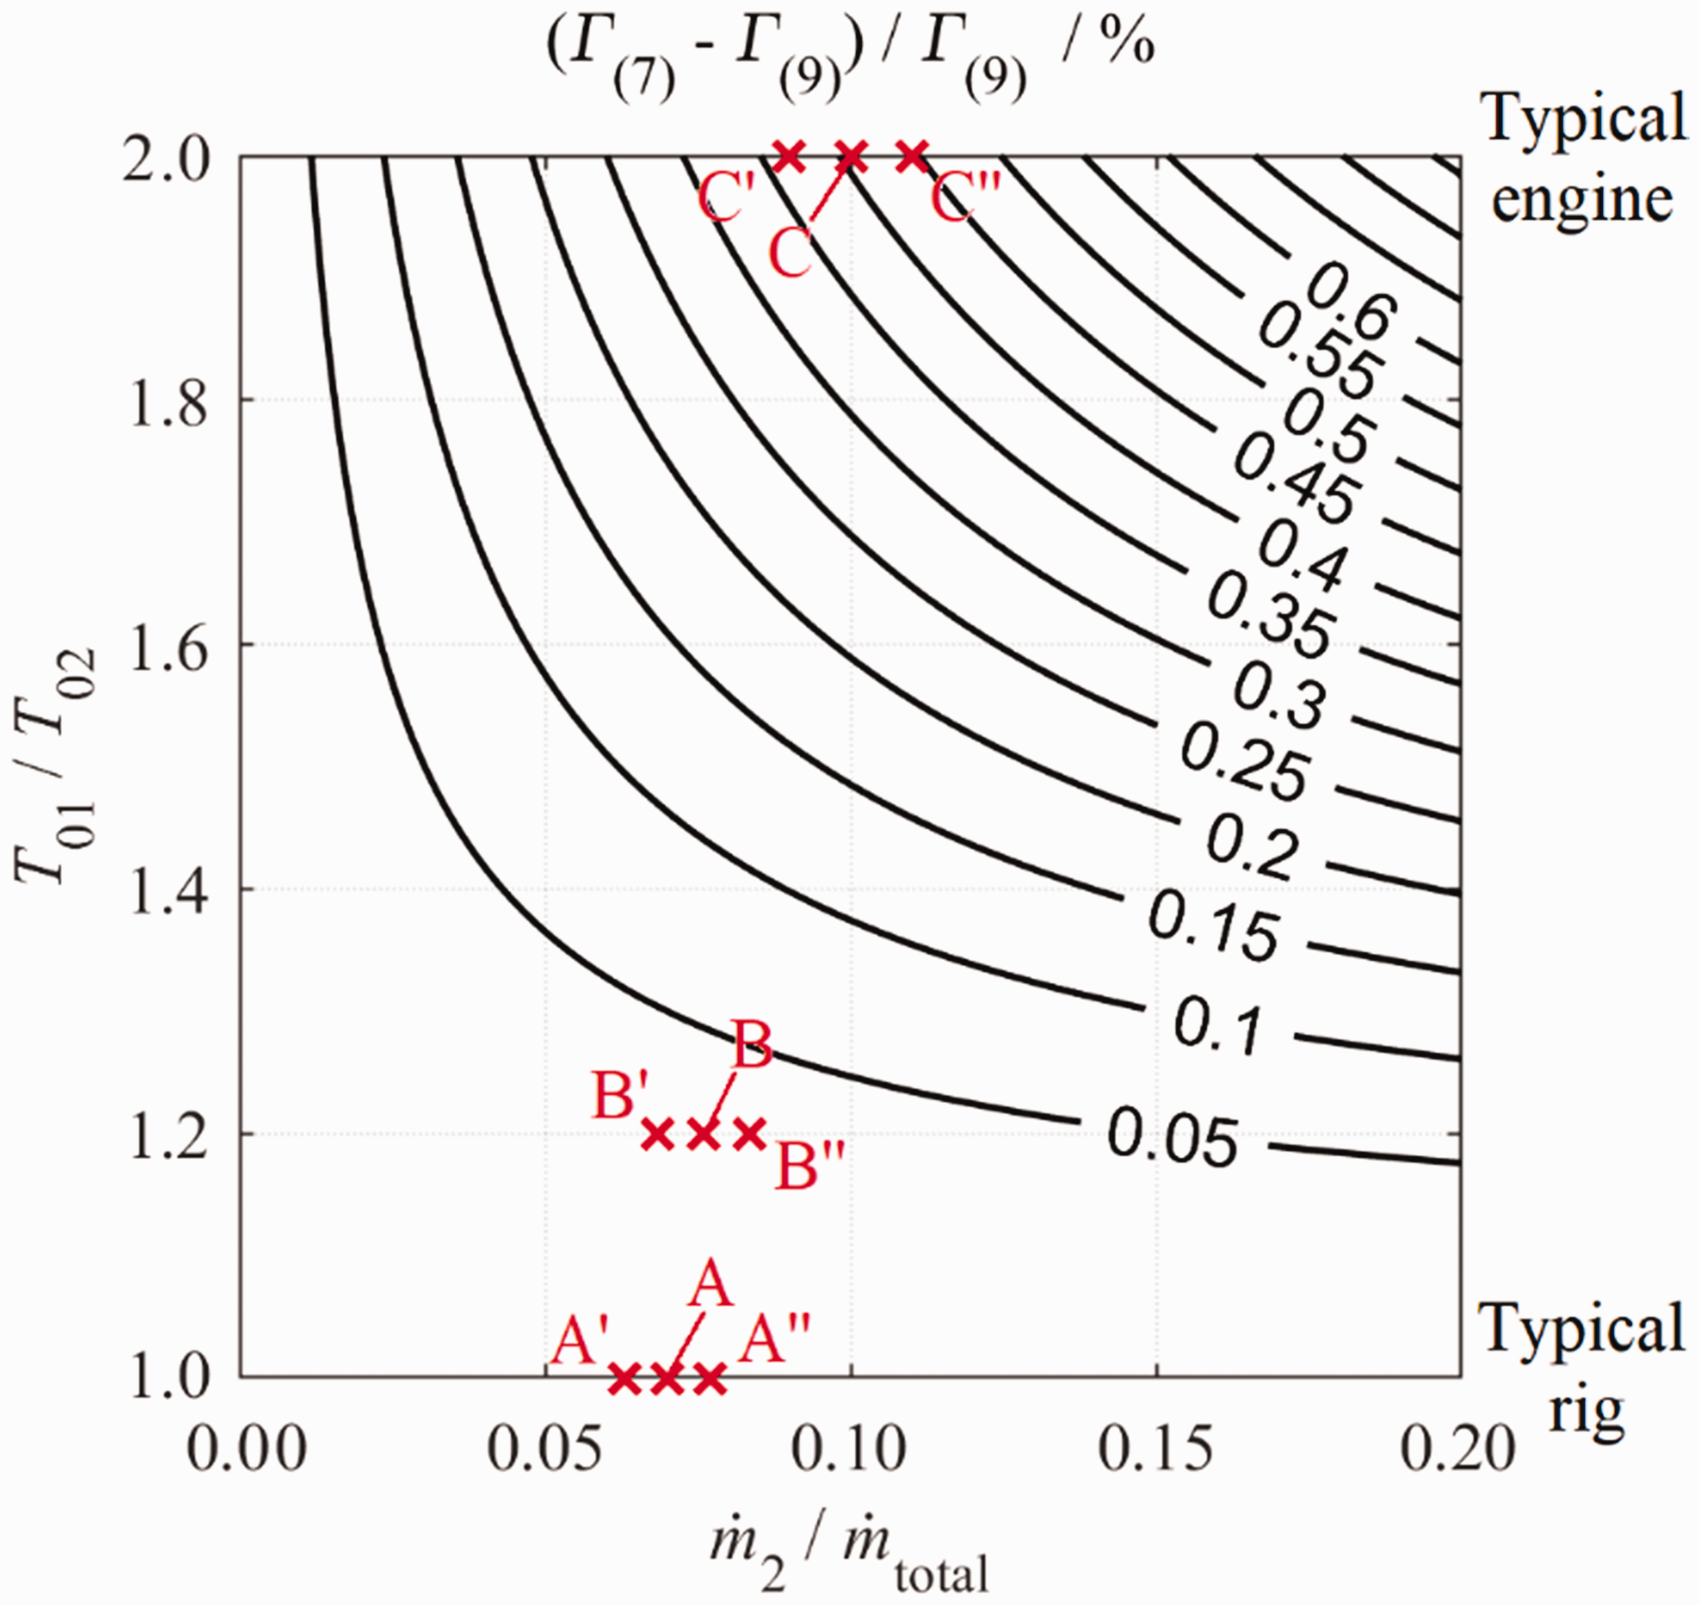
Summary of differences in sensitivity of different capacity definitions from Figures 14 and 15.
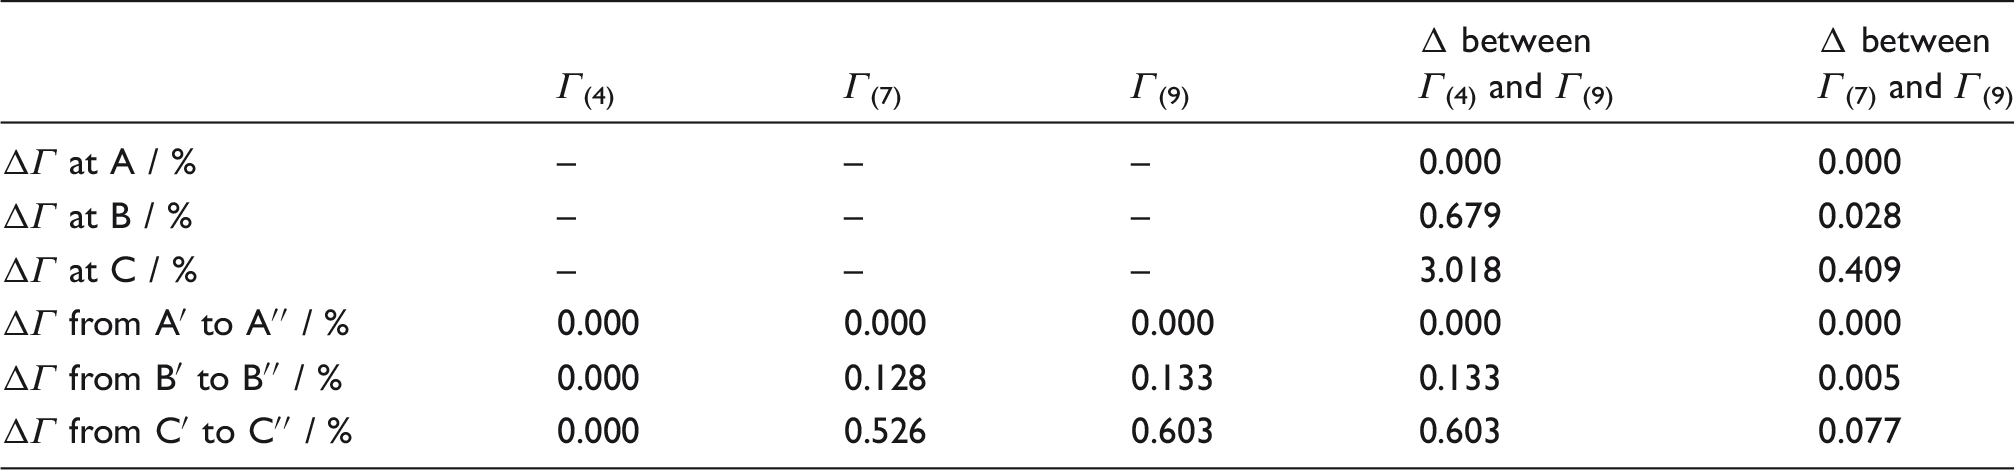
Consider now Figure 15, which shows the difference between equations (9) and (7). Again, at cold rig conditions (A) there is no difference in capacity due to temperature averaging alone, as the streams share a common temperature.
At warm rig (B) and engine (C) conditions, there are 0.028% and 0.409% differences in capacity (respectively) between these definitions. These differences are considerably smaller (by an order of magnitude at warm rig conditions) than between equations (9) and (4), showing that the difference between these methods of temperature averaging—i.e. implied by equations (9) and (7)—is relatively subtle.
As coolant mass flow rate is varied at cold rig conditions (A′ to A″), there is no difference in the capacity change between definitions (
We conclude that whilst it is helpful (for the purpose of translating between different environments; see also studies4,7) for the mass flow rate and inlet temperature of coolant flows to be included in the capacity definition (as in equations (7) and (9), but not in equation (4)), the difference arising from the way in which this is achieved is relatively small. That is, using the square root of the mass-flow-weighted temperature with the total mass flow rate (equation (7)), or using the mass-flow-weighted sum of individual
However, the definition in equation (9) has one significant advantage: in the correct experiment, it is possible (by virtue of the form of the equation) to isolate sensitivities to key effects such as trailing edge coolant ejection. That is, where the mass flow rates of the individual streams are independently metered, it becomes possible to identify the change in the mainstream mass flow (
We feel that this justifies, for most purposes, defining NGV capacity in the form of equation (9)—it is sufficiently complete (on account of
Evaluation of vane capacity characteristic
A capacity characteristic for a test vane can be generated, in principle, from a single test in blowdown mode operation. In practice, a number of repeat tests are performed, both to reduce the precision error in the mean of the characteristic and to allow this precision error to be evaluated. In this section, data from a typical set of experiments is presented and the method of generating a mean characteristic is demonstrated.
In this particular set, a total of 17 individual tests were conducted, shown by yellow lines in Figure 16(a). The mean capacity characteristic is overlaid in blue. Capacity is defined as in equation (9). Mass flow rates and vane inlet conditions of total pressure and temperature for each of the three constituent streams (mainstream, hub and case coolant) are measured as described in the preceding sections. The data are normalised with respect to the value at the nominal choked condition ( (a) Capacity characteristics from a typical HP NGV showing 17 repeat runs, and the mean-line trend; (b) number of repeat tests conducted as a function of 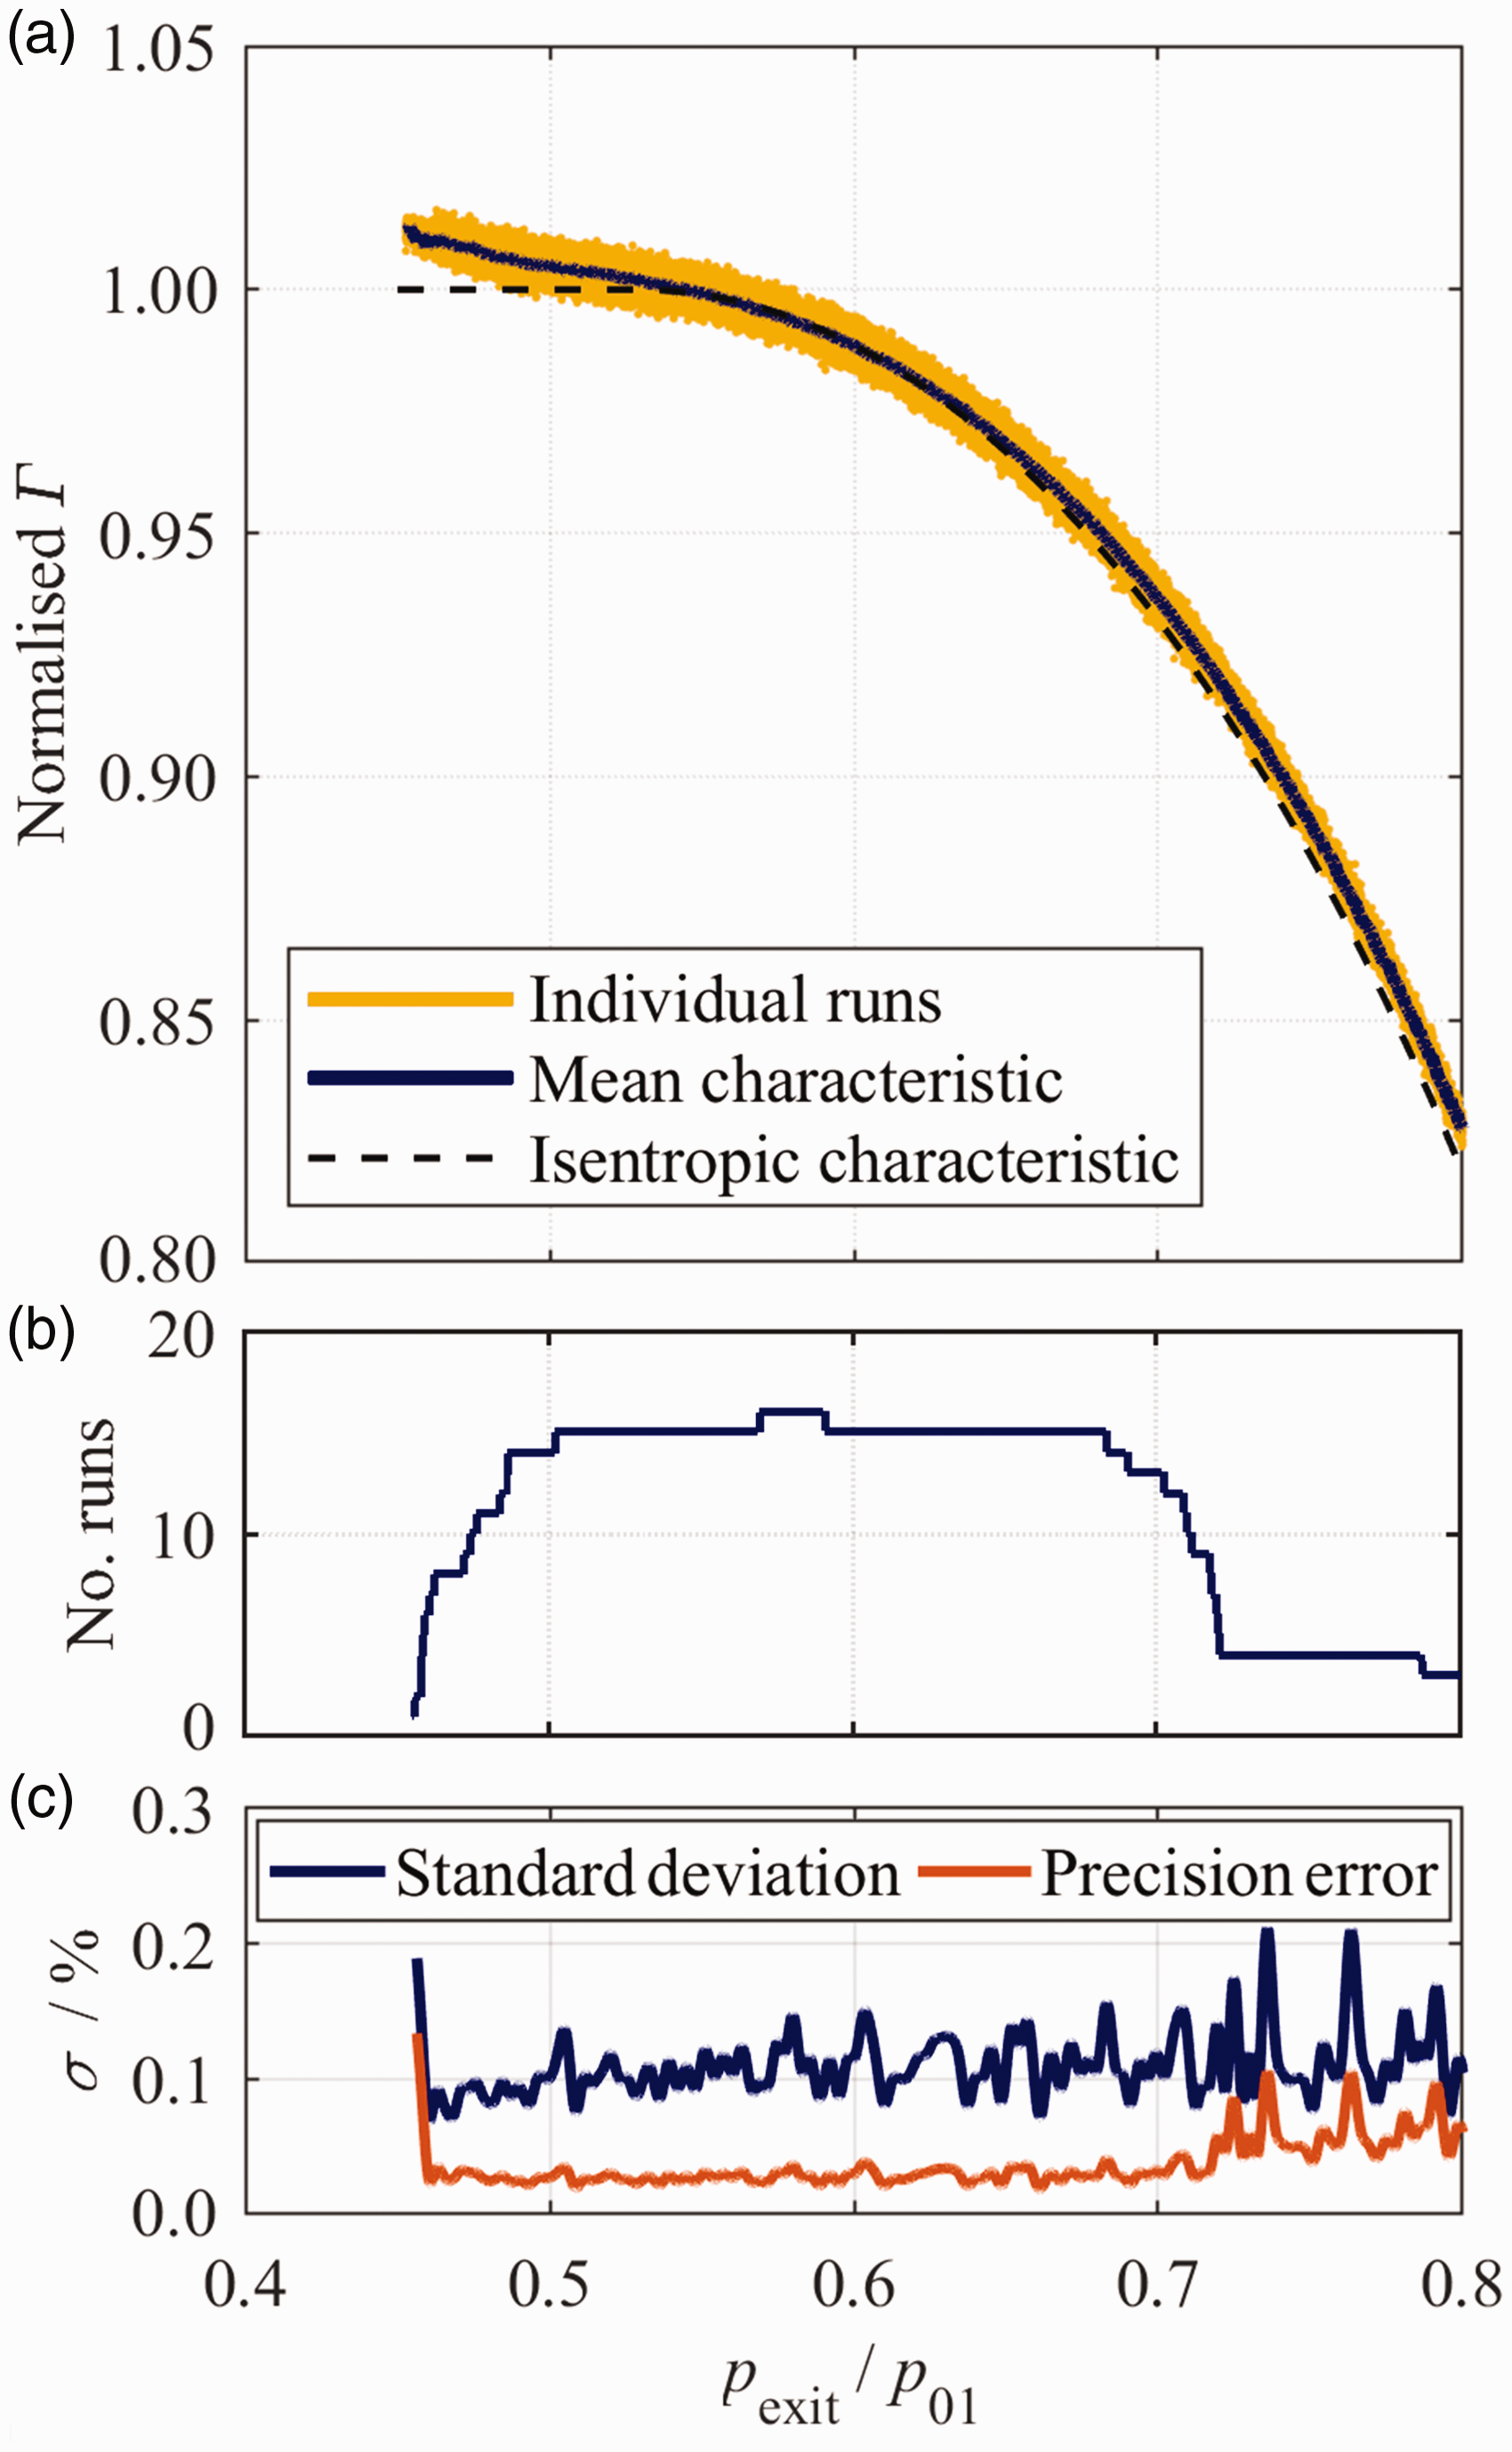
To produce the mean characteristic, the data from all of the individual runs were resampled onto a uniform pressure ratio grid, allowing an unbiased mean to be computed. Individual runs had different ranges of
The capacity characteristic is, to first order, that of the classical isentropic trend (shown by the dashed curve in Figure 16a). In contrast to the isentropic trend, however, after reaching a near-plateau at around the critical vane pressure ratio (
Evaluation of bias uncertainty in capacity measurement
The bias uncertainty in a typical vane (or overall) capacity measurement (defined as in equation (9)) is now considered. Capacity is a derived (as opposed to directly measured) variable. Evaluating its bias uncertainty therefore follows several stages. Before the bias uncertainty in capacity can be evaluated, the bias uncertainty in the following quantities must be determined:
The mass flow metering nozzle effective areas; The measured inlet feed mass flow rates; The unsteady mass flow correction term for each individual mass flow rate; The vane inlet total pressure for each individual stream; The vane inlet total temperature for each individual stream. Error propagation techniques are then used to calculate the bias uncertainty in: The individual stream capacity terms (three terms on the right hand side of equation (9); The total vane capacity (left hand side of equation (9)).
Once the bias uncertainty in the total vane capacity has been obtained, the additional contributions to bias uncertainty arising from the following sources are considered:
Uncertainty in the evaluation of the mean vane operating pressure ratio, Uncertainty in the evaluation of the coolant-to-mainstream pressure ratio,
Summary of conditions for example capacity test case.
(i) Bias uncertainty in mass flow metering nozzle effective areas
The mainstream is fed with a sonic Venturi nozzle, operated at choked pressure ratios. The nozzle was calibrated to a bias uncertainty in the effective area, Am, of ±0.500% (95% confidence). That is,
The hub and case coolant streams are fed from separate choked Venturi nozzles. The nozzle diameters used were approximately 16.0 mm and 15.3 mm for the hub and case, respectively. The estimated bias uncertainty in the coolant nozzle diameters is ±0.05 mm, or
(ii) Bias uncertainty in mass flow measurements
The mass flow rate through a choked Venturi nozzle is a function of the nozzle effective area and the upstream total pressure and temperature. First, consider the mainstream nozzle. The relationship is given by

The general equation for propagation of percentage uncertainty from directly measured to derived quantities is given in equation (21) in Appendix 1. For this case we get
The total pressure upstream of the main nozzle (nominal value 12.0 bar) was measured by two 30 bar transducers with quoted bias uncertainty (combined non-linearity and hysteresis) of ±0.04% of the transducer range. The uncertainty in the average measurement was therefore given by
The total temperature upstream of the main nozzle (nominal value 268 K) was measured using eight 0.025 mm K-type bare-bead thermocouples, with a quoted measurement accuracy of ±1.5 K, or ±0.560%. The percentage uncertainty in the average temperature measurement was therefore 0.56%/
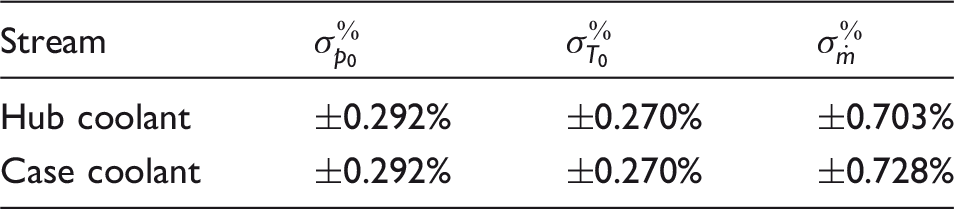
Summary of bias uncertainties in coolant stream pressures, temperatures and mass flow rates.
(iii) Bias uncertainty arising from unsteady mass flow correction terms
Mass accumulation in the intermediate plena between the metering nozzles and the vane (due to changing pressure and temperature) creates a small difference between the mass flow rates delivered to the vane by each of the three streams, and the mass flow rates measured at the corresponding metering nozzles. The measured mass flow rates are corrected for this effect, as discussed in the earlier section.
Again taking the mainstream feed as an example, the mass flow rate delivered to the vane, 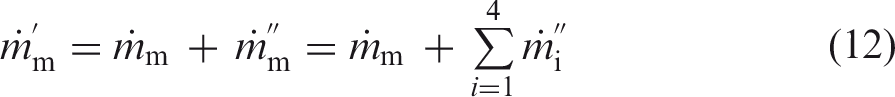
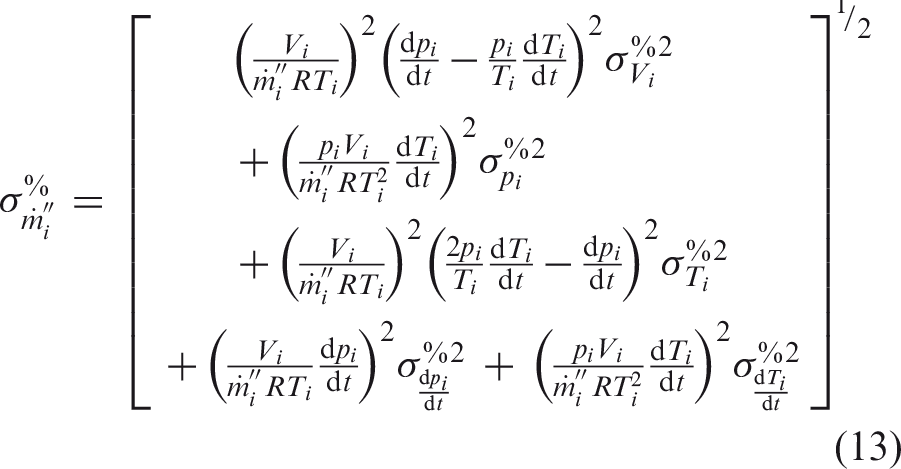
The unsteady mass flow correction term for each of the intermediate plena V1–V6 is computed based on equation (2): ṁ″ = f (Vi, pi, Ti, dpi/dt, dTi/dt), where the subscript i denotes an individual plenum. The volumes of the intermediate plena were measured to an estimated accuracy of ±5%. Uncertainties in the rates of change of plenum pressures and temperatures (dpi/dt, dTi/dt) were estimated conservatively to be of order ±15%. This is a high degree of uncertainty compared to the directly measured quantities and therefore dominates the estimated uncertainties in the correction mass flow rates.
Applying the general equation for uncertainty propagation (equation (21) in Appendix 1) to the expression for the plenum mass flow correction term (equation (2)), an expression is derived for the estimated bias uncertainty in the mass flow correction term for a single plenum
The individual plenum correction terms are estimated and then the uncertainty in the total mainstream correction mass flow rate is determined by summing the terms for plena V1–V4
Summary of typical mainstream, hub and case coolant correction mass flow rates and estimated bias uncertainties.
(iv) Bias uncertainty in inlet total pressure measurements
The mainstream total pressure at vane inlet (nominal value 2.0 bar) is measured using 32 transducers of range 5 bar, with quoted bias uncertainty of ±0.1% of full-scale range. The bias uncertainty in a single measurement was therefore 0.1 (5.0/2.00) = ± 0.250%. The bias uncertainty in the mean of all 32 measurements was therefore
The standard deviation of the 32 individual measurements at a representative single point during a test was ±0.187%. This is within the ±0.250% bias uncertainty expected in an individual measurement due to the transducer specification. Hence, the spatial non-uniformity in inlet total pressure is extremely small.
Hub and case coolant total pressures are measured in the coolant cavities within the vane module in the form of differential measurements relative to the mainstream vane inlet total pressure. The nominal coolant-to-mainstream pressure differential was 0.050 bar. The differentials at hub and case were measured by five and four ±0.350 bar differential transducers, respectively, with quoted bias uncertainty due to non-linearity and hysteresis of ±0.2% of the full-scale range. The estimated percentage bias uncertainties in total pressure are calculated as
The bias uncertainty in the absolute values of coolant inlet total pressure is dominated by the mainstream total pressure measurement due to the small relative size of the pressure differential. Bias uncertainty is computed as
(v) Bias uncertainty in inlet total temperature measurements
Mainstream total temperature at vane inlet (nominal value 277 K) is measured by 32 K-type thermocouples, each with a quoted measurement accuracy of ±1.5 K or ±0.540% bias uncertainty. The bias uncertainty in the mean of all 32 measurements was therefore
The standard deviation of the 32 individual measurements at a representative single point during a test was ±0.074%. This is small in comparison to the ±0.540% bias uncertainty in the individual measurements, indicating that the spatial non-uniformity in inlet total temperature is negligible. For completeness, note that the assumption that all of the individual measurements are entirely independent is unlikely to be true in practice, as the instruments come from a common batch and thus their bias uncertainties will be partially correlated.
Hub and case coolant stream total temperatures are measured in the coolant cavities within the vane module, by five and four K-type thermocouples, respectively. The bias uncertainties are therefore determined as
(vi) Bias uncertainty in individual stream capacity terms
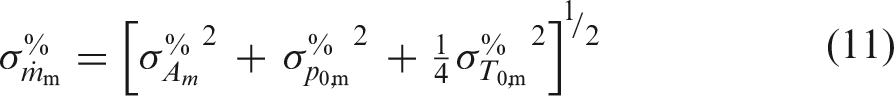
The bias uncertainties in mass flow rate, inlet total pressure and total temperature are now combined to calculate the bias uncertainty in capacity. This is done for each of the mainstream, hub and case coolant streams, represented by the three terms on the right-hand side of equation (9). As an example, the bias uncertainty in the mainstream capacity term, 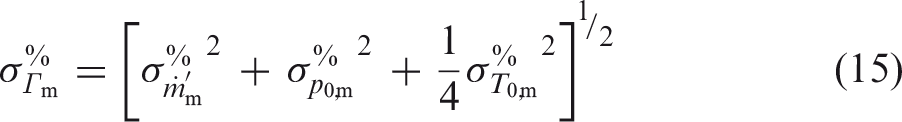
Substituting in numbers gives
The difference in uncertainty between the individual coolant stream mass flow rate and capacity terms is therefore ±0.012% for the hub and ±0.014% for the case. This is driven primarily by the bias uncertainty in coolant feed total temperature measurements. There is little to gain from further optimisation of stream inlet total pressure instrumentation.
(vii) Bias uncertainty in overall capacity measurement
The bias uncertainties associated with the individual capacity terms are now combined to calculate the uncertainty in the overall capacity (definition of equation (9)), as follows
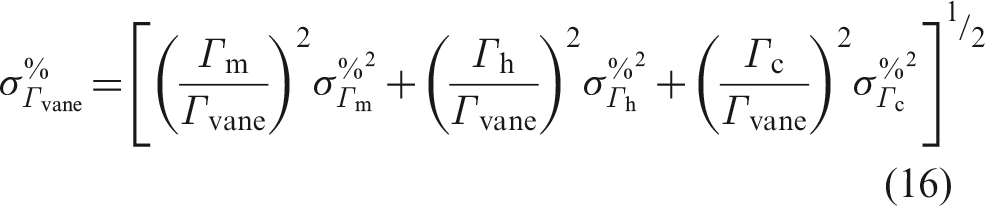
Substituting in the previously computed values gives
(viii) Bias uncertainty in capacity due to uncertainty in exit static pressure and vane pressure ratio
The overall capacity defined in equation (9) is a function of two controlling pressure ratios:
Uncertainty in the measurement of mean static pressure at vane exit,
Likewise, in principle a vane exit static pressure could be defined based on a single tapping measurement. This would likely lead to an unusual capacity characteristic, as the flow structure (exact location and strength of shocks etc.) close to the tapping location would change with vane pressure ratio, thus distorting the x-axis of the characteristic. A more significant problem would be the sensitivity to the exact tapping location, and the difficulty of replicating the precise position in a corresponding CFD study or repeat experiment. The aim—as far as capacity measurement is concerned—is to define a static pressure measurement protocol which is robust between repeat experiments, different builds of the same experiment, and in comparisons against computational simulations.
The sensitivity of capacity to the vane exit static pressure measurement is now examined using 2D Reynolds-Averaged Navier-Stokes (RANS) simulations. The profile is based on a section of the vane at midspan. Results of the simulation are presented in Figures 17 and 18.
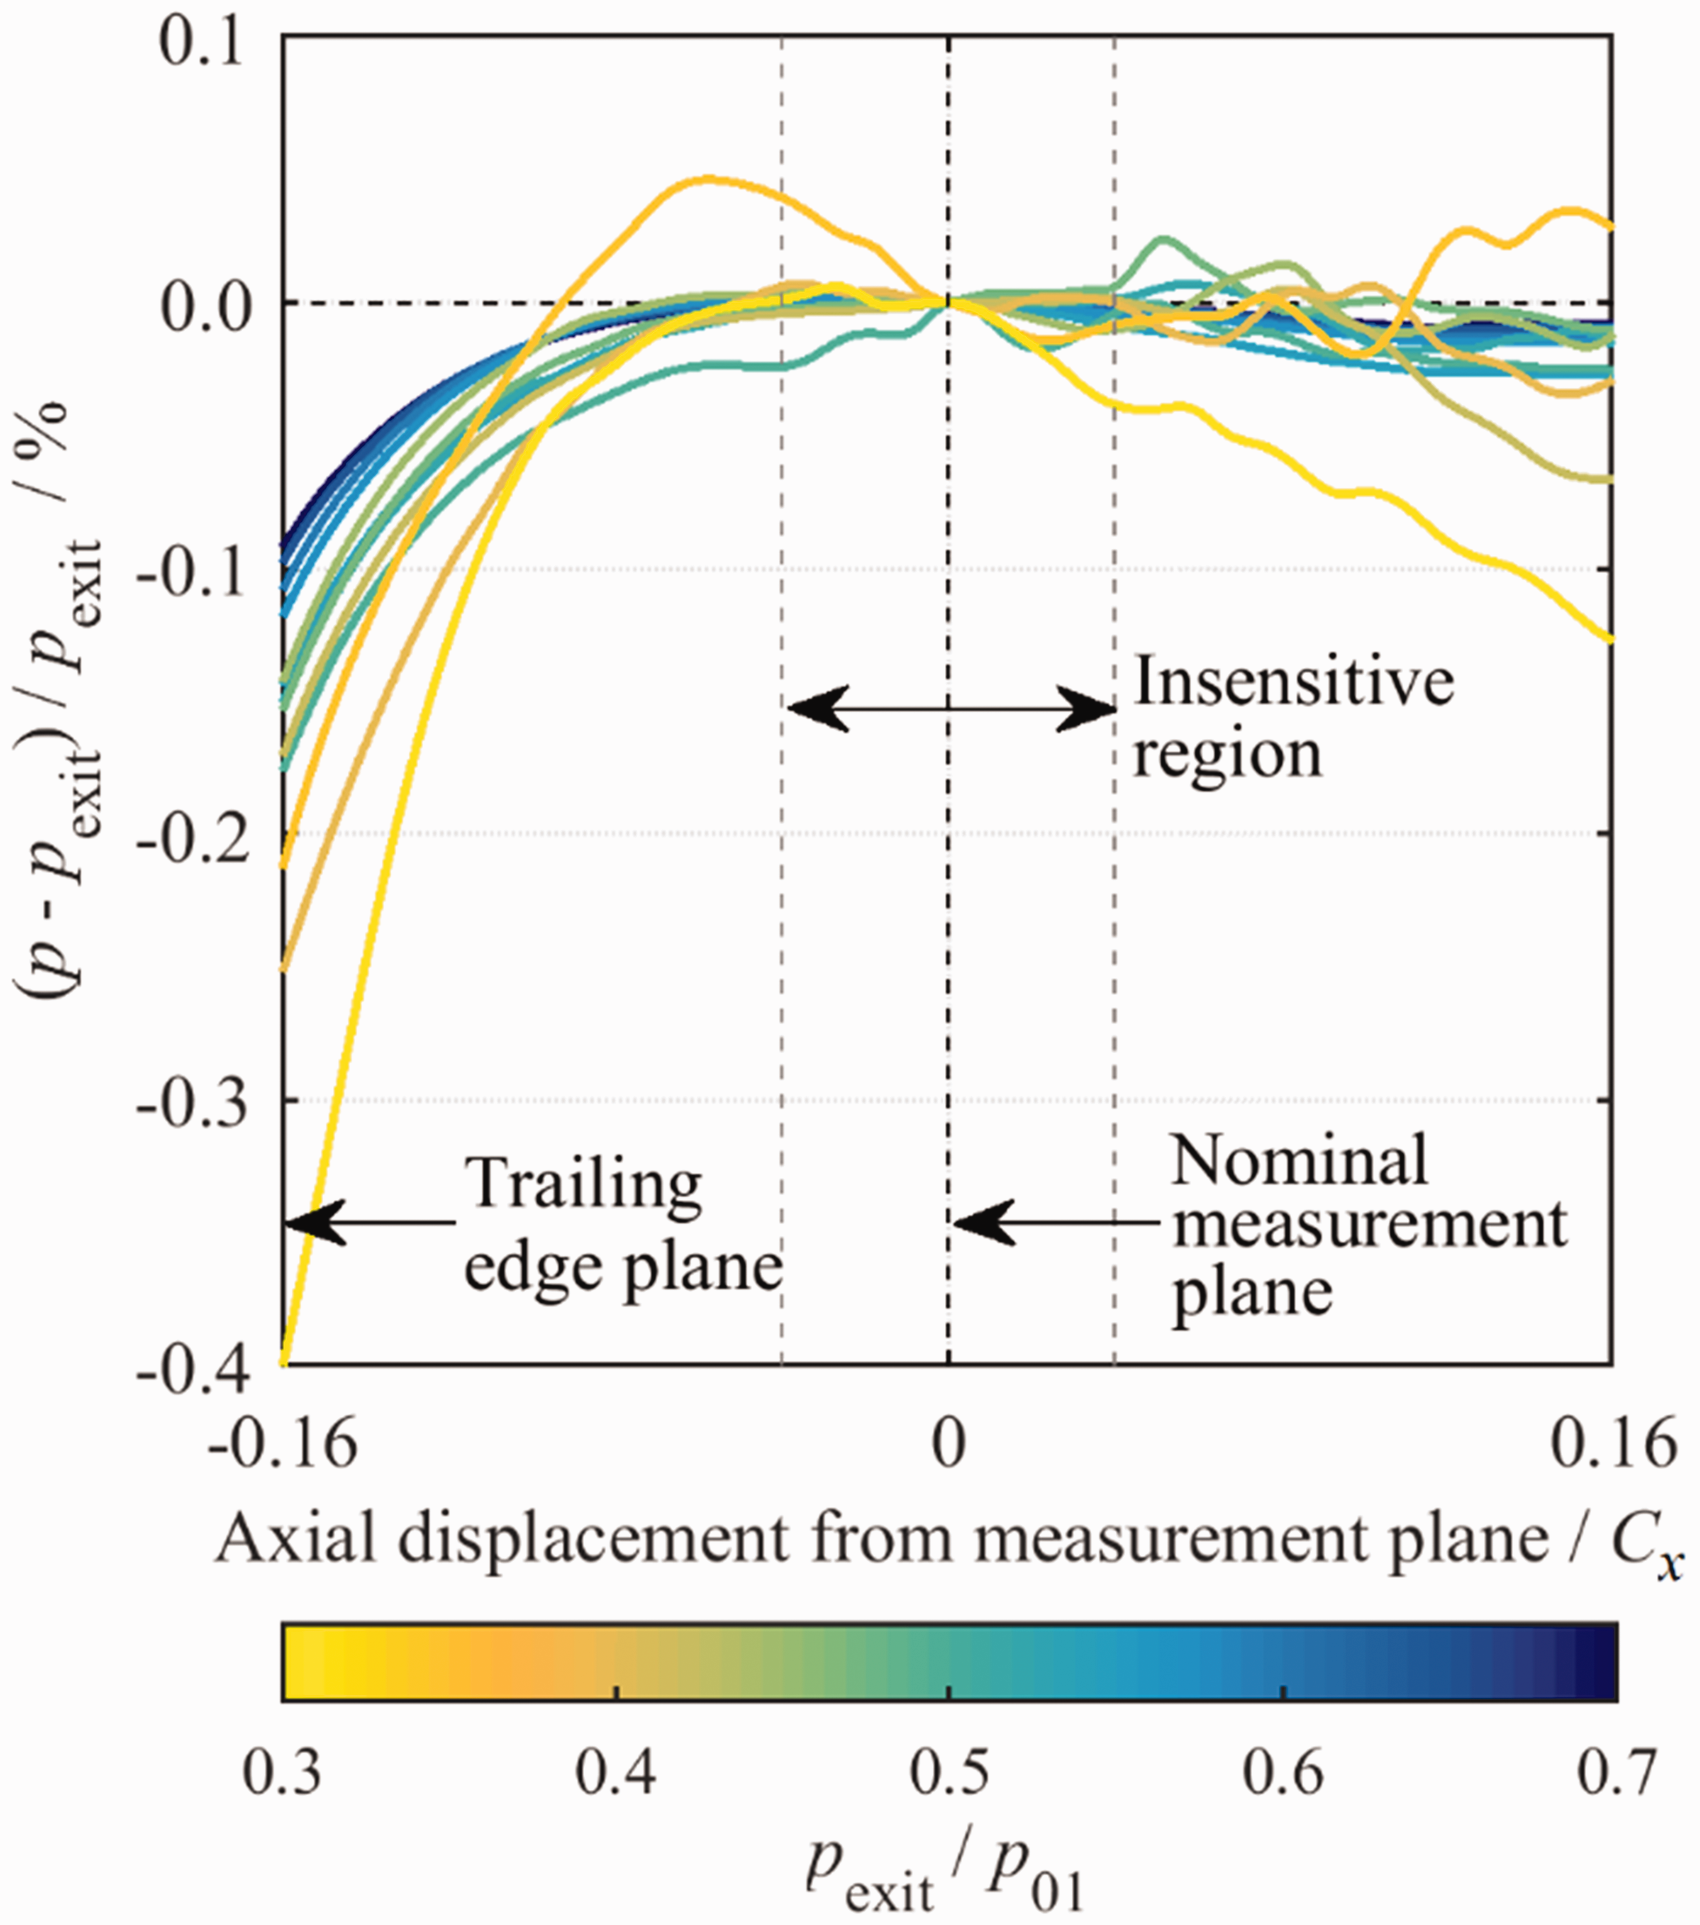
CFD-predicted circumferential static pressure profiles at vane exit (single axial position) for a range of operating pressure ratios. CFD-predicted variation in circumferentially averaged pressure ratio as a function of axial interrogation plane for a range of 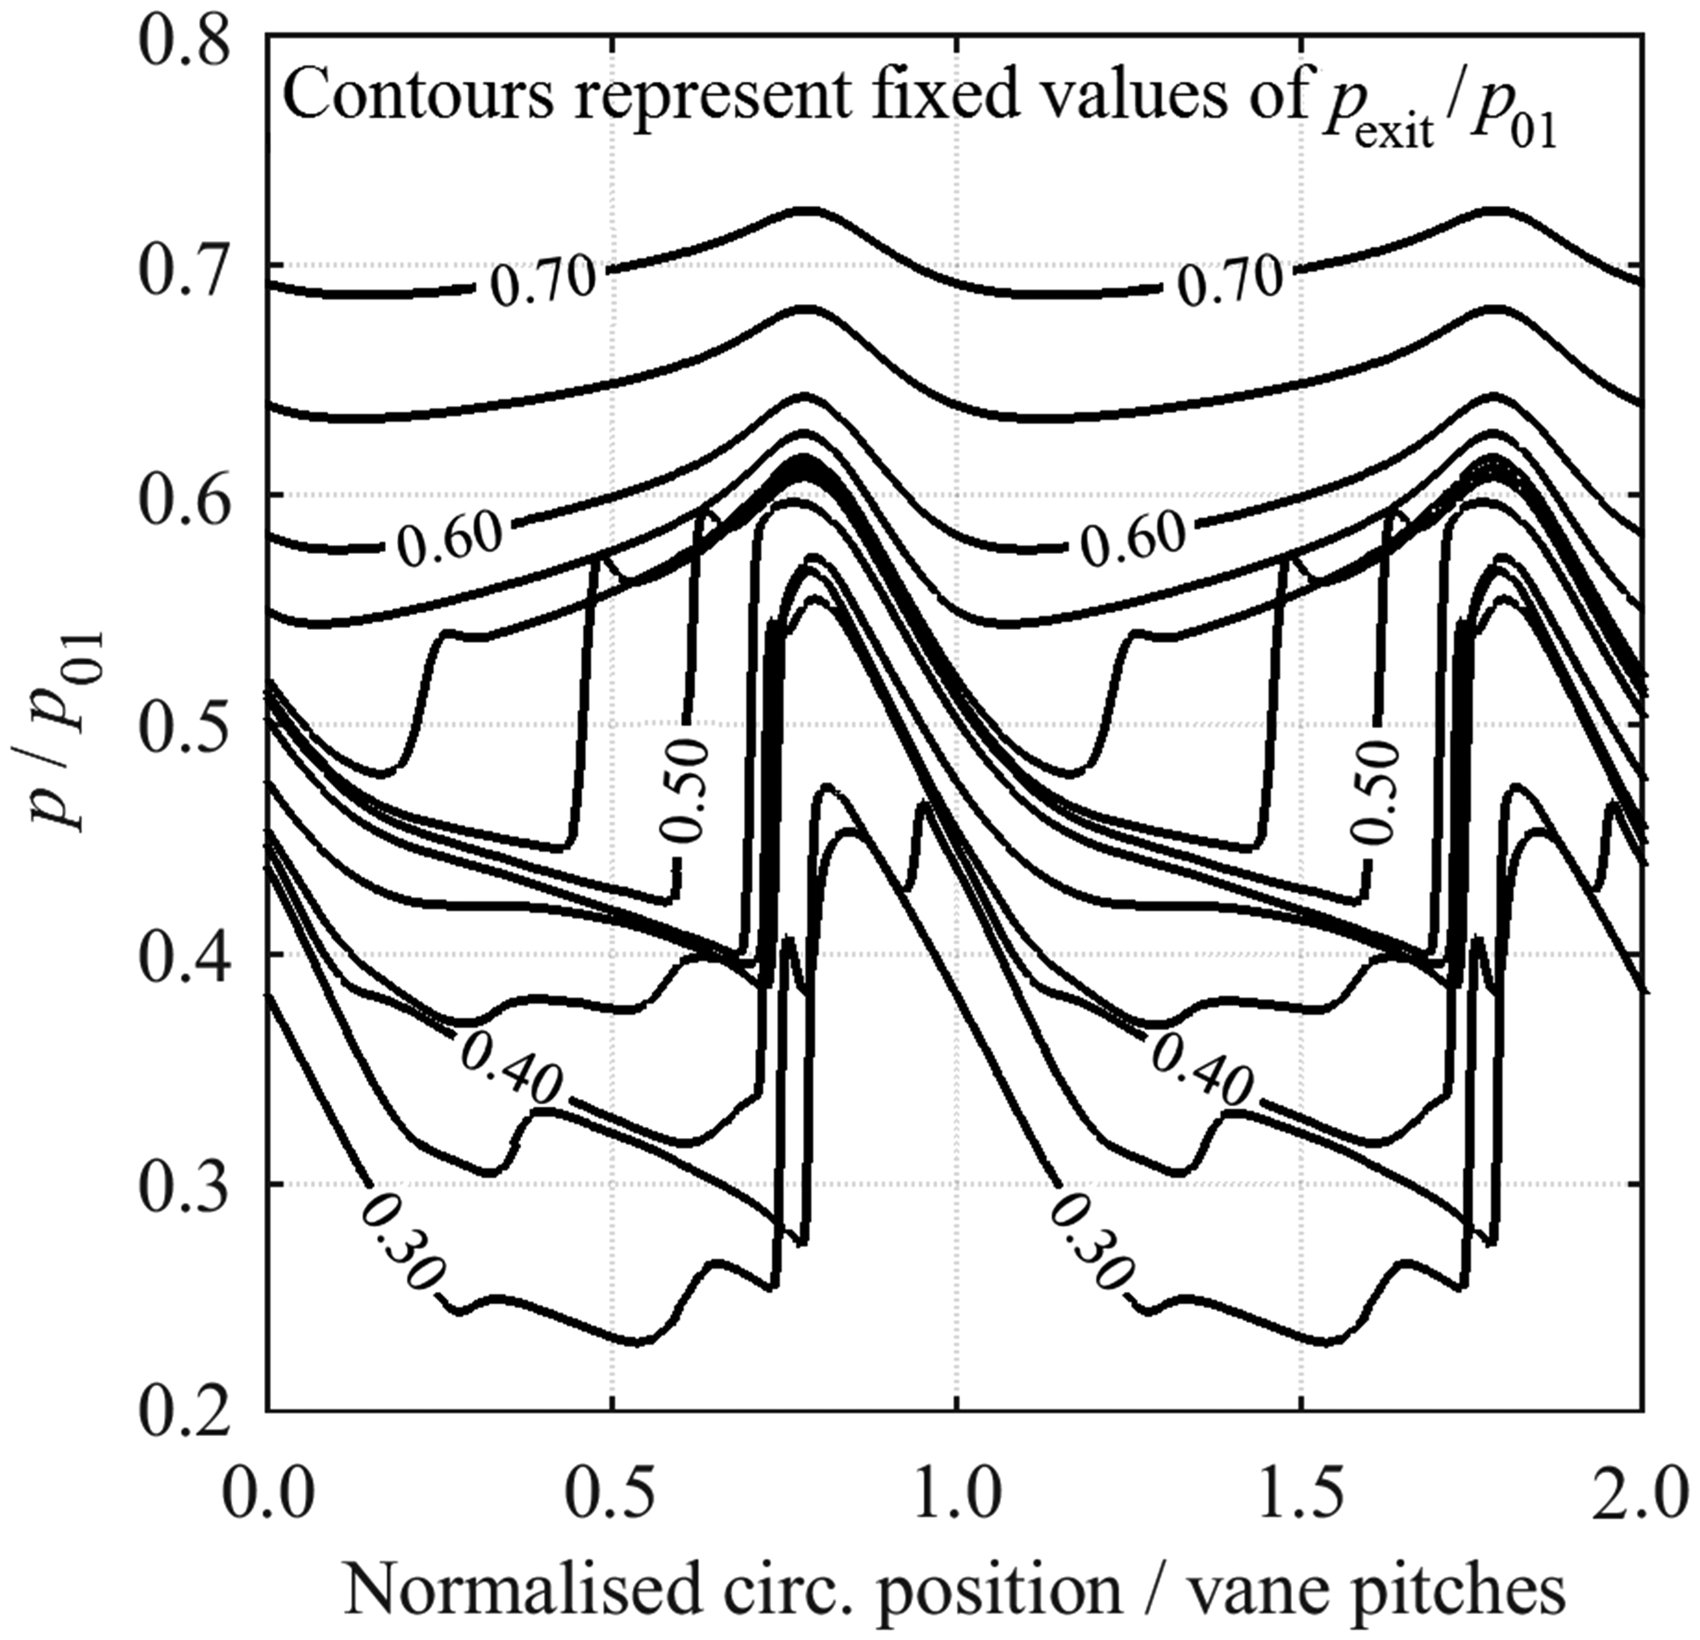
Circumferential static pressure distributions at vane exit are plotted in Figure 17 for 13 values of mean vane pressure ratio in the range 0.30 ≤
At each value of
With the exception of very low pressure ratios (pexit/p01 < 0.4), the axial gradient of average static pressure close to the measurement plane (|x/Cx| < 0.05) is extremely small (variation of less than 0.03%), showing very low sensitivity to small axial deviations in tapping location. Further downstream (x/Cx > 0.05), a complex shock system develops in the flow field, causing an increase in the sensitivity to the choice of axial measurement plane. This will be returned to in the context of defining an optimum distribution of tappings (axial and circumferential locations) for capacity measurement.
Before determining an optimum practicable distribution of pressure tappings, three principal sources of bias uncertainty affecting the evaluation of a robust mean vane exit static pressure are examined. These are:
Discrete sampling (limited number of tappings) of the time-varying, spatially non-uniform static pressure field at vane exit, which features complex flow features with high gradients. This is referred to as uncertainty due to tapping pattern. Uncertainty in the location of tappings, arising due to variation in the vane manufacture and/or inaccuracies in the positioning of the tappings. This is referred to as uncertainty due to variation in tapping location. Uncertainty in the measurement of static pressure at each tapping due to pressure transducer bias uncertainty. This is referred to as transducer measurement uncertainty.
Each of these sources of error is now dealt with in turn.
Uncertainty due to tapping pattern arises due to the sensitivity of the mean vane exit static pressure measurement to the tapping pattern. The error is defined as the difference between the arithmetic mean of the static pressure values at the finite set of tapping locations, and the underlying circumferential average pressure. Taking this definition, the uncertainty due to tapping pattern depends on both the number of measurement points, and on their circumferential locations relative to the underlying flow field. Certain measurement points will sit in particularly high pressure gradients in the flow—for example a tapping sitting in the path of a shock which moves across the tapping location with changing vane pressure ratio. Other tappings will be located in less sensitive regions of the flow, closer to mid-passage, for example, or in regions which (over a normal operating pressure range) remain on one side or another of a shock. By increasing the number of tappings, these sensitivities are averaged out.
Using the data of Figure 17, the uncertainty due to tapping pattern is estimated by considering the difference between the average pressure measured by a particular number of evenly spaced circumferential sample points and the underlying circumferentially averaged pressure. For a given number of tappings, the maximum difference is found by considering every possible circumferential positioning. This is referred to as the worst-case error. In Figure 19, the worst-case error, normalised by Normalised maximum difference between the underlying circumferentially-averaged pressure, and the average pressure as measured by a particular number of evenly spaced circumferential sample points. Each line represents a different number of sample points.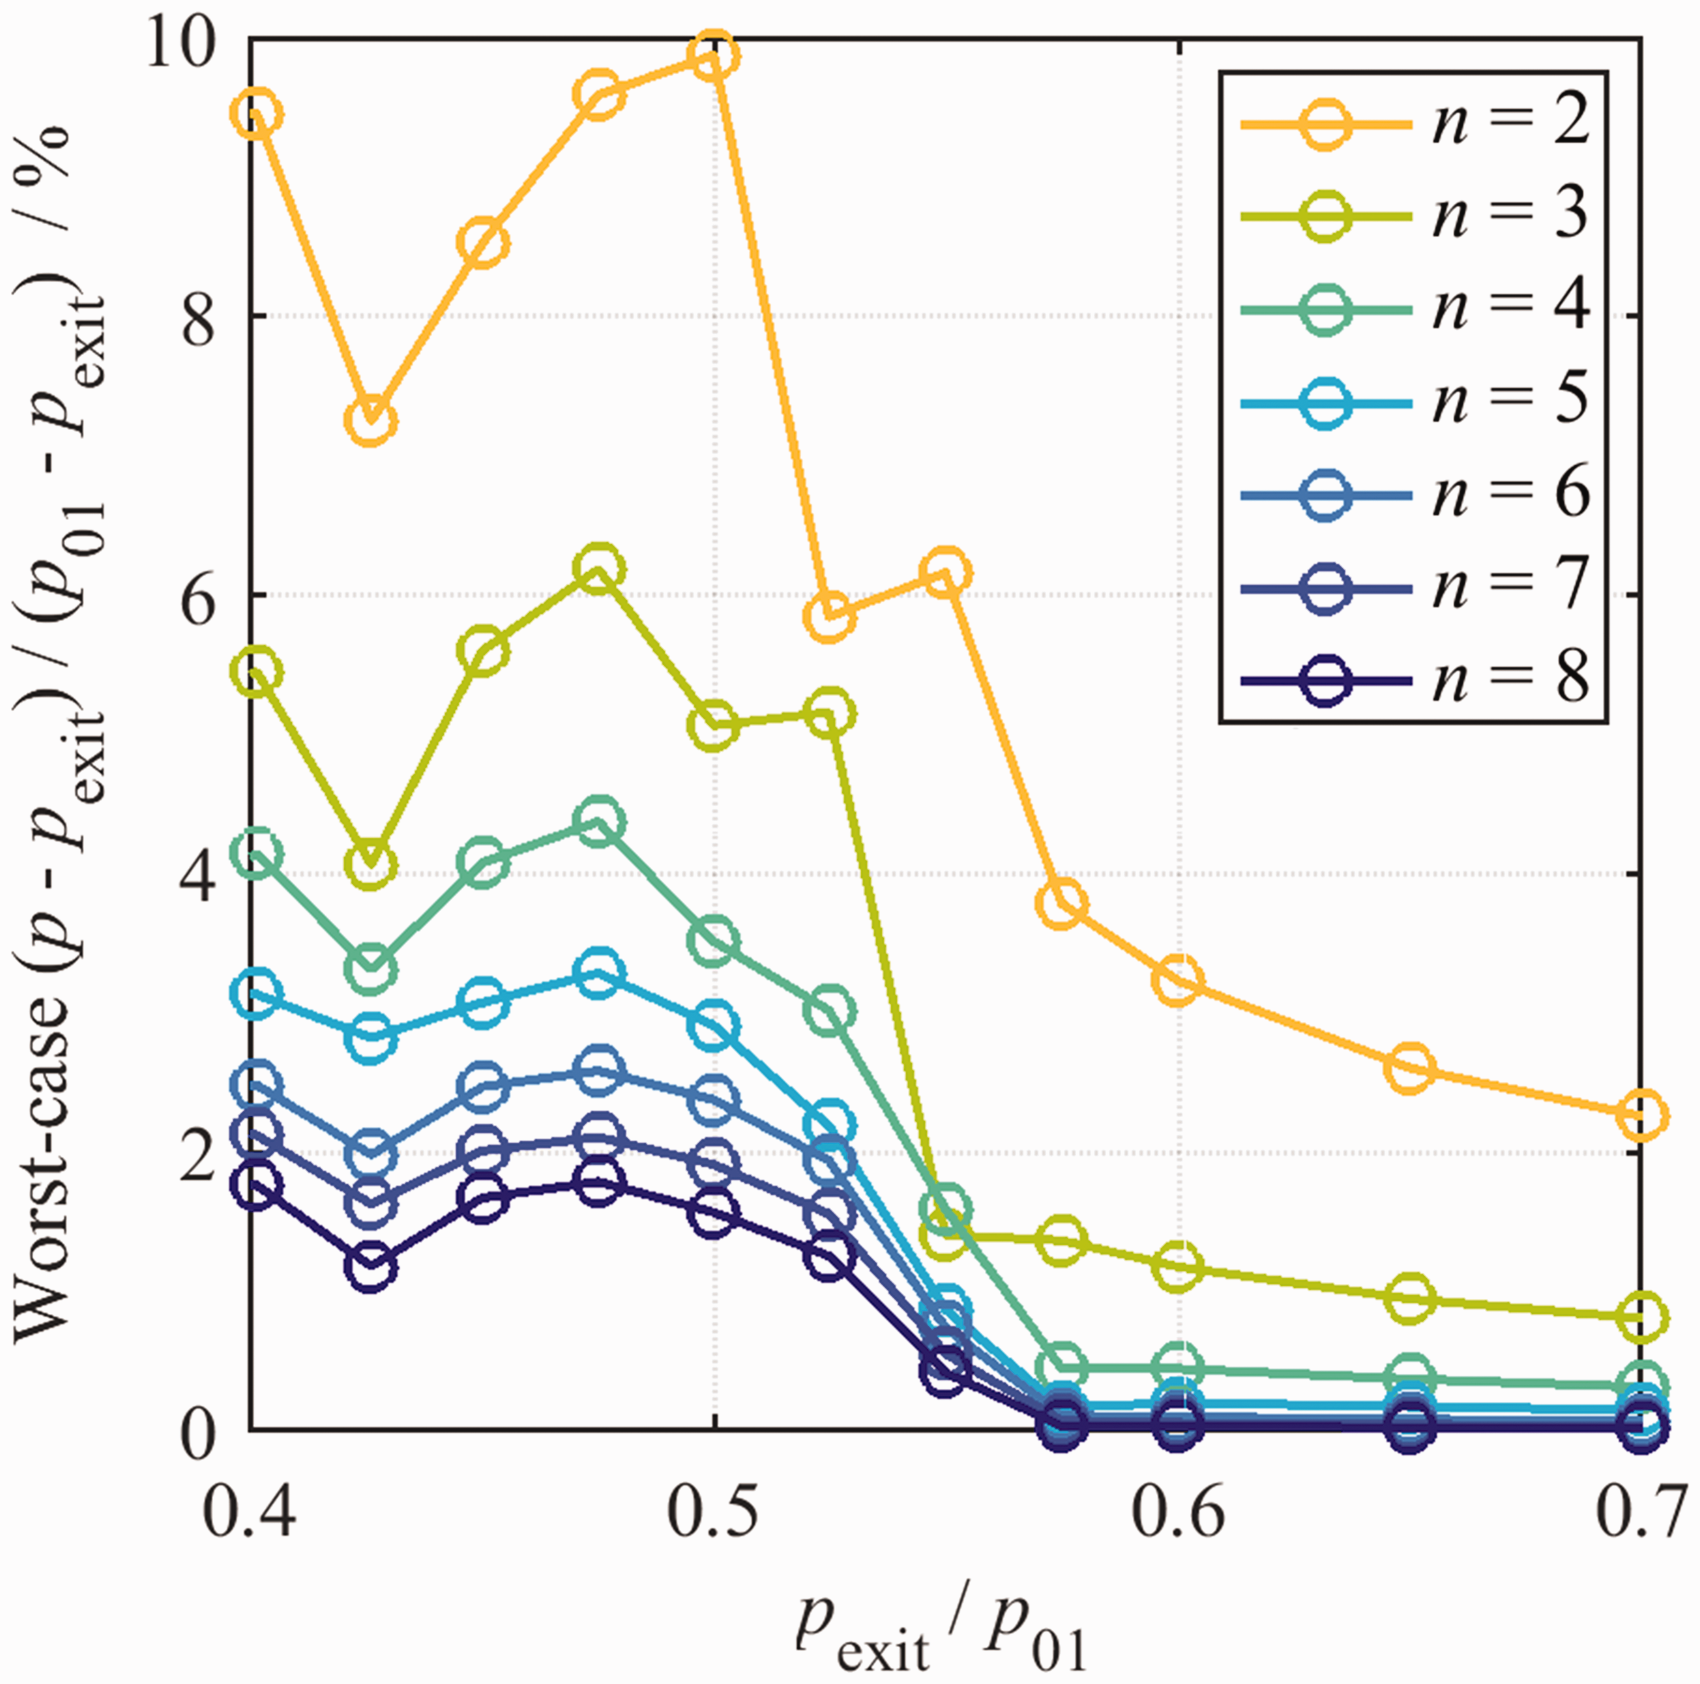
The worst-case error is approximately inversely proportional to the number of sample points. This result is expected as the average of an increasing number of discrete samples converges on the continuous average. The trend with decreasing pressure ratio (
Uncertainty due to tapping location variation arises due to the sensitivity of the mean vane exit static pressure measurement to deviations of individual static tappings from their intended locations on the vane platforms. To estimate the uncertainty arising from this effect, the location of each sample point in the CFD model is allowed to move both circumferentially and axially. The range of possible deviations was estimated very pessimistically to be ±1.5 mm in both directions. The position of a given tapping is then represented by a 2D normal distribution in space, with 95% of samples lying within ±1.5 mm of the nominal location. At each vane pressure ratio, the distribution of each pressure measurement corresponding to the 2D normal distribution for the tapping was then evaluated by interpolating the underlying predicted 2D flow field (visualised in 1D in Figures 17 and 18). Thus, a probability density function (PDF) is determined to describe the expected static pressure measured at a given tapping. These functions vary greatly from tapping to tapping, in some cases being similar to skewed normal distributions, and in others being bimodal (in the vicinity of a shock, for example). Uncertainty bounds on the value at each tapping are determined to the 95% credible interval (the interval within which 95% of samples are expected to fall, given that the true, underlying PDF is known) at each value of
For each particular tapping distribution (particular number of tappings and circumferential positioning), the PDF and associated credible interval for the pitchwise-average static pressure are calculated by considering the PDF and associated credible interval for each individual tapping location. In each case, the maximum credible interval is taken from all possible circumferential locations of the sample points (similar analysis to that used to evaluate the pattern location uncertainty). The size of the credible interval for
The worst-case (across all possible circumferential positions of a given number of samples) credible interval for the inferred value of Normalised credible interval for average pressure measured by a particular number of—nominally—evenly spaced circumferential sample points subject to random spatial variation of ±1.5 mm both axially and circumferentially. Results are for a single instrumented platform. Each line represents a different number of samples.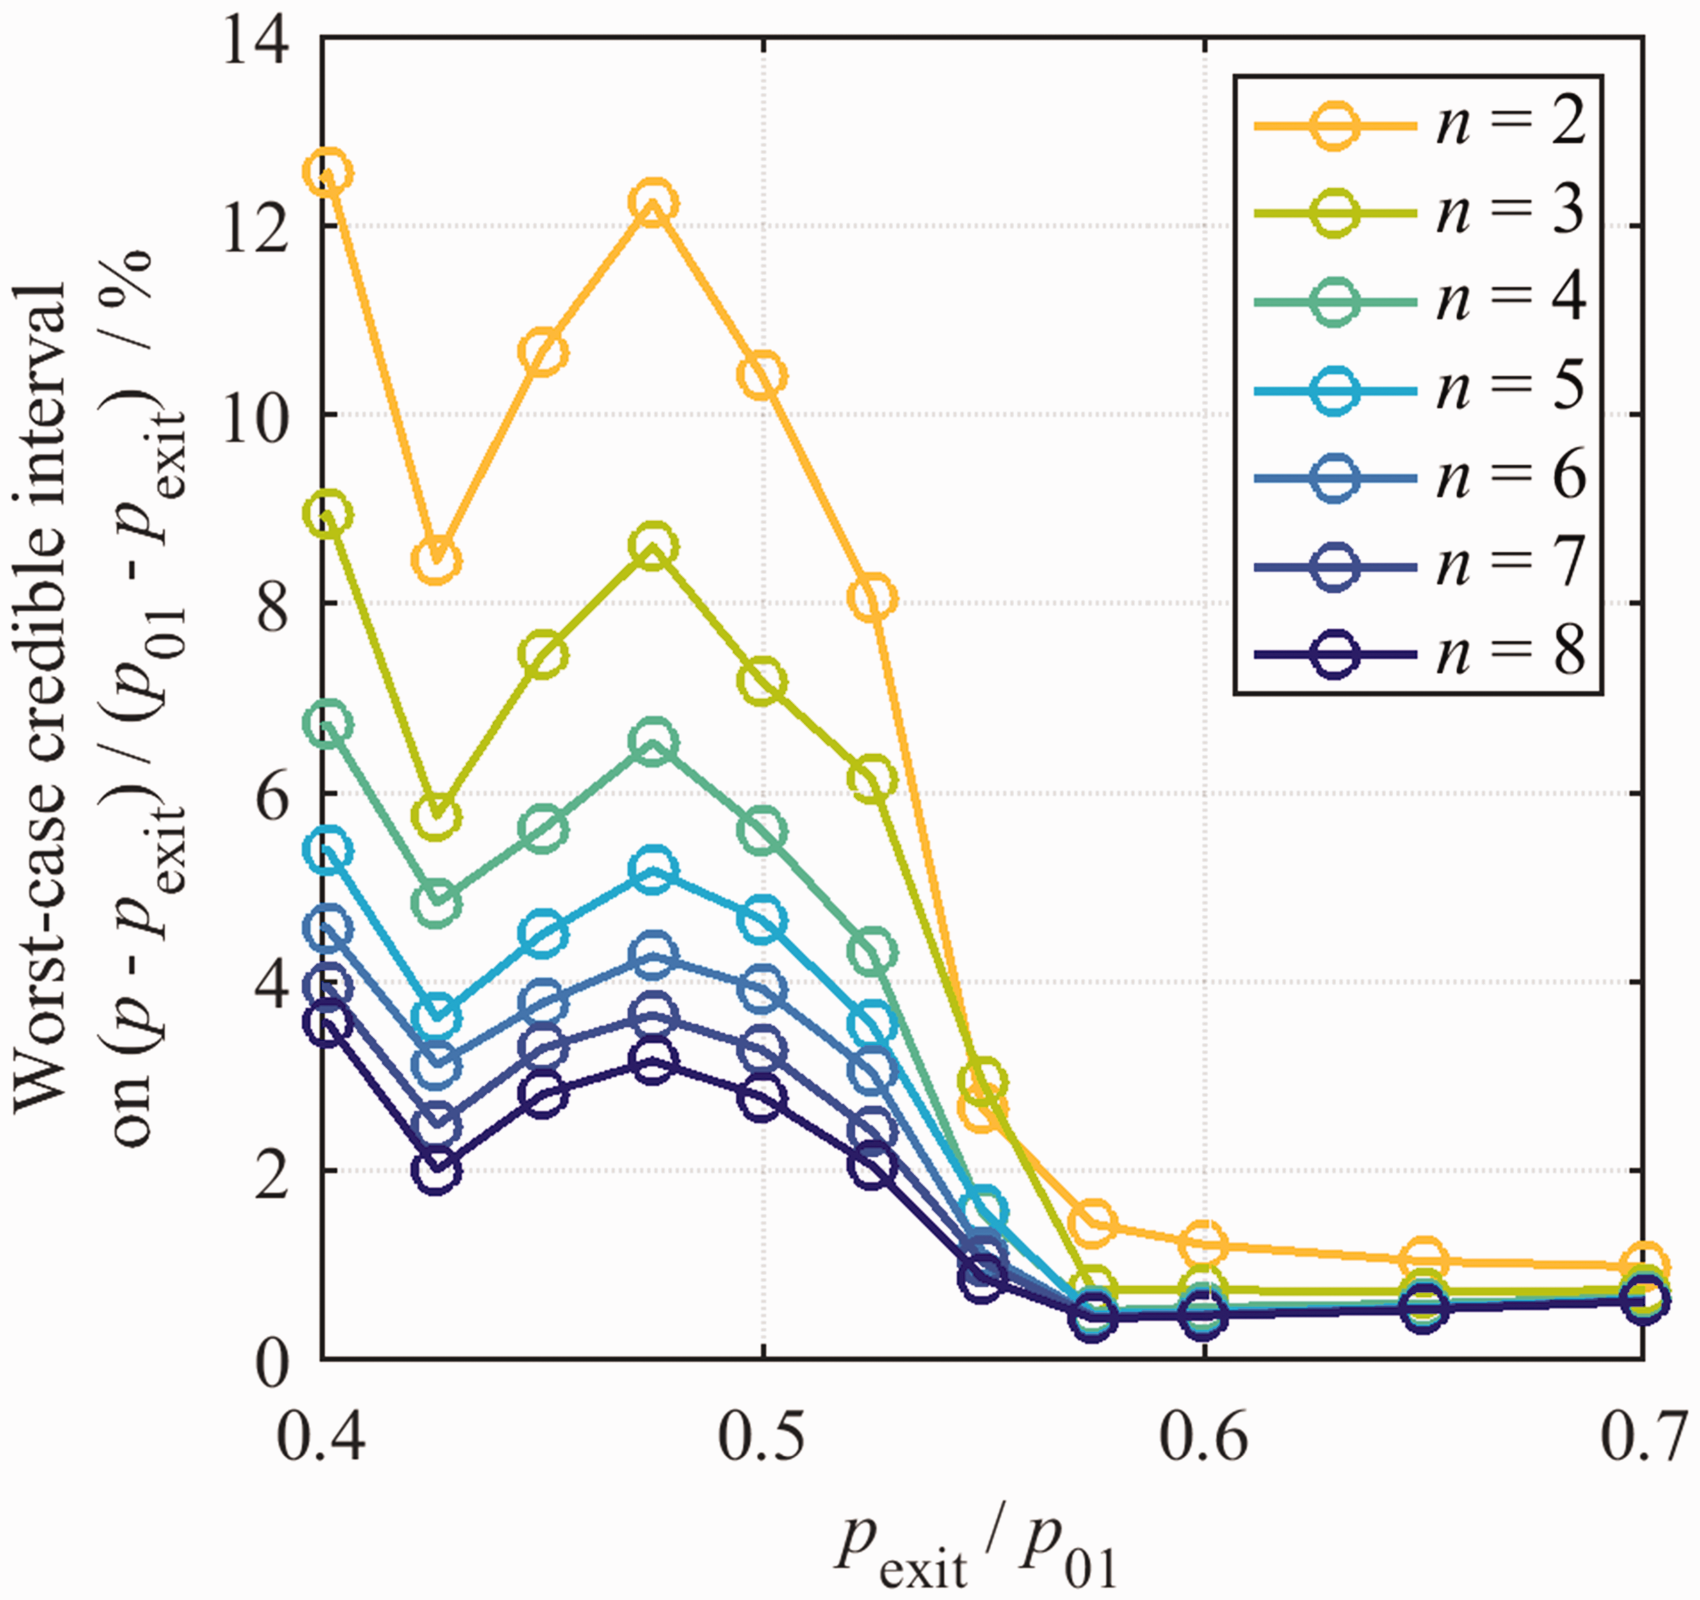
A typical experimental campaign has eight tappings per vane pitch (see Figure 7). From Figure 20, at a nominal vane pressure ratio of
Finally, the contribution to the bias uncertainty in
The overall bias uncertainty in the vane exit static pressure measurement is determined by combining the uncertainties arising from each of the three sources of uncertainty. The overall bias uncertainty is plotted as a function of Bias uncertainty in 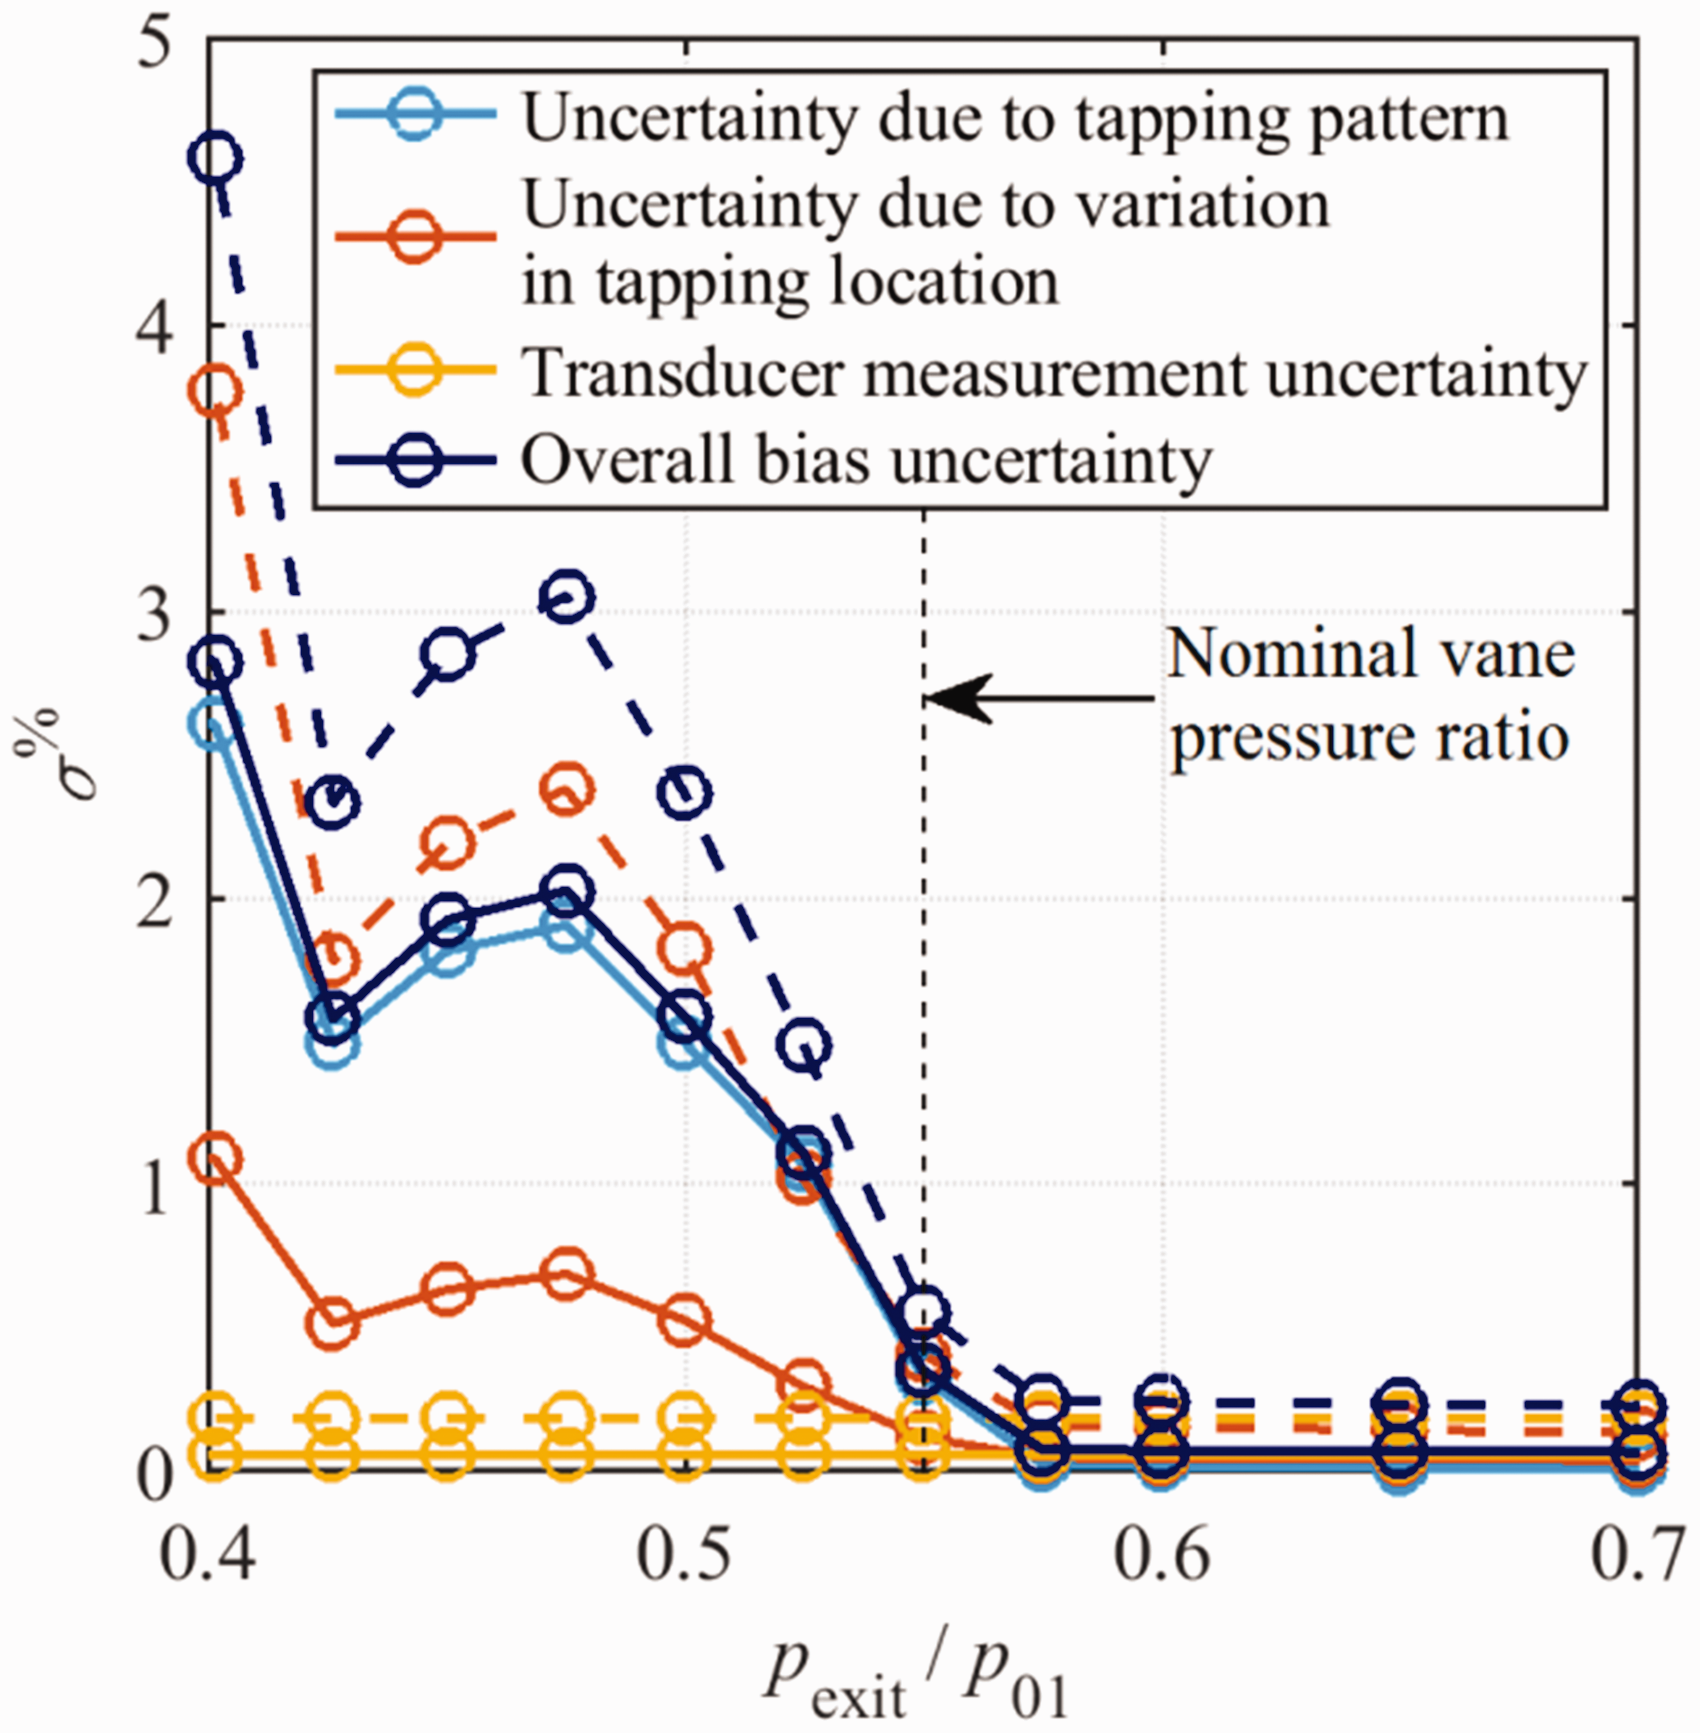
At the nominal pressure ratio (
The bias uncertainty in 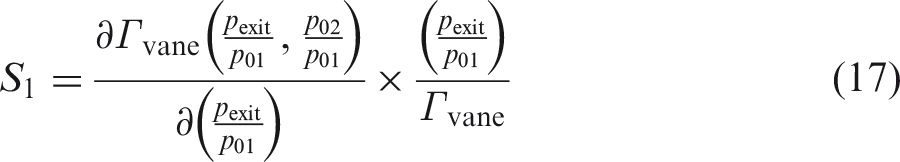
Contours of S1, along with a second sensitivity coefficient, S2, which describes the sensitivity of capacity to Contours of the sensitivity coefficients S1 (defined in equation (17)) and S2 (defined in equation (20)) as functions of 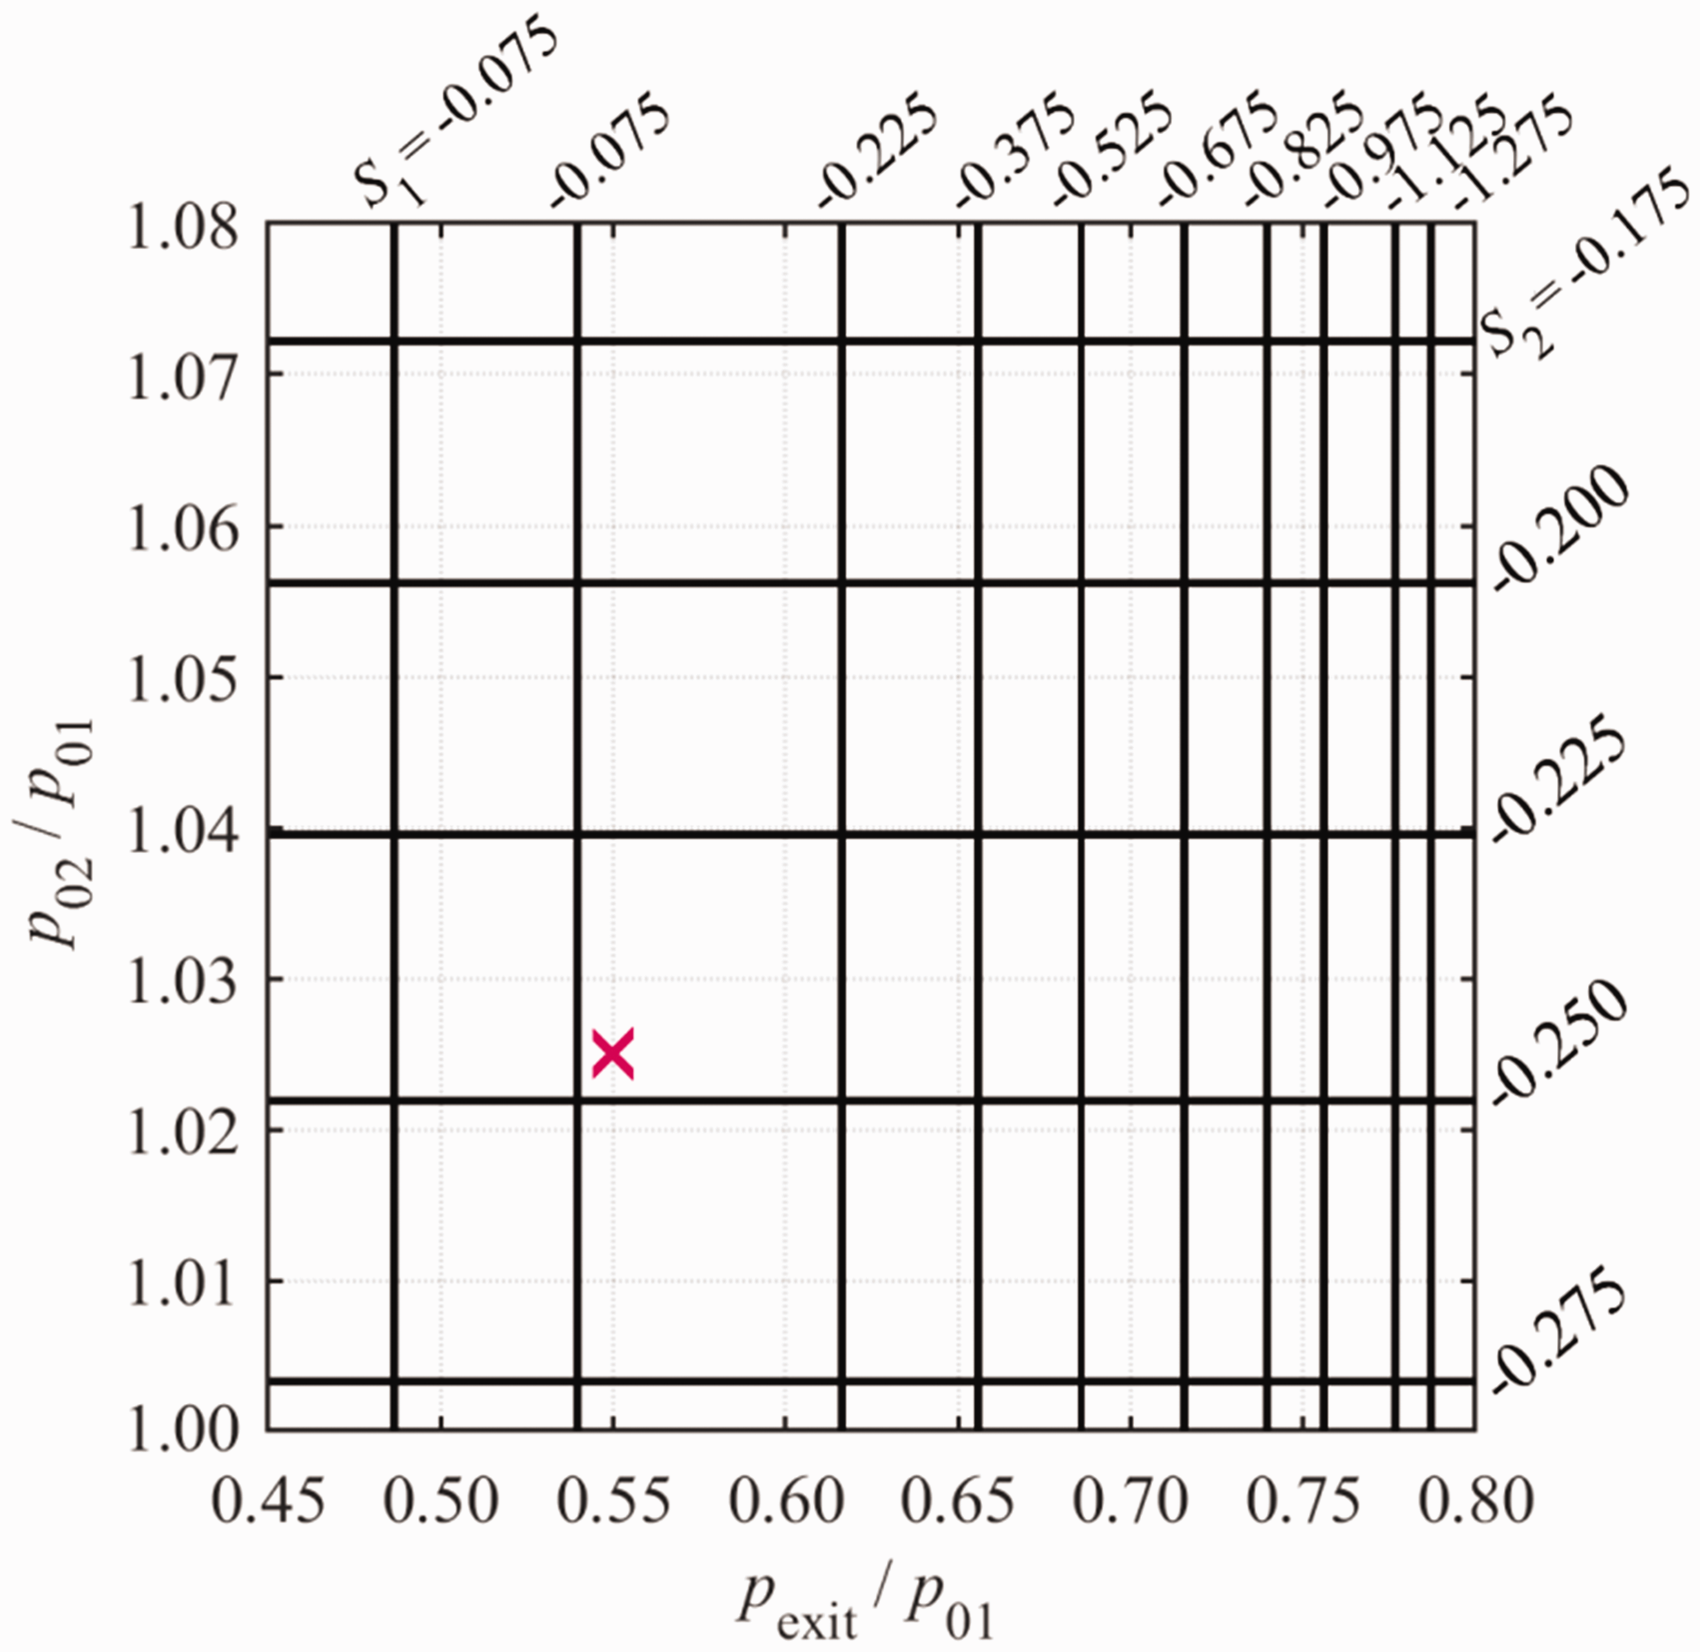
At the operating point, S1 takes a value of approximately −0.092. This shows that the uncertainty in vane capacity is an order of magnitude lower than the uncertainty in 
That is, the additional impact of uncertainty in exit static pressure and vane pressure ratio increases the overall bias uncertainty in vane capacity from ±0.494% to ±0.495%.
(ix) Bias uncertainty in capacity due to uncertainty in coolant-to-mainstream pressure ratio
The additional uncertainty in capacity due to uncertainty in coolant-to-mainstream pressure ratio,
The bias uncertainties in mainstream and coolant inlet total pressures have been calculated as ±0.044% and ±0.046%, respectively. These quantities share a large common element, as the coolant pressure is measured as a differential relative to the mainstream—that is, 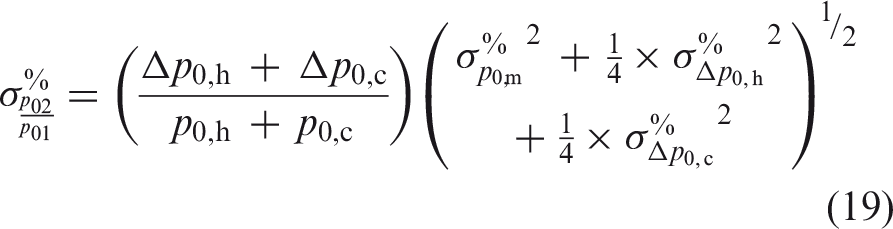
Substituting in values gives
In the same manner as the prior analysis, the bias uncertainty in 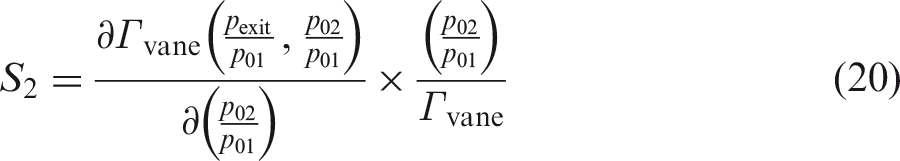
This sensitivity coefficient is plotted in Figure 22. At the operating point, the value of S2 is approximately −0.246. That is, the uncertainty in vane capacity is reduced by a factor of around four relative to the uncertainty in
To calculate the impact on overall uncertainty in vane capacity, this is combined with the uncertainty arising from steps (i) to (viii)—above—to obtain
Summary of uncertainties and comparison to original and proposed upgraded facilities
The bias uncertainties in mass flow rate and capacity measurements are now summarised and compared with the results both from the original facility (Povey et al. 6 ), and a proposed upgraded facility.
Comparison of bias uncertainties in mass flow rate and capacity measurements between: the original facility, 1 the current facility, and a proposed upgraded facility.
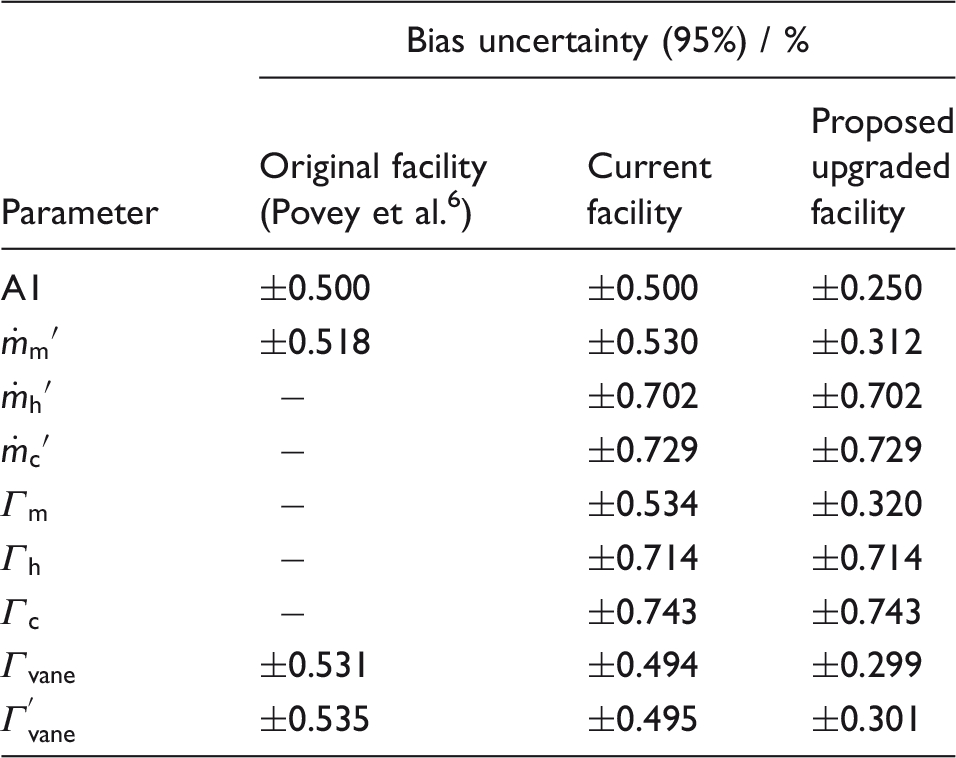
The remaining rows of the table present the bias uncertainty in the mass flow rate measurements and capacity measurements of the three individual streams (mainstream, hub and case), and the bias uncertainty in the overall capacity measurement. The last is presented both excluding and including the errors associated with uncertainty in
Comparison of overall uncertainties in capacity measurements between: the original facility, 6 the current facility, and a proposed upgraded facility.
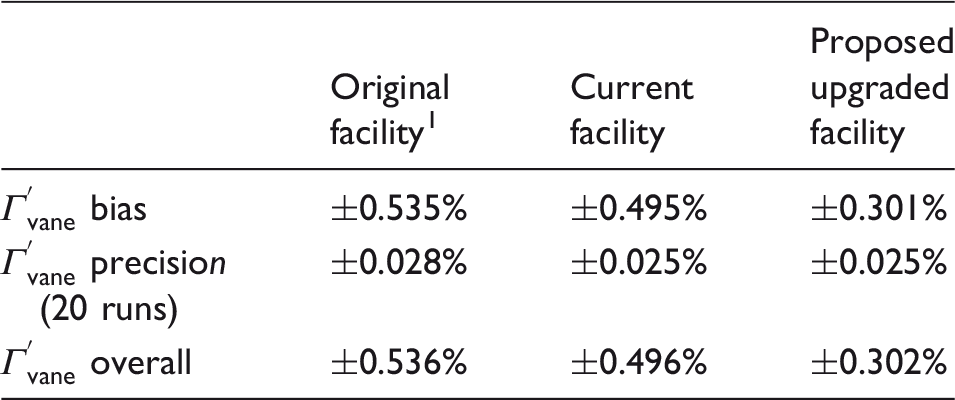
Figure 23 provides visualisation of the propagation of bias uncertainty through the measurement and analysis chain, following the nine stages of analysis, i–ix, previously described. The original facility (described in detail by Povey et al.
6
) is shown by a blue line. The final bias uncertainty in capacity for this facility is ±0.536%.
Visualisation of the propagation of bias uncertainty through to the final capacity measurement, for each of the three considered facilities.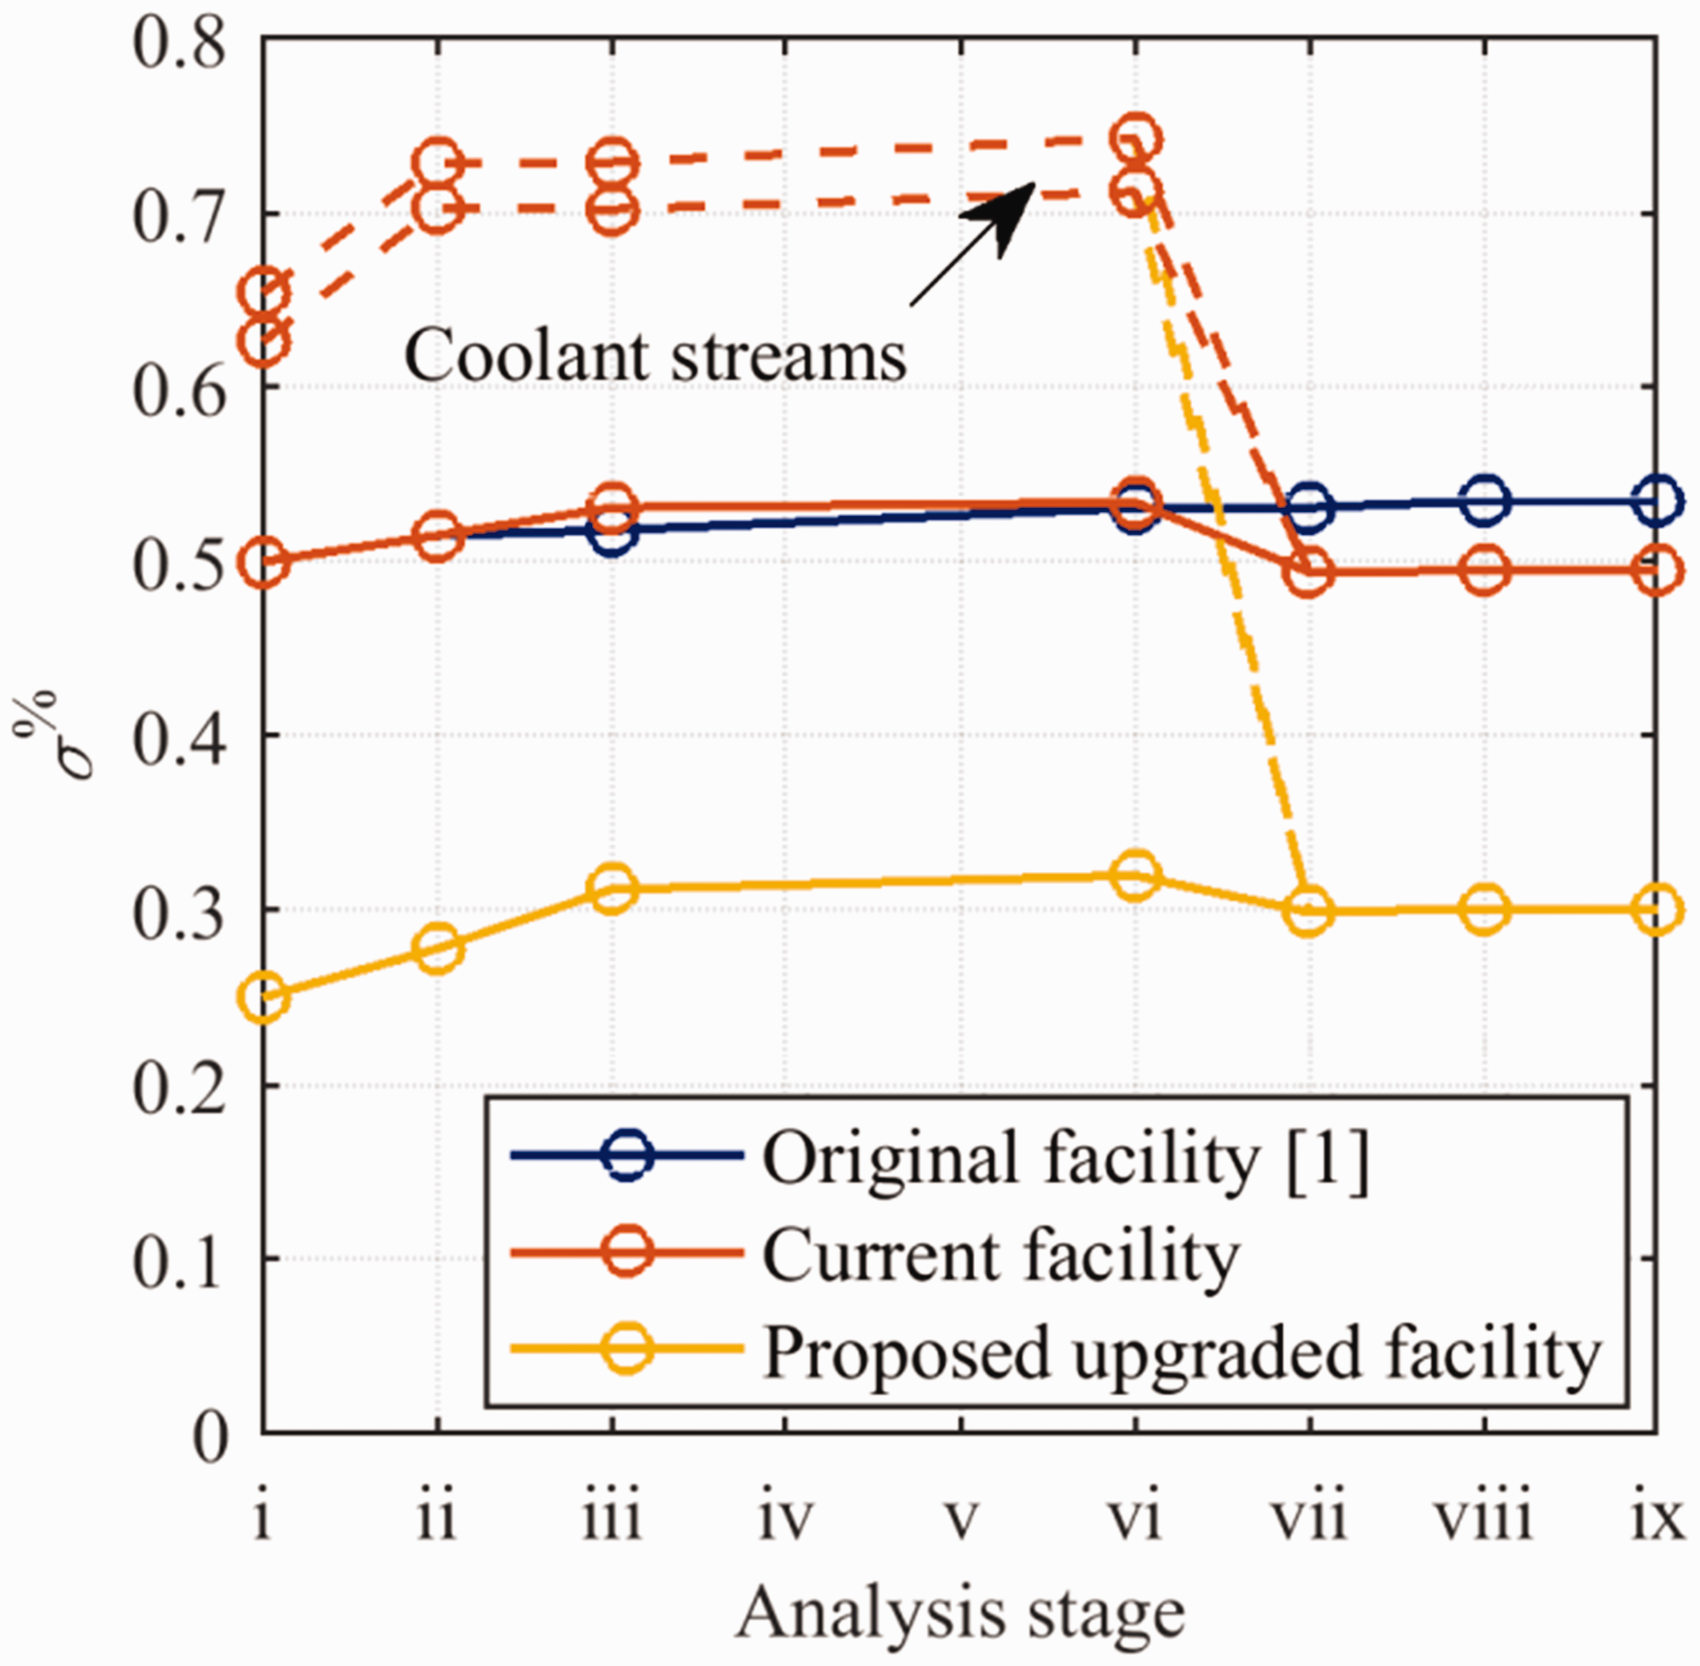
The current facility is represented by red lines, with dotted lines indicating the coolant streams, and the solid line indicating the mainstream. The lines combine when the overall vane capacity is calculated (analysis stage vii.). The final bias uncertainty in capacity for this facility is ±0.495%. The primary improvements over the original facility come in steps vii and viii, leading to an improvement of ±0.040% in the final bias uncertainty in capacity. The yellow lines represent a proposed upgraded facility, differing from the current one only in that the calibration of the primary mass flow metering nozzle will be improved from ±0.500% bias uncertainty to ±0.250%. This results in a final bias uncertainty of ±0.301%.
The following conclusions regarding the uncertainty analysis are drawn:
In the original facility, the entire measurement and analysis chain led to an overall uncertainty in capacity of ±0.536%, only ±0.036% greater than the ±0.500% bias uncertainty inherited from the primary nozzle. This was achieved by careful experimental design in terms of hardware, instrumentation and experimental technique. Note that these values differ slightly from Povey et al.
6
as the bias uncertainty due to error in vane exit static pressure measurement is more comprehensively considered. In the current facility, a combination of small improvements in the measurement of inlet and exit flow conditions, and small refinements to the experimental technique have led to an overall uncertainty in capacity of ±0.496%, or ±0.004% lower than the ±0.500% bias uncertainty of the primary (mainstream) nozzle. This is possible because mainstream and coolant streams are independently metered. Figure 23 shows that the reduction in overall uncertainty relative to the original facility has two significant drivers: the independent measurement of coolant streams (approximately 8% of total flow), which has the curious effect of driving down the overall uncertainty (see Appendix 1); and a reduced uncertainty in A proposed upgraded facility has been analysed which differs from the current facility only in the implementation of an improved calibration for the primary nozzle. This will reduce the inherited bias uncertainty from ±0.500% to ±0.250%. The overall uncertainty in capacity for this proposed upgraded facility will be ±0.302%, or ±0.052% greater than the bias uncertainty inherited from the primary nozzle. With a reduction in baseline uncertainty, the relative impact of the measurement and analysis chain (as described in stages ii–ix) will naturally be more significant. In particular, the measurement of flow conditions upstream of the primary nozzle (stage ii) and the application of the unsteady mass flow correction (stage iii) become significant contributors to overall uncertainty. It is felt that this facility would represent as optimal a system as practicable within realistic constraints.
Conclusions
In this paper, the current state-of-the-art in ultra-low uncertainty semi-transient techniques for experimental capacity measurement in gas turbines has been reviewed. A number of improvements to the technique, relative to previously published work, have been discussed. These improvements include: modularisation of the working section of such facilities to allow for rapid interchange of test vane modules; a move to independent metering of mainstream and coolant mass flow rates; and optimisation of instrumentation to minimise the measurement error in vane inlet and exit flow conditions.
A detailed uncertainty analysis has been presented which references the facility in which the technique was originally developed, the current facility, and a proposed future facility in which the uncertainty in capacity has been driven down to a practical limit using state-of-the-art nozzle calibration technology. The bias errors in vane capacity achieved by each of these three facilities are determined to be ±0.535%, ±0.495% and ±0.301%, respectively (to 95% confidence). The corresponding precision uncertainties are ±0.028%, ±0.025% and ±0.025%, respectively. The reduction in bias uncertainty between the original and current facilities was therefore ±0.040%. This is a small improvement but important in the context of the engine design and optimisation process. The combination of the extremely low precision uncertainty offered by the technique and the capability for rapid interchanging of test modules allows very small changes in capacity to be resolved. This facilitates studies of capacity sensitivity to secondary influences with much greater flexibility than was previously possible. In particular, studies of the effect of trailing edge coolant ejection, platform leakage flows, vane surface deterioration, and inlet flow disturbances (lean-burn combustor profiles) are topics of current interest.
The definition of vane capacity in systems with several streams at different inlet conditions of total pressure and temperature has been discussed. It is shown that whilst it is helpful for coolant stream mass flow rates and temperatures to be included in the capacity definition, the difference arising from the exact way in which this is achieved is minor. Whilst several definitions are similarly useful in terms of their robustness to changes in the inlet conditions of individual streams, it is felt that the favoured definition offers the possibility—in the correct experiment—to isolate sensitivities to key effects such as trailing edge coolant ejection. This is achieved by explicitly expressing vane capacity as a function of the two key controlling pressure ratios. It is argued that this definition may be of more practical use when comparing results from different sources.
It is hoped that this paper will serve as a reference point for the current state-of-the-art in experimental gas turbine flow capacity measurement, and also as a manual for best practice in the development and analysis of experiments in this area.
Footnotes
Acknowledgment
The support of Rolls-Royce plc is gratefully acknowledged.
Declaration of Conflicting Interests
The author(s) declared no potential conflicts of interest with respect to the research, authorship, and/or publication of this article.
Funding
The author(s) received no financial support for the research, authorship, and/or publication of this article.