
Abstract
Several studies have documented extensive low-density urban expansion of cities in sub-Saharan Africa, exacerbating issues of inadequate infrastructure, limited mobility and human impact on the environment. However, the relation between socioeconomic factors and urban expansion trends in sub-Saharan Africa remains understudied. This study investigates the links between household socioeconomic status and urban form of informal settlements based on case studies in Maputo, Mozambique. The findings of the study underscore that (1) built densification occurs over time, reflecting an incremental house expansion process enabled by household economic resources; (2) households with higher socioeconomic status consume comparatively more land, contributing to urban expansion; (3) households in more recently established settlements within the city limits have higher socioeconomic status than households in older settlements located in comparable proximity to the city centre; and (4) rental housing is more widespread in the centrally located settlements and accommodates younger residents with lower socioeconomic status.
I. Introduction
Informal settlements are populated areas that operate and develop with limited state control, typified by contested rights to the land and limited enforcement of building and planning regulations.(1) Most of the contemporary extensive urban population growth in sub-Saharan Africa is accommodated through proliferation of informal settlements due to limited state capacity to administer the rapid urbanization.(2) Urban land cover in sub-Saharan Africa is expanding at the fastest rate globally and is projected to increase as much as twelvefold between 2000 and 2050.(3) Recent studies document rapid urban expansion through low-density informal developments which will likely exacerbate issues of compromised mobility and inadequate infrastructure provision in urban areas across the African continent.(4) While recent research has documented an interrelation between socioeconomic factors and urban expansion,(5) limited studies have investigated the relationship between socioeconomic factors and contemporary urban expansion trends in the context of sub-Saharan Africa. In order to address this knowledge gap, this paper investigates the relation between the socioeconomic status (SES) of residents of informal settlements in Maputo, Mozambique and indicators of urban form. On this basis, the paper addresses the following research question: how is the SES of residents of informal settlements linked to land consumption and home expansion?
The study presented here analyses urban form and household socioeconomic variables of four informal settlements in Maputo, Mozambique. The analysis relies on detailed geospatial surveys; household surveys on indicators of SES; correlation analysis of the household survey responses; and analysis of different urban form indicators derived from the field surveys, such as built-up density, public space ratio and urban tree canopy cover. The study provides insight into the incremental growth patterns of informal settlements, highlighting that homeowners expand their dwellings according to the economic resources available over time. This is underpinned by data showing a correlation between dwelling size and the timespan of residency as well as between indicators of higher SES and larger dwelling size. The study suggests that households with higher SES consume more space and thereby contribute to low-density urban expansion trends. This is supported by data showing that the studied settlement with the highest average SES was characterized by a large average dwelling size and low level of built-up density, indicative of a low level of dwelling density. The study also suggests that households in more recently established settlements within the city limits may have higher SES compared to households in older settlements which have comparable centrality. The data show that the most recently established settlement was characterized by the highest SES. This is indicative of increasing property prices restricting access to the land market within the city limits for residents with lower SES. Finally, the study suggests that rental housing is more widespread in the centrally located settlements and generally accommodates younger residents with lower SES. This is underpinned by data showing a higher proportion of tenants in older and more centrally located settlements as well as a correlation between tenants and indicators of low SES and younger age. This suggests that recent migrants with lower SES likely settle largely in peripheral areas outside the city limits or rent accommodation in central areas.
II. Informal Urban Expansion Dynamics In Sub-Saharan Africa
Glaeser(6) argues that density is the defining property of cities and that urban form is in part shaped by transportation systems because proximity and the consequently reduced transportation costs for people, goods and ideas is the primary reason people settle in cities. Urban density has been an important topic for scholarly discussions on urban development due to the intricate relationships between urban density and environmental sustainability, economic development and human livelihoods. Urban areas in sub-Saharan Africa are expanding at a pace far exceeding population growth, leading to declining population densities of urban areas.(7) This trend will likely exacerbate issues with inadequate infrastructure provision and compromised mobility in urban areas. However, the socioeconomic drivers of urban expansion in African cities remain understudied, compromising the capacity to address issues associated with the current urban expansion trends in the region.
Visagie and Turok(8) provide an overview of urban density discussions in relation to the contemporary proliferation of informal settlements in sub-Saharan Africa. Peripheral low-density development can lead to compromised mobility due to inadequate road provision, traffic congestion, insufficient public transport systems and vast distances within the expanding cities in sub-Saharan Africa.(9) Low-density urban expansion can also increase the necessary investments in infrastructure, which must cover greater distances between residential units, while curbing the impact of such investments. Accordingly, it may compromise access to infrastructure and economic development, particularly in the context of sub-Saharan Africa, where investment capacity is limited. Higher dwelling densities, by contrast, can contribute to decreased infrastructure costs per residential unit due to shorter distances between dwellings.(10) Similarly, higher residential densities can enhance the effects of investment in infrastructure, as they enable a larger population to benefit from the investments. It is also true, however, that unregulated densification of the urban fabric can lead to unsanitary public spaces with adverse effects on public health in centrally located dense informal neighbourhoods where there is limited space for drainage. Sewage systems are rare in informal settlements and most household sanitation systems thus use latrines or septic tanks, while greywater (domestic wastewater without faecal contamination) is typically routed to drainage systems in the public space of dense settlements, thus compromising hygienic conditions.(11) In short, unregulated urban expansion can exacerbate issues with mobility and access to basic infrastructure while unregulated urban densification can create unsanitary conditions, which may have negative implications for public health.(12)
A number of studies have examined the relation between household dynamics and urban densification processes in informal settlements. Smith and Jenkins(13) examine the development of informal settlements in Huambo, Angola. They argue that most urban expansion is driven by popular demand and that an understanding of social and cultural values is hence important in order to support a more effective supply of urban land. These authors underscore that urban growth trends in Huambo include the decline in household sizes, the division of plots, a rise in the proportion of rental housing and an increase in the built-up density in informal settlements. Andreasen and Agergaard(14) examine property investments in the informal land sector among moderately resourced households in Dar es Salaam and Mwanza, Tanzania, highlighting that property investments in incremental home expansion are enabled by the growing incomes and saving capacity of the lower middle class. In addition, the study suggests that such processes shape informal urban expansion and co-finance settlement upgrading. Turok and Borel-Saladin(15) examine the role of informal backyard shacks for housing provision in Gauteng, South Africa as a modality of urban densification. Their paper highlights that informal backyard shacks may provide better access to infrastructure and services than in squatter settlements. The study argues that backyard shacks provide an important instrument for urban housing provision in the region and that governments should allocate resources for improving their dwelling conditions and should address the extra pressure on services and infrastructure this development entails.
In the context of Maputo, a recent study by one of the authors of this paper examined urban densification trends in informal settlements based on analysis of satellite imagery and census data, documenting increasing built-up densities and decreasing population densities in centrally located settlements over a 10-year period.(16) It found that the urban population growth in Maputo is primarily accommodated through urban expansion in peripheral areas beyond the municipal boundaries. These urban expansion dynamics will likely exacerbate issues with decreased mobility and inadequate access to infrastructure. Additional significant concerns are the failure to allocate space for public schools, healthcare facilities and recreational areas in unplanned peripheral urban growth zones. Furthermore, the lower population densities may compromise the potential for establishing viable street trade in these non-central localities.
Andersen et al.(17) reported that dwellings in Maputo’s informal settlements typically develop incrementally when the economic resources for home expansion are available, and that built densification is thus largely constrained by the household economic resources. However, the study lacks a systematic analysis of the relationship between home expansion and both timespan and SES. Although these studies highlight important aspects of urban densification and urban expansion dynamics in sub-Saharan Africa at both household and settlement levels, they do not explore the intricate relationship between urban form and SES that is examined in this study.
Urban expansion is a global tendency, not unique to sub-Saharan Africa and is likely linked to economic development.(18) The post-war large-scale suburbanization in American and European cities was largely enabled by the emergence of mass-produced affordable automobiles.(19) Car ownership is currently increasing across sub-Saharan Africa, exacerbating issues with traffic congestion, air pollution, carbon emissions and traffic accidents.(20) In addition, the lost-opportunity cost associated with the vast transportation time due to inadequate mobility systems and consequent congested roads suggests that significant resources are being wasted, with negative implications for productivity and economic growth. Structural conditions may play a crucial role in the current urban expansion trends, including developers making higher profit margins by building more expensive multi-storey constructions which cater for population segments with more economic resources.(21) However, as several studies have suggested a link between SES and urban form,(22) SES may also affect urban expansion trends in sub-Saharan Africa. Studies on the relationship between SES and built densification may enhance the understanding of the drivers of urban expansion and improve the basis for developing more effective policy and urban planning measures in sub-Saharan Africa. With this background in mind, the present study examines the relationship between SES and urban form variables of informal settlements in Maputo, Mozambique.
III. Context: Maputo, Mozambique
This section describes the context of the study and includes a broad overview of the history of Maputo, as well as brief presentations of each of the case study areas under examination.
a. Metropolitan context
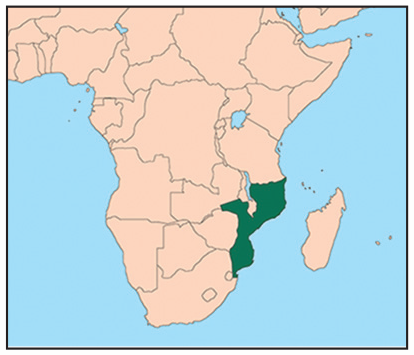
Mozambique is a low-income country located in south-east Africa. Maputo is the capital and the most populous city of the country. The city has a formal urban centre surrounded by informal settlements to the west and north and by Maputo Bay to the east and south. The city centre was established in 1781 by Portuguese colonialists by the estuary of the Maputo Bay (formerly Delagoa Bay), which provided opportunities for naval and inland transportation.(23) After Mozambique’s independence from Portugal in 1975, a civil war broke out and Maputo’s development was impacted by a large influx of internally displaced persons and by limited capacity to administer its consequent urban growth.(24) Most of the informal settlements in the city developed after independence, with limited urban planning and state governance of these developments.(25)
The greater Maputo metropolitan area includes the municipality of Maputo, the municipality of Matola and the districts of Marracuene and Boane.(26) The municipality of Maputo has seven administrative districts (distritos), which are subdivided into administrative neighbourhoods (bairros), in turn subdivided into administrative blocks (quarteirões).(27) District 1 covers the formal city centre, Districts 2–5 cover the informal urban areas to the north and west of the centre, and Districts 6 and 7 cover the island of Inhaca and Katembe, south of the bay.
Much of the urban land use in the city is informal, suggesting that authorities exercise limited control over urban development.(28) The lack of a coherent housing policy that recognizes the needs of the urban poor means that most households rely on self-building or on private market-based housing provision.(29) Housing in informal settlements of Maputo typically develops incrementally when households have the economic resources for home expansion.(30) These incremental, single-room expansions of dwellings have led to the emergence of a housing typology known as casa ventoinha (fan house) as it resembles a fan when seen from above.(31) When complete, these houses feature four individual roof surfaces which correspond to the interior division of the rooms. Secondary detached single-room units (independicias) are often constructed for extended family or to rent out once the casa ventoinha is completed. However, rental housing in the informal settlements of Maputo remains relatively limited.(32) Built densification is thus largely constrained by household resources and occurs over time.(33)
The case study areas examined in this paper are located in District 2 (Polana Caniço A and Polana Caniço B), District 4 (Albazine) and District 5 (Magoanine C). An overview of Maputo, along with the location of the four case study areas, is presented in Figure 1. An overview of the four case study areas is presented in Figure 2.
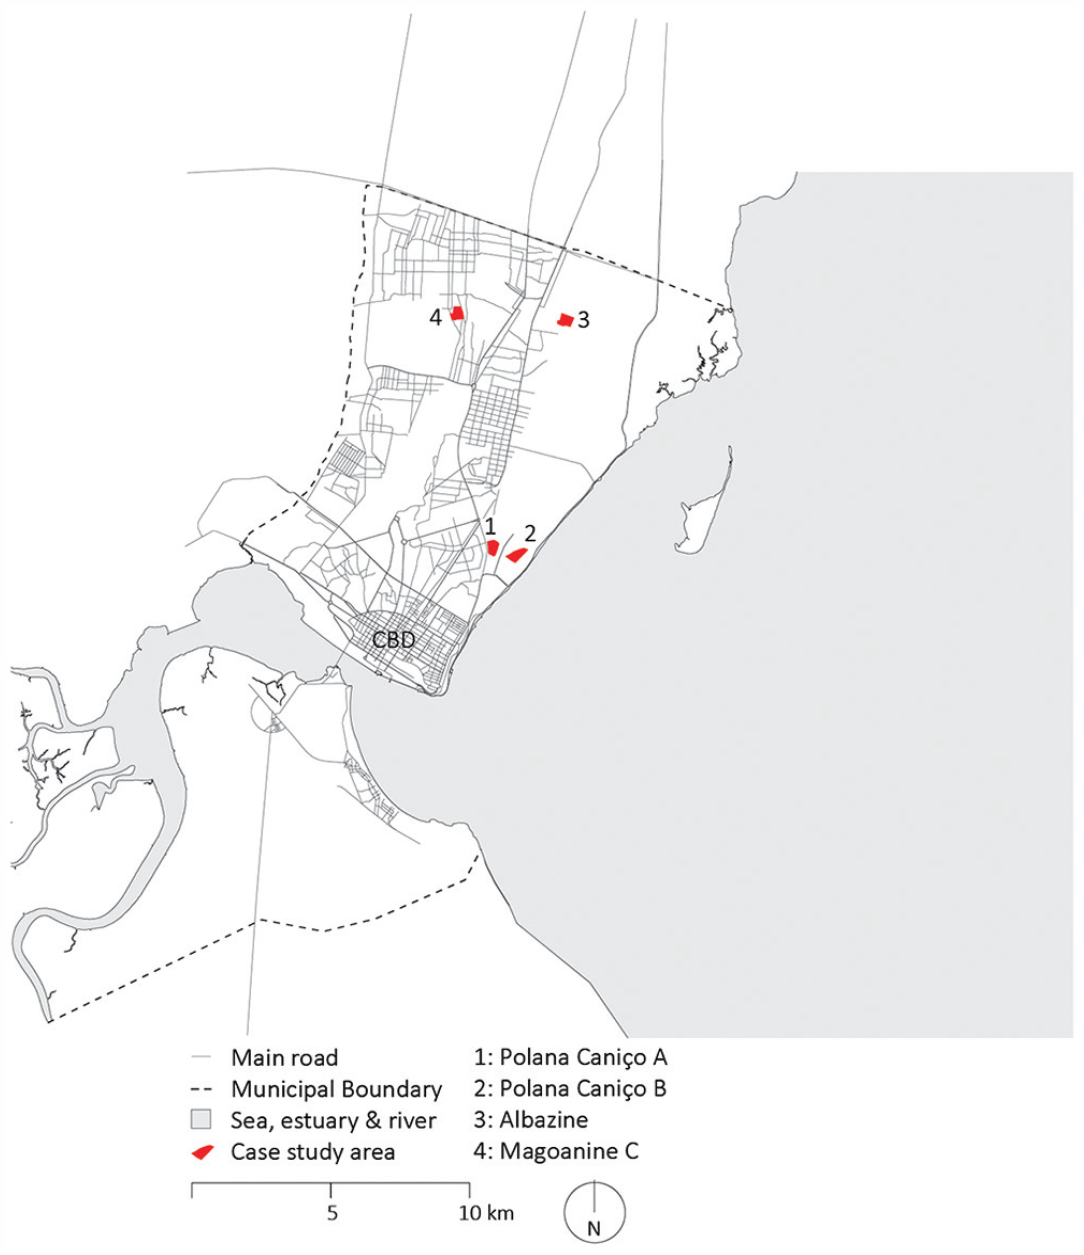
Overview of Maputo and locations of case study areas
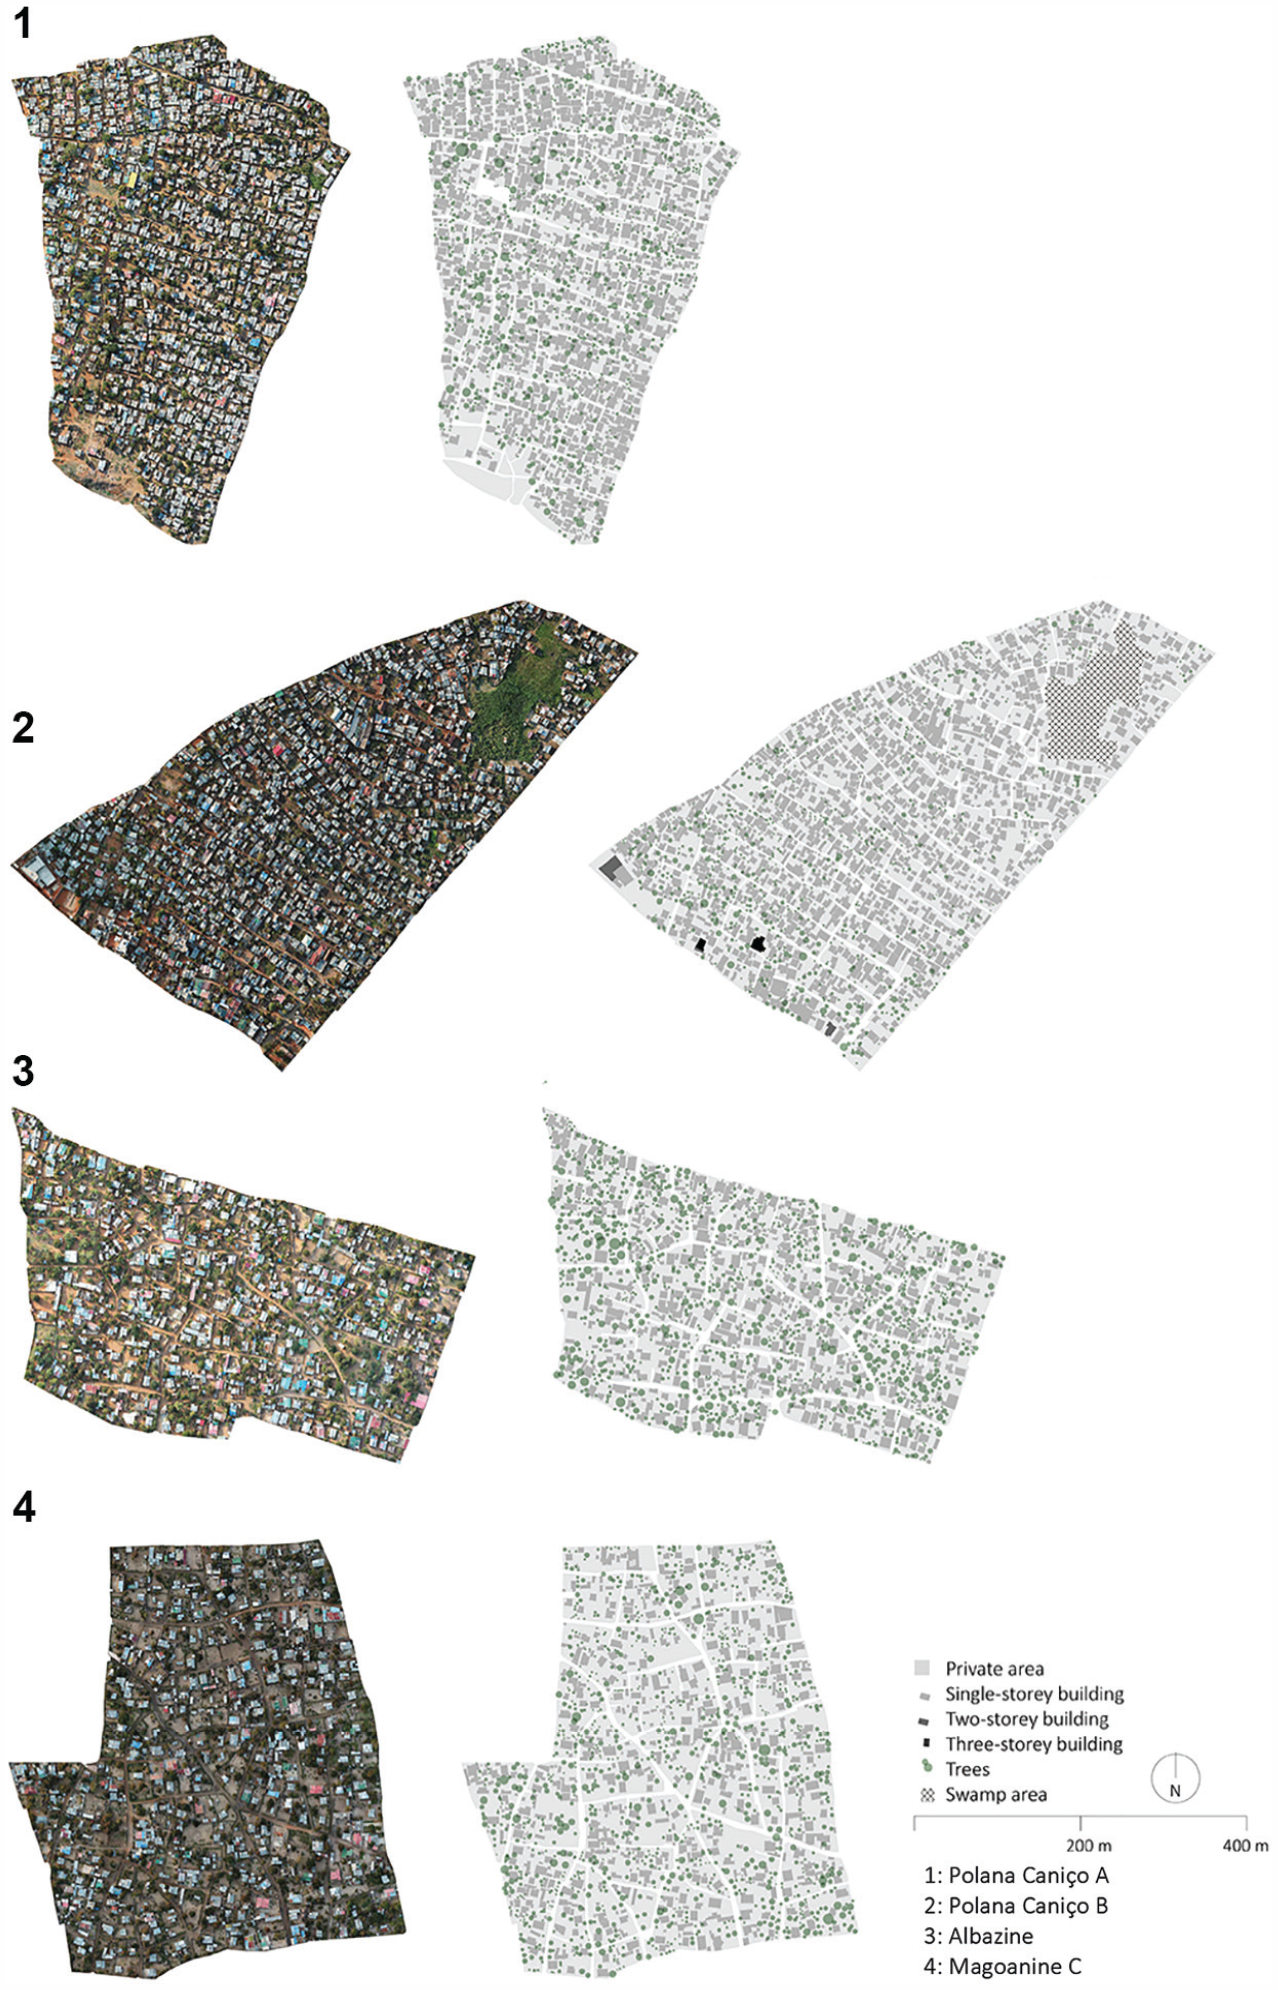
Overview of case study areas based on field surveys
b. Case study areas
Polana Caniço A was planned as a part of the Urbanisation Project of Maxaquene and Polana Caniço, which was implemented between 1977 and 1979. Over this time period, a structural readjustment project was developed by the National Directorate of Housing and funded by the United Nations, resulting in the relatively planned urban fabric seen in these neighbourhoods today.(34) There are no sources documenting the development of the case study area in Polana Caniço B, but notably, the neighbourhood features some degree of planned structure, similar to that in Polana Caniço A. In 2000, Magoanine C and Albazine were considered the peripheral boundary of urban development in Maputo and these neighbourhoods were largely occupied without urban planning or any enforcement of urban regulations.(35) Today, the city extends more than 30 kilometres beyond the municipal boundaries.(36) The central location of Polana Caniço contributes to a pressure there on the real estate market by private investors, which has led to signs of gentrification in the neighbourhood.(37)
IV. Methodology
The study draws on high-resolution geospatial surveys, household surveys focused on SES, a statistical analysis of the household survey responses, and computation of urban form metrics at neighbourhood level based on the geospatial surveys. The household surveys and the geospatial surveys were carried out between August and October 2020.
a. Case study selection and surveys
The case selection criteria were based on temporal and locational factors, as these influence the development of urban densities.(38) The timeline feature in Google Earth was used to select areas with higher and lower levels of consolidation in 2000, based on visual inspection. The satellite images are not included in the paper since this journal does not publish commercial re-use of third-party material, and first-party aerial imagery could not be sourced. Polana Caniço A and Polana Caniço B are centrally located at a similar distance from the central business district (CBD) (~5 km). Magoanine C and Albazine are more peripherally located at a similar distance from the CBD (~12.5 km). The urban fabrics of Polana Caniço A and Albazine were more consolidated by 2000, while those of Polana Caniço B and Magoanine C were less consolidated at this time and are thus likely more recently established. This site selection enabled the comparison of centrally and peripherally located settlements, which were consolidated and not yet consolidated in 2000. The selected cases thus provide a basis for examining the influence of both centrality and temporal factors on the density of settlements.
The household surveys of SES were based on frameworks used in previous studies.(39) More specifically, the indicators of SES used in the household surveys included three characteristics of so-called “slum” conditions (i.e. overcrowding, inadequate access to water and inadequate access to sanitation).(40) Indicators of respondents’ level of completed formal education, dwelling size, household access to electricity as well as car, smartphone and computer ownership contributed further to the basis for assessing SES across the four settlements. The survey also examined secondary household information (i.e. age of head of household, timespan of residency and tenancy status). Regarding access to infrastructure (i.e. water, sanitation and electricity), it should be noted that the surveys examined whether these amenities were present at household level, not whether the household could afford to use them. Since the provision of such infrastructure is financed at household level,(41) these indicators highlight aspects of households’ economic conditions. The questionnaire thus addressed multiple indicators of SES, including household amenities, level of education and dwelling size, thus combining indicators of household economic resources and social status.(42)
The questionnaires were distributed to heads of households at the lowest administrative level (quarteirão). All households of each quarteirão within the study areas were offered the opportunity to participate in the study. The representative of each quarteirão’s local neighbourhood administration (known as chefe de quarteirão) distributed the questionnaires to the households and subsequently collected them. Sample sizes of participating households varied between 104 and 183 for each of the four settlements. To facilitate an overall comparison beyond individual indicators, a composite ranking of SES was computed for each settlement. This involved assigning a ranking (1 to 4) to each settlement for every indicator, with 1 indicating the highest SES across all four case study areas, and 4 indicating the lowest SES. The scores were then summed and divided by the number of indicators to derive the composite ranking. Household access to a latrine and to a regular toilet were both surveyed, but only access to a regular toilet was included in the ranking. This is because the lack of latrine access might indicate either low SES (insufficient resources to afford the infrastructure) or high SES (if the household had a regular toilet, which is more expensive and associated with a higher status).
Major roads were chosen as external boundaries of the case study locations. However, these were not included in the analysis to avoid data bias (e.g. through variations in sizes of adjacent major roads potentially distorting the proportion of public space). High-resolution orthophotos were produced by mapping the four case study areas using an unmanned aerial vehicle (drone) for the systematic collection of photometric aerial data. The photometric data (aerial photos) were subsequently processed with Pix4D photogrammetry software to generate high-resolution geo-referenced orthophotos, digital surface models (DSMs) and digital 3D models of each settlement. The public space of each settlement was mapped by walking along the boundaries of every block with a handheld GPS-device (smartphone), while using the SW Maps application for tracing the movement. The public space survey thus included all areas where a pedestrian could walk freely without encountering obstacles or restrictions. Since there were no public squares or public institutions in the case study areas, the public space only included streets and lanes.(43) This metric was included in the study as adequate street space is critical for neighbourhood liveability and for the implementation of improved infrastructure in informal settlements.(44)
The GPS traces and orthophotos were subsequently imported into QGIS, automatically scaled and exported. The files were imported into AutoCAD and layers for buildings, blocks and street networks were created. All buildings were traced manually based on the orthophotos (see Figure 3). Multi-storey buildings were identified through the DSMs and 3D models in Pix4D and separate layers were created for each floor. The perimeter of each floor was traced manually and placed on the corresponding layer. The street network was also traced manually based on the GPS traces, and blocks were subsequently drawn based on the orthophoto and street network. Trees were demarcated with circles corresponding to the diameter of the tree canopy. Vegetation with a canopy diameter smaller than one metre was selected in AutoCAD and removed in order to exclude minor vegetation from the data. An area with demolished houses in the southern part of Polana Caniço A and a swamp area in the northern part of Polana Caniço B were excluded from the surveys in order to avoid data bias. The vector drawings were then used to compute a set of three metrics of urban form for the four case study areas at settlement level:
Floor area ratio (FAR): the total floor area (also called gross floor area) divided by the total sample area. The metric highlights the density of the built environment.(45)
Public space ratio (PSR): the total public space divided by the total sample area. The metric highlights the level of public space relative to the study area.(46)
Urban tree canopy cover (UTCC): the total ground area covered by the crowns of trees divided by the total sample area. The metric highlights the density of urban trees.(47)
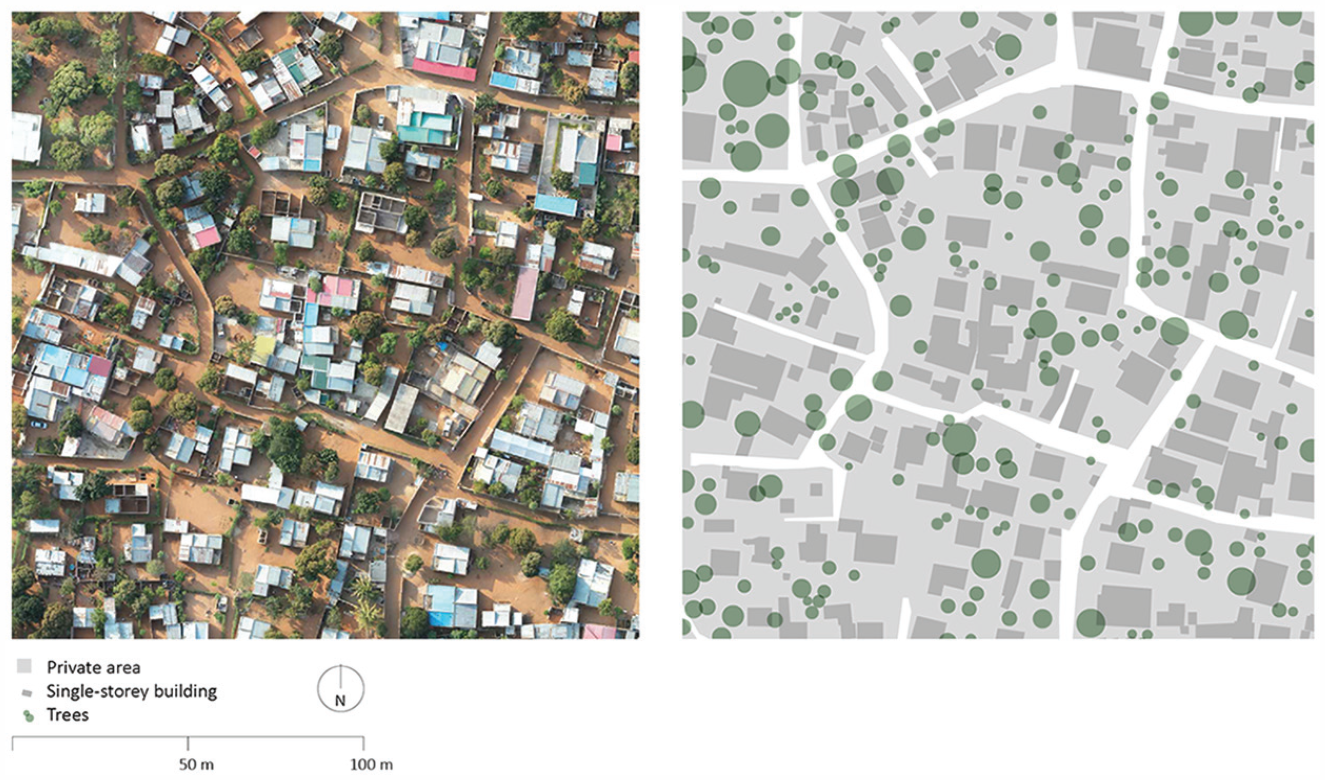
Detailed map of Albazine based on field survey
b. Correlation analysis
Relationships between socioeconomic indicators across the four case study areas were assessed by computing Pearson’s correlation coefficients (r)(48) for all possible pairwise combinations of indicators. Pearson’s r varies between −1 (i.e. perfect negative relationship) and 1 (i.e. perfect positive relationship). A p-value associated with this test provides information on the statistical significance of the coefficient (p-values less than or equal to 0.05 have statistical validity).
V. Results
a. Household surveys
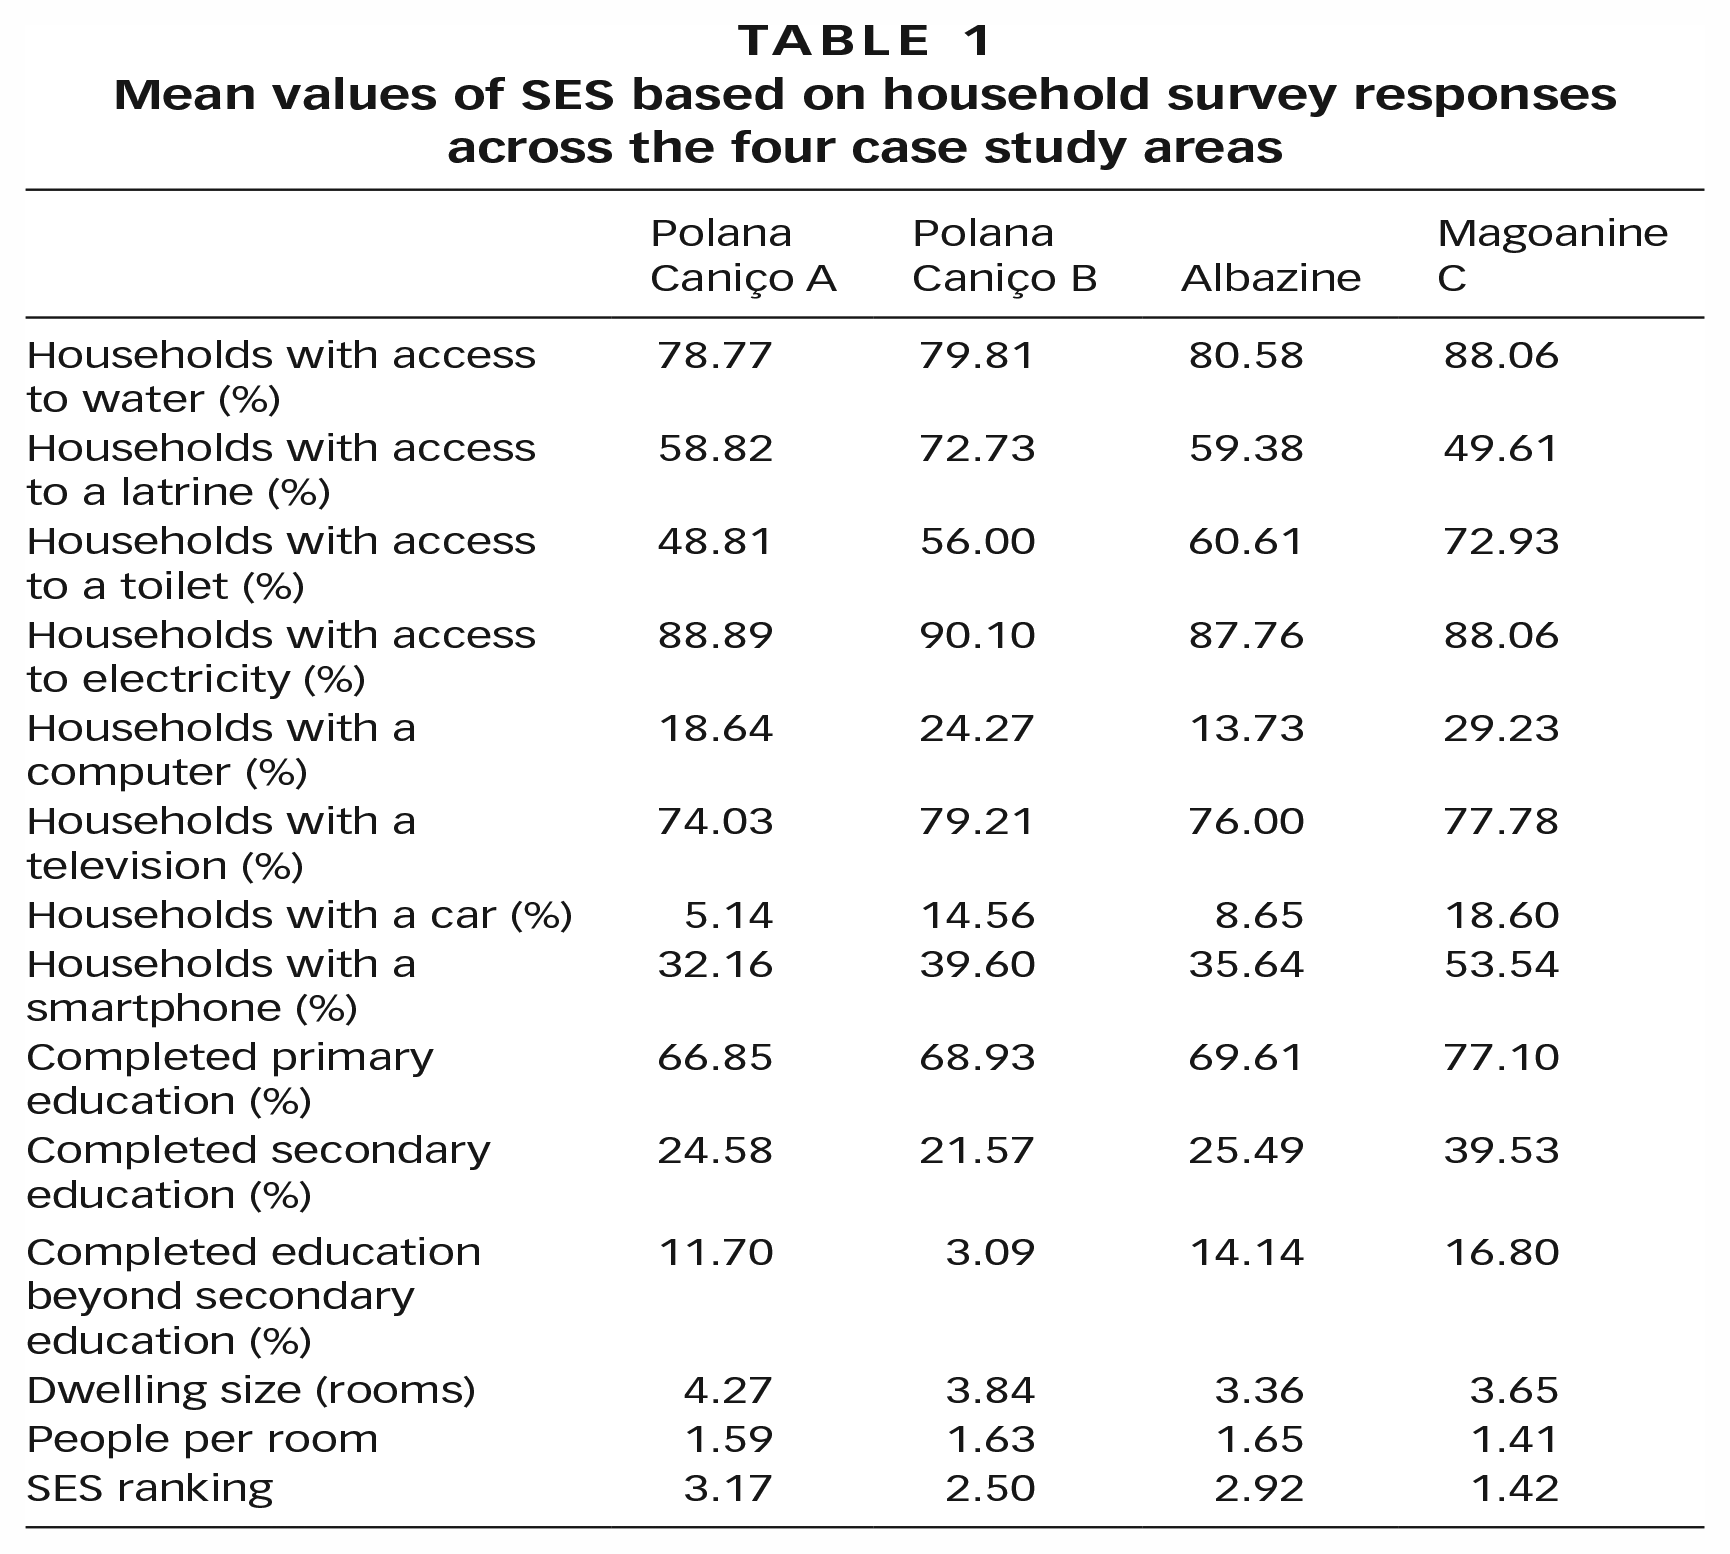
The responses to the household surveys are summarized in Tables 1 and 2. The SES ranking across individual SES indicators underscores that Magoanine C is characterized by households with higher SES, whereas Polana Caniço A shows notably lower SES compared to the other settlements. Polana Caniço B shows the second highest SES, and Albazine the second lowest SES. More specifically, the high SES of Magoanine C is exemplified by the highest levels of car ownership (15 per cent), access to water (88 per cent), improved sanitation (73 per cent) and computer (29 per cent) and smartphone (53 per cent) ownership, completed primary education (77 per cent) as well as lowest average number of people per room (1.41). The relatively low SES in Polana Caniço A is exemplified by the lowest levels of access to water (79 per cent) and improved sanitation (49 per cent), car ownership (5 per cent), smartphone ownership (32 per cent), and the lowest level of completed primary education (67 per cent). When settlements located at similar distance to the CBD are compared, the earlier established neighbourhoods are characterized by lower SES.
Mean values of SES based on household survey responses across the four case study areas
Mean values of secondary household information based on survey responses across the four case study areas
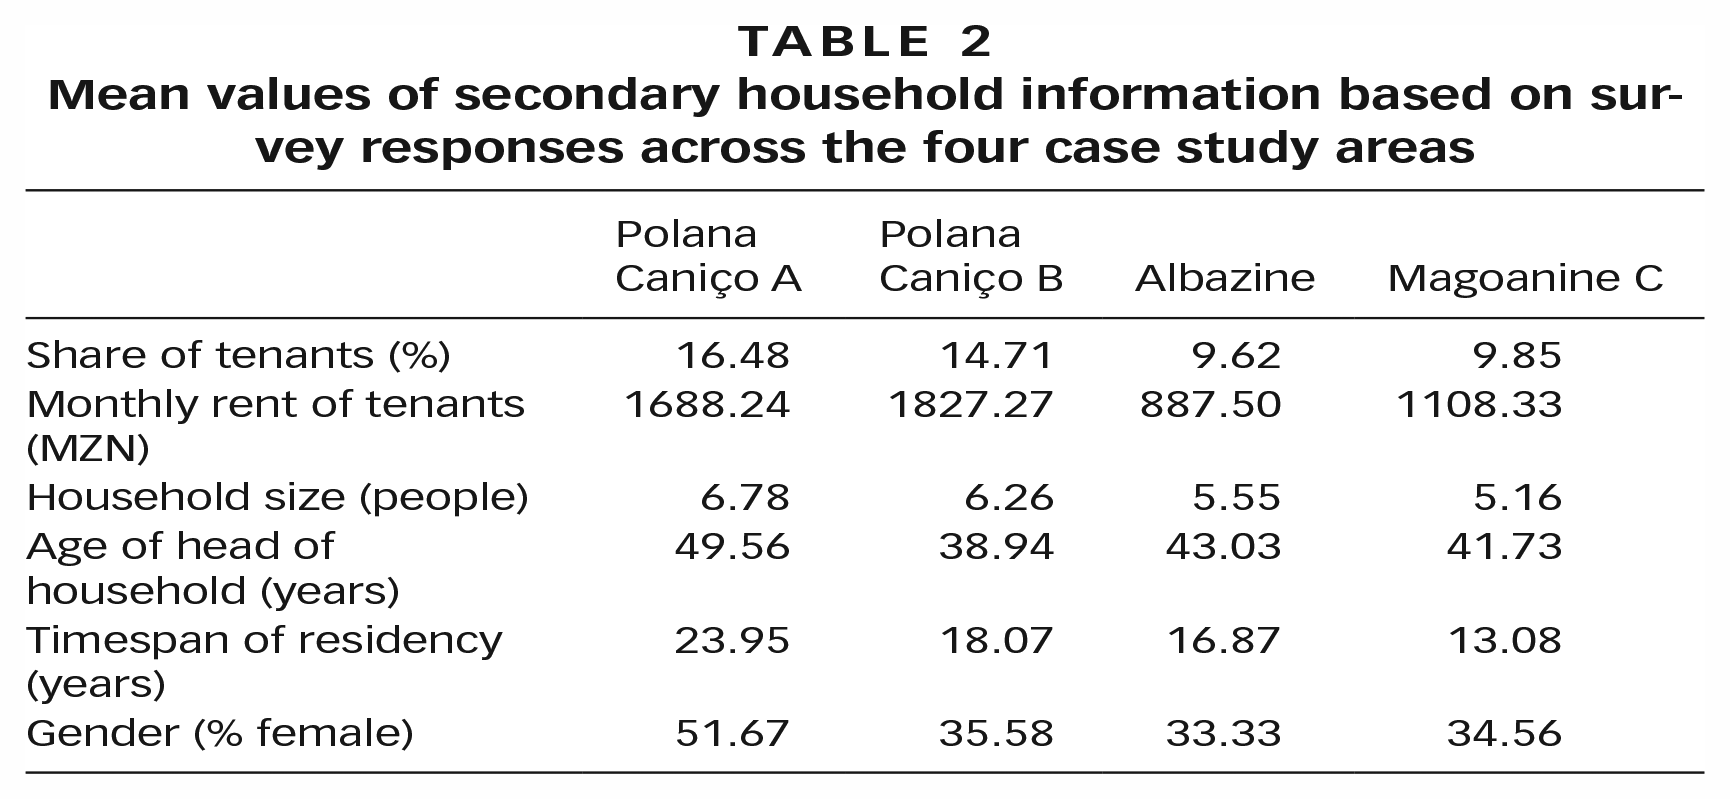
The household surveys show that Polana Caniço A residents had been in their houses for the longest period, and Magoanine C residents for the shortest period. Polana Caniço B residents had been in their homes for the second longest period on average and Albazine residents for the second shortest period. The assumption about the time of establishment of the settlements is thus supported by the average timespan of residency in each settlement, corroborating the basis for selection of cases – namely, that the case study area in Polana Caniço A was established prior to that in Polana Caniço B; and that the case study area in Albazine was established prior to that in Magoanine C.
b. Correlation analysis of survey data
Pearson’s coefficients were computed for all pairwise combinations of variables at settlement level and across all case study areas. This section reports and discusses only statistically significant coefficients (p-value <= 0.05). Overall, the correlations are weak to moderate (Figure 4). As expected, indicators of material possessions are cross-correlated and correlated with a higher level of education. For example, owning a TV (television) is correlated with access to water (water) (0.29), electricity (electricity) (0.34), owning a car (car) (0.15) and a smartphone (smartphone) (0.24). Having attended secondary school (sec_sch) is correlated with owning a smartphone (0.19), car (0.18) and television (0.17). Dwelling size measured in number of rooms (no_rooms) is consistently linked to indicators of material possessions, for example with access to water (water) (0.26), electricity (electricity) (0.25) and owning a TV (television) (0.24), but also to the timespan of residency (time_res) (0.26), age of residents (measured as age of head of household) (age_res) (0.20) and household size (hh_size) (0.40). This means that the incremental densification of the four settlements under examination is mainly related to owning a place, more financial resources and timespan of residency. Conversely, renting is inversely correlated with access to water (–0.12), in-house toilet (toilet) (–0.16) and computer ownership (–0.14), timespan of residency (–0.21), age of residents (–0.21) and house size (–0.24), showing that tenants tend to be younger residents with lower SES. The patterns illustrated above are generally representative of the four case studies under examination, with a few exceptions (see Appendix A in supplementary materials).
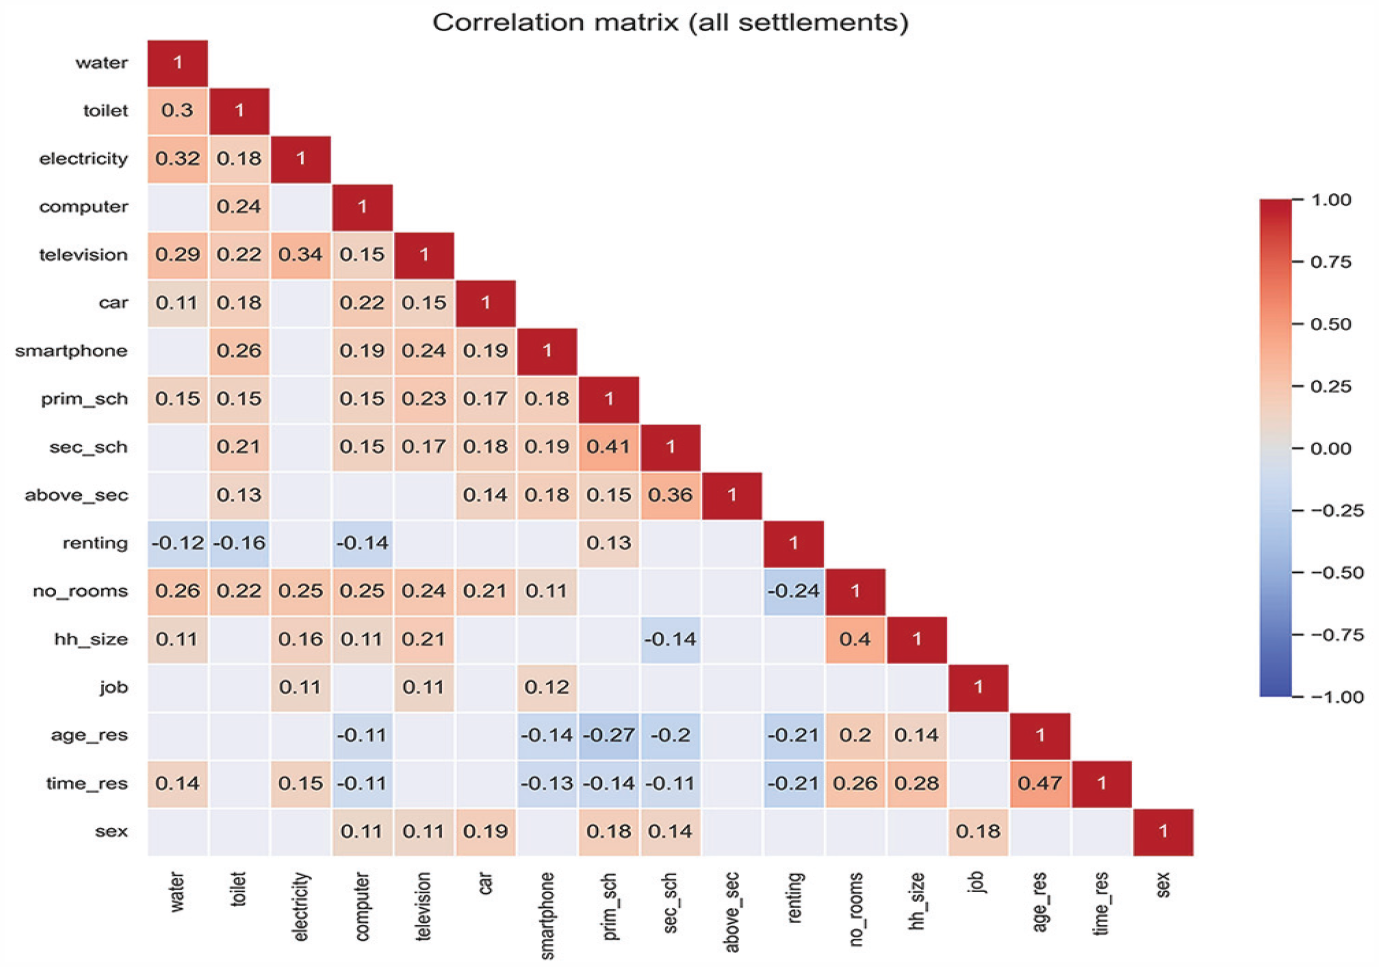
Correlation matrix of the household survey data
In Polana Caniço A, the inverse correlations between renting and timespan of residency (–0.4), age of residents (–0.35) and house size (–0.38), are considerably stronger; the pattern of younger people living in smaller accommodations and for shorter timespans seems to be more accentuated here. This is likely due to a higher proportion of rental accommodation than in the other settlements.
In Polana Caniço B, stronger correlations are found between house size and material possessions, i.e. access to water (0.24), in-house toilet (0.33), owning a computer (0.41), a TV (0.34), a car (0.42) and a smartphone (0.37), suggesting that house extensions are more strongly related to material possessions and higher SES than in the other settlements. However, in contrast to the pattern found across all settlements, no correlation emerges between timespan of residency and age of residents. This might be because Polana Caniço B is the most recently established settlement. However, levels of built-up density are similar to those of Polana Caniço A, which is at a comparable distance from the CBD, hinting at a faster densification process.
In Albazine, house size is more strongly related to material possessions than in Polana Caniço A and Magoanine C, i.e. access to water (0.42), in-house toilet (0.42), electricity (0.37), owning a computer (0.30), a TV (0.36) and a car (0.31), but not to timespan of residency and age of residents. This might underscore a higher level of mobility among wealthier families in and out of this settlement.
Magoanine C does not show large variations from the patterns found across the other settlements. House size is correlated not only with indicators of material possessions, i.e. access to water (0.26), owning a computer (0.27) and a TV (0.37), but also with timespan of residency (0.32) and age of residents (0.26), reiterating, even in this more recently established settlement, the densification patterns driven by SES found in Polana Caniço A.
c. Urban form of the settlements
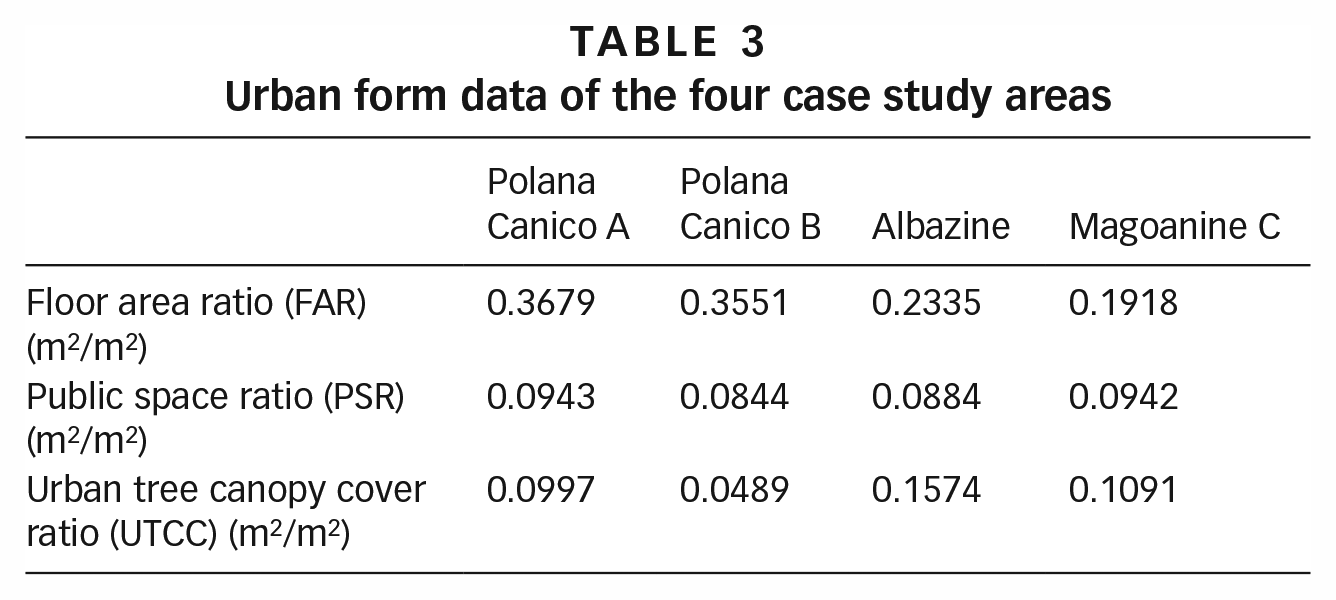
The outcome of the computation of the urban form indicators is summarized in Table 3. The data show that Polana Caniço B is characterized by lower levels of FAR and UTCC than Polana Caniço A, while Magoanine C is characterized by lower levels of FAR and UTCC compared to Albazine. Accordingly, when comparing the settlements located at similar distance to the CBD, the earlier established neighbourhoods are characterized by higher built-up densities and higher tree canopy coverage. While the findings related to FAR are expected, since built-up density tends to increase over time, the findings for UTCC are less intuitive, pointing to the fact that, even though Polana Caniço B and Magoanine C have lower levels of built-up density, they are characterized by less vegetation. The findings did not indicate any clear pattern regarding PSR.
Urban form data of the four case study areas
VI. Discussion
The findings of the study highlight that (1) the more recently established settlements within the city limits are characterized by households with higher SES, larger dwellings, less vegetation and less densely built environment, indicative of households with higher SES occupying more land; (2) there are statistical links between the indicators of SES, dwelling size and timespan of residency, indicative of incremental home expansion occurring over time according to available economic resources; (3) rental housing is more widespread in the centrally located settlements and generally accommodates younger residents with lower SES, indicative of a restricted access to the land market within the city limits for households with low SES. This section discusses the mechanisms that likely account for these findings and reviews relevant potential policy responses to the urban expansion dynamics informed by the research.
The findings indicate that urban densities of informal settlements increase over time as the levels of FAR correspond to the average number of years the respondents have resided in their households. Furthermore, dwelling size and timespan of residency were found to be correlated. In addition, the largest dwellings are found in Polana Caniço A, which is both the earliest established settlement and characterized by the lowest average SES. However, the average dwelling size was found to be larger in Magoanine C than in Albazine despite the fact that the former was established more recently than the latter. Magoanine C was found to be characterized by the highest SES of the four settlements, which likely partially accounts for the larger average dwelling size compared to Albazine. Notably, density patterns at neighbourhood level correspond directly to the average timespan of residency at household level, while both timespan of residency and higher SES are linked to larger dwelling size. Accordingly, the study highlights the multidimensional interrelation between temporal factors and SES in driving the size of dwellings and built densification.
The average dwelling size was found to be smaller in Albazine than in Magoanine C, while the FAR was found to be higher in Albazine than in Magoanine C. It is thus likely that the average plot sizes are smaller and the dwelling density is higher in Albazine compared to Magoanine C. As Magoanine C is characterized by the highest level of SES, this suggests that households with higher SES seek larger plots. Higher SES may thus contribute to low-density urban expansion due to increased space consumption.
When comparing the settlements located at a similar distance to the CBD, the more recently established examined settlements are characterized by higher SES compared to the earlier established settlements. This is exemplified by the higher average levels of household access to water and sanitation, education and material possessions in Polana Caniço B compared to Polana Caniço A and Magoanine C compared with Albazine. This finding seemingly contradicts the notion that urban migration in low-income countries is largely driven by disadvantaged rural populations moving to cities in search for a better life.(49) However, the explanation is likely that the examined settlements are located within the city limits and that recent migrants in these areas are likely comprised of those with more economic resources while those with fewer resources likely rent accommodation in central areas or settle in more peripheral areas where land is cheaper. Although the latter is not directly documented in the study, as only cases within the municipal boundaries are examined, the former is evidenced by the higher proportion of tenants in the centrally located case study areas.
While the first waves of migration to the city after the 1975 independence were characterized by the large influx of internally displaced persons fleeing the civil war, later waves were to a higher extent driven by higher wages and access to education and healthcare services in the city.(50) Furthermore, at the time of independence, the peri-urban areas surrounding the centre were largely unsettled, whereas today, the peri-urban areas form a more than 30-km continuous belt from central Maputo to Marracuene to the north and Matola to the west.(51) It is likely that the price of land in Greater Maputo is increasing due to the high rates of population growth and the consequent growing demand for land. This mechanism likely further excludes low-income groups from acquiring land in proximity to the city centre and may thus partially account for the higher SES seen in the more recently established of the examined settlements.
The study found lower levels of vegetation density in the more recently established settlements when comparing the pair of settlements located at a similar distance to the CBD. As previous studies have found that UTCC in informal settlements in Maputo declines over time,(52) the findings suggest that households with higher SES increasingly are inclined to cut down trees. Trees are important for urban micro-climate, mitigation of air pollution, absorption of surface water run-off and biodiversity,(53) and private gardens constitute the largest green space of Maputo.(54) However, findings highlight that households with higher SES seem to be contributing to cutting down existing vegetation, thus compromising the overall resilience of their own neighbourhood. The study did not find any pattern regarding public space ratio across the four sample areas despite considerable variations in built-up density. This suggests that built densification does not necessarily compromise access conditions and functional mobility systems. This is particularly important for infrastructure upgrades in informal settlements, where the availability of adequate street space for implementation of infrastructure is crucial.
The study found that tenancy is inversely associated with the timespan of residency, age of the residents, material possessions and the size of the houses. Tenants thus largely consist of younger people with lower SES who thus likely cannot afford to buy houses and land. There is a higher share of tenants in the more centrally located settlements. This may be the result of older households having more time to expand the dwellings to provide a secondary income through provision of rental accommodation. The informal housing sector in Maputo is thus likely characterized by four main groups of residents: (1) long-time residents who reside in the older settlements; (2) newer residents who have the financial means to acquire informal land in newer non-peripheral settlements; (3) newer residents who lack financial means and resort to rental accommodation primarily in the older settlements; and (4) newer residents who lack financial means and settle in peripheral settlements where land is cheaper. Although the present study emphasizes areas within the city limits and does not provide direct evidence of (4), previous research documents that the urban growth almost exclusively occurs beyond the municipal boundaries.(55) Recent migrants thus likely either settle in rental accommodation close to the city to attain increased access to the job market and education institutions or beyond municipal boundaries where land is more economically accessible but mobility is more constrained.(56)
These findings have the potential to inform and qualify discussions on how to address contemporary urban expansion trends and issues with compromised mobility and public hygiene in contexts characterized by rapid urban development and limited capacity to administer the urban growth. Potentially relevant measures include policies that require only limited enforcement of land use regulation given the constrained local institutional capacity. These might include transit-oriented development (TOD), road-pricing and support of small-scale rental housing.
TOD can drive densification in nodes along main traffic arteries, incorporating public transportation, commerce and housing in mixed-use developments.(57) Such densification is incentivized through improved transportation conditions. In this respect, the bus rapid transit system implemented in Dar es Salaam, Tanzania, constitutes a relevant example of such a form of development, based on rapid transit bus lanes separated from the regular traffic.(58) This may drive densification in these areas with enhanced mobility, and curb urban expansion.
Road-pricing is already practised on the major road connecting Maputo with the neighbouring municipality of Matola. Similar systems may be implemented for all entry points to the municipality of Maputo. Road-pricing disincentivizes urban expansion due to increased costs of transportation.(59) On this basis, road-pricing to enter the municipality of Maputo could create a market-based “green-belt” effect, which would otherwise require land management capacities that local authorities lack. This may provide incentives for the middle class (who can afford to make investments in infrastructure) to settle within these central areas, thus driving the urban densification and in so doing limiting issues with public hygiene that affect dense settlements. Exemption of public transport from the road-pricing system can ensure a more socially balanced urban development.
Small-scale informal backyard rental housing is widespread in Maputo and contributes to increasing population densities as well as affordable housing provision. This is thus an established model for densification in centrally located informal settlements that restricts peripheral expansion. Currently, the public transportation system in Maputo largely relies on state-subsidized private minibuses (chapas). A similar model may be considered for subsidizing secondary backyard housing within the municipal boundaries to support densification and expand the affordable housing provision. However, since limited research has been conducted on backyard housing as an affordable solution within the city limits of Maputo, a widespread implementation would require further validation to ensure this is an appropriate and scalable solution. Such a further validation can be carried out through initial small-scale pilot projects, addressing potential concerns such as fire hazards and reduced access conditions.
The policy measures listed, namely transit-oriented development (TOD), road-pricing and small-scale backyard rental, have the potential not only to curb urban expansion dynamics, but also support small business development. Firstly, TOD can contribute to trade and economic activities in local urban centres along main transport corridors by promoting increased concentration of people, leading to higher footfall and customer base for small businesses.(60) Secondly, road-pricing can serve as an effective tool to incentivize residential densification within the city limits. By reducing private vehicle usage and encouraging efficient use of the transportation system, road-pricing enhances mobility and provides better access to labour markets, facilitating small business operations.(61) Lastly, small-scale rental housing, often managed by individual landlords, can be considered small businesses themselves. By providing additional income streams to the landlords, such rental properties can generate revenue for establishing further small-scale private sector developments, thus contributing to the growth and diversification of the local economy.
VI. Conclusion
The present study examined urban form variables and household SES of four informal settlements in Maputo, Mozambique. It highlighted the incremental growth patterns of informal settlements whereby homeowners expand their dwellings according to the available economic resources over time. The study highlighted that households with higher SES likely consume more space, contributing to low-density urban expansion trends. This was underpinned by data showing that the settlement characterized by highest SES was also characterized by both large dwelling sizes and low level of built-up density, indicative of low dwelling density. Although the largest dwellings were found in the settlement with the lowest average SES, the density patterns observed at the neighbourhood level were related to the average timespan of residency at the household level. Additionally, both the timespan of residency and higher SES were statistically associated with larger dwelling sizes, highlighting the complex and interconnected relationship between temporal factors and SES in influencing both the size of dwellings and the process of built densification. In addition, the study suggested that households in more recently established settlements within the city limits have higher SES compared to households in older comparable settlements, and that recent migrants with lower SES largely rent accommodation in central areas or settle outside the municipality where land is cheaper. The study recommended policy measures such TOD, road-pricing and state subsidy of small-scale backyard rental housing to address the adverse effects of low-density urban expansion in contexts characterized by limited institutional capacity to enforce land use regulation.
Supplemental Material
sj-pdf-1-eau-10.1177_09562478231195512 – Supplemental material for Urban density and socioeconomic characteristics of informal settlements: evidence of interrelation from Maputo, Mozambique
Supplemental material, sj-pdf-1-eau-10.1177_09562478231195512 for Urban density and socioeconomic characteristics of informal settlements: evidence of interrelation from Maputo, Mozambique by Johan Mottelson and Alessandro Venerandi in Environment & Urbanization
Footnotes
Acknowledgements
We would like to acknowledge Mapeando.Meu.Bairro for conducting the fieldwork and Margarida Waco for assisting the manual delineation of the maps.
Supplemental Material
Supplemental material for this article is available online.
4.
17.
20.
22.
27.
30.
34.
37.
Silva (2016); ![]() .
.
References
Supplementary Material
Please find the following supplemental material available below.
For Open Access articles published under a Creative Commons License, all supplemental material carries the same license as the article it is associated with.
For non-Open Access articles published, all supplemental material carries a non-exclusive license, and permission requests for re-use of supplemental material or any part of supplemental material shall be sent directly to the copyright owner as specified in the copyright notice associated with the article.