
Abstract
Over 70 per cent of India’s surface water is polluted by human excreta and other waste and less than 35 per cent of urban wastewater is treated. This poses a severe risk to public and environmental health. Urban waterbody rejuvenation in India often focuses on aesthetic improvements rather than addressing its systemic interdependencies with sanitation. This paper establishes these systemic links through a mixed-methods study using water-quality testing and stakeholder interviews in the city of Bengaluru, India. A conceptual system dynamics model of technical, social, institutional and environmental factors is developed. Results show that sewage leaks into lakes via stormwater drains are a major pollution pathway, among others. Three system levers for positive change have been identified: coordination of government entities, adequate faecal sludge management and strong citizen involvement. Citywide inclusive sanitation (CWIS) is proposed as an approach to provide leverage and solve the intertwined issues of public and environmental health.
Keywords
I. Introduction
For over a decade, sanitation has been recognised as a basic human right by the United Nations. Despite this, nearly half the world’s population still lacks safely managed sanitation services and wastewater treatment.(1) Both groundwater and surface water are polluted with human waste.(2) For lower-middle-income countries such as India, health, water and sanitation are considered the most critical strategic priorities right after poverty alleviation to attain the Sustainable Development Goals.(3)
In urban India, 128 million people were without basic sanitation as of 2017, up from 34 per cent in 2017.(4) India’s urban population, 34 per cent of the total in 2017, is expected to reach 40.7 per cent by 2030, further magnifying this problem.(5) While efforts such as Swachh Bharat Abhiyan (Clean India Mission) have reduced open defecation in part by creating onsite sanitation systems, this also means an increase in faecal sludge production, with inadequate infrastructure for its safely managed collection and treatment, and contamination of the environment remains widespread.(6) It is estimated that over 70 per cent of India’s surface water is polluted by human excreta and other waste, and less than 35 per cent of urban wastewater is treated.(7)
While public and environmental health are closely related, their management is not integrated. India’s urban sanitation planning focuses predominantly on the expansion and rehabilitation of sewer-based centralised infrastructure without attention to the full range of realities, needs and related environmental factors, including protecting ecology and biodiversity, conserving native species and sustaining lake ecosystems.(8) Where masterplans exist, their implementation often lags behind.(9) Within the rapidly developing urban context, inadequate planning, governance arrangements, finance and engineering constraints limit infrastructure roll-out, especially in informal settlements and unplanned peri-urban areas.(10) Onsite sanitation systems such as pits and septic tanks are viewed by key decision-makers only as temporary solutions until a functioning sewer network is realised. Faecal sludge overflows from these onsite sanitation systems, combined with partially treated or untreated wastewater from sewage treatment plants, ends up in waterbodies, where the concentration of nutrients and pathogens increases and, in turn, decreases dissolved oxygen levels and affects species richness and diversity. It also poses a health risk for those in physical contact with or ingesting the polluted water.
Despite comprehensive laws and regulatory frameworks to mitigate water pollution and ensure safe sanitation, a lack of enforcement results in poor public and environmental health.(11) Instead, a holistic, contextual approach and inter-agency coordination is required to go beyond India’s conventional fragmented technocratic approach.(12) This requires consideration of several interlinked social, spatial, political and institutional systems and their interactions:(13) in other words, systems thinking.(14) The application of systems thinking helps to clarify the dynamic, multi-loop, multi-level structures and non-linear feedbacks between elements that bring about the behaviour and emergent properties of water, sanitation and hygiene (WASH) systems.(15) A systematic literature review in 2020 by Valcourt et al. on the systems approach in WASH, however, suggests that the crucial interconnections between WASH systems are not analytically evaluated.(16)
Citywide Inclusive Sanitation (CWIS) is a framework that both development agencies and academia have taken up. CWIS endorses systems thinking and presents itself as a unified approach based on principles that bring together many elements of WASH.(17) It aims for sanitation provision to be equitable for the urban poor, using a mix of context-specific technical solutions to ensure positive outcomes for both public and environmental health. The CWIS principles provide the necessary systems thinking perspective that goes beyond infrastructure provision, and takes a multi-level service-based approach, accounting for inclusive planning, regulations and business models. It is therefore a useful theoretical lens for studying the systemic links between urban sanitation and environment in a complex city such as Bengaluru, the focus of this case study.
The link between environmental health and public health is well established. But to our knowledge, there has been no study that holistically identifies the system-wide interactions between factors leading to faecal pollution pathways into urban waterbodies or the underlying socio-economic, institutional and political reasons. The objective of this research is to broadly understand the systemic interactions between variables driving urban sanitation in Bengaluru and their influence on the health of waterbodies in the city. This research uses mixed methods to:
a) identify the faecal pathways into the environment and qualitatively assess their relative pollution contributions into waterbodies;
b) map the complex sanitation systems that include socio-economic, political, institutional and environmental factors; and
c) define the key levers of change.
Recommendations for future research and action areas for practice are derived from the research.
II. Case Study
a. Study area
Water and sanitation in India are state responsibilities.(18) Environmental regulatory frameworks are also prescribed at state level, in this case by the Karnataka State Pollution Control Board. Cities can define more stringent bylaws and environmental standards. In Bengaluru, the municipal wastewater management bylaw follows a strict zero liquid discharge policy, whereby residential apartments with 20 or more individual households are required to treat and reuse all the wastewater produced in situ through small-scale sanitation systems. Strict as the policy is, however, these systems are often not operational.(19) Bengaluru has over 285 lakes, a mix of sewered and non-sewered sanitation systems, and thousands of decentralised treatment plants (both functional and non-functional),(20) making it a useful case for studying the systemic interactions between factors underlying both environmental and public health effects of sanitation.
Bengaluru, located in the state of Karnataka, has a population of over 10 million and an annual growth rate of 4.73 per cent, making it the fastest-growing metropolitan city in India. Dubbed the Silicon Valley of India, Bengaluru has been expanding exponentially with an urbanisation rate of 125 per cent between 2000 and 2014, while approximately 4.5 million residents live in underserved informal settlements. The 285 lakes are mostly human-made structures, built over centuries as irrigation tanks, and planned as a system of cascading lakes which overflow into each other and finally discharge into the rivers Arkavathi, Vrishabhavathi and Dakshina Pinakini.(21) Although the city receives an average rainfall of about 900 millimetres, there has been a steady decline in the number and size of lakes, many of which have dried up due to excessive groundwater abstraction from over 400,000 borewells. Many have subsequently been built over.(22)
While sewered solutions to sanitation are the primary choice of the local water utility, Bengaluru Water Supply and Sewerage Board (BWSSB), non-sewered onsite sanitation solutions are widely prevalent in informal settlements and peri-urban areas with around 15 per cent of the city’s population dependent on them. Only 52 per cent of the city’s wastewater is safely managed. The rest pollutes the environment through various pathways.(23) As in other low- and middle-income countries, stormwater drains often function as open sewers.(24) In Bengaluru, stormwater drains (also known as raja kaluve or “big drain”) carry municipal wastewater along with stormwater and serve as receiving bodies for illicit faecal sludge dumping.(25)
The Lake Development Authority, custodians of Bengaluru’s urban waterbodies, classifies only 80 lakes as healthy. The others are dried out or heavily polluted with phosphates, nitrates and heavy metals.(26) The water-quality standards are set by the Central Pollution Control Board (CPCB) and include five classes from A to E indicating designated use.(27)
The pollution standards also guide the city’s waterbody improvement (“rejuvenation”) projects such as Bellandur Lake restoration.(28) These often entail quick fixes such as desilting, clearing solid waste and making aesthetic developments, with little regard to water quality or biodiversity improvement.(29) This has been changing lately with the active involvement of citizens, local non-governmental organisations (NGOs) and environmentalists, and other lakes, including Jakkur, Soulkere and Puttenahalli, have been rejuvenated through these initiatives.(30)
b. Site and lake selection: Kommaghatta Lake
So-called shit flow diagrams (SFDs) provide a citywide, quantitative representation of estimated faecal flows in every step of the sanitation service chain.(31) But since a citywide study was not feasible in this case, we investigated flows into a typical urban lake, and then extrapolated the associated factors. Our lake selection was based on three criteria:
a) minimal exposure to industrial wastewater and animal husbandry;
b) combination of non-sewered and sewered sanitation in the lake catchment; and
c) proximity to laboratory facilities and ready access to data, key informants and local residents (already established by the local NGO).
After scoping four potential lakes in Bengaluru based on these criteria, we selected a lake situated in Kommaghatta village at the southern border of the city. Although Kommaghatta Lake itself is not within the city’s administrative boundary,(32) it was still chosen as it fared best against the aforementioned criteria and since most of its catchment area falls within the urban agglomeration. It shares the climatology and topography of the other Bengaluru lakes, as well as demographic characteristics with mixed sanitation systems and similar effluent flow.
III. Methodology
We adopted a mixed-methods approach, with quantitative water-quality testing, key informant interviews and the development of a conceptual system dynamics model.(33) We collected primary and secondary data between February and May 2020. The interviews and the water testing were carried out at the same time but independently of their respective findings.
a. Flow mapping, water-quality sampling and analysis
As consolidated documentation about catchment hydrology and specific inflows of Kommaghatta Lake was not available, we made several site visits to map the lake catchment area in January 2020. Activities included:
a) visual inspection of sanitation arrangements around the lake;
b) mapping lake inlets by walking along the stormwater drain with a geo-tracking device; and
c) preliminary identification of pollution hotspots (leaks along sanitation value chain) around the lake by visual checks and informal conversations with key informants.
To identify and map the faecal flows into Kommaghatta Lake, based on key informant interviews we qualitatively analysed the different pathways that end at the lake to produce a diagram showing the pathways of faecal pollution to Bengaluru lakes (see Figure 2), based on an existing shit flow diagram (SFD) for Bengaluru produced by Eawag and CDD.(34) This identified potential leaks in the emptying, transport and treatment of offsite sanitation installations, leaks from onsite sanitation into groundwater, and faecal sludge dumping as pollution pathways. Our mapping of Kommaghatta Lake focused on identifying direct and indirect sources that would reveal these pathways (Figure 1).(35) Water sampling included:
a) three points inside the lake;
b) the identified inlets to the lake;
c) the upstream stormwater drain;
d) an overflowing sewer manhole; and
e) two groundwater borewells.
Overview of the sampling locations, Kommaghatta Lake, Bengaluru
Flow measurements at the inlets allowed us to estimate the relative contributions of different faecal flows to the waterbody’s health. All measurements and analysis were undertaken by trained technicians.
At the main inlet and side inlet as shown in Figure 1, composite sampling was done on 3 March 2020 from 6 a.m. to 8 p.m., collecting samples and flow measurements (using an electromagnetic flowmeter) every two hours. There had been no rainfall for at least two days. Samples were refrigerated at 4°C and sent to an accredited laboratory at the end of the day. Laboratory analysis included 40 water-quality parameters, including potential hydrogen (pH), biochemical oxygen demand (BOD), chemical oxygen demand (COD), total Kjeldahl nitrogen (TKN), total dissolved solids (TDS) and dissolved oxygen (DO).(36)
Four additional grab samples were taken on the same day. Two were taken at the lake inlets at 8 a.m. to analyse inflow during peak flow conditions. Another two were taken upstream: one at a stormwater drain originating from the SMV Layout neighbourhood (to the northeast of the lake) and joining the main inlet, and another at an overflowing manhole which lacked connectivity to a sewage treatment plant. The grab samples were analysed for 19 parameters.(37) Two borewell samples, taken on 16 March 2020 from two households close to the lake, were analysed for eight parameters including pH, turbidity, DO, BOD, nitrates and coliforms.
The sudden lockdown during the COVID-19 pandemic made it impossible for us to sample the pathways of faecal sludge dumping in and around the lake and that of partially treated wastewater discharge into the lake. Instead, we obtained secondary data from the CDD Society,(38) which operates a pilot faecal sludge-treatment facility and a partially working decentralised treatment plant within the Kommaghatta Lake catchment area.
b. Informal and semi-structured interviews
Informal conversations with local NGO representatives, government officials and academics contributed to our understanding of the implementation of the city’s sanitation bylaws and provided guidance on our selection of potential participants for semi-structured interviews.(39)
Using social network analysis(40) as a starting point, we identified and purposefully sampled cohorts of key city sanitation stakeholder groups. We identified interview participants using the snowball technique, their willingness to participate, and their accessibility during COVID-19 restrictions. We conducted 18 interviews in all, relying on video conferencing. Participants included five practitioners (PT), two academics (AC), three researchers (RS), three citizen group representatives (CGR), two urban planners (UP), two consultants (CT) and one government stakeholder (GS).(41) The interviews focused on their perceptions, experiences and expert opinions on urban sanitation in the city and its link to waterbody health. Probing questions were asked, and vignettes and anecdotal examples were sought.(42) Using a three-stage “why?” analysis,(43) we prompted participants to further explain their responses. We later triangulated their perceptions with the literature. While water-quality data were collected just for Kommaghatta Lake, the interviews and literature pertained to the larger city.
c. Conceptual system diagram
We coded the semi-structured interview transcripts using Atlas.ti software(44) based on rules for establishing casual links following the Documentary Coding Method.(45) We conducted our analysis until we were able to triangulate the interview responses and conceptual stability was reached. Using the interview data and the casual links between the identified system variables, we created a conceptual system diagram using Vensim PLE v8.1.1 (see discussion and Figure 3 in Section IV d).(46) In addition to the causal links, other links based on the literature filled gaps and made a holistic representation. Finally, we then identified the system levers for change(47) using a thematic analysis. A concept was considered a system lever based on the frequency and credibility of response and its centrality in the feedback loops.
IV. Results and Discussion
a. Pollution pathways in Bengaluru
Water-quality sampling together with the analysed interview data suggest that a significant amount of municipal wastewater ends up in Bengaluru lakes through several pathways (Figure 2). Industrial or chemical wastes were not included.
Pathways of faecal pollution to Bengaluru lakes
As noted, Bengaluru has had thousands of small-scale sewage treatment plants (STPs)(48) installed to supplement its sewer capacities. Recent studies and interviews suggest that most are non-functional(49) and discharge their wastewater into stormwater drains, which also ends up in the lakes as a major pollution source. Informal settlements also discharge faecal waste into stormwater drains or connect illegally to private sewers linked to drains that directly lead to waterbodies. We also observed this in two of the other lakes we considered during the scoping phase. In peri-urban regions, new sewer lines are often laid first, but there is a time lag of several years before STPs are built and last-mile connections established. Until then, sewer lines either leak into the environment or are connected to stormwater systems draining into the lakes.
All interviewees agreed that faecal sludge dumping is not adequately monitored and that truck drivers often dump sludge into lakes or streams leading to a lake. This is corroborated by evidence from Bengaluru’s shit flow diagram, given all the faecal waste and supernatant from the onsite systems not currently being treated. A faecal sludge treatment plant in Devanahalli, 40 km northeast of Bengaluru, is solely for local use and Bengaluru’s trucks are not allowed to empty sludge there.(50)
b. Status of Kommaghatta Lake
The water-quality analysis revealed that Kommaghatta Lake is significantly polluted by wastewater contamination (Table 1).
Results of grab samples collected at three locations inside Kommaghatta Lake
NOTES: The values marked in bold type indicate parameters for which best-use criteria by the regulatory body are not met (see supplementary material S2). MPN refers to most probable number.
KEY: BOD (biochemical oxygen demand); COD (chemical oxygen demand); EC (electrical conductivity); NTU (nephelometric turbidity unit); pH (potential hydrogen); TDS (total dissolved solids).
The BOD levels exceed the maximum permissible level of 3 mg/l (Class B and C in supplementary material S2) in all samples, while ammonium concentrations are above 1.2 mg/l and alkaline pH values above 8.5 (after the wetland). Therefore, the lake water is unsuitable for any of the use classes A–E prescribed by the Central Pollution Control Board. The wetland structure at the head of the lake significantly reduces the BOD, COD, ammonium and turbidity load by 66 per cent, whereas the nitrate and phosphate concentrations increase, due to the fact that contaminated wastewater flows quickly into the lake, in addition to detergents used in washing water entering the lake via the side inlet.
c. Pollution pathways in Kommaghatta Lake
By combining the pathways identified from the interviews (Figure 2) with the water-quality analysis, we further studied three main pollution pathways and qualitatively ranked them based on:
a) their contribution to lake pollution in terms of both concentration of pollutants and quantity of inflow; and
b) qualitative data collected from the semi-structured interviews and the literature.
Pathway 1: Sewage in stormwater drains
Stormwater drains are the primary pollution pathway in terms of loads discharged into the lake. According to a citizen group respondent, stormwater drains “have become the catchment for lakes in an urban context” (CGR-003). Based on the flow measurement data, we observed that the main inlet discharged around 3,000 m3 over the 14 hours of sampling, which peaked at 10 a.m.(51) The stormwater side inlet from Kommaghatta village discharged 70 m3 during the same period and peaked at around 12 p.m. Peak flow times reflect domestic water use. The key results of the composite samples and grab samples from the sampling points are summarised in Table 2.(52)
Key results for composite samples and grab samples
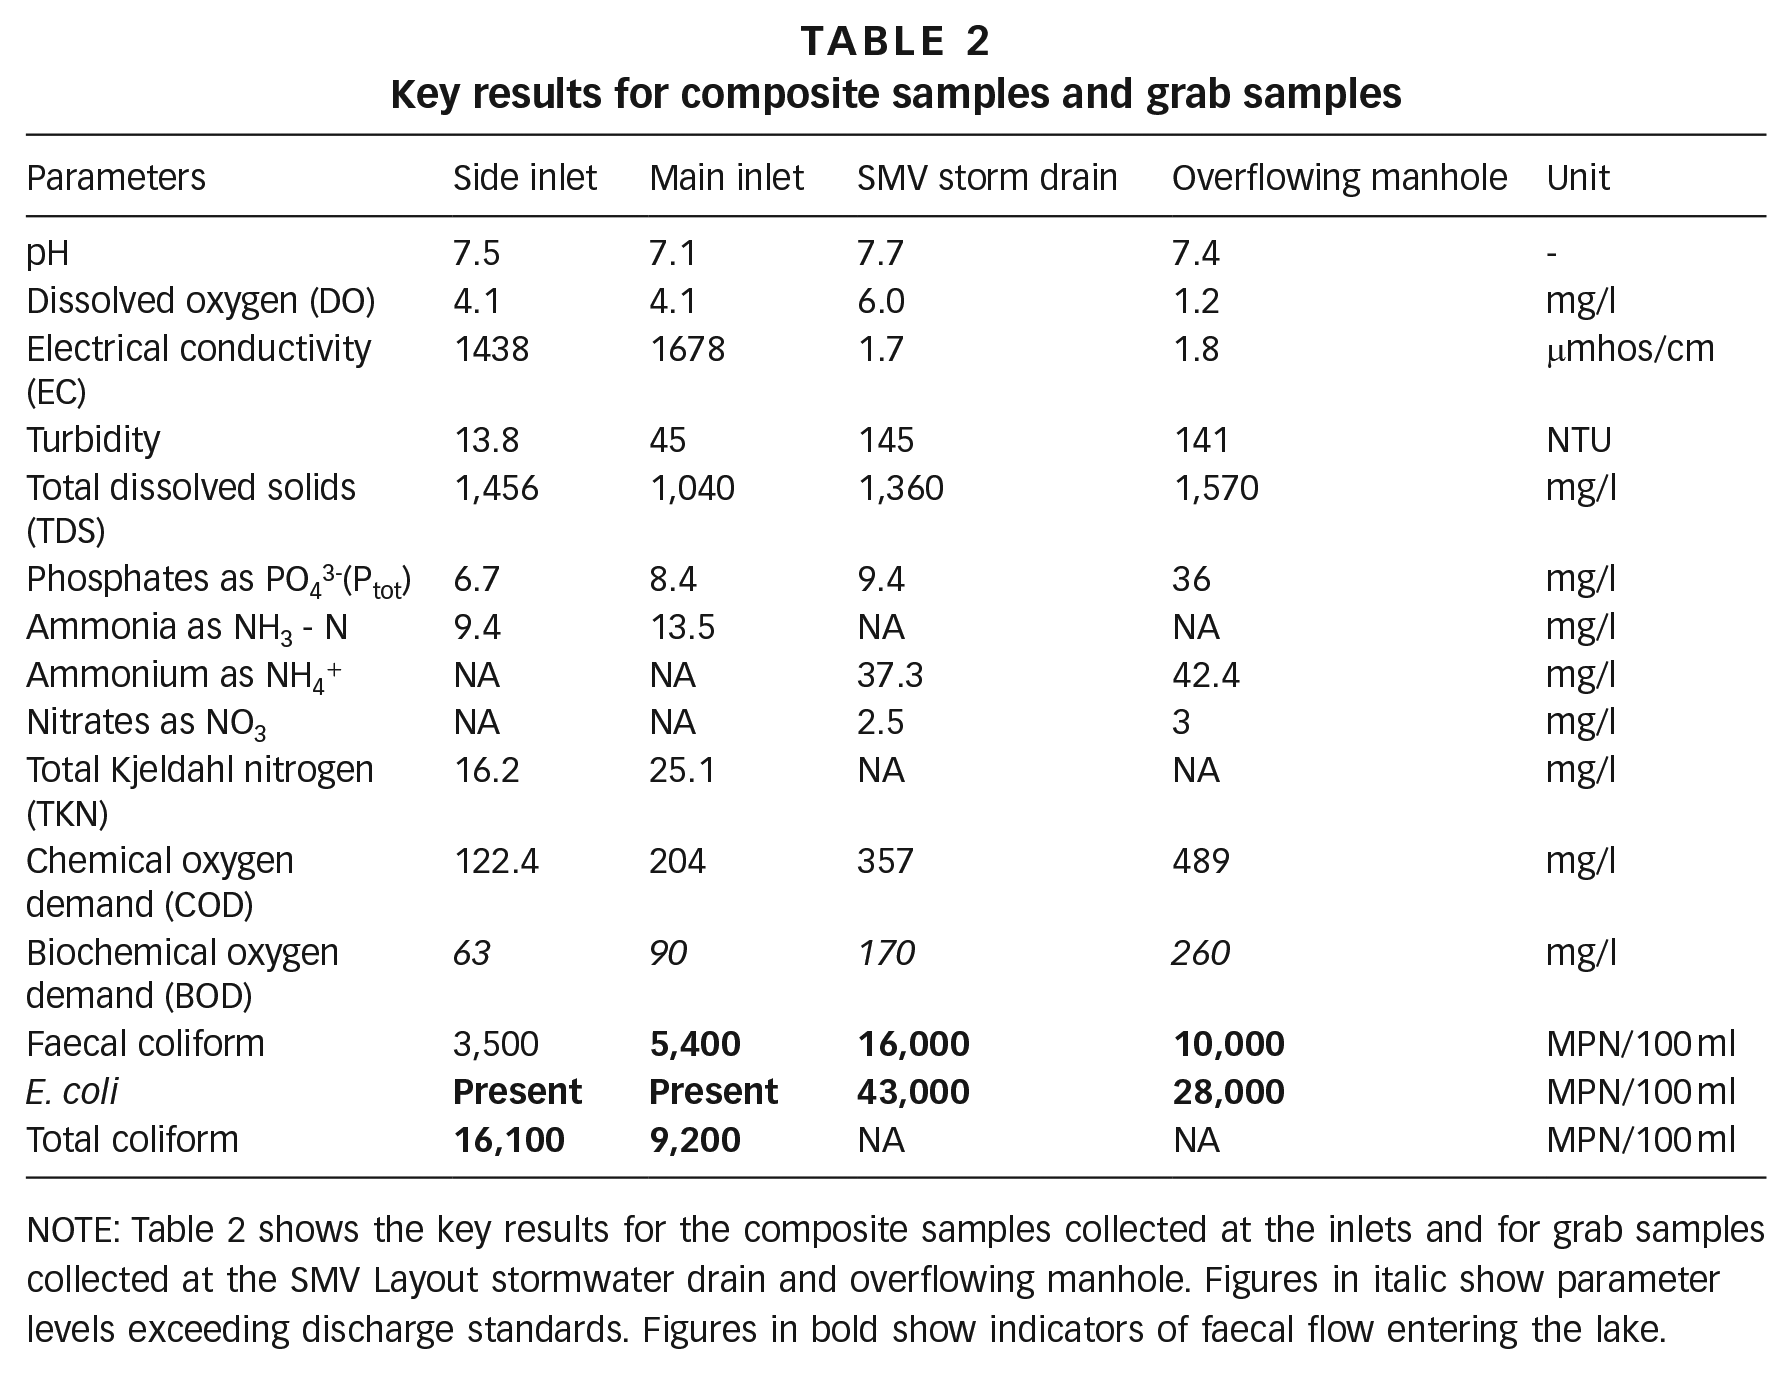
NOTE: Table 2 shows the key results for the composite samples collected at the inlets and for grab samples collected at the SMV Layout stormwater drain and overflowing manhole. Figures in italic show parameter levels exceeding discharge standards. Figures in bold show indicators of faecal flow entering the lake.
Water-quality results show large amounts of coliform bacteria polluting the lake via the side and main inlets (total coliforms at 16,100 MPN(53)/100 ml and 9,200 MPN/100 ml respectively), as well as high concentrations of BOD and COD (side inlet: 63 mg/l and 122.4 mg/l; main inlet: 90 mg/l and 204 mg/l respectively), both exceeding the discharge standards of 10 mg/l BOD and 50 mg/l COD.(54)
Additionally, we observed significant nutrient loading with total Kjeldahl nitrogen (TKN) and phosphates (Ptot) in the side inlet (TKN = 16.2 mg/l, Ptot = 6.7 mg/l) and in the main inlet (TKN = 25.1 mg/l, Ptot = 8.4 mg/l). These values are indicative of typical low-strength domestic wastewater.(55) The concentration and flow data imply that the main inlet discharged almost 270 kg BOD (6,750 people equivalent)(56) into the lake over the 14-hour measurement period, and the side inlet 4.4 kg BOD/14 hours. These are clear indications of sewage inflow via both lake inlets. The difference in pollutant loads reflects the differences of the catchment areas – the main inlet drains predominantly into sewered areas and the side inlet covers areas served mainly by onsite sanitation.
Due to COVID-related restrictions, it was not possible to quantify the contributions of (non-functional) STPs or illegal discharges directly into the storm drains. The expert interviews together with anecdotal evidence and observation during sampling in the study area confirm that these are important sources of pollution of the stormwater drains.
Pathway 2: Untreated or partially treated wastewater from sewer lines
The second most important pathway for pollution of Kommaghatta Lake is untreated or partially treated wastewater from sewer lines discharging into the stormwater drains. In most cases within the central city, sewer lines lead to a centralised STP, where sewage is treated and discharged into a waterbody. But even in such cases, sewage is only partially treated, and still contributes to the lake’s nutrient load. In peri-urban regions, sewers are often directly connected to stormwater drains leading to discharge of untreated waste in the lakes.
Grab samples were collected at the stormwater drains of a sewered neighbourhood called SMV Layout, and from the overflowing manhole (Table 2). The SMV Layout sample had a high concentration of faecal coliform (16,000 MPN/100 ml) and E. coli (43,000 MPN/100 ml), indicating sewer leakage or failure to connect to STPs. Also, some households might still possess onsite systems which illegally discharge into the stormwater drains. The overflowing manhole near the lake shows the highest concentration of BOD (260 mg/l) and COD (489 mg/l) as well as the presence of pathogens such as E. coli (10,000 MPN/100 ml) and faecal coliform (10,000 MPN/100 ml) in the sample. These values indicate that the overflow water is untreated raw sewage that may reach the main inlet via preferential flow via the subsurface towards the lowest point (the lake), located only about 40 m away.
The characteristics of the overflowing manhole and the wastewater from a defunct treatment plant in the neighbourhood are comparable, reflecting the problems from the numerous defunct small-scale STPs across Bengaluru. Studies show the lack of monitoring as a main reason for their failure.(57)
Pathway 3: Unregulated disposal of faecal sludge and leakage of onsite sanitation systems
The third pathway is the unregulated disposal of faecal sludge by desludging trucks into lakes or stormwater drains flowing into lakes. The overflow/leaks from onsite sanitation systems into the aquifer lead to contaminated groundwater and also act as a pollution pathway to the lake. In the Kommaghatta Lake, we did not observe faecal sludge dumping. However, dumping is common in other parts of the city(58) and experts and residents say that sludge is dumped into nearby farms or into the waterlogged area where the overflowing manhole was sampled. Such intermittent sludge discharge may result in a sudden increase in BOD, COD and total solids in the lake inflow. In addition, results from the borewell sampling show the presence of nitrates and faecal coliforms, making borewell water unsafe for domestic water consumption (Table 3).
Results of borewell samples
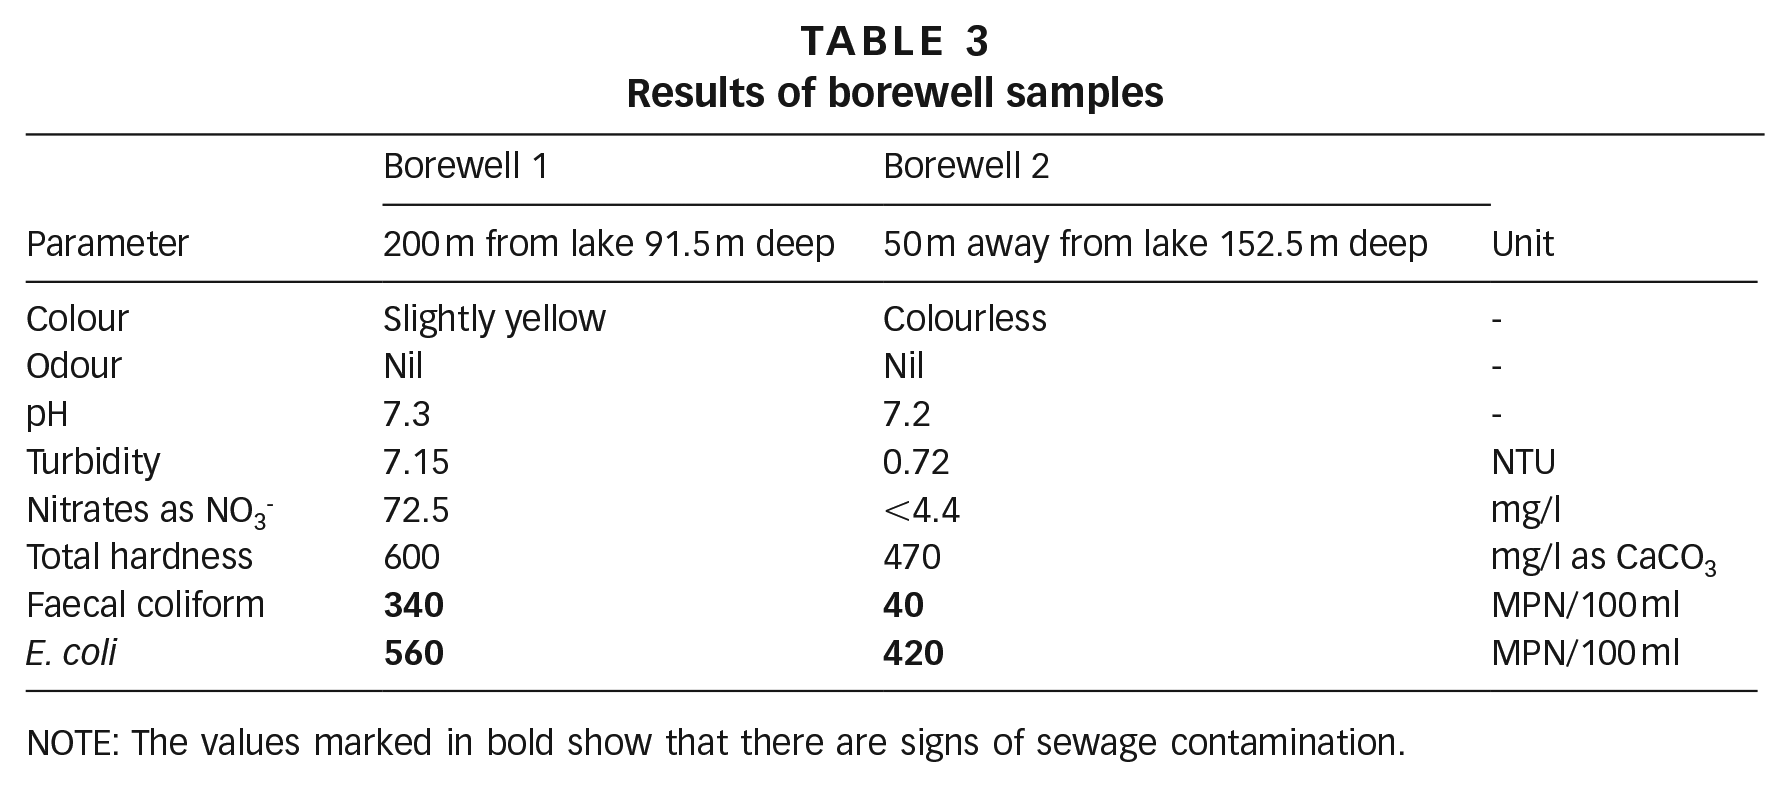
NOTE: The values marked in bold show that there are signs of sewage contamination.
Borewell 1, in the neighbourhood where onsite sanitation systems predominate, has a much higher concentration of nitrates (72.5 mg/l), faecal coliform (340 MPN/100 ml) and E. coli (560 MPN/100 ml). The borewell water is pumped into an underground sump from which the water is supplied to households. It is possible that cross-contamination with sewage occurs from the household’s single-pit sanitation system, consisting of five concrete rings with seepage holes.
For Borewell 2, lower values of faecal coliform (40 MPN/100 ml) and E. coli (420 MPN/100 ml) were measured, likely due to the borewell’s location in an area with a simplified sewer system. The presence of E. coli and faecal coliform could indicate pollution of the groundwater aquifer from other sources, whether onsite sanitation systems or even Kommaghatta Lake itself given its high nitrate and pathogenic load. Additionally, pollutants in the borewell water eventually end up in the lake after domestic use and discharge.
d. System levers for urban sanitation in Bengaluru
After identifying the relevant pollution pathways for Kommaghatta Lake, we asked interviewees how representative these pathways were for Bengaluru lakes and the reasons behind their existence. The “why?” analysis helped capture the causal links underlying the three identified pollution pathways. The resulting conceptual systems diagram is shown in Figure 3, which shows several system levers influencing urban sanitation dynamics in Bengaluru. Some were reported more frequently; for example, “rapid urbanisation” was reported by 14 of the 18 participants as a reason for failing urban sanitation.
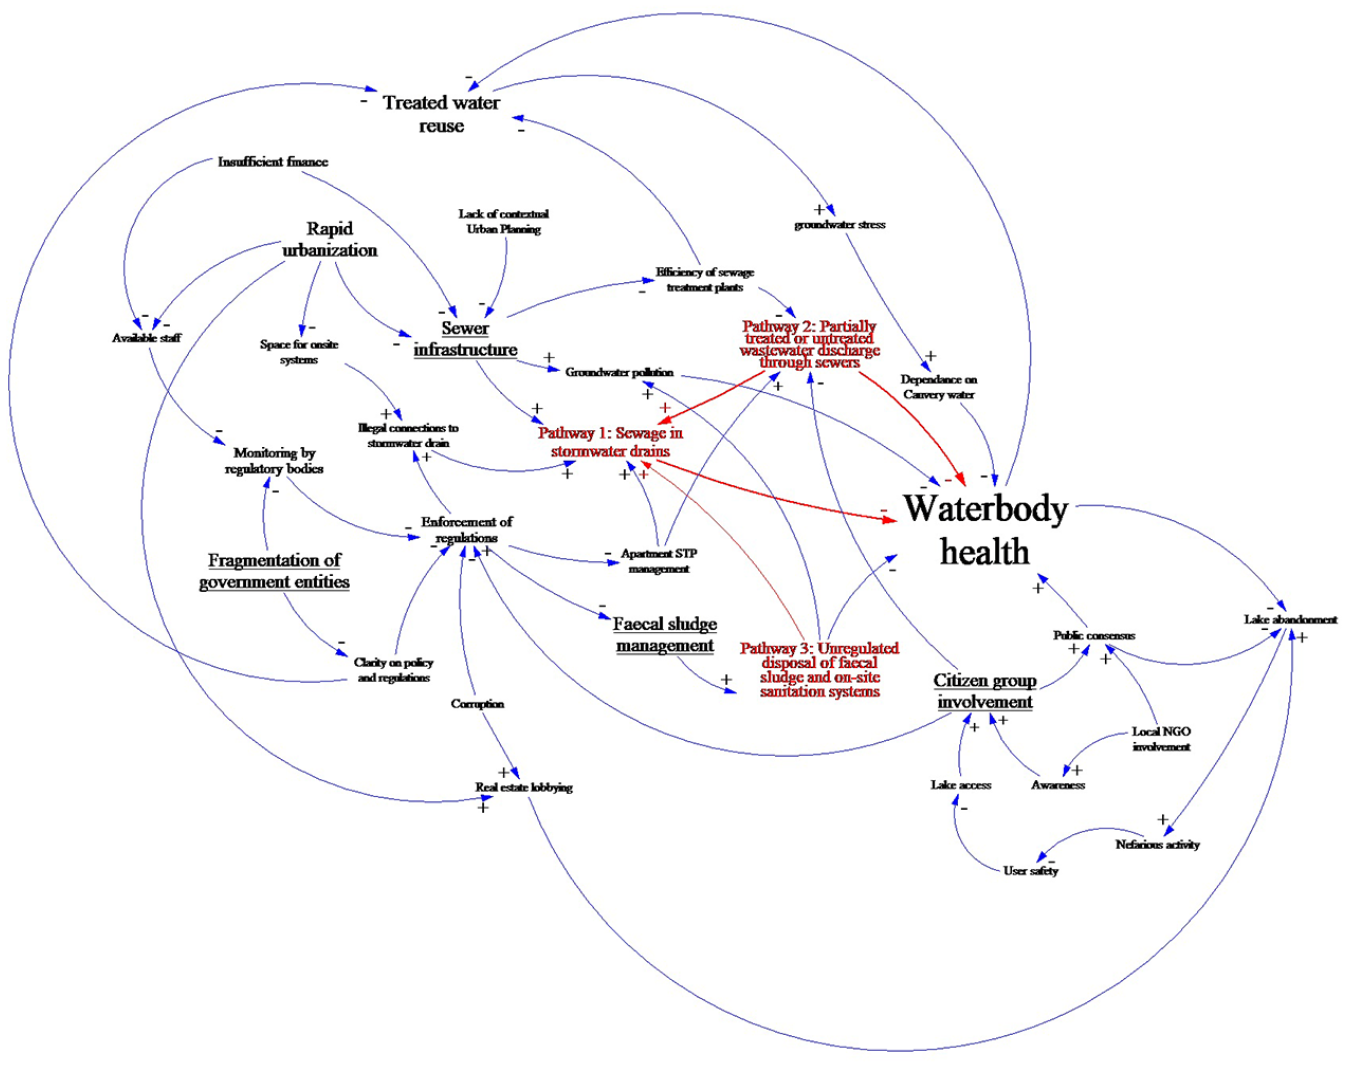
Conceptual systems diagram of reported causal links between urban sanitation and waterbody health in Bengaluru
The conceptual systems diagram shows waterbody health and its pollution pathways are influenced by a wide range of social, technical, institutional and financial variables. The several causal links that tie these variables together are not just technical but also driven by social factors such as behaviour, perceptions and institutional arrangements.
For example, for Pathway 1 (stormwater carrying sewage into waterbodies) factors include:
a) rapid urbanisation (an external variable);
b) illegal connections by the residents disposing of sewage into stormwater drains;
c) inadequate sewerage infrastructure linked to technical and financial aspects; and
d) lack of monitoring by authorities to curb discharge of sewage into the drains.
Thus, a technology-focused approach would be inadequate to address the issue of deteriorating waterbody health. This is evident also from a study evaluating rejuvenated lakes in Bengaluru, where quick fixes and technocratic solutions packaged as “waterbody rejuvenation” failed to improve water quality.(59) Rather, holistic planning is necessary, addressing the problem from a multi-scalar, multi-disciplinary perspective. This study identifies three key dynamic levers which need to be reinforced or countered to improve waterbody health in Bengaluru:
a) fragmentation of government entities (to be minimised);
b) faecal sludge management (to be maximised); and
c) citizen group involvement (to be maximised).
We elaborate on the significance of these levers and their influence on urban waterbody health and public health in the city in the subsequent sections.
Lever 1: Fragmentation of government entities
Governance in a rapidly urbanising city like Bengaluru is a multi-layered issue, with problems ranging from lack of financial and human resources to poor inter-agency cooperation and corruption (interviewee AC-001). There are also multi-dimensional factors for lake pollution, including lake management, provision of sanitation infrastructure, enforcement of regulations and city sanitation planning.
Responsibility for the reported lack of urban governance is contested. While the authorities claim they are doing their best to improve the situation, citizen groups and local NGOs claim there is no collaboration with beneficiaries, and that the authorities follow a top-down approach, emphasising infrastructure more than the social aspects.(60) Interviewees point to a lack of accountability, transparency and inclusivity: “We want to be involved right from the planning stage until the implementation of the systems” (interviewee CGR-003).
While there are reports of change in recent years due to public-interest litigation on lake activities filed by the local public, the authorities are considered only to cooperate within their institutional framework, strongly influenced by politics within the governance system (interviewee CGR-002).
Another reason for poor urban water governance in Bengaluru is the lack of clarity regarding the respective responsibilities of the several agencies involved.(61) For example, the utility, BWSSB, is responsible for the sewerage and treatment of wastewater, while the municipal administration, Bruhat Bengaluru Mahanagara Palike (BBMP), manages the city’s lake rejuvenation. According to one respondent, “Unless there is a cooperation between these two agencies, the chances of the lake being in a healthy state are very low” (interviewee CGR-003). In addition, the Pollution Control Board and Lake Development Authority are responsible for monitoring the pollution in the lake, and are reported to focus more on industrial pollution, while BWSSB imposes blanket fines on neighbourhoods believed to be polluting the lake (interviewee CGR-001). On the other hand, the municipal administration deems local citizens to be watchdogs for the lake and responsible for enforcing municipal bylaws. The complexity of lake regulation in the city reinforces a tendency for authorities to turn a blind eye until the lake is heavily polluted.
The wastewater bylaws and regulations are formulated and enforced by the Karnataka State Pollution Control Board at the city level, while the municipal administration monitors it. At national level, different agencies have different recommendations on discharge standards, which are blindly endorsed, causing confusion (interviewee RS-003).(62) Most interviewees also confirmed the tension between practitioners and the authorities related to frequent changes to stringent wastewater discharge standards. The reason for setting such stringent measures is that better results are more likely to be achieved if the standards are set very high. As reported by a Pollution Control Board official to one of the interview participants: “Only if we set 10 mg/l BOD, will we get citizens to treat it to 30 mg/l” (interviewee PT-005).
The impracticality of the standards set by the Pollution Control Board is corroborated by other interviews (interviewees CT-002, RS-003, UP-002) and by the literature.(63) The lack of ownership, confusion on discharge standards, and poor monitoring capacities together make wastewater regulation a challenge across the city (interviewees AC-001, PT-005, CGR-003). According to one interviewee, “Everything is on paper, but nothing is enforced or regulated by the authorities” (interviewee RS-003). Finally, a lack of available, accessible data on the functioning of the existing treatment plants leads to a lack of transparency in urban water and sanitation governance (interviewee PT-003).
Lever 2: Faecal sludge management
Faecal sludge management has gained much attention since the announcement of the Clean India Mission in 2014 and the subsequent release of the National Policy on Faecal Sludge and Septage Management in 2017.(64) The increase in provision of household toilets, in the absence of accompanying sanitation-management measures, makes faecal sludge management a rising concern in Indian cities.
However, aspirations for a 100-per-cent-sewered city, and the lack of a holistic vision, result in insufficient political will or funding for faecal sludge treatment plants in the city. There are no desludging trucks operated by the city utility or administration, and dumping by private operators is hard to monitor and regulate. Two STPs in the city originally permitted the disposal of faecal sludge into their facility, but this was discontinued due to the increased concentrations in organic load and industrial contamination brought in by the private operators (interviewees PT-004, PT-003). The lack of adequate faecal sludge treatment plants motivates truck operators to dispose of the waste wherever it is convenient and to bribe local law-enforcement officials (interviewees AC-001, AC-002, CT-001).
Regarding onsite infrastructure, most containment systems are reportedly not constructed according to the Central Public Health and Environmental Engineering Organisation (CPHEEO) standards.(65) They are not lined, which allows leakage into the ground, potentially contaminating the aquifer. Space constraints mean septic tanks have no soak pits, and overflow is connected to a stormwater drain. Citizen group interviewees believe that onsite systems pose no threat to aquifer contamination; others feel that anecdotal evidence points to a definite link with contaminated open wells (interviewees CGR-002, CGR-003). A recent study shows that Bengaluru’s groundwater is indeed polluted with sewage from leaking sewer pipes.(66) But because no research evidence isolates the contribution of onsite sanitation systems to this issue, it remains a blind spot.
Experts also claim that onsite sanitation system construction is not monitored by the municipal engineers who approve the design, but rely on the working knowledge of the masonry workers. There has been some effort to educate these workers on the impact of deviating from the guidelines (interviewee CT-002). And although there is a national-level policy on faecal waste management, it has not been actively taken up by Bengaluru. The expanse of the city combined with a lack of clarity about government agency roles makes it harder to monitor and regulate the bylaws that are in place. This leads to informal (and illegal) arrangements and quick disposal of faecal sludge (interviewee RS-001), at a cost to the environment.
Lever 3: Citizen group involvement
There is significant environmental activism in Bengaluru, particularly focused on lake protection, often spearheaded by NGOs, and driven by the city’s water stress coupled with worsening lake-water quality. Informal resident groups have resorted to public-interest litigation in the courts (interviewees RS-001, CGR-003). These tactics have been amplified by social media(67) and the in-migration of a more educated labour force that takes part in environmental activism.
All interviewees agree that citizens are becoming better informed and willing to collaborate in pushing the authorities to fix sanitation issues in their neighbourhoods. According to one interviewee, “We often forget that we live in a democracy and we could bring about a change if we wanted to” (interviewee CGR-003). This increased stakeholder involvement is changing the city’s top-down approach to service delivery. Through the involvement of informed experts, NGOs and citizen groups have managed to push government agencies towards a more holistic approach to waterbody rejuvenation, which includes conservation of biodiversity and other ecological aspects (interviewees PT-001, PT-005, CGR-002).
Recreational users and residents in the lake vicinity are affected by the deterioration of waterbody health, and bird watchers are often among the first to speak up about the condition of lakes and the loss of biodiversity.(68) The vicious cycle of deteriorating lake health results in a dwindling number of users (mainly for recreation), leading to abandonment and further deterioration of lakes. One respondent argued that a lake must be safe, accessible, and have motivated custodians to restore and maintain it (interviewee PT-003). Another pointed to the political incentive for elected representatives to improve lake health to appease voters (interviewee CGR-003).
Jakkur Lake, where citizens participate in lake-related activities from planning to monitoring sewage inflow, is an exemplary model for many NGOs. The government lake authorities encourage such citizen participation, given limitations in their own capacities (interviewee CGR-002), and an effective working partnership between the municipal administration BBMP and citizen custodians of the lake has been established. Citizen groups also create awareness among residents with respect to disposal of solid and liquid waste.(69) In some cases, it is reported that “bourgeoisie environmentalism”(70) among middle- and upper-income residents ends up marginalising other communities, such as fisher folk or textile launderers, who depend on the lakes for their livelihoods (interviewees AC-002, PT-004). Interestingly, it is also often the middle- and upper-income apartment complexes that operate small-scale STPs and discharge untreated or partially treated wastewater into stormwater drains or directly into the lakes (Pathways 1 and 2). There were also reports of developers encroaching on lakes, causing flooding and increasing public health risks for the poorer communities around the vicinity (interviewee CGR-002).
These three levers could be used to improve the health of Bengaluru waterbodies. Regarding the first lever, the city administration should clearly define roles and responsibilities in its line departments and coordinate with other public and private entities to ensure adequate financial and technical capacities and to prevent overlapping responsibilities and jurisdictions. Second, BWSSB, the utility in charge of sanitation provision, should provide for adequate faecal sludge management by constructing new treatment plants and enabling co-treatment in the existing STPs. Finally, the city government and the utility should involve citizen action groups more meaningfully to incorporate local knowledge.
V. Citywide Inclusive Sanitation for Better Public and Environmental Health
Citywide inclusive sanitation (CWIS) could provide a useful approach to act on these levers to create systemic change.(71) The concept of CWIS, while still nascent, is rapidly gaining traction in the development sector.(72) The six Manila principles of CWIS(73) ensure both provision of safe and equitable sanitation, and improved urban waterbody health, among other objectives (see also S11 in the supplementary material, showing the relevance of the six principles to the case of urban lake pollution in Bengaluru).
In this section, we provide examples of possible actions using the CWIS approach and consider the benefits of CWIS to public and environmental health. These recommendations for action are aimed mostly at service providers: in this case, the utility (BWSSB) and the municipal corporation (BBMP).
a. Principle 1: equity
First is the issue of equity. Low-income groups in rapidly urbanising cities often suffer from poor access to sanitation and end up living close to polluted urban waterbodies.(74) These groups are caught in a vicious cycle. Due to inadequate sanitation services, they are forced to discharge faecal waste into the very waterbodies that then expose them to health hazards. The CWIS approach aims to ensure citywide provision of adequate and affordable access to sanitation, paying special attention to those groups marginalised by income, gender, caste, etc. It works to remove diffuse municipal pollution found in lakes and also provides adequate safely managed sanitation to the most vulnerable, thereby bridging social divides(75) and democratising access to clean waterbodies. In the case of Kommaghatta Lake, we observed that low-income communities living closer to the lake were exposed to the highest faecal contamination. With a CWIS approach, appropriate and priority interventions would be made, for example utility-managed faecal sludge management where there are limited finances, so that no community is left exposed to faecal contamination. This would replace the current approach of laying sewers early on without any certainty of connection to an STP, which leaves communities living closest to the lake most vulnerable to faecal exposure, while other communities connected to sewers are not directly exposed.
b. Principle 2: environmental and public health
CWIS specifically refers to the management of the entire sanitation service chain – from containment to treatment and disposal – as essential components of achieving public and environmental health. It addresses sanitation issues holistically, ensuring every component of the service chain is planned to prevent contamination of the urban environment.(76) In this case study, sewers have been laid without consideration of the treatment and end-use stages. By planning for the entire value chain (including the treatment stage) from the beginning, the pollution pathways established in Figure 3 would have never existed. By retrofitting solutions using the CWIS approach in Kommaghatta Lake, each of the stages of the sanitation value chain would be systematically considered. This means that the containment (Pathway 3), conveyance (Pathway 1) and treatment (Pathways 2 and 3) would be addressed, thereby improving lake health.
c. Principle 3: mix of sanitation systems
CWIS proposes a mix of sanitation systems, which includes sewers, small-scale sanitation systems and faecal sludge management, to coexist at a city level. Bengaluru has all three, with associated pollution pathways into lakes. A mix of solutions is required that are locally appropriate at neighbourhood level, affordable and accountable.(77) For example, faecal sludge management or small-scale sanitation systems could cater better to the needs of peri-urban regions, such as the study site in Bengaluru, which faces issues of ad hoc containment, transport and treatment in the absence of a water supply, trunk sewers, or even fund allocation.
d. Principle 4: comprehensive planning
Perhaps the most significant point in the case of lake pollution in Bengaluru is the lack of comprehensive planning. Lack of inclusion of citizen stakeholders in the planning process, fragmentation of relevant agencies for managing sanitation and urban waterbodies, and short-term goals have resulted in the state of Bengaluru’s lakes. CWIS systematically promotes planning that is stakeholder inclusive, incremental and coordinated both vertically (along the service chain) and horizontally (between related urban sectors such as water supply and solid waste).(78) This provides benefits to the management of urban waterbodies with direct linkages to these sectors. It also helps the voices of the vulnerable communities (such as those living close to the lake) to be heard in the planning stages.
e. Principle 5: monitoring and regulation
The CWIS approach emphasises that a mix of technologies and service models would be functional only in the presence of a regulatory framework that clarifies the actors and the functions of responsibility, accountability and resource management.(79) As discussed earlier, there is a lack of monitoring and enforcement by the lake and sanitation authorities. The CWIS framework encourages close monitoring of the city’s various sanitation systems, and could potentially identify non-functional decentralised systems and keep sewage from entering stormwater drains and contaminating lakes. A clear accountability and coordination mechanism for sanitation and lake health would eliminate the issues of fragmented government entities and overlapping jurisdiction. This particular principle requires systemic change in the governance of sanitation and lakes in Bengaluru and not just adapting procedures during the intervention period. A direct measure that BWSSB could take would be the safe collection and treatment of faecal sludge from households reliant on onsite sanitation and the Pollution Control Board could closely monitor and curb illegal discharge of faecal waste into the environment.
f. Principle 6: mix of business models
Finally, CWIS calls for a mix of business and service models that could include the private sector in sanitation service provision for the city. The limited technical, financial and human capacities and fragmentation of city government departments could be augmented with private-sector involvement. Local communities could also play a coordinating role in urban waterbody management, which has significant potential according to an analysis of the socio-political ecology of lakes in Bengaluru.(80) This approach would not only stimulate greater ownership of the resources, but also create an enabling environment for alternative and regulated sanitation service models to emerge. For example, private de-sludgers could be regulated to provide scheduled faecal sludge emptying services, with the sludge then co-treated in existing treatment plants.(81)
g. Recommendations for further research and development
While CWIS provides an overarching framework with six key principles to consider and a holistic and systemic approach for planning sanitation, these must be embedded in a larger multi-actor and multi-dimensional policy process that is geared towards addressing the dual needs of sanitation and urban waterbody health. This includes a need for further research into developing frameworks and methods for multi-actor engagement, and process designs for incremental and inclusive sanitation planning. CWIS as a theoretical lens also has its limitations since the principles themselves are broad in scope and are not adequately operationalised according to the context. Therefore, its use in this paper is still at a high level with few select examples offered as solutions. We acknowledge that other solutions within the CWIS framework may also be suitable for solving the challenge of sanitation and waterbody health in Bengaluru.
VI. Conclusion
In the case of lake pollution in Bengaluru, our mixed-methods study has established a clear link between the sanitation-related factors affecting public and environmental health and several social, economic, institutional and political variables. Three major pollution pathways were validated for Kommaghatta Lake, based on water quality analyses uncovering their relative contributions. The predominant pathway is through stormwater drains, via:
a) direct discharge of wastewater from informal settlements in the vicinity;
b) partially treated wastewater from small-scale STPs;
c) overflow from onsite containment systems; and
d) dumping of faecal sludge by the desludging trucks.
Typical for any complex, persistent problem, underlying dynamic factors explain and reinforce this situation. The conceptual systems mapping identified these key factors and the dynamics between them. It is evident that poor waterbody health is driven by the interactions of social, technical, institutional and financial variables acting together within this urban setting. The pollution pathways are closely intertwined in this network of causal links, making a narrow approach focused on provision of technical infrastructure ineffective in addressing deteriorating waterbody health. Non-technical levers also need to be addressed while planning sanitation and waterbody-related infrastructural improvements. We have identified three such levers for bringing about positive change:
a) address the fragmentation of government entities;
b) improve faecal sludge management; and
c) foster citizen group engagement.
These are not standalone solutions but rather complement each another, along with the required technical interventions. Citywide inclusive sanitation provides a holistic approach that brings these identified levers together and provides a framework for a systemic way forward. It forms the basis for designing incremental steps towards policy change, appropriate service models, and inclusive planning and management with stakeholders. The CWIS framework provides the principles for interventions designed to ultimately help achieve both environmental and public health outcomes.
It is important to note that the identified pollution pathways and resultant system levers may vary. In this study, water-quality assessment was conducted for one representative lake and faecal pollution pathways were corroborated with the shit flow diagram for Bengaluru. The approach should be replicated for other lakes in Bengaluru to validate the findings and gauge their general applicability across the city. In other cities, for which no validated shit flow diagram is available, multiple waterbodies could be assessed for establishing the faecal pathways and subsequently the qualitative analysis can be carried out.
Supplemental Material
sj-pdf-1-eau-10.1177_09562478221084243 – Supplemental material for There is no environmental health without public health: exploring the links between sanitation and waterbody health in Bengaluru, India
Supplemental material, sj-pdf-1-eau-10.1177_09562478221084243 for There is no environmental health without public health: exploring the links between sanitation and waterbody health in Bengaluru, India by Clifford Godwin Sundar Navamany, Abishek Sankara Narayan and Lisa Scholten in Environment & Urbanization
Footnotes
Acknowledgements
The authors would like to acknowledge the guidance provided by Dr Boris van Breukelen, Dr Saket Pande and Dr Christoph Lüthi during the bulk of this research as a master’s thesis project out of which this study has emerged. The in-kind support from CDD Society in Bengaluru by supporting this study and providing access to their facilities is also gratefully acknowledged. Furthermore, we would like to thank all the interview participants for their time and insights.
Funding
The authors disclosed receipt of the following financial support for the research, authorship, and/or publication of this article: from Eawag: the Swiss Federal Institute of Aquatic Science and Technology as well as the Lamminga Fonds of TU Delft, Faculty of Civil Engineering and Geosciences.
Supplemental Material
Supplemental material for this article is available online.
4
Data for 2017 sourced from UNICEF and WHO (undated).
11.
14.
18.
Regulation and governance of water and sanitation is undertaken by the state government while the central government prescribes broader policy goals.
19.
32.
Kommaghatta Lake is situated about 800 m from the administrative boundary of Bengaluru. Most of its catchment lies within the city limits, including all upstream lakes which contribute to its inflow.
33.
In this study, we have restricted ourselves to identifying the system variables and defining the polarity of their relationship (X positively or negatively impacts Y). To avoid confusion and to clarify that process relationships were not mathematically defined and subsequently modelled, we call it a “conceptual system dynamics model”.
34.
Eawag and CDD Society (2019). See also ![]() , showing the relevant components of the SFD for Kommaghatta Lake.
, showing the relevant components of the SFD for Kommaghatta Lake.
35.
For details about the components for the SFD, see the table in supplementary material S3. For the sampling scheme, sample analysis, and water-quality parameters tested, see ![]() (parameters test) and S5 (sample collection form).
(parameters test) and S5 (sample collection form).
36.
See supplementary material S4 (parameters test) and ![]() (results of composite sample).
(results of composite sample).
38
CDD Society is a not-for-profit organisation that innovates, demonstrates and disseminates decentralised nature-based solutions for the conservation, collection, treatment and reuse of water resources and the management of sanitation facilities.
39.
Our research complied with all requirements as approved by the Delft University of Technology, Human Research Ethics Committee (reference 1028).
41.
Government stakeholders were largely inaccessible due to local elections and COVID-19 restrictions at the time.
43.
Our objective for using this method was to establish cause–effect relationships, which is done by asking the respondent a series of follow-up “why” questions. The three-stage “why?” analysis used in this study is an adaptation of the Five Whys Technique by Serrat (2017) using three stages of “why?” instead of five. See ![]()
47.
We define system levers for change as the key variable which influences the mapped system which can be leveraged to create a desired outcome.
48.
Small-scale STPs serve between 10 and 1,000 households at the point of generation and predominantly use technologies such as Activated Sludge Process (ASP) and Sequential Batch Reactors (SBR) (Klinger et al., 2020).
53
Most probable number (MPN).
56.
61
62.
Jamwal et al. (2016); Klinger (2020); ![]() .
.
63
64.
AMRUT (2017); ![]() .
.
70.
Bourgeoisie environmentalism in this paper is defined as the attitude of an economically privileged class of citizens laying claim to a particular waterbody for its aesthetic and recreational utility.
71.
73.
Following a global urban sanitation conclave in Manila in 2018 where there was discussion around CWIS, a set of draft principles was formed and then widely reviewed with experts, including the Sustainable Sanitation Alliance’s working group on cities in the course of 2019.
75.
References
Supplementary Material
Please find the following supplemental material available below.
For Open Access articles published under a Creative Commons License, all supplemental material carries the same license as the article it is associated with.
For non-Open Access articles published, all supplemental material carries a non-exclusive license, and permission requests for re-use of supplemental material or any part of supplemental material shall be sent directly to the copyright owner as specified in the copyright notice associated with the article.