
Abstract
There is an increasing need to study urban food security in the global South. This is because of the monetization of food in urban areas and compounding vulnerability from other deprivations such as lack of access to infrastructure. We assess these claims in this paper, based on a city-wide household survey in Bengaluru (Bangalore) carried out in 2016 that used experiential measures of food security like the Household Food Insecurity Access Scale. We find that income and consumption do not have a clear relationship with food insecurity. However, socioeconomic dimensions like education level and wage type of the household head, and infrastructural dimensions like housing typology, and water connection are strongly related to food security. Through this work, we attempt to establish the baseline evidence on the current status of food security in Bengaluru, to lay the foundation for a future research agenda on urban food security in India.
I. Introduction
Recent evidence on food security points to an increase in the number of undernourished people over the past few years,(1) despite renewed global policy emphasis and consensus on the need to end hunger and poverty worldwide.(2) This is particularly true in the South Asian context: although there have been substantial gains in food production in India over the past few decades, the region is home to the largest numbers of undernourished people in the world.(3) There is also a growing recognition of the importance of cities and urban regions in addressing questions of development and sustainability. The New Urban Agenda adopted at the 2016 Habitat III conference and the Sustainable Development Goals adopted in 2015 highlight the significance of cities in achieving equity and sustainability.(4) Despite this, the question of access to nutritious and high-quality food in urban areas across the world has been understudied.(5)
The question of food security takes on particular importance in urban areas of the global South that are undergoing substantial and rapid transformations, especially in Asia and Africa. These are also places with large concentrations of urban poor as well as high levels of inequality, informality, and inadequate access to infrastructure.(6) Substantial intra-urban variation means that some people in urban areas may be worse off than the rural poor in material terms.(7) In addition, these are not only locations that already have high food insecurity; they will also bear a disproportionate burden of any reductions in food availability, access and quality due to climate-related variability and extreme events.(8)
However, there has been little work on understanding food security at the urban scale, especially in the Indian context. This is the first study of urban food security at a city scale in India that focuses on self-reported measures of food access and food intake using experiential metrics. We analyse food insecurity in Bengaluru (Bangalore), India, through a household survey covering 1,698 households across the city. Through the study, we assess the prevalence of food security at a city scale based on self-reported experiences by households, and analyse the relationship of food security with income and non-income factors that affect food security, such as educational attainment, access to infrastructure, household structure, housing type, migration status, and access to social safety nets. This research is part of a larger comparative study on food security in seven cities of the global South, the Hungry Cities Partnership (HCP). Similar studies have been carried out in the other cities of the partnership.(9)
The paper is organized as follows: the following section reviews the literature on food security measurements, and on the prevalence of urban food insecurity. Section III explains the approach of our study and the methods employed. Findings are presented in Section IV, and are discussed in Section V. Section VI concludes and presents an agenda for future research on urban food security in India.
II. Literature review
a. Measuring food security
The most widely accepted definition of food security, which was adopted at the 1996 World Food Summit, takes multiple dimensions of food security into account. It states that food security exists “when all people, at all times, have physical and economic access to sufficient, safe and nutritious food to meet their dietary needs and food preferences for an active and healthy life”.(10) The definition covers a range of issues that could hinder the attainment of food security; it encompasses not only insufficient quality and quantity of food intake, but also anxiety about food supply and access. Numerous conceptual and measurement problems have been identified with regard to measuring a complex, unobservable phenomenon such as food security. Despite this, many indicators have been developed over the years to assess food security because of its policy significance.(11)
In earlier development literature, achieving food security was largely viewed as a matter of increasing food supply or availability.(12) This is what Barrett(13) has referred to as “first generation” metrics of food security, while “second generation” metrics look at food security as a function of income, social safety nets, food prices, and other factors, which led to the creation of a set of complicated indicators that also incorporated anthropometric data. In India, much of the public assistance for food security through the Public Distribution System (PDS) is targeted through Below Poverty Line cards that are allocated based on income or consumption. A “third generation” of metrics have now emerged that focus on people’s self-reported experiences of food security. These are simpler and more cost-effective than second generation metrics, and have been tested and validated in multiple contexts.(14)
These experiential measures are rooted in the assumption that households react in a predictable way to reduced access to food, and that data measuring this can be collected and quantified to study the degree of insecurity.(15) The potential explanatory power of these metrics has been assessed by a cross-cultural review of ethnographic accounts of food security, which finds that insufficient food quantity, inadequate food quality, and uncertainty and worry about food were significant parts of food insecurity experiences across different cultural contexts, as was concern about the social acceptability of food sources.(16) These metrics move beyond such proxy measures as food production and supply,(17) or income, calories and nutrient intake,(18) which are also unable to capture quality or safety of food intake, or anxiety about having the next meal.(19)
Experiential scales such as the Food Insecurity Experience Scale (FIES) have been identified as being among the sub-indicators to assess global progress against SDG Goal 2 (Zero Hunger).(20) The FIES has also been used to assess food insecurity across countries by the Food and Agriculture Organization (FAO), which has found that prevalence of severe food insecurity according to this scale is 10.7 per cent for South Asia (compared with 14.8 per cent undernourishment, according to the same report).(21)
Experiential measures have the potential to add a new approach to the way food security has been studied and understood so far. However, regardless of the choice of metrics, urban food security remains an under-researched field within studies on food security.
b. Urban food security
According to the limited research on access to nutritious and high-quality food in cities, urban areas on average perform better than rural areas on indicators such as poverty and food security. However, these numbers mask substantial intra-urban inequality, and there might be several sub-populations in urban areas that are far more vulnerable than those in rural areas.(22) To illustrate, writing about the African context, Crush and Frayne argue that there has been a “rural bias” in the African agenda on food, and they review several studies that show that hunger, malnutrition, and dietary insufficiency are worse among the urban poor than the rural poor.(23)
There are multiple reasons that urban food security needs to be treated as conceptually distinct from rural food security. One is that urban food insecurity can be compounded due to other deprivations, such as a lack of infrastructure access. Disease exposure, arising due to factors such as a lack of sanitation facilities, has been shown to affect nutrition by hampering the efficient use of nutrients consumed.(24) Urban poverty is often accompanied by a lack of access to secure employment,(25) basic infrastructure, services, social protection and healthcare,(26) all of which affect the ability of households to cope with risks. These multiple deprivations exacerbate the health impacts of food insecurity.(27)
A second reason is that the urban transition can have an impact on the accessibility and affordability of food.(28) Food is a monetized commodity in urban areas, and therefore there is a greater sensitivity to food prices in urban areas as compared to rural ones.(29) The urban poor are most vulnerable to unpredictable spikes in food prices and in some cases have been noted to spend 70–80 per cent of their disposable income on food.(30) These groups are also disproportionately affected by other factors that are becoming more significant, such as climate-related risks and environmental disasters.(31) As highlighted above, these factors are particularly important in cities of the global South, and there has not been adequate research on food security in urban areas in India.
c. Urban food security in India
Studies on food security assessing nutrition levels and other anthropometric indicators have highlighted the poor situation of food security in India.(32) There is very little research focusing on urban food security in India, and most of the existing work uses a diverse set of metrics to assess food security, making comparison across places and over time difficult. A comprehensive assessment of urban food security in India comes from the M.S. Swaminathan Research Foundation and the World Food Programme,(33) which have created an index of urban food security to measure the performance of Indian states for 2002 and 2010. They assess food security through an index that includes access variables (calorie consumption, employment status), absorption variables (access to water and sanitation), and outcome variables (anaemia, stunting, wasting, underweight).
However, this report relies on secondary data alone and does not consider people’s self-reports about food security. Further, because of constraints on the availability of secondary data, the analysis can only be carried out at higher levels of aggregation and is unable to focus on particular cities, or understand within-city inequality in food security. There is a small set of studies that attempt to do this in the Indian urban context using experiential measures that have been extensively reviewed for internal validity and reliability.(34) Sethi’s review includes published and unpublished work and grey literature. It finds only 10 studies published between 2000 and 2015 on urban food security that use experiential scales, all of which are focused on slum(35) settlements or resettlement colonies. We have not found any study of urban food security at the city scale.
Further, we find wide variation in the findings of these studies regarding the extent of food insecurity in Indian informal settlements. They range from a food insecurity prevalence of 15.4 per cent in the slums of Kolkata(36) to 76.3 per cent in slums in Mumbai.(37) Two different studies in slums in Delhi found that 51 per cent of households in one slum in north-east Delhi were food insecure(38) and 77.2 per cent in a resettlement colony in north Delhi.(39) It is not clear how much of this variation can be explained by differences in sampling methodology and metrics across these studies, and how much is because of actual differences across cities and contexts. For instance, the Kolkata study samples slums across the entire city whereas the Delhi and Mumbai ones are focused on informal settlements in one part of the city, and it is possible that those particular slums are more vulnerable than others in the city. However, these differences point to the need to carry out more in-depth empirical work across urban contexts and across communities to understand the status of urban food security in India.
d. Relationship between urban food security and other socioeconomic variables
Income dimensions
One of the primary barriers to accessing adequate quantity and quality of food in urban areas is insufficient income. In India, poverty is defined in terms of being able to purchase and consume a certain minimum caloric intake in a day.(40) From the literature we find that, while income does affect food security, there might be other food-insecure groups that are not captured by income dimensions alone.(41) Although poverty and food insecurity are often treated as coterminous in India, the divergence between these two has led Suryanarayana and Silva to caution that “the set of food insecure is larger than the set of poor in India”.(42)
Non-income dimensions
As highlighted above, having access to basic services and infrastructure such as water and sanitation facilities can also affect the absorption of food,(43) thus having important implications for food security. Lack of access and/or instability of access to basic services are part of the experience of urban poverty.(44) Crush,(45) in his study of food insecurity in Maputo, finds that inconsistent access to any of the six “basic necessities” – food, water, medical care, electricity, cooking fuel and cash income – is associated with an increased likelihood of a household being food insecure.
In addition to income and access to basic infrastructure and services, the other factors that have been highlighted as impacting food security are the employment status and education level of the household head, household structure (including the gender of the household head), size of the household, dwelling type, migration status, and access to social safety nets.(46) Multiple studies across contexts have documented that female-headed households are more likely to be food insecure.(47)
Migration status of households in urban India can be an additional risk factor: migrants have greater obstacles to accessing good housing, medical, water, sanitation and other infrastructural services. Studies also demonstrate that internal migrants have poor access to food.(48) In addition, issues that make it difficult to prove identity and eligibility for government welfare provisions might further compound vulnerability.
Access to social security
A final aspect that is critical in ensuring food security is the social safety nets provided by the state. In India, the Public Distribution System (PDS) has historically been the central government’s most important instrument to address food security and hunger for households below the poverty line.(49) The PDS provides grains to low-income households at subsidized rates through a vast network of ration shops that can be accessed through a ration card. However, the PDS has been criticized for leaving out those who could be most vulnerable and living in precarious conditions, such as migrant households(50) and street dwellers.(51) Literature assessing the PDS in India has highlighted questions of access to the ration shops, leakages,(52) and the impact of caste and other networks in distribution of food through the PDS.(53)
III. Measures and Methods
Our study attempts to bridge the gaps in understanding food security in urban areas in India by using third generation, experiential measures of food security. We do this through a survey of 1,698 households across the city of Bengaluru, India. To our knowledge, this is the first city-scale study in India using self-reported measures of food security. Our study uses food security scaled scores developed by the Food and Nutrition Technical Assistance (FANTA) Project developed by the United States Agency for International Development (USAID)(54) particularly for developing countries, to determine the prevalence of food insecurity in Bengaluru.
We use two measures to understand households’ access to food: the Household Food Insecurity Access Scale (HFIAS) and the Household Food Insecurity Access Prevalence (HFIAP). The HFIAS score ranks households from 0 (completely food secure) to 27 (completely food insecure) based on a set of nine questions about food access. This measure captures aspects such as (a) quantity and (b) quality of food intake or (c) reductions of food intake and (d) its consequences, as well as (e) feelings of uncertainty over the next meal.(55) The HFIAP converts this ordinal measure into a categorical scale ranking all households into one of the four categories of (1) food secure; (2) mildly food insecure; (3) moderately food insecure; and (4) severely food insecure. It does so in increasing order of severity and frequency of food-insecure occurrences.(56)
We also calculate the Household Dietary Diversity Scale (HDDS), which assesses the frequency of food intake of different food groups such as cereals, vegetables, fruits, meat, pulses, dairy, etc. This measure ranges from 0 to 12, with a higher number indicating a greater diversity in diet.(57) This is important because the intake of a greater variety of foods is closely linked to household food security.(58) The HDDS and the HFIAS measures together provide a comprehensive idea of food balance and security in a population.(59) The detailed questions employed to calculate the scores are reported in the online supplement.
Using these metrics of food security, we assess the relationship of food security with income and non-income dimensions of vulnerability, including access to infrastructure, household size, type of dwelling, migration status, education, employment status and gender of the household head, and finally, access to social safety nets such as the Public Distribution System.
a. Methods
Brief summary of the survey
We conducted a city-wide survey on access to food and food consumption patterns in Bengaluru from April to September 2016. We sampled 1,698 households across 40 of the 198 wards in Bengaluru using a structured questionnaire. After a pilot was conducted, the survey was administered by 12 enumerators guided by three field supervisors with additional supervision by researchers from the Indian Institute for Human Settlements (IIHS). The surveys were administered in the local language, Kannada, to an adult member of the household capable of answering questions about its finances and food purchasing patterns. In the case of dwellings with more than one household, the first available and consenting household was surveyed. Back-checks were conducted every two or three days by the field supervisors. Enumerators went through a three-day intensive training before the survey.
Sampling
Bengaluru is divided into 198 administrative units, wards, which are governed by the Bruhat Bengaluru Municipal Corporation (BBMP). We conducted our survey in 40 of the 198 wards across the city.
We used a stratified random sampling method for the survey. The first stage was to identify wards in which the survey was to be conducted. For this, we classified the 198 wards in the city into four economic strata based on asset ownership. In the absence of ward-level income data, we used a proxy variable, a composite asset ownership index computed by the Census of India, that lists household ownership of assets such as a television, motor scooter, car, mobile phone and so on. After creating the strata, we randomly sampled wards from each stratum that was to be surveyed. In this case, the strata were the first-stage sampling units.
The next step involved determining the number of households to be surveyed. The sample size for each ward was determined using proportionate probability allocation with replacement based on the total population of each ward. Therefore, a ward with a larger population had a higher number of sample households than a ward with a lower population. Additionally, in keeping with the broader aims of the research around food security in the city of Bengaluru, we decided to oversample wards with lower asset ownership. We assigned 500 samples each to the first two strata, with the remaining 700 equally divided between strata three and four, the strata with higher asset ownership.
The third step was the selection of households to be surveyed. Since we did not have a listing of households that we could use for random sampling, we used a variation of the random walk sampling method by mapping transects along which the survey was to be conducted using Google Earth. Similar methods have been used by researchers to map households in locations with no household identification data.(60) We mapped transects that cut through different housing typologies as could be identified using Google Earth. We mapped an average of four transects per ward and then surveyed every third household in each transect.
Survey tool
We captured data on three main aspects in our questionnaire: i) household and individual characteristics like demography, employment, migration status, education level, and access to social security schemes; ii) income and expenditure levels, asset ownership, housing typology, and access to basic services like water, sanitation and electricity; and iii) food security indicators – the Household Food Insecurity Access Scale (HFIAS) and the Household Dietary Diversity Scale (HDDS).
The demographic variables were collected for all members of the household, while other indicators were collected at the household level. These included housing type, access to basic services, and the food security variables. We also collected data on both income and consumption, using two different approaches: the first approach involved asking about each individual’s income in the last month to arrive at total household income, and the second approach involved asking about household expenditures across 18 different categories including food, healthcare, education, transportation, telecommunications, savings and remittances, to arrive at the total monthly consumption expenditure for the household. Both were collected for a 30-day recall period. Our measure of income was only able to capture earnings of working members in the household, and we were unable to capture incomes from rent, farm activities, pensions and other sources.
Data analysis
The data was cleaned and analysed in Stata. We primarily present our results through cross-tabulations. We look at cross-tabulations of mean HFIAS score across variables like income quintiles, education, employment, access to infrastructure, housing typologies, migration status, and access to the PDS. We used the Pearson’s chi-square test of independence for comparison across categorical variables and the ANOVA test to assess whether the differences of food security, food diversity and expenditure across categories are statistically significant. To make post-hoc pairwise comparisons across categories, we used the Tukey test to understand which groups were statistically different.
b. Limitations
A drawback of our analysis is that the questionnaire, for reasons of sensitivity, did not collect information on caste. In the Indian context, deprivation and lack of access to food cannot be comprehensively explained without this axis of stratification.(61)
Another issue with our data was that, within some wards, middle-income households were oversampled despite our conscious efforts to cover more of the poorer households. This is partly because enumerators faced difficulties in gaining access to marginal populations such as migrant workers, construction workers, and people living in temporary arrangements such as hostels. Upper-income households were also undersampled because particular gated communities and elite housing layouts (which represent the uppermost end of the income distribution in Bengaluru) were hard to access.
IV. Findings
a. Sample characteristics
Summary statistics for the overall sample are presented in Table 1. The average income per capita and the monthly per capita expenditure (MPCE) in our sample are INR 8,527 and INR 4,567 respectively (US$ 123 and US$ 65.91 respectively; US$ 1 = INR 69.26). Comparing our sample with data from the Census of India, 2011, we find that our data match up fairly well when comparing the sex ratio and age structure of the population.(62) However, we find that a higher proportion of our sample reported ownership of assets such as a scooter, motorcycle or car when compared to the census data for Bengaluru. Only 47 per cent of households in Bengaluru owned scooters or motorcycles according to the census, while 74 per cent of our sample reported owning at least one of these two assets. The difference in car ownership was smaller: 20 per cent of census households compared to 30 per cent in our sample owned cars.
Summary of household characteristics (N=1,698)
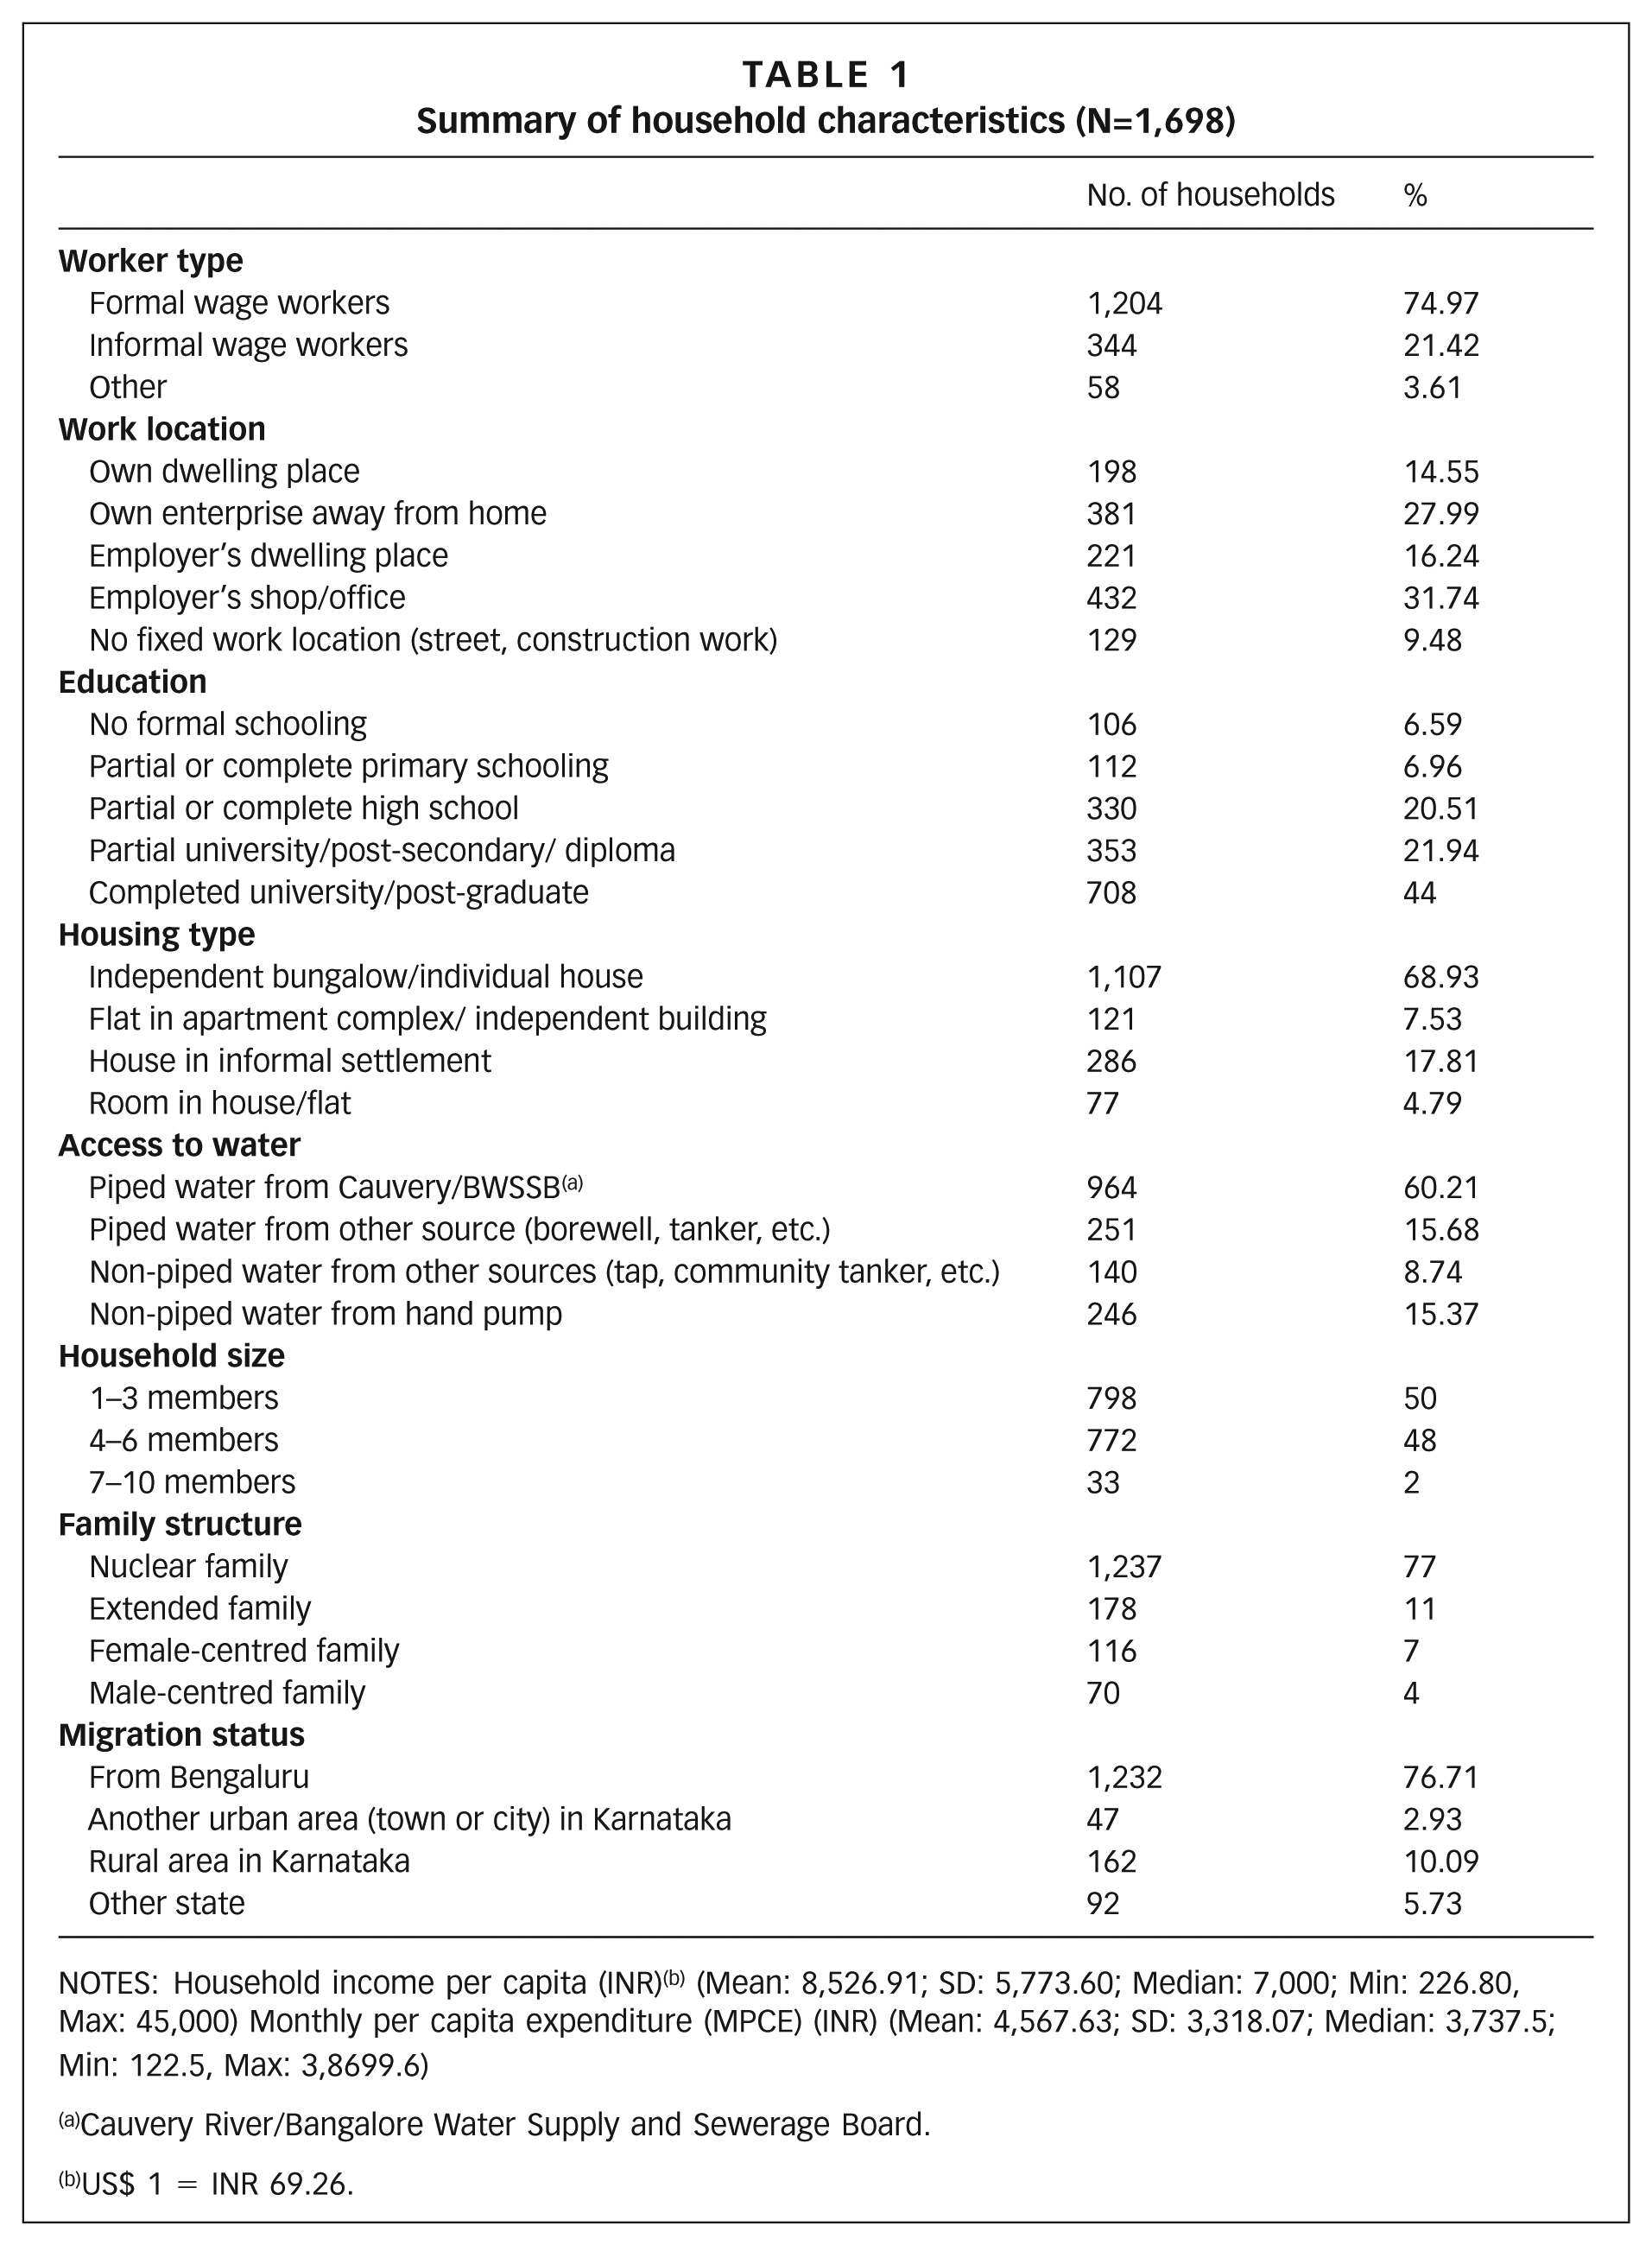
NOTES: Household income per capita (INR)(b) (Mean: 8,526.91; SD: 5,773.60; Median: 7,000; Min: 226.80, Max: 45,000) Monthly per capita expenditure (MPCE) (INR) (Mean: 4,567.63; SD: 3,318.07; Median: 3,737.5; Min: 122.5, Max: 3,8699.6)
Cauvery River/Bangalore Water Supply and Sewerage Board.
US$ 1 = INR 69.26.
b. Prevalence of food security
We first present the overall pattern of food security in the city. We find that 81 per cent of the households in our sample are food secure, and 16.7 per cent report food insecurity of some kind. 3.5 per cent of the sample (59 households) are found to be mildly or moderately food insecure and 13.2 per cent (224 households) are severely food insecure. The sampled households report a mean HFIAS score of 0.71. Responses to the individual questions from which the HFIAS score is calculated are shown in Figure 1. As indicated, very few households (3 per cent) report worrying about not having enough food, while a small proportion (5 to 8 per cent) report concern across the other dimensions of not having adequate quantity and variety of foods.
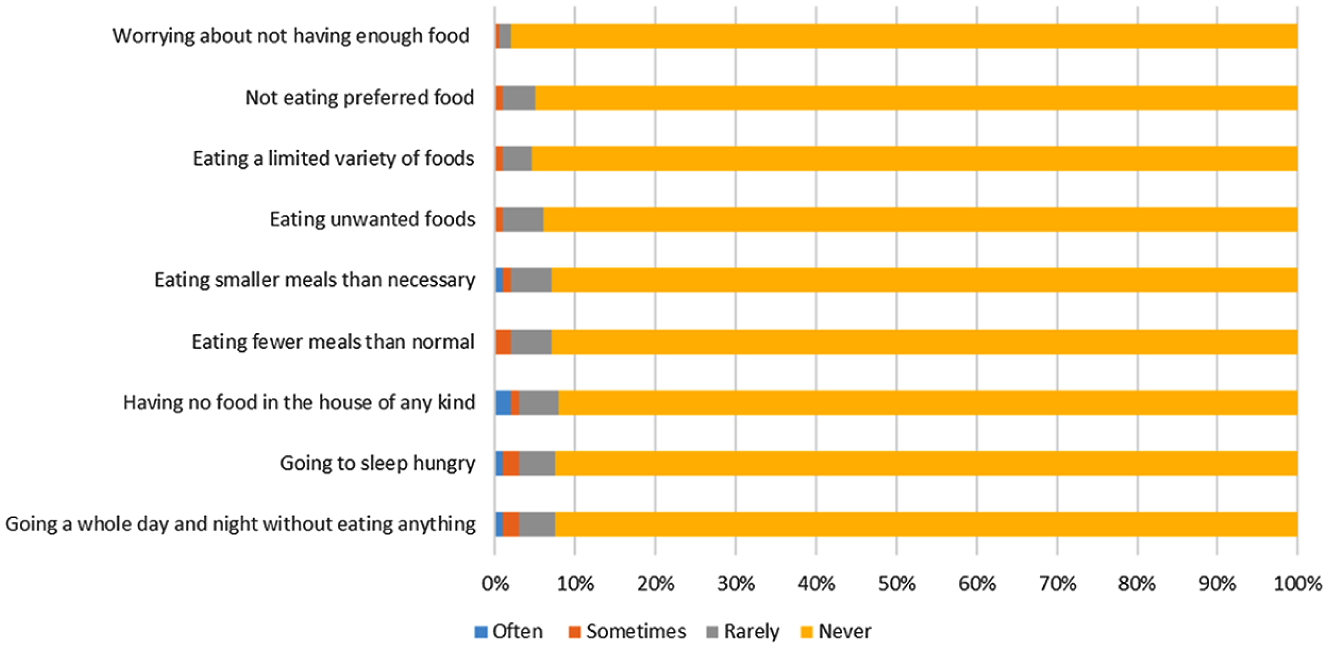
Responses to HFIAS questions
c. Relationship between income and food security
We carry out our analysis using MPCE as a proxy for income, since consumption is less biased by reporting issues compared to income.(63) We assess the relationship of MPCE and food security in three ways. First, we examine a scatterplot of MPCE and HFIAS and calculate the correlation between the two variables. We find a weak negative correlation of -0.054, which is significant at the 10 per cent level.
Second, we conduct a binomial logit regression to understand whether household food security status is affected by MPCE. We create a dichotomous household food security status (HFSS) as the dependent variable (HFSS = 1 if food secure, 0 for insecure). We take the calculated household MPCE as the independent variable in the model (results in Table 2).
Effect of monthly per capita expenditure (MPCE) on household food security status (HFSS): binomial logit regression model. HFSS=1 for food secure
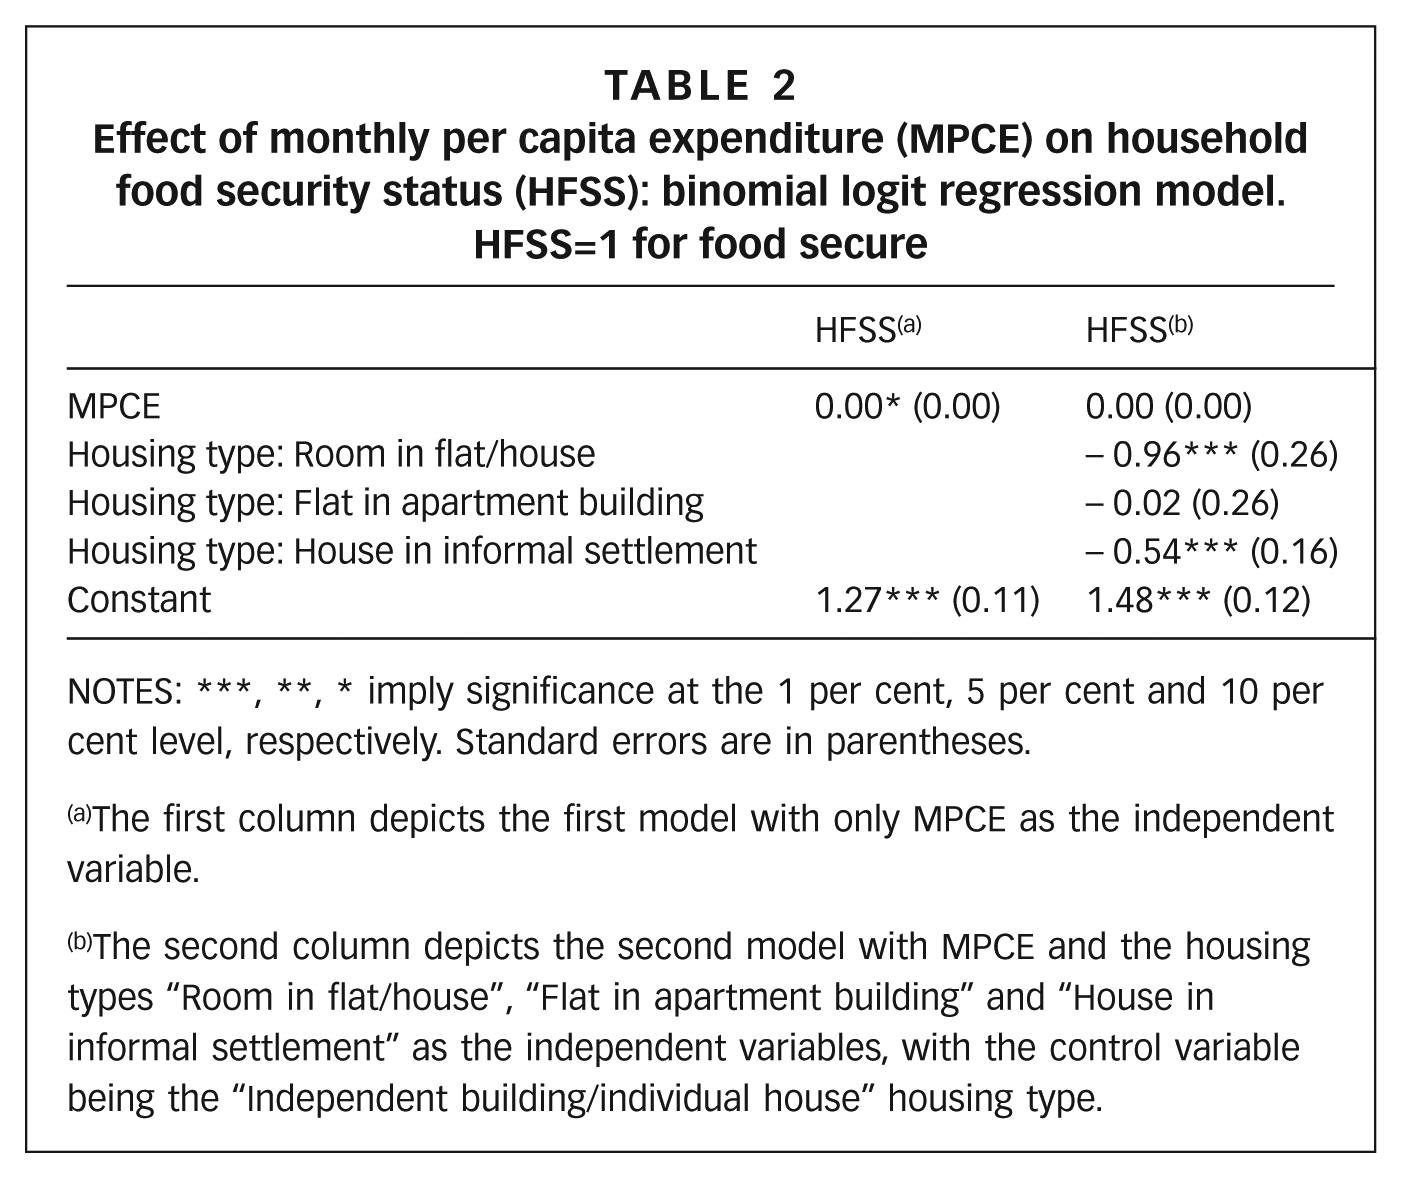
NOTES: ***, **, * imply significance at the 1 per cent, 5 per cent and 10 per cent level, respectively. Standard errors are in parentheses.
The first column depicts the first model with only MPCE as the independent variable.
The second column depicts the second model with MPCE and the housing types “Room in flat/house”, “Flat in apartment building” and “House in informal settlement” as the independent variables, with the control variable being the “Independent building/individual house” housing type.
Results indicate a lack of a relationship between MPCE and food security (p = 0.00, coefficient = 0.00). The finding is significant at the 10 per cent level. Further, when running the model again with “Independent building/individual house” housing type as a control, MPCE as a predictor of household food security status is no longer significant (p = 0.00, coefficient = 0.00). In the second model, we see that respondents from the housing types “Room in flat/house” and “House in informal settlement” have lower chances of being food secure than those in the housing type “Independent bungalow/individual house” (significant at the 1 per cent level).
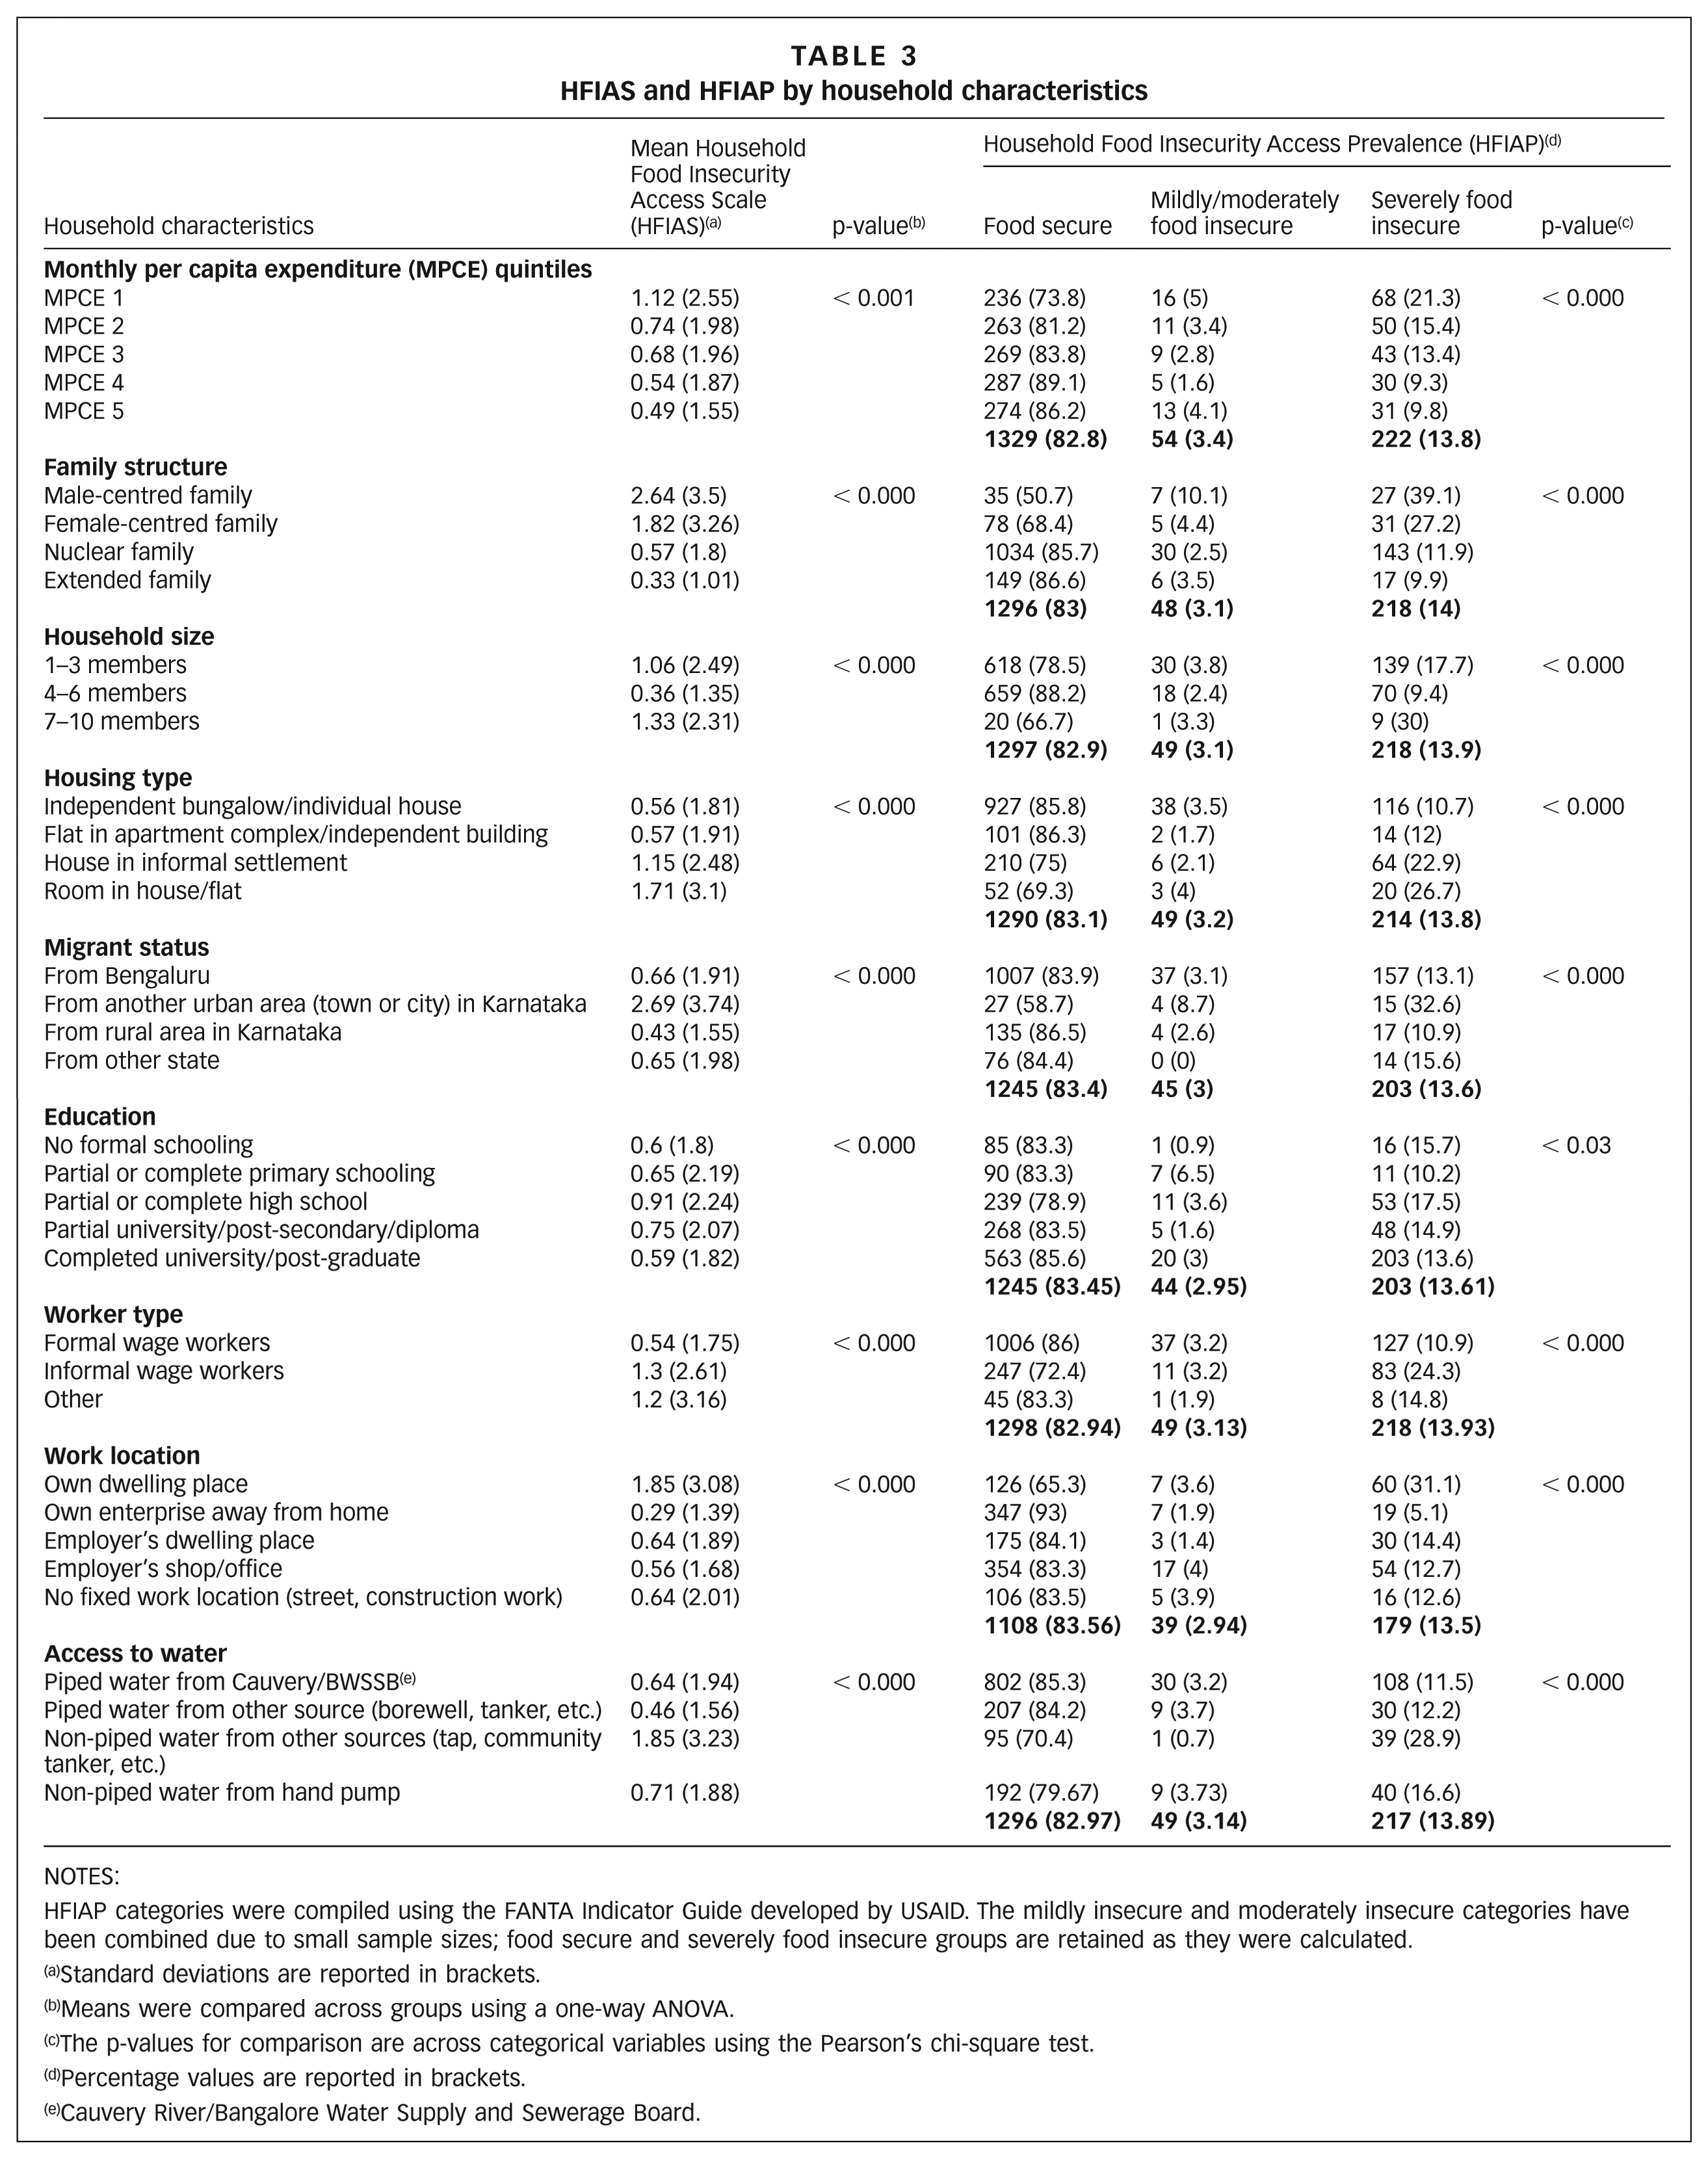
Third, we compare the mean values of the HFIAS and HFIAP across MPCE quintiles. We find that food insecurity decreases steadily across MPCE quintiles (from 1.12 for the poorest households to 0.49 for the richest households), and this difference is statistically significant at the 1 per cent level (Table 3). The HFIAP also varies substantially across MPCE quintiles, with prevalence of severe food security declining from 21.3 per cent for the lowest MPCE quintile to 9.8 per cent for the highest quintile (Table 3).
HFIAS and HFIAP by household characteristics
NOTES:
HFIAP categories were compiled using the FANTA Indicator Guide developed by USAID. The mildly insecure and moderately insecure categories have been combined due to small sample sizes; food secure and severely food insecure groups are retained as they were calculated.
Standard deviations are reported in brackets.
Means were compared across groups using a one-way ANOVA.
The p-values for comparison are across categorical variables using the Pearson’s chi-square test.
Percentage values are reported in brackets.
Cauvery River/Bangalore Water Supply and Sewerage Board.
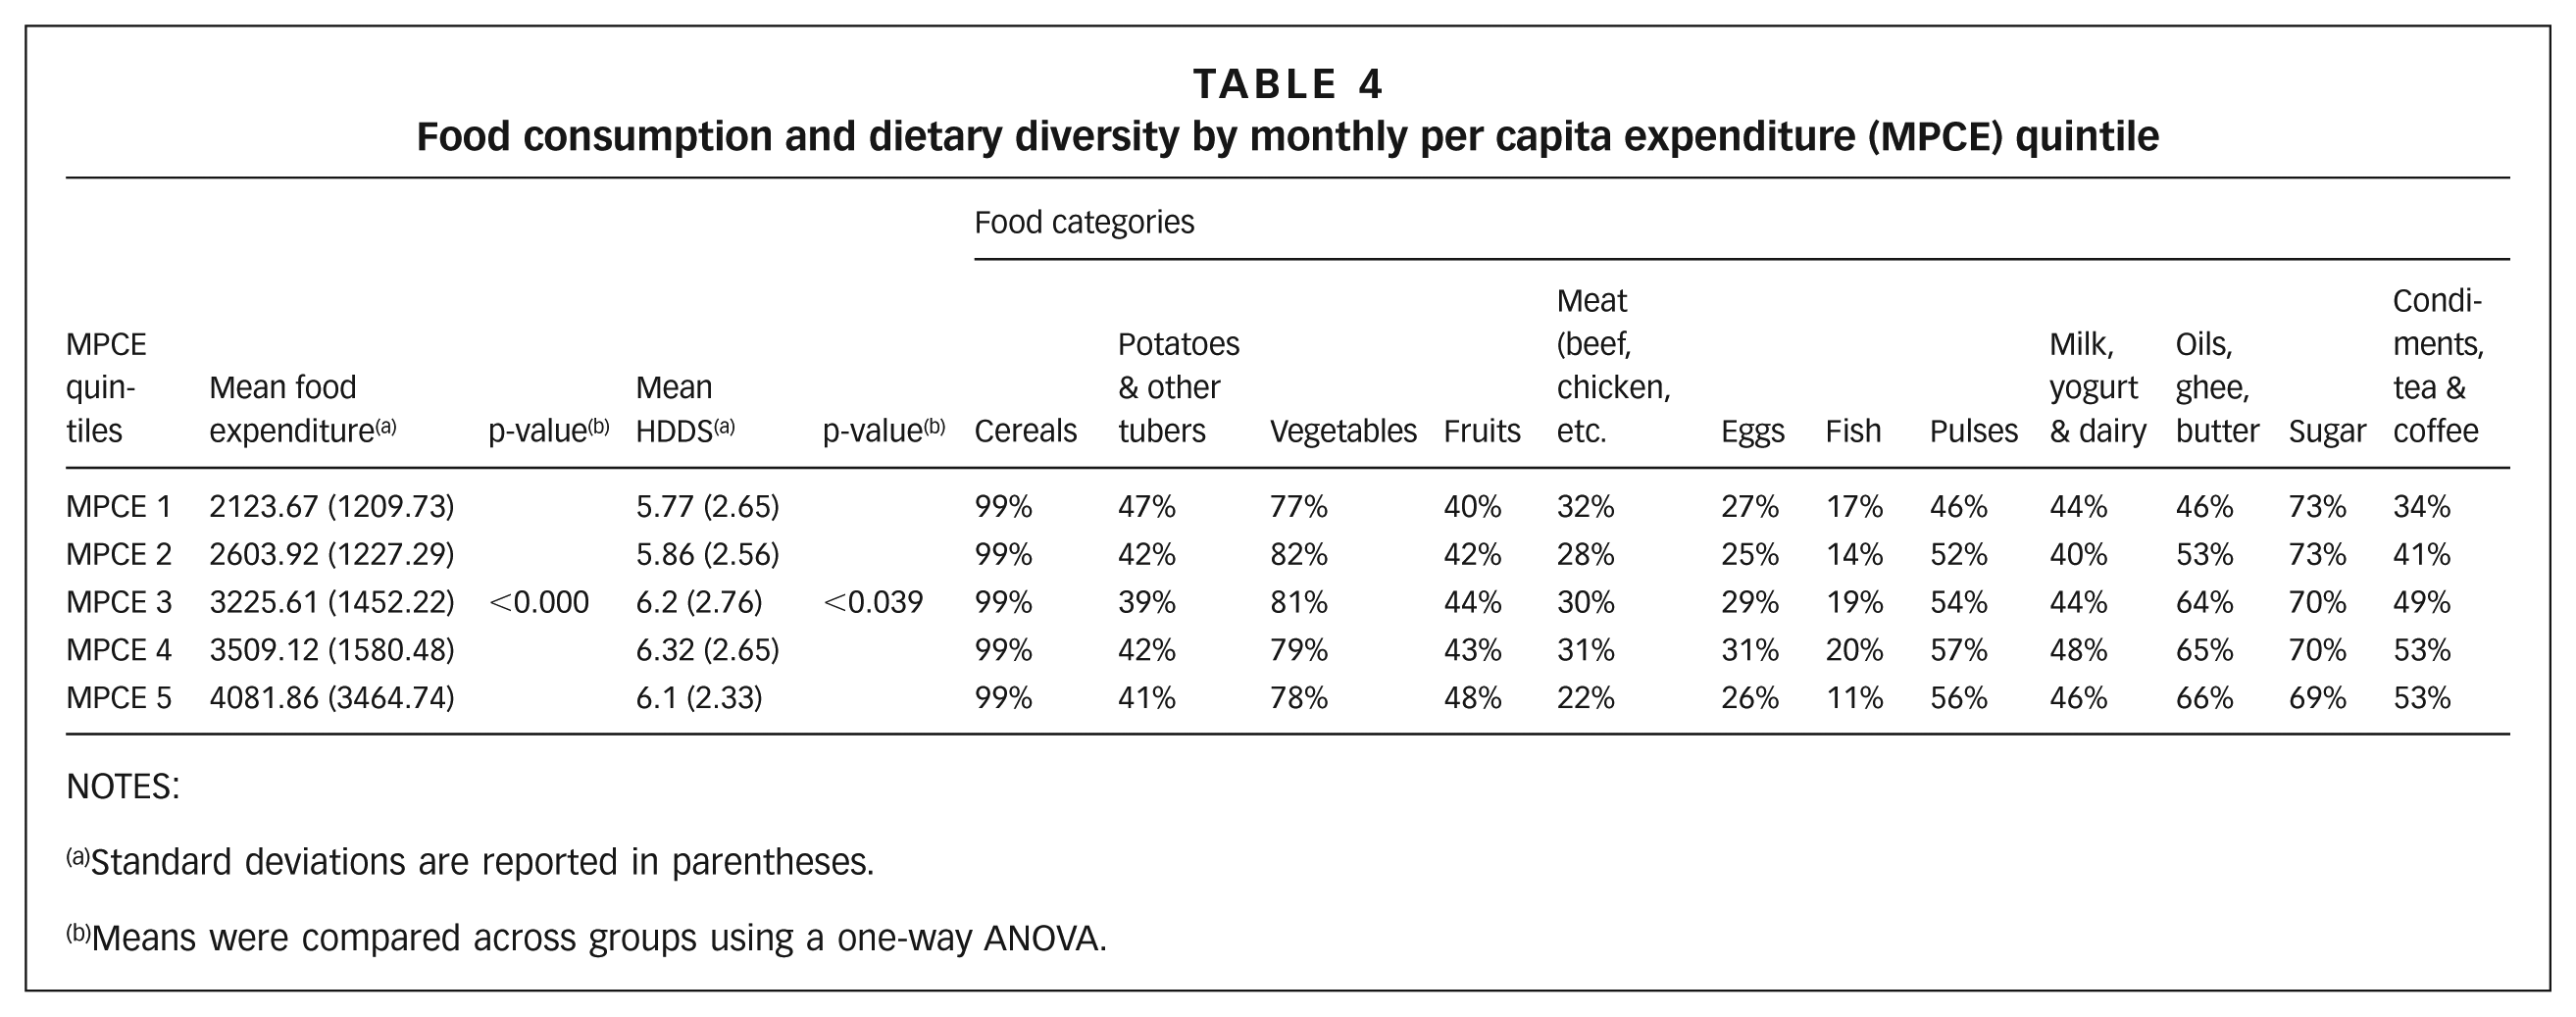
In order to further understand the relationship of MPCE with food security, we assess food expenditures across MPCE quintiles. We find a substantial difference in food expenditures across quintiles, with the average expenditures on food being INR 2,123, INR 2,603, INR 3,225, INR 3,509, and INR 4,081 (US$ 30.63, US$ 37.56, US$ 46.53, US$ 50.63, US$ 58.88) for each of the quintiles(64) (Table 4). Clearly, the richest households are spending almost twice as much on food and groceries compared with the poorest households in our sample.
Food consumption and dietary diversity by monthly per capita expenditure (MPCE) quintile
NOTES:
Standard deviations are reported in parentheses.
Means were compared across groups using a one-way ANOVA.
However, an increased income does not necessarily result in a more diverse food intake. We find that while mean HDDS scores do appear to increase with income, the difference is statistically significant only between the lowest quintile and the second-highest income group, while the other MPCE quintiles have more or less equal HDDS means (Table 4). The mean HDDS score in our sample is 5, which implies that most households are consuming approximately five varieties of food. Table 4 also shows the variation in consumption of particular food groups by MPCE quintile. We see very little variation in the proportion of households consuming food groups such as cereals, potatoes/tubers, vegetables, eggs, milk/dairy, and sugar/jaggery. However, we do see that consumption of fruits, ghee/oils, and condiments, tea and coffee increases with income. For meat and fish, we find similar levels of consumption for the bottom four MPCE quintiles, and then a drop for the richest quintile. This is probably indicative of dietary preferences among the upper castes in India, who are more likely to be in the highest income quintile.
d. Relationship of food security to non-income dimensions
We find that non-income dimensions are significant in understanding urban food security. Here, we assess the relationship of food security with household structure, household size, housing type, employment, access to water, education level of the household head, migration status of the household head, and access to the Public Distribution System. We test the differences of the mean HFIAS and HFIAP scores across these variables, and all results are summarized in Table 3. We use the chi-square and ANOVA tests to check for significance.
We find significant patterns emerging when we assess HFIAS scores by access to infrastructure variables, in particular access to clean drinking water (Table 3). Households that have no access to piped water and secure their water from a community tap, tankers or water cans are most likely to be severely food insecure and have the highest mean HFIAS score. In general, households without connections to piped water are less food secure than households connected to the piped network, regardless of whether the latter actually receive a piped supply from the city or depend on water tankers or bottled water, privately provided.(65)
We also find significant differences across households depending on their employment status. We use two variables to assess the nature of employment: whether the household head earns a formal wage income or an informal wage income, and the location of the workplace. The latter has been identified as having a substantial impact on work security.(66) We find that both of these variables are strongly related to food security. Twenty-four per cent of households where the head of the household has an informal wage are severely food insecure, compared with 11 per cent for formal wage work (Table 3). Similarly, those whose workplace is their own dwelling or an associated structure have a substantially higher likelihood of being food insecure when compared with other groups. Those who own their own enterprise away from home are the least likely to be food insecure.
The survey categorized households into four types: female-centred, male-centred, nuclear, and extended. Nuclear and extended families are less likely, on average, to be food insecure than single-headed households, which are either single-parent households or households with one or two adult members who are not married to each other. In terms of household size, we find that household food insecurity is higher for smaller and larger households (those with 1–3 members and those with 7–10 members, Table 3).
As highlighted in other literature, we also find high food insecurity among respondents dwelling in more precarious housing types, such as houses in informal settlements. Households in these settlements record a mean HFIAS score of 1.15. However, the survey results point to other precarious households. Respondents living in hostels, or a single room in a house or flat (category “Room in flat/house” in Table 3) – both indicative of a young migrant demographic – also suffer from higher levels of food insecurity.
We use the birthplace of the household head as a proxy to capture the migrant status of a household and find that migrant households in our sample are worse off than non-migrant households. Those who migrated from other cities in Karnataka seem to be severely affected, both in terms of food security (a score of 2.69) and PDS coverage (24 per cent) (Table 3). In comparison, the HFIAS score and PDS coverage are 0.6 and 43 per cent for those from other states and 0.6 and 57 per cent for those who are not migrants, or are from Bengaluru. One of the significant findings of the survey is that among severely food-insecure households, 57 per cent do not have any type of ration card (compared with 46 per cent for food-secure households), and hence do not get adequate support from the welfare system.
V. Discussion
We find that the prevalence of food insecurity in Bengaluru (16.7 per cent) is in line with other estimates, such as those from the National Family Health Survey (NFHS) on health and food security in Bangalore Urban District. According to the NFHS data, the proportion of children between 6 and 23 months old with an inadequate diet is 16.1 per cent in urban Bengaluru.(67) Similarly, a 2018 FAO report also estimates food insecurity in South Asia at 10.7 per cent by experiential metrics and 14.8 per cent by the undernourished population.(68) Our survey also shows that 25 per cent of households in informal settlements are food insecure (22.9 per cent severely food insecure and 2.1 per cent mildly or moderately food insecure), compared with 15.4 per cent in slums in Kolkata.(69) Our numbers are lower than those found in other slum surveys like those in Mumbai and Delhi (which range from 51 per cent to 77 per cent), but the other surveys were located in one particular part of the city and might not be representative of informal settlements across the city.(70)
a. Income and food security
Our analysis of the relationship between income (proxied by MPCE) and food security yields a mixed picture. When looking at the entire sample in aggregate, we find no clear relationship between income and HFIAS score. However, by disaggregating our sample across MPCE quintiles, we do find a statistically significant difference between quintiles for mean values of HFIAS as well as prevalence of food insecurity. On closer inspection, we see that this is driven by the difference between quintile 1 and quintiles 3, 4 and 5. Hence the HFIAS differences across income/MPCE quintiles are significant only when compared with the lowest income quintile, which has the highest food insecurity.
For those in quintiles 2, 3, 4, or 5, income and expenditure do not adequately explain their food security status. This means that experiential metrics are contributing very different information about food security than income and expenditure in a metropolitan context. This has important implications for policy, and for our understanding of how to measure food security. Much of public assistance such as the PDS is targeted according to poverty lines that are determined using MPCE. Our analysis implies that third generation metrics might be crucial for measuring food security and identifying beneficiaries of social safety nets like the PDS. It also suggests that there are other vulnerable groups that are not being captured by income or MPCE alone.
Further research is required to unpack the reasons behind the lack of a clear relationship between income and food security at the city scale. In an urban context like Bengaluru, there might be differences in this relationship in core and peripheral areas: for instance, households in peripheral areas might be more strongly connected to food supply through proximity to food production, whereas households in core areas might have better access to a network of ration shops. Further analysis is required to assess these possible explanations.
b. Income and diet diversity
Income impacts the food that comes onto one’s plate in another way: lower income implies a lesser monthly expenditure on food. However, income is found to not impact the diversity of food intake (HDDS), implying that it might not be a good predictor of nutritional intake in urban India.
The lack of a substantial increase in HDDS despite increasing incomes, in this case, is likely to indicate that the rich are paying more for the same items (due to better quantity or quality) but not necessarily translating into a more diverse nutrient intake. When we look into the self-perception of consuming a “limited variety of foods” across income classes versus the actual diversity of food intake, we see that a lack of concern about their diet is consistent across income groups. This finding refutes popular assumptions about the choices of the poor, such as their unhealthy attitudes and bad nutritional practices.(71) About 97 per cent of households in the highest income quintiles eating fewer than five types of food per day do not perceive themselves to be consuming a limited variety of foods. Around 80 per cent of households in the lowest income quintile with HDDS scores ranging from 1 to 4 also do not feel that they limit their variety of foods due to lack of resources. Therefore, we argue that increasing income does not lead to consumption of greater variety of food; nor does it affect self-perceptions of diversity of diet.
c. Gender of the household head
Similar to findings in Msunduzi, South Africa,(72) female-headed households are more likely to be severely food insecure in Bengaluru. However, unlike in Msunduzi, male-headed households are the worst off in terms of food insecurity in Bengaluru, even though they fare better than female-headed households in terms of income (Table 3). Male-headed households have a mean MPCE of INR 8,234 (US$ 118.80), whereas female-headed households have a mean MPCE of INR 4,521 (US$ 65.23); this difference is statistically significant at the 1 per cent level. This could be indicative of the importance of a cultural split of duties in food preparation and consumption practices, or could indicate that men might be spending more on other items.(73)
d. Housing type
As expected, we find a higher likelihood of food insecurity in informal settlements when compared with the rest of the city. In addition, we find that households living in certain typologies like “Room in house/flat” have an even higher likelihood of being food insecure. When looking more closely at the food-insecure households in this group, we find that these are largely female-headed households with older women as household heads. Within this group, we find a subset of respondents who have responded “Rarely” to all nine questions of the food security questionnaire. This has driven their average HFIAS scores up, and it is unclear whether this is an issue of the way they have interpreted the questions and responses. As a robustness check, we remove this small set of people and recompute the mean HFIAS value for this group. After doing this, the average HFIAS value for this group drops down to a value very close to that of households in informal settlements, and still a statistically significant difference from the other housing typologies. This indicates that this housing typology is indicative of a vulnerable population distinct from households living in informal settlements, which merits further study.
e. Access to infrastructure
In particular, besides being associated with housing typology, food insecurity is also closely linked to infrastructural deprivations such as a lack of adequate supply of clean water. The fact that food-insecure households are also the ones suffering from infrastructural and other deprivations means that they have less ability to cope with risks. This is crucial, as these other deprivations, which are debilitating by themselves, are also key factors inhibiting the proper utilization and absorption of food by household members.
f. Migration
We find that households that have migrated from other urban areas in Karnataka demonstrate a high degree of food insecurity. To understand why this might be the case, we look in greater detail at the food-insecure migrant households in this group. We find that this group largely consists of male-headed households (mostly single-member households, but also some two-member households), with an average age of 30 years. This group is also least likely to have a ration card (76 per cent do not have a ration card, when compared to 43 per cent for households from Bengaluru, 66 per cent for rural migrants and 57 per cent for migrants from other states). This is another significant finding that indicates a vulnerable sub-population that is not easily identified by income or housing typology alone.
g. Measurement issues
We echo Maitra’s finding about the potential of experiential metrics to contribute to an understanding of urban food security in India.(74) However, we find an additional aspect that is different from experiences in other countries. Very few households in Bengaluru report anxiety over access to food, and this is a finding echoed in other Indian studies of urban food security.(75) This is not the case in other HCP cities; for instance, 18 per cent of Mexico City households reported that they were anxious about not having enough to eat, either sometimes or often, while in Nairobi, a quarter of surveyed households reported worrying about access to food either sometimes or often.(76) This might indicate a difference in cultural contexts or perceptions, which would need further testing to assess.
VI. Conclusions
In this paper, we report our findings from a survey of 1,698 households across Bengaluru to assess food security at the city scale using experiential metrics, and income and consumption expenditure. Through this work, we attempt to put out the baseline evidence on the current status of food security in Bengaluru, to lay the foundation for a future research agenda on urban food security in India. This analysis has important implications for the design and targeting of public assistance programmes for the urban poor, such as the PDS. We find that income and consumption do not have a straightforward relationship with food insecurity. Households in the lowest income quintiles experience the highest food insecurity, but income and expenditure do not clearly explain the food insecurity faced by those in higher income quintiles. This implies that targeting food-insecure populations should not be limited to consumption-based metrics.
We also find clear relationships of food security with access to infrastructure, employment status, housing type, household structure and migration. Households that carry out informal wage work, that do not have access to clean water supply, that live in precarious housing, that are headed by a single parent (male- or female-centred family), and that have migrated to Bengaluru, are all more likely to be food insecure. It is clear from these findings that food-insecure households in cities face multiple deprivations, and that these could further exacerbate their risk from having insufficient quantity or quality of food.
Since this is the first study of food insecurity at the city scale in India that does not presuppose the presence of vulnerability in any particular housing or settlement typology, it allows us to identify vulnerable populations beyond those living in informal settlements. We find other vulnerable groups such as those living in a shared room in a house or flat. Using experiential metrics also allows us to identify food-insecure populations beyond those that can be captured by income dimensions alone, such as male-headed migrant households that are not income poor, but do suffer from food insecurity. However, further research is required to unpack the relationship between income and food security across urban areas – for instance, whether there are spatial patterns to the relationship of income with food security.
Overall, we find that using experiential metrics for food security allows us to capture variations across urban populations that might not be captured by first or second generation metrics. We find that anxiety about food supply is not reported by a large number of households, indicating either a lack of cultural relevance or a need to reframe that particular question in the Indian context. However, we reiterate that much more research is required on the question of urban food security in India, across cities and neighbourhood types, to assess the concerns raised in this paper.
Supplemental Material
adelina-supplement – Supplemental material for Urban food insecurity and its determinants: a baseline study of Bengaluru
Supplemental material, adelina-supplement for Urban food insecurity and its determinants: a baseline study of Bengaluru by Shriya Anand, Keerthana Jagadeesh, Charrlotte Adelina and Jyothi Koduganti in Environment & Urbanization
Footnotes
Acknowledgements
This research was undertaken as part of the Hungry Cities Partnership (HCP). The HCP is an international research project examining food security and inclusive growth in cities in the global South. The five-year collaborative project aims to understand how cities in the global South will manage the food security challenges arising from rapid urbanization and the transformation of urban food systems. The Partnership is funded by the Social Sciences and Humanities Research Council of Canada (SSHRC) and the International Development Research Centre (IDRC) through the International Partnerships for Sustainable Societies (IPaSS) programme.
Supplemental Material
Supplemental material for this article is available online.
1.
2.
3.
See reference 1; also Chakravarty, Sujoy and Sejal A Dand (2005), Food Insecurity in India: Causes and Dimensions.
4.
See reference 2.
5.
Crush, Jonathan S and G Bruce Frayne (2011), “Urban food insecurity and the new international food security agenda”, Development Southern Africa Vol 28, No 4, pages 527–544.
6.
Revi, Aromar, Arindam Jana, Teja Malladi, Shriya Anand, Gautam Bhan, J S Mohan Raju, Jyothi Koduganti and Pooja Rao (2015), Urban India 2015: Evidence (Poverty, Inequality and Exclusion).
7.
See reference 5.
8.
See reference 1.
9.
The cities in the Hungry Cities Partnership are Cape Town, South Africa; Maputo, Mozambique; Nairobi, Kenya; Bengaluru (Bangalore), India; Nanjing, China; Kingston, Jamaica; and Mexico City, Mexico. A full reporting of the findings from our Bangalore study are also available as a report: Koduganti, Jyothi, Charrlotte Adelina, Mohanraju J S and Shriya Ananda (2019), The State of Household Food Security in Bangalore, India, Hungry Cities Report No 14, Hungry Cities Partnership.
10.
11.
Barrett, Christopher B (2002), “Food security and food assistance programs”, Handbook of Agricultural Economics Vol 2, pages 2103–2190.
12.
Coates, Jennifer, Anne Swindale and Paula Bilinsky (2007), Household Food Insecurity Access Scale (HFIAS) for Measurement of Food Access: Indicator Guide (Version 3), Food and Nutrition Technical Assistance (FANTA) Project, Washington, DC; also Pingali, Prabhu, Bhaskar Mittra and Andaleeb Rahman (2016), “The bumpy road from food to nutrition security - slow evolution of India’s food policy”, Global Food Security, December, pages 1–8.
13.
See reference 11.
14.
Coates, Jennifer, Edward A Frongillo, Beatrice L Rogers, Patrick Webb, Parke E Wilde and Robert Houser (2006), “Commonalities in the experience of household food insecurity across cultures: What are measures missing?”, The Journal of Nutrition Vol 136, No 5, pages 1438S–1448S.
15.
Agarwal, Siddarth, Vani Sethi, Palak Gupta, Meenakshi Jha, Agnihotri Ayushi and Mark Nord (2009), “Experiential household food insecurity in an urban underserved slum of North India”, Food Security Vol 1, pages 239–250.
16.
See reference 14.
17.
Crush, Jonathan (2016), Hungry Cities of the Global South, Hungry Cities Partnership Discussion Paper No 1, Waterloo, 24 pages.
18.
Webb, Patrick, Jennifer Coates, Edward A Frongillo, Beatrice L Rogers, Anne Swindale and P Bilinsky (2006), “Advances in developing country food insecurity measurement measuring household food insecurity: why it’s so important and yet so difficult to do”, The Journal of Nutrition Vol 136, No 5, pages 1404S–1408S.
19.
See references 14 and 18.
20.
Maitra, Chandana (2017), “Adapting an experiential scale to measure food insecurity in urban slum households of India”, Global Food Security Vol 15, pages 53–64.
21.
See reference 1.
22.
See reference 5; also Athreya, V B, R Rukmani, R V Bhavani, G Anuradha, R Gopinath and A S Velan (2010), Report on the State of Food Security in Urban India, World Food Programme, Perungudi, 214 pages.
23.
See reference 5.
24.
Duh, Josephine and Dean Spears (2016), “Health and hunger: disease, energy needs, and the Indian calorie consumption puzzle”, The Economic Journal Vol 127, No 606, pages 2378–2409.
25.
Crush, Jonathan and Mary Caesar (2014), “City without choice: urban food insecurity in Msunduzi, South Africa”, Urban Forum Vol 26, pages 165–175.
26.
See reference 17; also Satterthwaite, David (2014), “The multidimensional poverty index: another underestimate of urban poverty”, blog post, International Institute for Environment and Development, 18 June; and ![]() , An Action Agenda for Sustainable Development: Report for the UN Secretary-General, Sustainable Development Solutions Network.
, An Action Agenda for Sustainable Development: Report for the UN Secretary-General, Sustainable Development Solutions Network.
28.
Tacoli, Cecilia (2017), “Reframing food security for an urbanising world”, blog post, International Institute for Environment and Development, 10 April.
29.
See reference 5; also Rai, Rajnish Kumar and Patturaja Selvaraj (2015), “Exploring realities of food security: oral accounts of migrant workers in urban India”, Economic and Industrial Democracy Vol 36, No 1, pages 147–171.
30.
32.
See reference 3, Chakravarty and Dand (2005); also Chinnakali, Palanivel, Ravi P Upadhyay, Deepa Shokeen, Kavita Singh, Manpreet Kaur, Arvind K Singh, Anil Goswami, Kapil Yadav and Chandrakant S Pandav (2014), “Prevalence of household-level food insecurity and its determinants in an urban resettlement colony in North India”, Journal of Health, Population, and Nutrition Vol 32, No 2, pages 227–236.
34.
Sethi, Vani, Chandana Maitra, Rasmi Avula, Sayeed Unisa and Surbhi Bhalla (2017), “Internal validity and reliability of experience-based household food insecurity scales in Indian settings”, Agriculture and Food Security Vol 6.
35.
The term “slum” usually has derogatory connotations and can suggest that a settlement needs replacement or can legitimate the eviction of its residents. However, it is a difficult term to avoid for at least three reasons. First, some networks of neighbourhood organizations choose to identify themselves with a positive use of the term, partly to neutralize these negative connotations; one of the most successful is the National Slum Dwellers Federation in India. Second, the only global estimates for housing deficiencies, collected by the United Nations, are for what they term “slums”. And third, in some nations, there are advantages for residents of informal settlements if their settlement is recognized officially as a “slum”; indeed, the residents may lobby to get their settlement classified as a “notified slum”. Where the term is used in this journal, it refers to settlements characterized by at least some of the following features: a lack of formal recognition on the part of local government of the settlement and its residents; the absence of secure tenure for residents; inadequacies in provision for infrastructure and services; overcrowded and sub-standard dwellings; and location on land less than suitable for occupation. For a discussion of more precise ways to classify the range of housing sub-markets through which those with limited incomes buy, rent or build accommodation, see Environment and Urbanization Vol 1, No 2 (1989), available at ![]() .
.
36.
See reference 20.
37.
Chatterjee, Nilesh, Genevie Fernandes and Mike Hernandez (2012), “Food insecurity in urban poor households in Mumbai, India”, Food Security Vol 4, No 4, pages 619–632.
38.
Agarwal, Siddharth (2011), “The state of urban health in India: comparing the poorest quartile to the rest of the urban population in selected states and cities”, Environment and Urbanization Vol 23, No 1, pages 13–28.
40.
See reference 6.
41.
See reference 25; also Nnakwe, Nweze and C Yegammia (2002), “Prevalence of food insecurity among households with children in Coimbatore, India”, Nutrition Research Vol 22, No 9, pages 1009–1016; and D’Souza, Rev Stany, A M Sheela and Raja D Jebasingh (2013), “Impact of socio-economic factor on child development among urban poor - a Study in Bangalore, India”, European Scientific Journal Vol 9, No 23, pages 175–188.
42.
Suryanarayana, M H and Dimitri Silva (2007), “Is targeting the poor a penalty on the food insecure? Poverty and food insecurity in India”, Journal of Human Development Vol 8, No 1, pages 89–107, page 89.
44.
Mehrotra, Santosh, Jan Vandemoortele and Enrique Delamonica (2000), Basic Services for All?, UNICEF, Florence; also ![]() , Improving Conditions of the Urban Poor and Increasing Access to Basic Services.
, Improving Conditions of the Urban Poor and Increasing Access to Basic Services.
45.
See reference 17.
46.
See reference 11; also see reference 32, Chinnakali et al. (2014); reference 37; reference 38; Bapat, Meera (2009), “Poverty lines and lives of the poor: underestimation of urban poverty - the case of India”, working paper, Poverty Reduction in Urban Areas series, International Institute for Environment and Development, London; and Maitra, Chandana and D S Prasada Rao (2015), “Poverty–food security nexus: evidence from a survey of urban slum dwellers in Kolkata”, World Development Vol 72, pages 308–325.
47.
See reference 37; also see reference 41, D’Souza et al. (2013); reference 46, Maitra and Rao (2015); and Riley, Liam and Mary Caesar (2017), “Comparing household food security in cities of the global South through a gender lens”, discussion paper, Hungry Cities Partnership, Waterloo.
48.
See reference 29, Rai and Selvaraj (2015); also Borhade, Anjali (2011), “Migrants’ (denied) access to health care in India”, in R Srivastava (editor), Internal Migrants and Social Protection in India: The Missing Link, Vol 2, Indian Council of Social Science Research (ICSSR), New Delhi, pages 166–193.
49.
See reference 22, Athreya et al. (2010); also Gopichandran, V, P Claudius, L S Baby, A Felinda and V R Mohan (2010), “Household food security in urban Tamil Nadu: a survey in Vellore”, The National Medical Journal of India Vol 23, No 5, pages 278–280.
50.
Saxena, N C and Harsh Mander (2008), PUCL v. UOI & Ors., Writ Petition (Civil) No. 196 of 2001.
51.
Mander, Harsh (2013), Living Rough: Surviving City Streets.
52.
Ahluwalia, Deepak (1993), “Public distribution of food in India: coverage, targeting and leakages”, Food Policy Vol 18, No 1, pages 33–54.
53.
Nagavarapu, S and S Sekhri (2013), “The role of informal caste networks in public service delivery”, Ideas for India, 6 May, available from ![]() .
.
54.
Swindale, Anne and Paula Bilinsky (2006), “Development of a universally applicable household food insecurity measurement tool: process, current status, and outstanding issues”, The Journal of Nutrition Vol 136, No 5, pages 1449S–1452S.
57.
See reference 25.
58.
Hatloy, Anne, Jesper Hallund, Modibo M Diarra and Arne Oshaug (2000), “Food variety, socioeconomic status and nutritional status in urban and rural areas in Koutiala (Mali)”, Public Health Nutrition Vol 3, No 1, pages 57–65; also Hoddinott, John and Yisehac Yohannes (2002), “Dietary diversity as a household food security indicator”, technical note, FANTA.
60.
Grais, Rebecca, Angela Rose and Jean Paul Guthmann (2007), “Don’t spin the pen: two alternative methods for second-stage sampling in urban cluster surveys”, Emerging Themes in Epidemiology Vol 4, Article 8; also Galway, L P, Nathaniel Bell, Al Shatari S A E, Amy Hagopian, Gilbert Burnham, Abraham Flaxman, Wiliam M Weiss, Julie Rajaratnam and Tim K Takaro (2012), “A two-stage cluster sampling method using gridded population Data, a GIS, and Google Earth™ imagery in a population-based mortality survey in Iraq”, International Journal of Health Geographics Vol 11, Article 12.
61.
Thorat, Sukhdeo and Joel Lee (2005), “Caste discrimination and food security programmes”, Economic and Political Weekly, Vol 40, No 39, pages 4198–4201.
63.
We also replicate all the analyses presented here with income per capita, and get similar results.
64.
The difference between these is statistically significant at the 1 per cent level (except for the difference between quintiles 3 and 4).
65.
In some areas of Bengaluru, particularly in peripheral areas, there are households that are connected to a network of pipes but do not get a sufficient supply from the city water utility. These households get their water from water tankers or bottled water.
66.
Chen, Martha Alter (2012), The Informal Economy: Definitions, Theories and Policies.
68.
See reference 1.
69.
See reference 20.
71.
Nevarez, Leonard, Kathleen Tobin and Eve Waltermaurer (2016), “Food acquisition in Poughkeepsie, NY”, Food, Culture & Society Vol 19, No 1, pages 19–44.
72.
See reference 25.
73.
See reference 38; also see reference 46, Bapat (2009); and reference 47, ![]() .
.
74.
See reference 20.
75.
See reference 37.
76.
Capron, Guénola, Salomón Arellano Gonzalez, Jeremy Wagner and Cameron McCordic (2018), The State of Household Food Security in Mexico City, Mexico, Hungry Cities Report No 13, Hungry Cities Partnership; also Owuor, Samuel (2018), The State of Household Food Security in Nairobi, Kenya, Hungry Cities Report No 11, Hungry Cities Partnership.
References
Supplementary Material
Please find the following supplemental material available below.
For Open Access articles published under a Creative Commons License, all supplemental material carries the same license as the article it is associated with.
For non-Open Access articles published, all supplemental material carries a non-exclusive license, and permission requests for re-use of supplemental material or any part of supplemental material shall be sent directly to the copyright owner as specified in the copyright notice associated with the article.