
Abstract
This paper explains the methods that were used to study environmental health problems in Karonga, a rapidly growing secondary urban centre in Malawi. The study used existing information from hospital records and consulted local health officials and academics on how best to use it. The aim was to position the hospital as a disease surveillance site by using its records to generate disaggregated health data at the intra-urban scale. This paper identifies the strengths and limitations of using hospital data to inform joint urban planning and public health interventions. It also provides a summary of the key findings, including a discussion of the implications for enhancing urban health intelligence and urban policy formulation in Malawi and other rapidly urbanizing countries. This paper is intended to show researchers how existing information in low-resource settings can be used to generate needed health data for urban populations, with a particular interest in secondary centres.
Keywords
I. Introduction
This paper reports on the strengths and limitations of using existing information from hospital records to study environmental health problems in Karonga, a rapidly growing secondary urban centre in Malawi. The paper responds to the widespread recognition of the need to better understand the relationship between the urban physical environment and health inequities in rapidly urbanizing countries.(1) This need for understanding is especially acute in secondary centres, where a large and typically growing share of the world’s future urban growth is expected to occur, but where few demographic and health data are available.(2) The paper is also based on the recognition that research should guide urban planners and policymakers toward the development of healthy living environments, especially for the urban poor and other vulnerable groups.(3) According to Stephens et al.,(4) this can occur in a number of ways:
Filling gaps in knowledge about inequalities in environmental resources and health impacts between groups
Contributing to understandings of the impacts of urban environmental conditions on health
Developing replicable methods for identifying priorities on the basis of urban health needs
Producing generalizable information on prevailing environmental health conditions in urban areas
Building on Stephens et al.(5) and others,(6) this paper is intended to show researchers how existing information in low-resource settings can be used to generate disaggregated demographic and health data at the intra-urban scale, with specific reference to hospital records. The aim is to encourage methodologies that contribute to an evidence base for urban planning and public health in Malawi and other rapidly urbanizing countries. As a basis for this discussion, Section II examines the need for actionable data to guide joint urban planning and public health interventions at the municipal scale (i.e. at the scale of the city) and intra-urban scale (i.e. at the sub-city scale). Section III reviews existing sources of information that can be used to generate these data using Malawi and Karonga Town as examples. Section IV explains how the methodology was developed to analyse hospital records, while Section V provides a summary of the key findings. The final section concludes by discussing the implications for future practice and research in Karonga Town and beyond.
II. The Need for Actionable Data
Interest in health as an international policy issue was first evident in the 1970s, after the former colonies gained independence and began receiving international aid. At the time, very few population and health data were available at the intra-urban scale beyond those collected by several studies showing high infant and child mortality rates in informal settlements.(7) Interest in urban health grew in the 1980s following the publication of a widely cited book, In the Shadow of the City,(8) which questioned the prevailing focus of international policy on rural health by emphasizing two emerging trends. The first was the rapid urbanization of low- and middle-income countries, and the second was the growth of informal settlements with very poor housing and living conditions and the health burdens that resulted.(9) These trends motivated the World Health Organization (WHO) to launch the Healthy Cities Movement in the late 1980s so as to better understand the relationship between the urban environment and health, and to revitalize the role of local governments in urban health promotion.(10)
Evidence of the relationship between urban living conditions and inequities expanded in the 1990s and into the 2000s following the release of several other landmark books and reports(11) and special issues in this journal(12) and others.(13) Among the most groundbreaking studies was one published by the African Population and Health Research Center (APHRC) in 2002 based on data from the Nairobi Urban Health and Demographic Surveillance System (NUHDSS).(14) The study uncovered marked differentials in under-five mortality rates between residents of Nairobi’s “slums” and the urban population as a whole, providing new evidence of an “urban health penalty” borne by the urban poor. This growing body of evidence has continued to reveal urban differentials in mortality rates and the prevalence of life-threatening diseases (such as malaria, diarrhoea, malnutrition and respiratory infections) based on socioeconomic status.(15) Given this evidence, it is now widely recognized that the health of the urban poor can be just as bad as, if not worse than, that of the rural poor.(16)
Yet a review of the literature indicates the continued lack of demographic and health data disaggregated for urban centres (by city size and location), for people (by age, gender, income and other socioeconomic characteristics) and for small area units (by wards, neighbourhoods, blocks and streets), especially in sub-Saharan Africa.(17) Most health data are aggregated to provide averages for urban populations, obscuring ingrained urban health inequities.(18) Consequently, little is known about the most common causes of disease, death and disability, and even less about the most affected groups, at the municipal and intra-urban scales.
A growing number of scholars(19) emphasize the lack of basic health data in sub-Saharan African urban centres. They call for enhanced urban health intelligence and disease surveillance given the rapid growth of the urban population and the large and complex burden of disease borne by the urban poor. A strand of this scholarship emphasizes the prevalence of health inequities linked to deficiencies in the urban physical environment, notably poor-quality housing, congestion and overcrowding, and inadequate infrastructure and service provision (of, for instance, water and sanitation, drainage and sewerage, solid waste management, and electricity).(20) It is argued that urban planning has a key role to play in addressing health inequities given its impacts on the quality and form of the urban physical environment. According to Smit et al.,(21) urban planning can contribute to public health objectives by enabling the following:
Access to adequate housing and basic services
Access to other benefits of urban life (e.g. livelihood opportunities and public facilities, including schools, hospitals and clinics)
A healthy natural environment (e.g. promoting ecosystem services and protecting ecologically sensitive areas from development)
A safe living environment (i.e. with low risk of injuries and few negative impacts on mental health)
A resilient living environment that is better able to cope, resist and recover from the impacts of environmental hazards, such as floods, storms and heat stress
Food security and nutrition
Physical activity, including active modes of public transport (e.g. walking and cycling)
For these functions to be fulfilled, local governments and planning authorities require essential data on the intra-urban distribution of environmental health problems and their determinants so as to identify the most affected populations, prioritize investments (particularly in basic services), and guide local interventions.
III. Existing Data in Low-Resource Settings
Most of what is known about the intra-urban distribution of environmental health and environmental health determinants in sub-Saharan Africa comes from case studies of informal settlements.(22) Few studies have generated primary data for entire cities due to the prohibitive costs. As an alternative, some studies have drawn on existing information to generate disaggregated demographic and health data at the intra-urban scale.(23)
A recent study by Satterthwaite et al.(24) provided a detailed review of available data in sub-Saharan African urban centres and of recent studies that have generated needed data using innovative methodologies, including the methodology used by this study to analyse hospital records, as elaborated in the following section. Building on Satterthwaite et al., this section provides a review of routinely collected data generated both inside and outside health information systems, with specific reference to Malawi and Karonga Town. The intention is to show the breadth of secondary sources available in low-resource settings and to highlight their strengths and limitations for guiding local urban/public health interventions in this context.
a. Health information systems
As the basis for public health decision-making, country-level health information systems collect a range of data from different sectors and agencies at the individual, health-facility and population scales.(25) Key information sources include many of those discussed below, notably the census, population-based surveys, vital registration systems, and disease surveillance sites.(26) At the country level, ministries of health capture data recorded in public health facilities (including hospitals and clinics) on health status (including diseases, births and deaths, and maternal, child and reproductive health), service provision (including the type of services used) and health system resources. These data form the foundation of what are commonly referred to as health management information systems specifically designed to guide planning, management and decision-making in the public health system.(27) A key strength of facility-based data is their ability to inform public health surveillance so as to define problems and provide a timely basis for targeted responses, especially during disease epidemics.(28)
However, health management information systems in sub-Saharan Africa are weak and fragmented and so do not, in general, provide consistent, complete, accurate or reliable data.(29) A large portion of the data required by the health system is collected outside it. In Malawi, the health management information system was introduced in 1999 to address the need for a comprehensive approach to provide health information at the community, health facility, district and national levels.(30) However, a recent assessment of Malawi’s health management information system found that “the country’s health sector still lacks accurate, reliable, complete, consistent and timely health data to inform effective planning and resource management”.(31)
b. Censuses
A 2006 study by Onsembe and Ntozi(32) found that 36 out of 51 countries in Africa participated in national censuses in 2000 and that of the 15 countries that did not, two-thirds were engaged in conflict and so were unable to implement the census.(33) Despite their uneven coverage, censuses provide the most abundant basic data on population characteristics, including indicators relevant to many social and environmental determinants of health, ranging from socioeconomic status (for instance, age, sex, income), to access to basic services (for instance, water and sanitation, electricity, education), quality of housing (for instance, building materials), and employment.(34) Because this information is collected for all individuals in a population, census data have strong statistical power and policy relevance at the municipal and intra-urban scales.
However, censuses in sub-Saharan Africa, as in most regions, are conducted on a 10-year basis and so do not provide up-to-date information.(35) This poses particular problems in urbanizing countries where the size of the urban population is rapidly growing and its composition is in constant flux.(36) In addition, some censuses are not processed to provide data at the municipal or intra-urban scale, particularly when the data are aggregated for districts or are not geocoded. Consequently, local governments may find it difficult to access census data in a form useful for local planning.(37) Censuses may also underrepresent the urban population if they exclude informal settlements from enumeration(38) or if they use unrealistic definitional criteria (such as high population thresholds) that underrepresent the smallest centres.(39) In Malawi, the accuracy of current urbanization estimates is questionable given the lack of clear and consistent criteria used by the National Statistical Office (NSO) to define settlements as “urban”.(40)
c. The Demographic and Health Survey (DHS)
The DHS is the primary source of information on population health in most low- and middle-income countries. The DHS is a nationally representative household survey designed to collect demographic and health information on, for instance, maternal and child health, reproductive health, nutrition, child survival and mortality, fertility, immunization, household characteristics, and environmental conditions (including access to basic services). A key strength of the DHS is its use of a multi-stage sample that selects households from geographic units in the form of districts (urban and rural). The sample enables analyses of individual, household and population-level indicators on the distribution of health problems and health determinants. The recent addition of Global Positioning System (GPS) data enables population health to be spatially analysed at lower levels of aggregation.
However, the DHS still does not provide sufficient spatial information to identify urban settlements by size, “making the city-size dimension of health surprisingly difficult to document” according to Montgomery.(41) Despite the addition of geocoded data, geographic offsets of four kilometres for households in rural areas and two kilometres for households in urban areas are used to protect the confidentiality of respondents. Offsets can occur in any random angle between 0 and 360 degrees, although the new location of each offset household must fall within its original boundary at the district level. However, it is unclear whether this also applies to municipalities containing urban centres. Consequently, urban households could be offset into outlying rural areas, while rural households could be offset into urban areas. In Karonga Town, for example, Survey Cluster 571, sampled by the 2010 Malawi DHS, could have been initially located in the town before being offset outside of the administrative boundary (Map 1). This uncertainty increases the likelihood of misclassification errors when attempting to disaggregate survey clusters for individual urban centres.
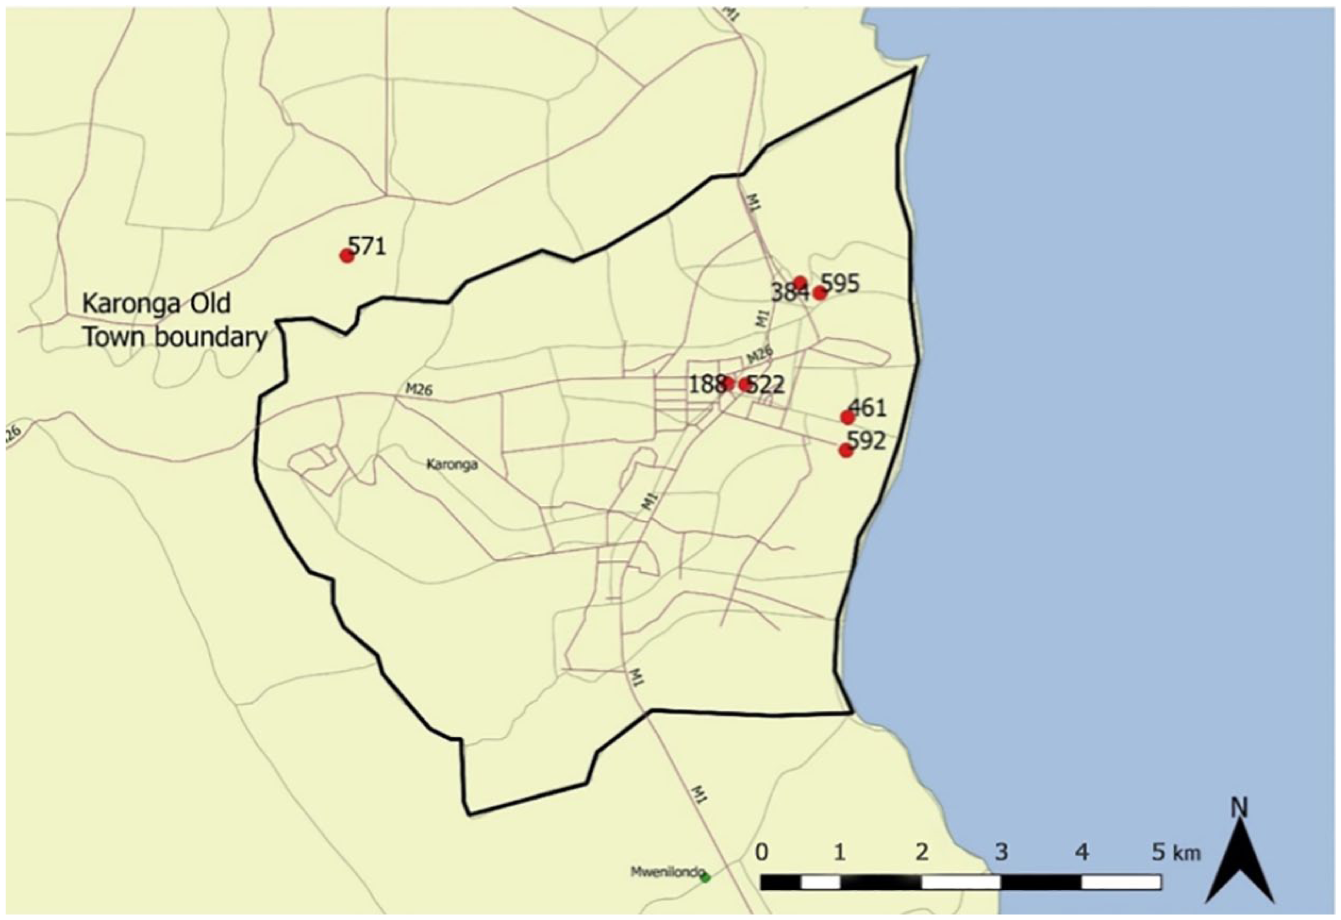
Geocoded survey clusters in Karonga Town sampled by the 2010 Malawi Demographic and Health Survey (DHS)
d. Vital registration systems
These systems serve as the primary source of information on live births and deaths worldwide and provide reliable cause-specific mortality data based on medically certified records. However, the vast majority of sub-Saharan African countries have incomplete registration of live births and deaths and incorrect reporting of age and cause of death.(42) In Malawi, the vital registration system is based on vital events that occur in public health facilities and so does not capture all relevant events, including deaths occurring under the care of traditional attendants, which are either reported only to chiefs or not reported at all.(43)
Without cause-specific mortality data, many analyses of urban health have been largely presumptive in terms of linking mortality to particular causes. While there is strong evidence attributing a large share of death in “slums” to environmental health risks,(44) as discussed above, causal links are too often drawn without accurate or reliable data.
e. Urban Health and Demographic Surveillance Systems (UHDSS)
Where vital registration systems and facility-based data are lacking, UHDSS can provide alternative information on causes of death by age and sex through the use of verbal autopsy methods.(45) A key strength of UHDSS is its ability to generate longitudinal data that can be analysed to monitor and compare differentials in child and adult mortality at the intra-urban and municipal scales and at higher levels of aggregation. These data can reveal changes in the demographic, spatial and temporal distribution of urban health inequities and their determinants, and provide a strong evidence base for urban/public health interventions locally.(46)
The UHDSS in Nairobi was established in 2002 as the first of its kind in sub-Saharan Africa and has provided some of the most detailed data on urban mortality differentials to date,(47) as discussed above. Disease surveillance sites appear to be expanding in number and coverage. For instance, 37 disease surveillance sites are operational within the regional research network called INDEPTH Network,(48) including a number of sites (including Nairobi) based in urban areas; however, it is uncertain whether these sites are urban-specific. Rural surveillance sites have also been documented, including one in Chilumba, a port village in the Northern Region of Malawi.(49) The site has provided detailed longitudinal data on patterns and risk factors for deaths using verbal autopsy.(50) However, a key limitation of this method is its inability to retroactively identify all causes of deaths reliably due to inherent uncertainties.(51)
f. Community-driven enumerations and mapping
Many low-income communities in sub-Saharan African urban centres are not enumerated by official surveys (including censuses and the DHS), either because of their informal or “illegal” status or because local governments lack the capacity to enumerate and map all settlements in their jurisdiction.(52) Consequently, basic data on socioeconomic and environmental conditions in informal settlements are widely lacking. Communities affiliated with SDI (previously Slum/Shack Dwellers International) have taken action by enumerating and mapping all households in their neighbourhoods, as documented in Kisumu, a secondary city in Kenya.(53) A key strength of community enumerations and maps is that they provide detailed local data on population size and composition, neighbourhood and plot boundaries, and existing infrastructure and services. Many surveys have standardized questions for self-reported health problems, as observed in Sierra Leone and Kenya.(54) The information from enumerations and maps enables communities to develop detailed settlement profiles, which also serve as a basis to negotiate for formal recognition, secure land tenure, and access to basic services from local authorities.(55) However, community information may have little influence over local authorities if they are unable or unwilling to take action. Often, the generation of settlement profiles is the first step in a longer process of partnership building with the local state.(56)
g. Community-level surveys
Community health workers (CHWs) can provide a critical link between communities and the formal health system, particularly in peripheral areas. In Malawi, CHWs are called health surveillance assistants (HSAs) and are responsible for delivering a range of primary health care services, including conducting community outreach, carrying out household assessments, performing disease surveillance (including epidemics), monitoring water quality, providing immunizations, facilitating the formation of village health committees (VHCs), recording health data, and disseminating information about water, sanitation and hygiene (WASH) and maternal and perinatal health. Given their role in community-level data collection, HSAs play a key role in supporting the decentralization of Malawi’s health management information system.
In Karonga District, HSAs are employed by the Karonga District Hospital under the Ministry of Health and are assigned to individual villages. Their activities are aimed primarily at preventing disease among high-risk groups, including infants, children, mothers, and people living with HIV/AIDS.(57) Seven HSAs were followed using participant observation in Karonga Town in order to understand the different types of data they collect and use to guide their work. Some HSAs conduct routine household surveys on access to WASH facilities. For instance, the survey pictured in Photo 1 was designed by an HSA who planned to administer it to all households in the village in order to provide a complete picture of the WASH situation. But because HSAs use surveys primarily for their own work, the data are seldom made more widely available and may not be known to researchers.
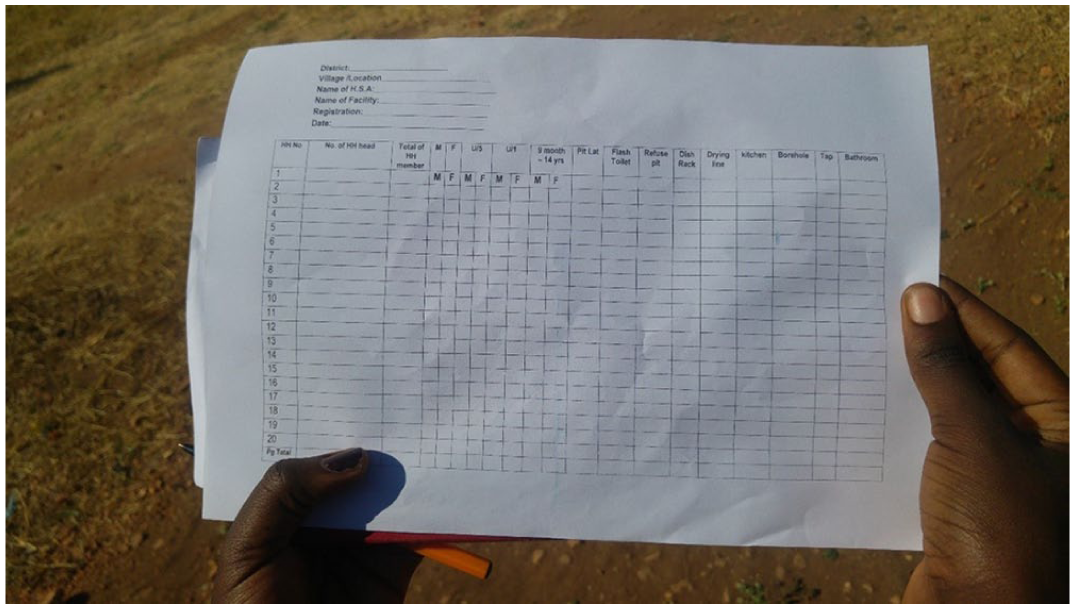
A household survey on access to WASH facilities designed by an HSA in Karonga Town, Malawi
h. Newspaper records
Newspapers capture a variety of everyday hazards (such as road traffic accidents and violent crime) and disaster events (such as floods, storms and disease outbreaks) and their effects (such as the number of people killed or displaced, or the number of homes damaged or destroyed).(58) Since these events are continuously reported, newspaper records can facilitate longitudinal analysis of trends over time. However, newspapers do not capture everyday hazards deemed too small to be newsworthy, including diseases (such as diarrhoea, respiratory infections and injuries) affecting individuals. Newspaper records also tend to be incomplete in terms of age, sex and location, precluding detailed sociospatial analysis. Consequently, newspaper records are not representative of everyday health problems at the individual level.(59)
IV. Background and Methods
a. Study context
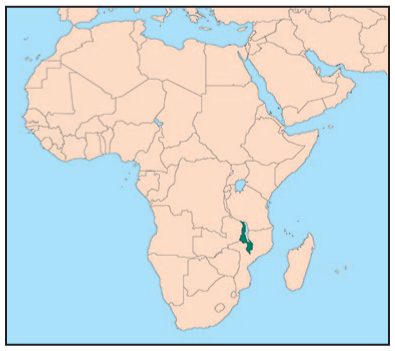
The study draws on the case of Karonga, an emerging secondary centre in the Northern Region of Malawi. Malawi is a small landlocked country in East Africa. As of 2018 (the last census year), Malawi’s population was 17.5 million, with 16 per cent living in urban areas,(60) making it one of the least urbanized countries in sub-Saharan Africa. Malawi is also one of the most rapidly urbanizing countries in the region, with an annual urbanization rate of around 4 per cent.(61) At this rate, 30 per cent of Malawi’s population is expected to live in urban areas by 2050.(62)
While Karonga Town is small by international standards, with a population of 41,074 in 2008,(63) it is the seventh largest urban centre in the country. The town is nevertheless considerably smaller than the three largest cities (Lilongwe, Blantyre and Mzuzu), which together with Zomba accounted for most of Malawi’s urban population in 2008(64) (Figure 1). Despite its relatively small size, Karonga Town’s population is rapidly growing at an annual rate of around 4.3 per cent, and is projected to reach around 58,000 by 2018.(65) To capture the town’s growth, the administrative boundary, which originally included 46 villages,(66) was recently expanded to include an additional 13 villages in the town’s rapidly expanding periphery.
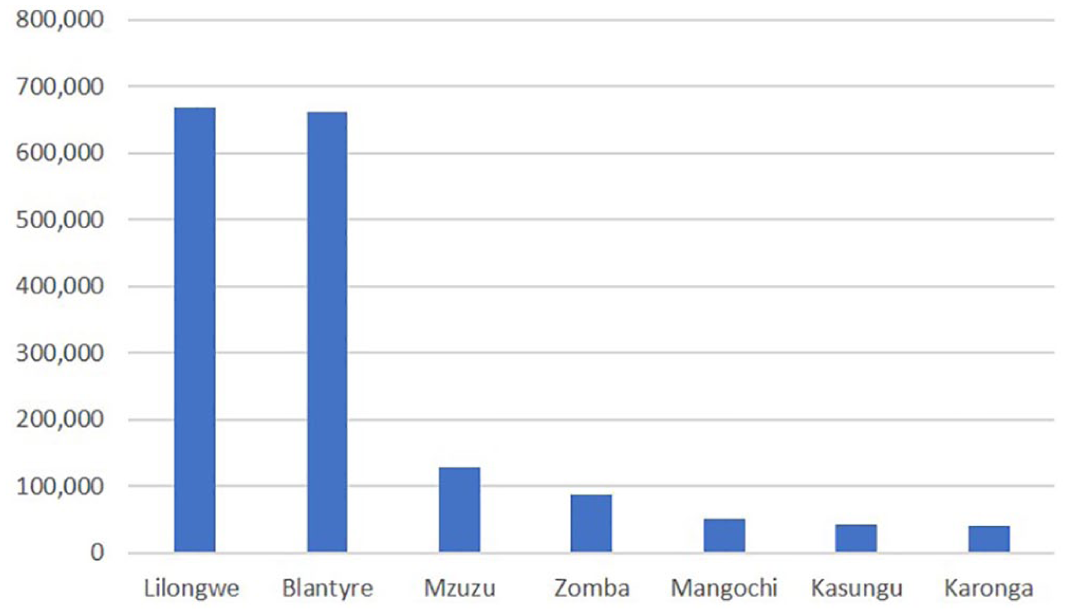
Populations of the seven largest urban centres in Malawi, 2008
Karonga Town(67) is reported to suffer from a range of problems similar to those in other secondary centres in the region.(68) These problems include a lack of capacity to plan and manage urban growth; provide basic infrastructure and services (notably water, sanitation and electricity); and reduce environmental hazards, ranging from poor water and sanitation, to seasonal floods, road traffic accidents, and large-scale disasters, including earthquakes, floods and drought. Table 1 demonstrates the range of events that impact morbidity, mortality and asset loss in Karonga Town, based on a town-wide questionnaire survey.(69) It is widely suspected that living in secondary centres with problems similar to those in Karonga Town may be especially hazardous to health. Until now, however, most scholarly and practical attention to urban environmental health has been paid to the largest cities.
Nature, scale and frequency of hazard events in Karonga Town, 2016
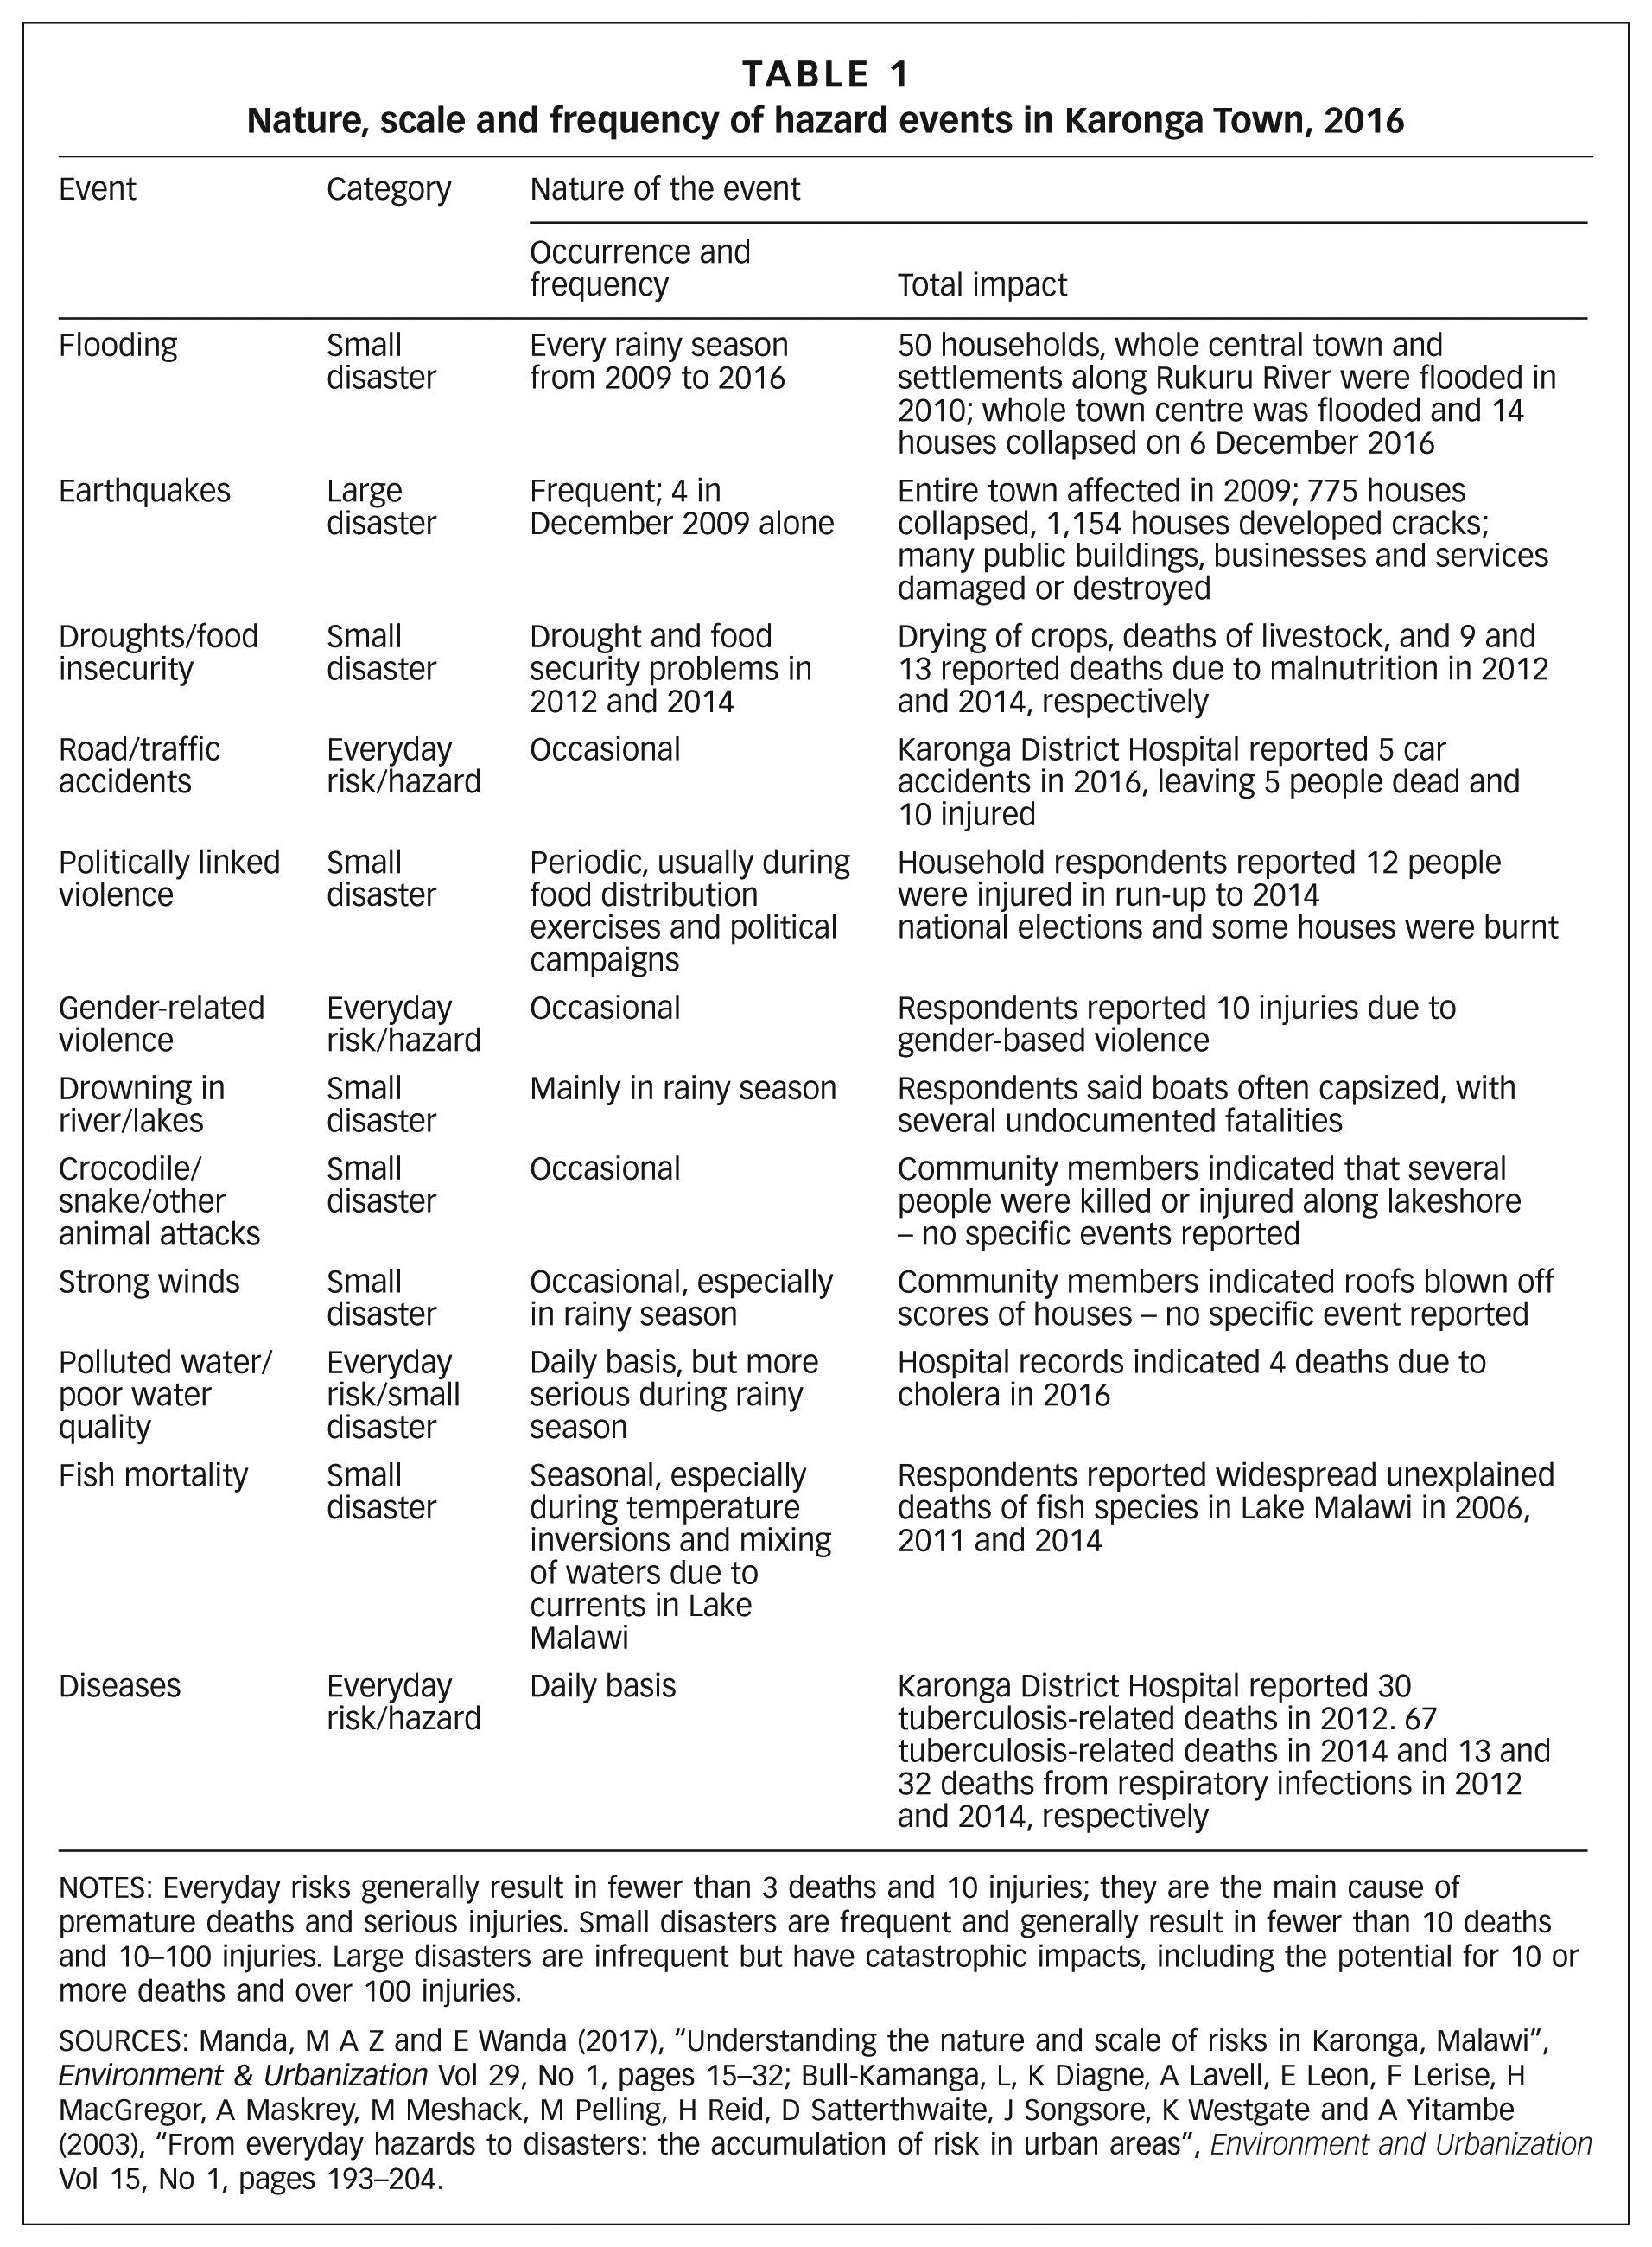
NOTES: Everyday risks generally result in fewer than 3 deaths and 10 injuries; they are the main cause of premature deaths and serious injuries. Small disasters are frequent and generally result in fewer than 10 deaths and 10–100 injuries. Large disasters are infrequent but have catastrophic impacts, including the potential for 10 or more deaths and over 100 injuries.
SOURCES: Manda, M A Z and E Wanda (2017), “Understanding the nature and scale of risks in Karonga, Malawi”, Environment & Urbanization Vol 29, No 1, pages 15–32; Bull-Kamanga, L, K Diagne, A Lavell, E Leon, F Lerise, H MacGregor, A Maskrey, M Meshack, M Pelling, H Reid, D Satterthwaite, J Songsore, K Westgate and A Yitambe (2003), “From everyday hazards to disasters: the accumulation of risk in urban areas”, Environment and Urbanization Vol 15, No 1, pages 193–204.
b. Aims
Against this backdrop, the main aim of the study was to use existing information collected from hospital records to generate disaggregated data on environmental health problems in Karonga Town. While hospital records have traditionally been used for clinical purposes, they are increasingly used in epidemiological research to assess trends and patterns in morbidity and mortality across a number of domains, including demographics (age, sex, residential address), vital signs (blood pressure, height, weight, pulse), laboratory data (blood tests), and problem lists (diagnoses).(70) For instance, researchers have used hospital records to analyse disease aetiology, assemble groups of patients with specific diseases, and monitor disease (surveillance).(71) However, the use of hospital records in epidemiological research has been largely confined to Europe and the United States, where urban/public health issues are arguably less severe than in sub-Saharan Africa and other developing regions.(72) The specific aims of the study were to assess:
The prevalence of diseases with known environmental causes or contributions (environmental health problems)
The extent to which environmental health problems change seasonally or following hazard events, including disasters and disease epidemics
The demographic distribution of environmental health problems by age and sex
The spatial distribution of environmental health problems between villages
The study represents a form of “descriptive epidemiology”, where the population group is the unit of analysis (i.e. describing health problems in different groups within a particular place).(73) The two health problems analysed were morbidity and mortality. The study was designed in partnership with the Karonga District Health Management Team (DHMT(74)) and local academics from Mzuzu University based on their interest in monitoring health status at the urban scale, particularly given the recurrence of cholera outbreaks in the town. The study was granted ethics approval by the National Committee on Science and Technology (NCST) in April 2017 after gaining permission from the Karonga DHMT under the Ministry of Health.
c. Sampling
Hospital records are a form of archival data. Records for inpatients who live in Karonga Town (urban inpatients) were purposively sampled from the admission and discharge registers of the paediatric, female and male wards for a 12-month period between 1 August 2016 and 31 July 2017. Additional data on patients admitted for cholera during an outbreak between January and July 2016 were collected. The inpatient population was used as the sample because it is likely to be representative of more severe manifestations of diseases and injuries (including epidemics, such as cholera) requiring hospitalization. However, the inpatient population may not be entirely representative since it may exclude people who did not seek medical care when sick or injured. These groups may include people with low incomes who cannot afford sick days or people with mobility issues, as discussed below. To increase sample representativeness as much as possible, every single urban inpatient with valid records was included.
The sampling procedure had three stages. First, because Karonga District Hospital serves as a referral facility for the entire district, which includes a vast rural territory, it does not disaggregate records for smaller area units, including urban centres. A list of all 59 villages located in Karonga Town’s administrative boundary was therefore created by consulting local chiefs. The list was used to purposively sample urban inpatients based on the “address” field in the primary registers. Second, because data collection began in April 2017 after ethics approval was granted, as discussed above, the records from 1 August 2016 onward were collected retroactively. Records for the remaining months were collected at the beginning of each successive month (e.g. the records for July 2017 were collected at the beginning of August 2017). Last, the following information was recorded from the admission registers: age and sex, reason for admission (ailment), date of admission (month and year), and name of home village (address). The same information was collected from the discharge registers to determine the number and causes of deaths. No identifying information was collected.
d. Coding
A coding system was developed to identify and classify diseases with known environmental causes or contributions (environmental health problems), developed from a comprehensive report by the WHO(75) and consultations with the Karonga DHMT. Two criteria from the WHO report were used: health conditions must have known environmental causes or contributions, and they must be related to environmental factors that can be reasonably modified through physical interventions. Communicable diseases (notably infectious and parasitic diseases), non-communicable diseases (notably cardiovascular and lung diseases and malnutrition) and accidental injuries (notably road traffic injuries) were included. The coding system was continuously refined based on expert medical opinion as new health problems appeared. The coding system was used to create the simplified environmental health matrix presented in Table 2. A more sophisticated matrix was used during the sampling process.
Environmental health matrix
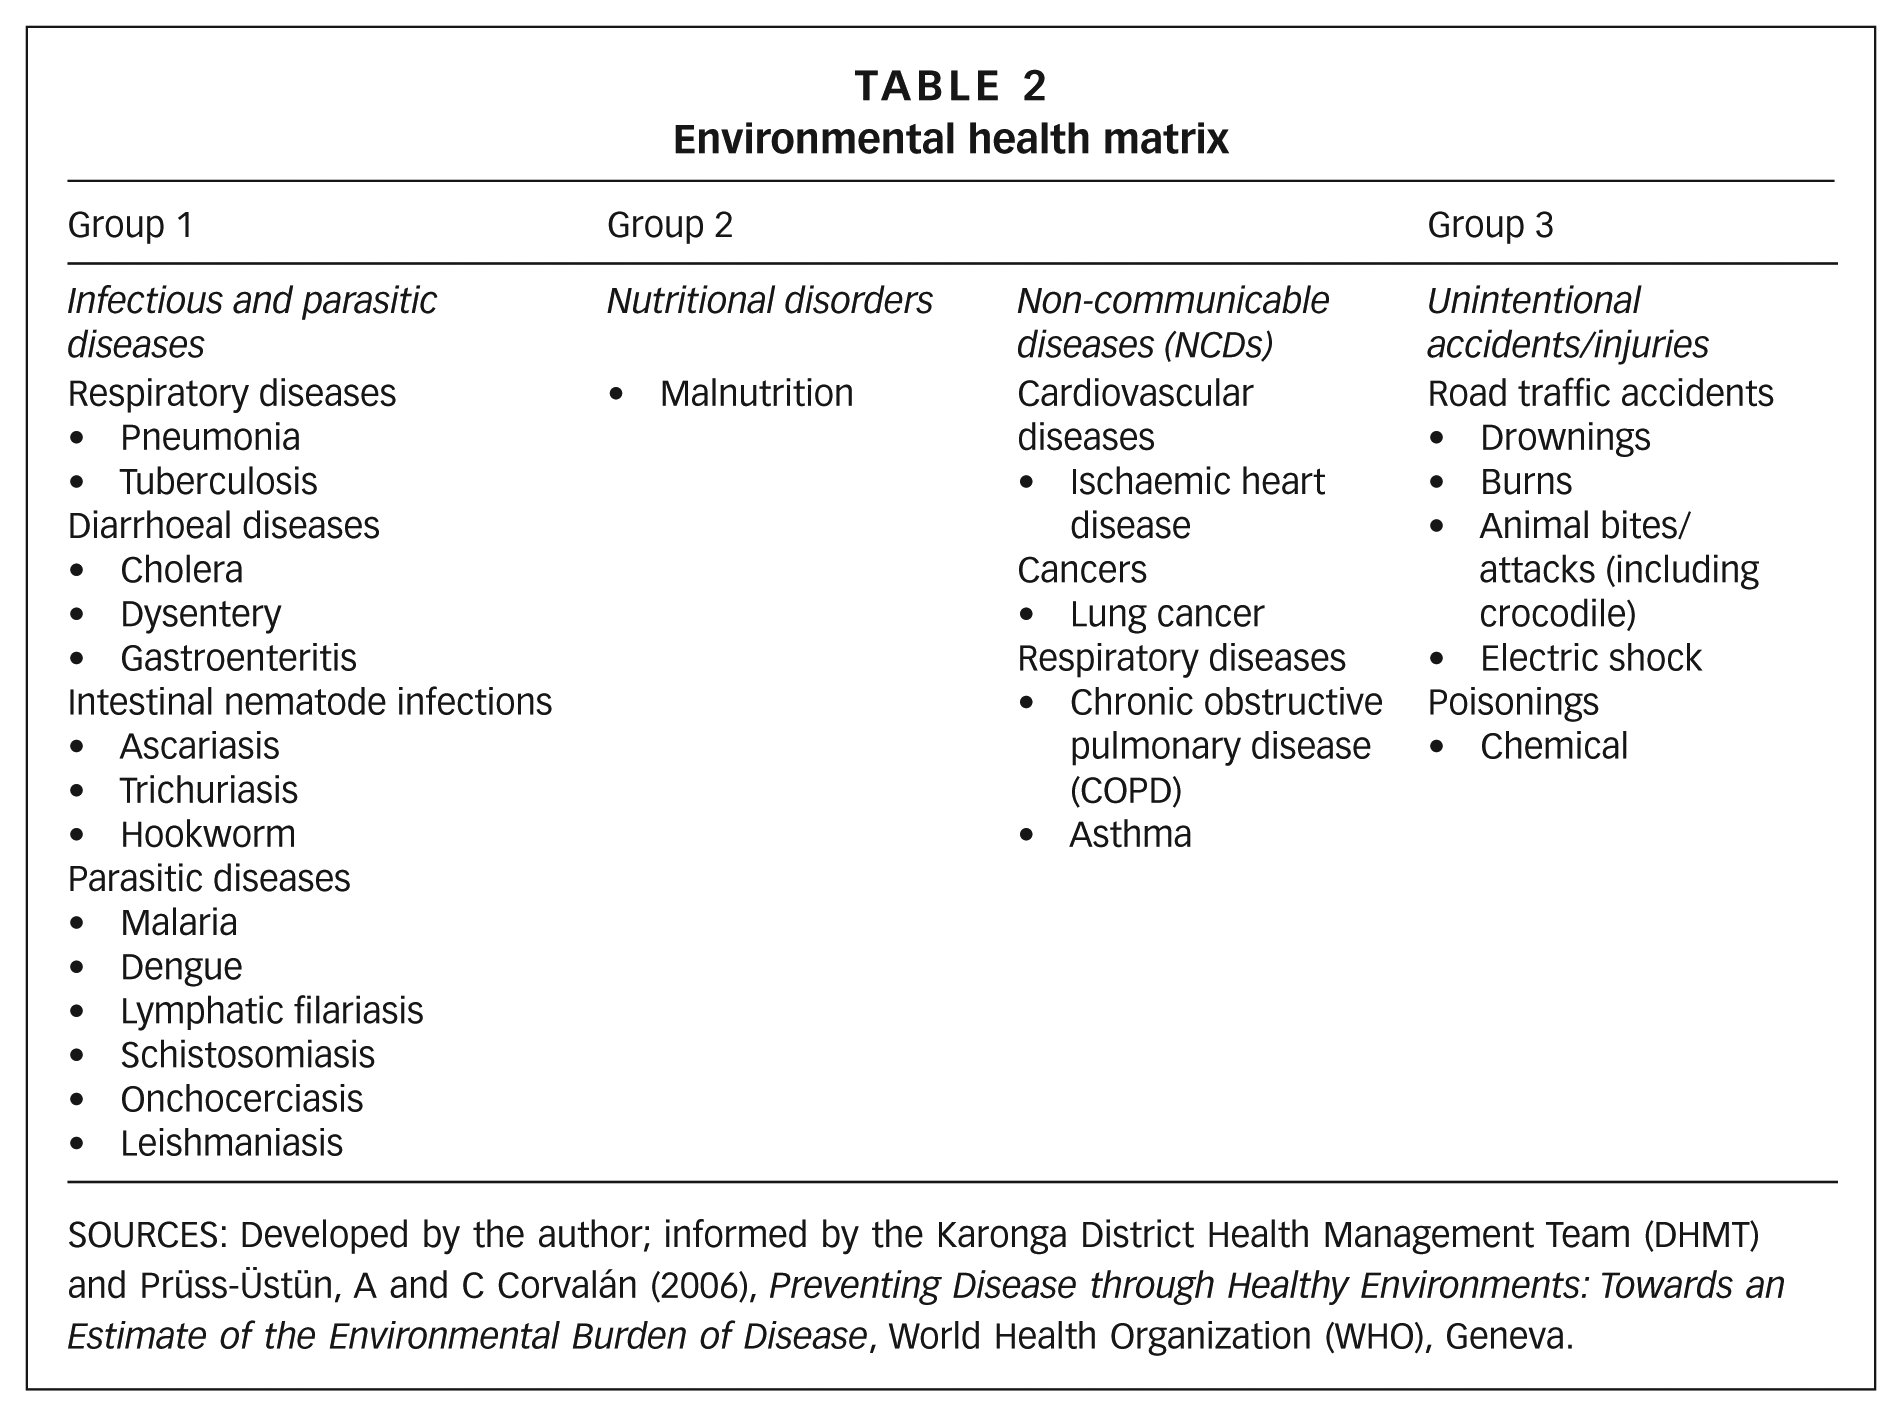
SOURCES: Developed by the author; informed by the Karonga District Health Management Team (DHMT) and Prüss-Üstün, A and C Corvalán (2006), Preventing Disease through Healthy Environments: Towards an Estimate of the Environmental Burden of Disease, World Health Organization (WHO), Geneva.
V. Findings
a. Numbers and causes of admissions
Of all 10,100 inpatients admitted to Karonga District Hospital during the study period (August 2016 to July 2017), 4,489 were from villages in Karonga Town, accounting for 44 per cent of all inpatients. However, 1,494 urban inpatients were excluded for having invalid records, including those that were illegible, or contained obvious errors or uncertain information (particularly with regard to clinical diagnoses), decreasing the sample to 2,995 (Table 3).
Sample population of urban patients from Karonga Town admitted to Karonga District Hospital, August 2016 to July 2017
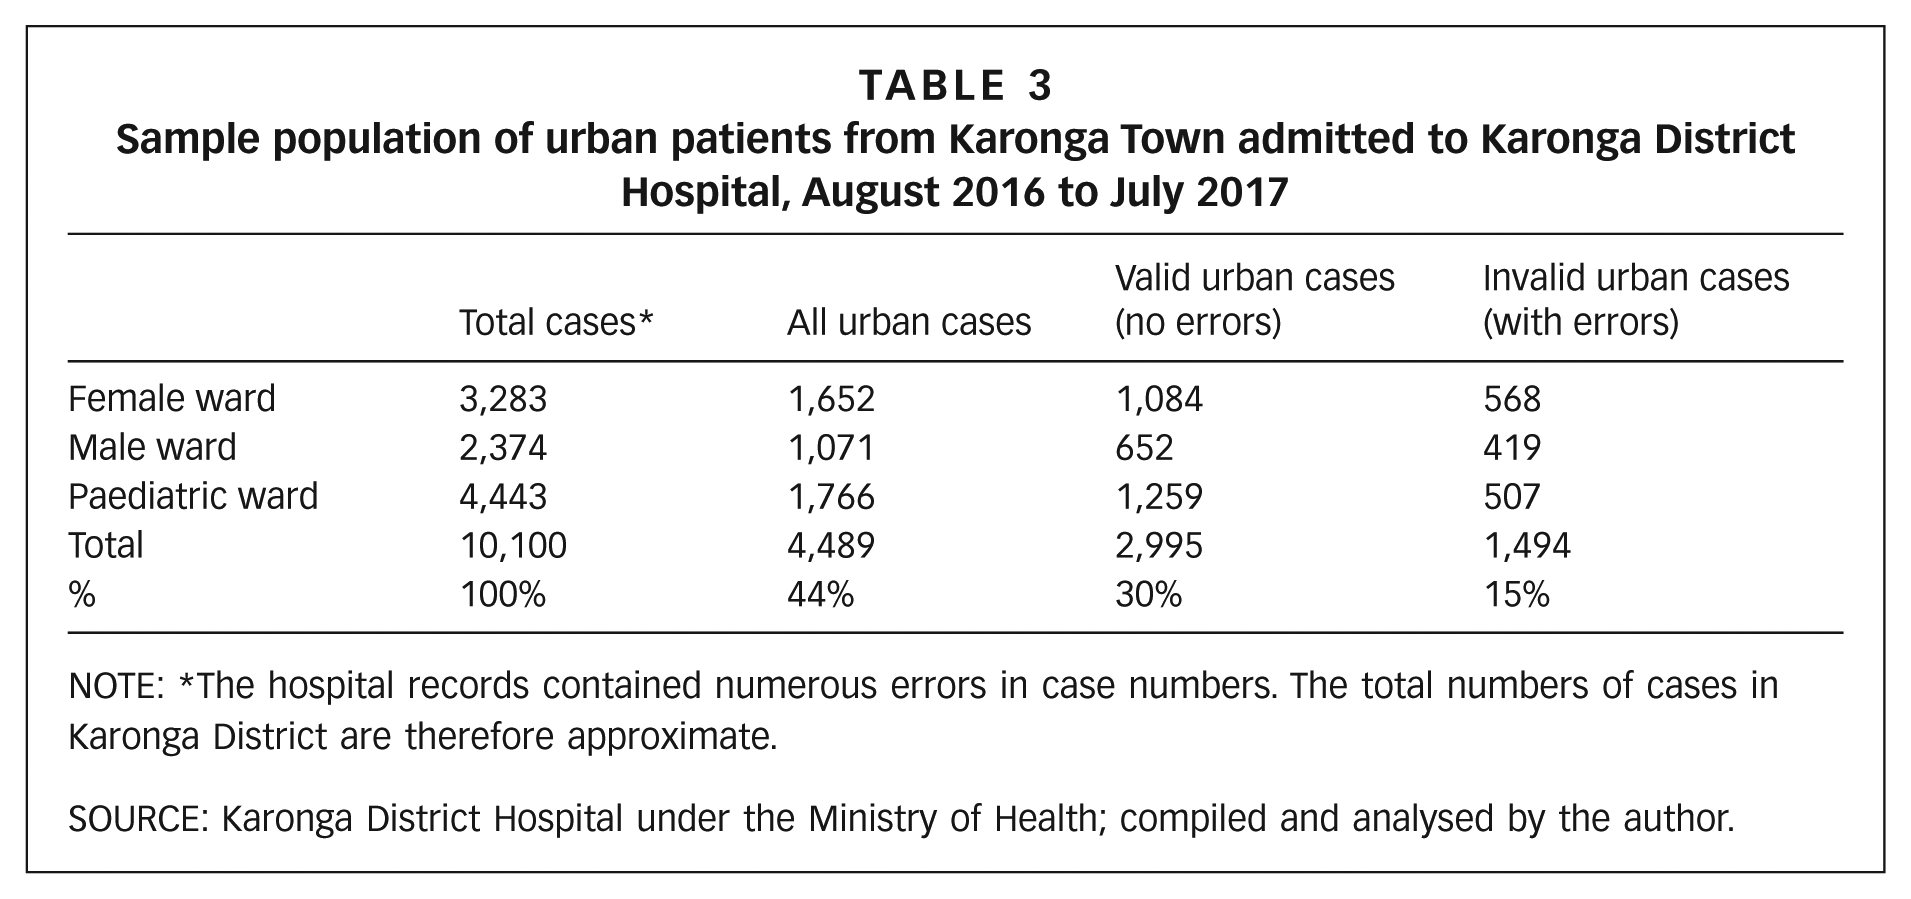
NOTE: *The hospital records contained numerous errors in case numbers. The total numbers of cases in Karonga District are therefore approximate.
SOURCE: Karonga District Hospital under the Ministry of Health; compiled and analysed by the author.
Because the urban inpatient population is likely to be representative of more severe manifestations of environment-related diseases and injuries requiring hospitalization, as discussed above, it is possible to draw some tentative inferences about the prevalence and distribution of environmental health problems in Karonga Town’s population during the study period. The findings reveal unexpectedly strong links between the environment and health.
First, the relative size of the urban inpatient population is significant not only in terms of patient caseload, but also in terms of population health. Assuming that Karonga Town had an estimated population of around 57,000 in 2017,(76) the 4,489 urban inpatients admitted to the hospital during the study period accounted for approximately 8 per cent of Karonga Town’s entire population in that year. More specifically, of the 2,995 urban inpatients with valid records, 63 per cent were admitted for environment-related diseases or injuries, accounting for 3 per cent of the town’s population at the time. This figure would have been higher if urban inpatients with invalid records were included in the sample.
Second, 64 per cent of all environmental health problems were attributed to infectious or parasitic diseases, suggesting the existence of biological pathogens (such as bacteria, viruses, worms, protozoa, fungi) and vectors (such as mosquitoes) in the town’s environment.
Third, 93 per cent of all environmental health problems were attributed to five main causes: malaria at 30 per cent, acute respiratory infections (namely pneumonia and tuberculosis) at 22 per cent, malnutrition at 19 per cent, accidental injuries at 13 per cent, and diarrhoea at 8 per cent. This observation points to the prevalence of environmentally related health problems that are largely preventable through physical improvements.(77)
Fourth, 41 per cent of all environmental health problems were experienced by infants and children 5 years and under, although no clear difference between the sexes was observed. This observation reflects the heightened susceptibility of younger age groups to infections and accidental injuries linked to local environmental health risks.(78)
Fifth, the rainy season (November–April) accounted for the largest share of environmental health problems, particularly diarrhoea and malaria, indicating a connection between flooding and water- and sanitation-related diseases.
Sixth, 57 per cent of all cholera cases recorded during an outbreak between January and July 2016 were concentrated in villages (notably Mwanjabala) along the lakeshore area (Table 4), where provision of water and sanitation is known to be poorest.(79)
Last, 38 per cent of all deaths were attributable to environmental causes, of which 28 per cent were from pneumonia (Figure 2). Overall, the findings support the hypothesis that Karonga Town is a hazardous place to live.
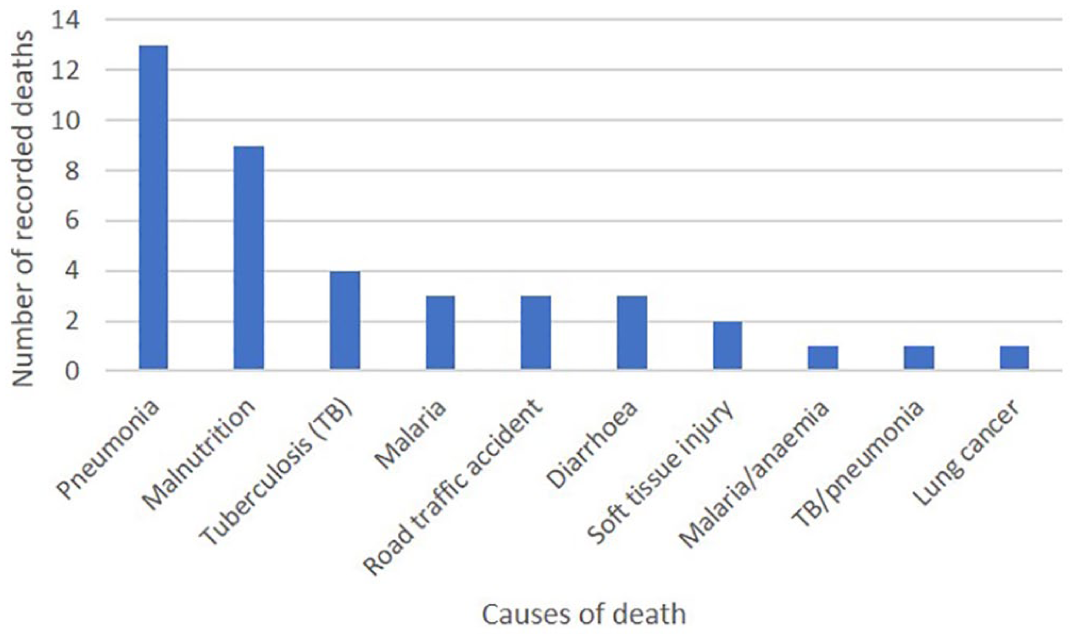
Causes of death linked to environmental health risks in Karonga Town’s urban inpatient population, August 2016–July 2017
b. Strengths and limitations
The analysis of hospital records generated disaggregated data on environmental health problems for Karonga Town’s inpatient population over a 12-month period, revealing trends and patterns in morbidity and mortality between groups (age and sex) and villages during different seasons. Used as a proxy for the town’s population, the urban inpatient records revealed that environmental health risks are the major factors in the prevalence of more severe health problems. This is a key strength of inpatient records: they are likely to be more representative than outpatient records since people with more severe ailments are more likely to seek care. The common argument that hospital data may underrepresent lower-income groups who cannot afford to miss work days may apply less in the case of life-threatening ailments for this reason. Indeed, people suffering from debilitating ailments (such as cerebral malaria) are unlikely to be able to work. The availability of affordable transport (namely bicycle taxis) combined with the town’s small size may also mean that lower-income groups may be able to reach the hospital without incurring much cost. However, those who are particularly unwell may require motorized transport, which may be too costly to hire if the hospital’s sole ambulance is unavailable.
A key limitation of using hospital records to enhance urban health intelligence is the lack of data on the underlying causes of disease in people’s living environments. While inpatient records can yield insight into the prevalence and distribution of health problems with known environmental causes or contributions, they do not provide information on environmental or social factors (e.g. the gender division of labour) that render some groups (e.g. women and children) more at risk than others. This point is important because it reaffirms the need for multi-level approaches to understand the determinants of health in urban environments,(80) as discussed in the concluding section.
The more specific strengths and limitations of using inpatient records to enhance urban health intelligence are as follows:
Strengths
Limitations
VI. Conclusions
From the discussion above, several key implications for future practice and research arise. While the focus is on Karonga Town, the insights are anticipated to be relevant to other towns and cities with limited health data and similar demographic, environmental and institutional challenges.
a. Implications for practice
However, while Karonga District Hospital is located in the town, its catchment area encompasses the entirety of Karonga District, so the data are not collected with urban health in mind. To serve as an urban surveillance site, the hospital would need to disaggregate the field in the registers for “home village” into “urban” and “rural” categories based on the sample framework developed for this study. This would require a simple change to the clinical coding system. Ideally, the registers would also be digitized to improve the reliability of the data by reducing recordkeeping errors, but this would require resources the health system currently lacks.
Cholera cases by village in Karonga Town during an outbreak, January–July 2016
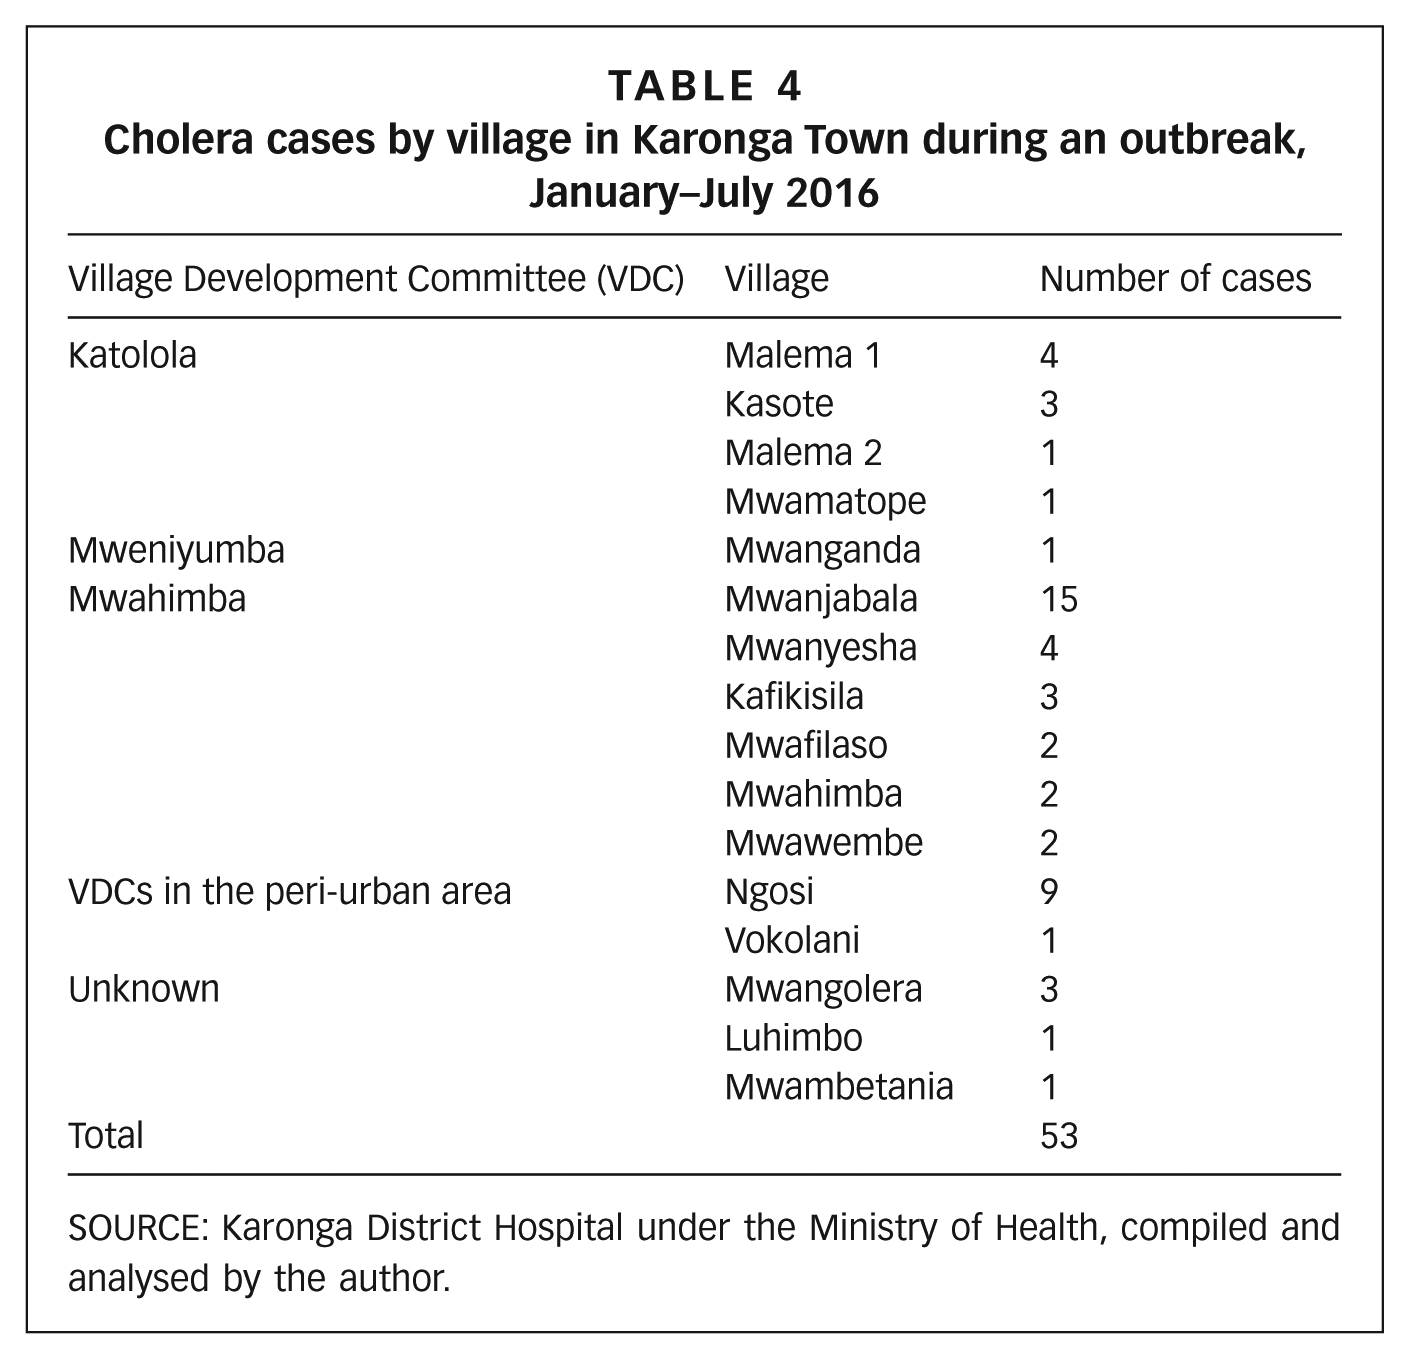
SOURCE: Karonga District Hospital under the Ministry of Health, compiled and analysed by the author.
b. Implications for research
Footnotes
Acknowledgements
I would like to thank my doctoral supervisors, Dr Cassidy Johnson and Prof. David Osrin, for their unwavering support throughout the research process. Special thanks go to Prof. David Satterthwaite for generously volunteering his comments on my thesis. Profound gratitude goes to the Bartlett Development Planning Unit (DPU), University College London, for selecting me as the recipient of the 2016 DPU60 Doctoral Award, and to the Chadwick Trust Committee at University College London for nominating me as its 2016–2017 Travelling Fellow and as its 2016–2017 Dr Jeroen Ensink Fellow. Without your support, my PhD would not have been possible. Last but not least, profound gratitude goes to Khumbo Kumwenda, my research assistant in the field.
1.
3.
10.
11.
12.
13.
14.
APHRC (2002); see also ![]() .
.
19.
22.
42.
WHO (2007); ![]() .
.
45.
46.
57.
Author field notes from 2017.
64.
At the time of writing, census data for individual urban centres were not available in the most recent 2018 Malawi Population and Housing Census Report. Instead, population figures for Karonga Town were drawn from the 2008 census.
66.
In larger and more established Malawian urban centres, community units are typically referred to as “neighbourhoods”. But in Karonga Town, they are referred to as “villages”, which reflects the town’s history as a rural settlement and the continuation of traditional norms.
67.
Manda (2014); ![]() .
.
68.
74.
DHMTs are responsible for the planning and management of health services at the district level.
79.
Manda (2014); ![]() .
.