
Abstract
Projections suggest that most of the global growth in population in the next few decades will be in urban centres in Asia and Africa. Most of these additional urban residents will be concentrated in slums. However, government documentation of slums is incomplete and unreliable, and many slums remain undocumented. It is necessary to employ creative methods to locate and sample these understudied populations. We used satellite image analysis and fieldwork to build a sample of Indian slums. We show that living conditions vary along a wide-ranging continuum of wellbeing; different points correspond to different policy needs. We also show that most variation in conditions is due to differences across rather than within neighbourhoods. These findings have important implications for urban policy. First, satellite data can be a useful tool to locate undocumented settlements. Second, policy must be appropriately nuanced to respond to wide-ranging needs. Finally, variation patterns suggest that policies should be targeted at the neighbourhood rather than the individual level.
I. Introduction
What do we really know about the lived experiences of the urban poor? To what extent do their conditions vary? Is there social mobility within poorer urban spaces, or does one’s initial position in the urban strata determine where one ends up? These questions have important academic and policy implications, yet they call for data that are not routinely available. In an effort to provide initial answers, this paper reports on a large-scale data collection effort across three cities in India. This effort was undertaken to circumvent deficiencies in the official data on India’s slums,(1) and to draw attention to their policy implications. This study made use of satellite data as part of its approach to identifying undocumented slums, and this satellite-based sampling methodology is a major contribution of the work reported here. We discuss the importance of utilizing novel sampling methods to study slums and also present evidence on living conditions across three Indian cities. This study provides the most comprehensive documentation of the range of conditions and policy needs in Indian slums to date.
The extensive data collection effort in India began in 2010. An earlier paper documents the distinct policy challenges for the least and most well-off slums within one city.(2) This current paper, which shares an author with the earlier paper, expands on that work, drawing from what is now a three-city database on 8,257 households across 279 slums, where conditions span the two extremes identified in the previous paper. As was the case in the original city, many of these slums, especially those at the lower end, are not included in official data.
We provide rigorous evidence to show that settlements, including those omitted from official data, span a wide range of conditions and present different policy needs. Contrary to a naïve, generic notion of slums and slum dwellers, our findings show that the urban poor vary considerably in their economic wellbeing and access to services. We also show that household outcomes cluster strongly within neighbourhoods and that much of the variation in lived experiences is between neighbourhoods. Policy must be nuanced and responsive to the highly varied challenges facing the urban poor and the neighbourhoods in which they live.
II. Background
Collecting data on slums is a messy exercise. It can be difficult to locate slums and define their boundaries, and in many cases it is impossible to trace a household over time. Furthermore, statistics vary based on how slums are defined. UN-Habitat, a United Nations agency that has become an international authority on slums, presented the following understanding in its first global audit of slum conditions:(3)
Slums are too complex to define according to one single parameter.
Slums are a relative concept and what is considered a slum in one city will be regarded as adequate in another city – even in the same country.
Local variations among slums are too wide to define universally applicable criteria.
Slums change too fast to render any criterion valid for a reasonably long period of time.
The spatial nature of slums means that the size of particular slum areas is vulnerable to changes in jurisdiction or spatial aggregation.
UN-Habitat has refined its definition of slums over time to improve measurability, but it is still generic. Without insisting upon any minimum number of households, it defines a variety of undesirable living conditions that usually pertain to households in slums:
1) Inadequate access to safe water
2) Inadequate access to sanitation and infrastructure
3) Poor structural quality of housing
4) Overcrowding
5) Insecure residential status(4)
Identifying slum households as those that are deficient in one or more of these living conditions, the UN agency found that, in 2014, India had as many as 104 million slum dwellers. Compared to Indian government estimates, this number seems closer to the facts on the ground as depicted by independent grassroots investigations.(5) Indian government agencies have only recently started to count the number of people who live in slum settlements, and different official agencies often employ conflicting methodologies. Adopting one definition of slums, the National Sample Survey Organization counted 44 million slum dwellers in 2008. Adopting another definition, the Census of India counted 65 million slum dwellers in 2011. Regardless of definition, these official agencies commonly underestimate the slum population.(6) These issues are hardly unique to India; across the global South, there is an “astonishing lack of data about informal settlements”.(7)
Scholars and practitioners appreciate that official statistics underestimate urban poverty but also that they oversimplify complex and wide-ranging realities.(8) Case studies, ethnographies and field knowledge support claims that socioeconomic status and ability to access services vary substantially among urban residents in developing countries.(9) However, systematic evidence is lacking on the vast range of conditions within and across slums. In other words, not only is the true number of people in slums not clearly known in official circles, but there is little information available that can provide guidance on how policies of service provision and urban poverty reduction should be adjusted to account for the varying needs of people in slums with different living conditions.
Current policy does not appreciate these nuances. Federal policy dictates a minimum standard of living, but states also play a role and are responsible for further developing and implementing urban policies.(10) State and local governments draw rudimentary distinctions across slums: some slums are officially recognized and legally allowed to remain while others are deemed untenable(11); there is considerable variation across states in these policies.(12)
Once a slum is officially “notified” – after going through a protracted many-stage process culminating in official recognition – that slum is supposed to be provided with a set of public services. Service provision is not systematic, however. Some unrecognized slums are provided with public services, while many that are officially recognized go without. Service access can vary greatly depending on the political networks of informal slum leadership.(13) There is no discernible system in how service provision is prioritized.
Furthermore, there is hardly any evidence on poverty dynamics. How slum settlements differ at a single point in time is poorly understood, and how their trajectories change over time is almost completely unknown. More data and analyses are required to determine how more carefully targeted investments in urban economies might translate into opportunities for those at the bottom of the urban pyramid. Rectifying gaps in knowledge is essential for using resources more wisely. In this study, we employ a satellite-based methodology to sample and collect original survey data from over 200 Indian slums. Our analysis of the survey data is a beginning in filling the gaps in knowledge on the range of conditions and policy needs in urban slums.
III. Study Context
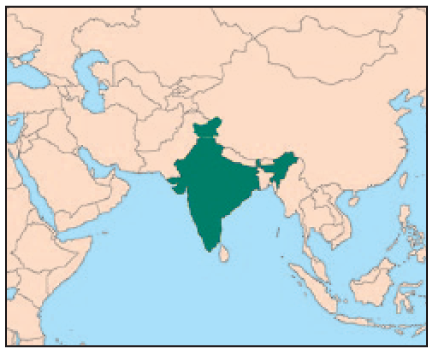
Our study focuses on three Indian cities – Bangalore (now Bengaluru), Jaipur and Patna – each a state capital, and located respectively in the south, west and east of the country. These cities are not only diverse geographically, but also vary along economic, cultural and political dimensions.
Bangalore, the first city sampled, and the wealthiest and most rapidly growing of the three, has received global attention for its booming information technology (IT) sector. The wealth associated with these opportunities engenders the “Bangalore dream” of a sophisticated and internationally competitive hub of globalization.(14) However, the majority remains excluded from these opportunities, disconnected from the policies that privilege the corporate sector, and hurting from the effect of the tech boom on real estate prices.(15)
Jaipur has recently been growing due to investments in real estate as well as IT, though not to the same extent as in Bangalore.(16) More important to Jaipur’s economy are the artisanal crafts trade, which has deep historical roots, and tourism. The city was historically India’s first planned city, walled off, divided into grid sections, and covered by an organized network of roads and infrastructure. The different grid areas within the walled city were occupied by different types of craftspeople stratified by caste.(17) Jaipur has expanded beyond the walled areas over time, but little information exists on how well the city has planned in recent years.(18)
Patna is the poorest and slowest-growing city in our sample.(19) Bihar remains one of the poorest states in India and much of its development focus has been on rural areas.(20) The government estimates that over 90 per cent of Patna remains unplanned.(21) Ground evidence suggests that more than half of the city’s residents reside in slum-like conditions, a glaring contradiction of the official census estimate that only 3 per cent of Patna’s residents live in slums.(22)
IV. Methods
We conducted six waves of original surveys in these three cities between 2010 and 2016. The method of sample selection in the first (2010) survey reflects the extent of our knowledge at that time. Following a track taken by much prior research on slums, we obtained a list of notified slums in Bangalore from the municipal authority (Karnataka Slum Development Board), and randomly selected 14 slums from this official list for investigations.(23)
Interviews with a random sample of 1,481 households showed that the slums on this official list are home not so much to the city’s poorest people as to a settled lower-middle class, most of whom have lived in Bangalore for multiple generations. Multi-storey permanent construction prevails; electricity connections and clean drinking water are commonly available; TVs, pressure cookers, and electric fans are commonly owned; poverty is low compared to the city average; 41 per cent own the homes they live in, and of these homeowners, 70 per cent possess official papers.(24)
This list appears to omit the city’s poorest neighbourhoods; but we also find that other municipal lists omit many of the notified slums we describe here. We examined a sample of 75 notified slums across three official government lists. Only one slum appears on all three lists, implying that the majority of slums recognized by one government agency are not recognized by other government agencies charged with related tasks of urban governance.
a. Identifying and defining slums: Bangalore
Since the official data sources were of little help, we began to develop new, more reliable methods of slum identification. Following a path taken by other analysts,(25) we looked to leverage satellite images. We started by examining images publicly available on Google Earth. We divided the spatial borders of the area administered by Bangalore’s municipal authority into quadrants. Considering each quadrant separately, we began manually examining satellite images in an effort to identify urban residential areas that were visually distinct in terms of a few key criteria that were developed in successive iterations of image analysis and ground verifications. These included lack of space between shelter units, roofs that appeared to be low-quality based on colour (ranging from blue tarps to weathered brown or grey), a haphazard arrangement of shelter units, lack of proper roads, and lack of shadows adjoining the shelter units, signifying that they are low to the ground, thus not multi-storey.(26) Figure 1 shows satellite images of a non-slum neighbourhood and two slums with different visible slum-detection criteria.
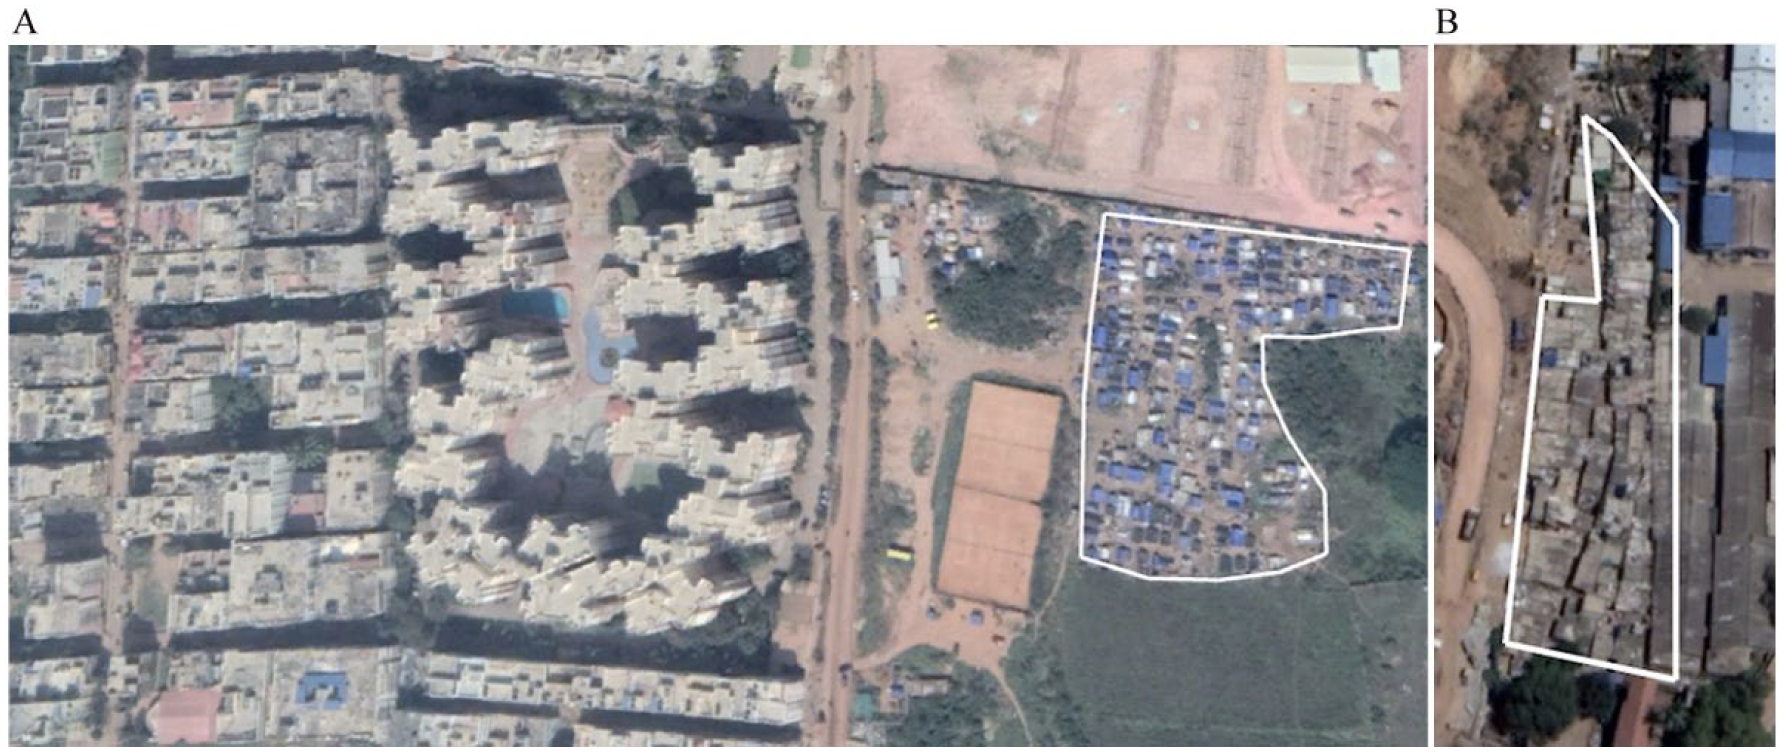
Satellite images of non-slum areas and slum areas: 2018
Figure 1A shows both a non-slum area (left) and a slum area (1B) outlined on the right. It is clear from this image that the non-slum area does not display any of our shortlisted criteria, while the outlined slum displays all of them. The slum area is distinctly more crowded and has a distinct colour due to the different roof materials. The slum area is haphazardly arranged, while the non-slum area looks carefully planned and geometrically arranged. The slum area also has no roads and the brown colour of the ground shows the foot paths are made of dirt. In contrast, the non-slum area appears to be built around gridlike, concrete roads. Finally, no shadows are visible in the slum area, but shadows in the non-slum area indicate the buildings are much taller.
Figure 1B illustrates another slum area that meets fewer visible slum-like criteria than the slum in Figure 1A. This slum boundary – or “polygon” – is distinct from both the slum in Figure 1A as well as the non-slum area in Figure 1B. In this image, we see that the buildings are crowded and haphazardly arranged without proper roads. However, the colour and presence of shade indicates these buildings are taller and made of sturdier materials than those in the slum shown in Figure 1A.
Figure 1 illustrates the qualitative characteristics that we inductively determined are important to identify slums in Bangalore. Ground verifications consisting of oral histories of the settlement and examinations of its official status – including notification and property titles – helped confirm or reject our preliminary identifications. In our ongoing work, we are attempting to determine the feasibility of developing algorithms to quantitatively define and identify slum areas with satellite data. For the scope of this study, we continued to rely on inductive strategies to develop qualitative identification criteria, which we expanded to two other Indian cities.
b. Identifying slums: expanding to Jaipur and Patna
In 2016, we began expanding our data collection efforts to Jaipur and Patna. We again turned to satellite images to build a database, and information provided by local partners helped to refine our query. In Jaipur, we began with a list of geolocations of 273 slums compiled by a colleague over several years of fieldwork.(27) We again split Google Earth into quadrants and we plotted all 273 slum boundaries in Google Earth in order to examine the range of visible characteristics. We also plotted five additional slums for our sample, based on discussions with local partners, who provided potential locations for more recently formed slums. We again inductively identified visibly distinct criteria. In Jaipur, three criteria emerged as important to manually discern slum areas for this preliminary identification: lack of space between shelter units, a haphazard arrangement of shelter units, and homogeneity of shelter density. We clustered slums into four rudimentary types based on the density and arrangement of the buildings. Examples of images of each of the four types are shown in Figure 2.
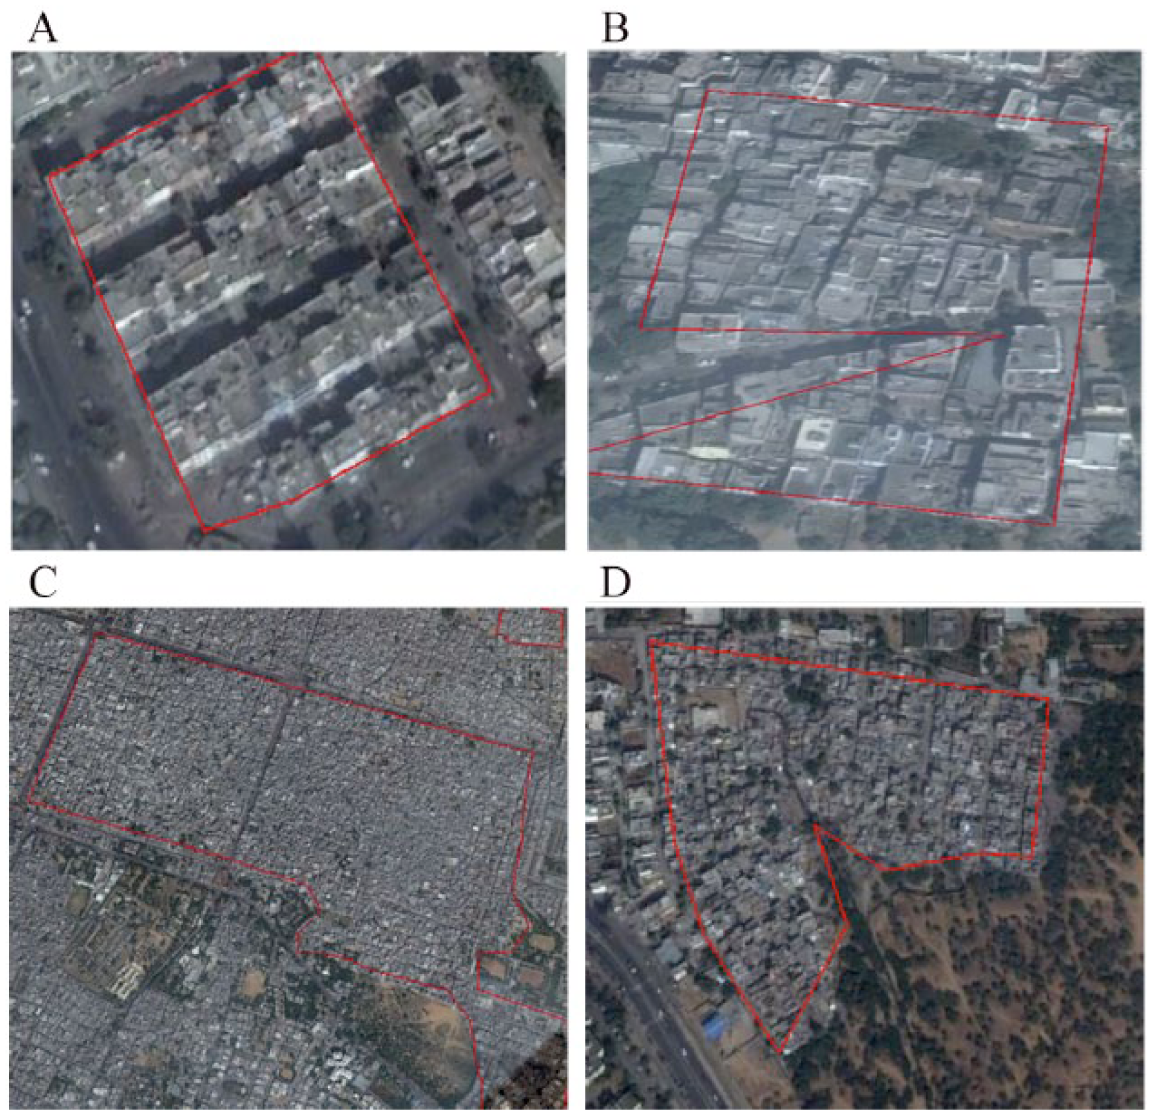
Examples of images of Jaipur satellite types
Identifying slums in Patna produced unique challenges. We began with a list of 113 slums provided by a local partner, Support Programme for Urban Reforms (SPUR).(28) We again turned to Google Earth to plot the slums, but found that slum boundaries were indistinguishable; most of the city displays slum-like characteristics in satellite images, as shown in Figure 3. For Patna, we could not identify a sample based on satellite image classifications. Finer-grained images than those publicly available on Google Earth would be necessary to discern slum characteristics.(29) In the following subsection we discuss the sampling strategy we employed instead.
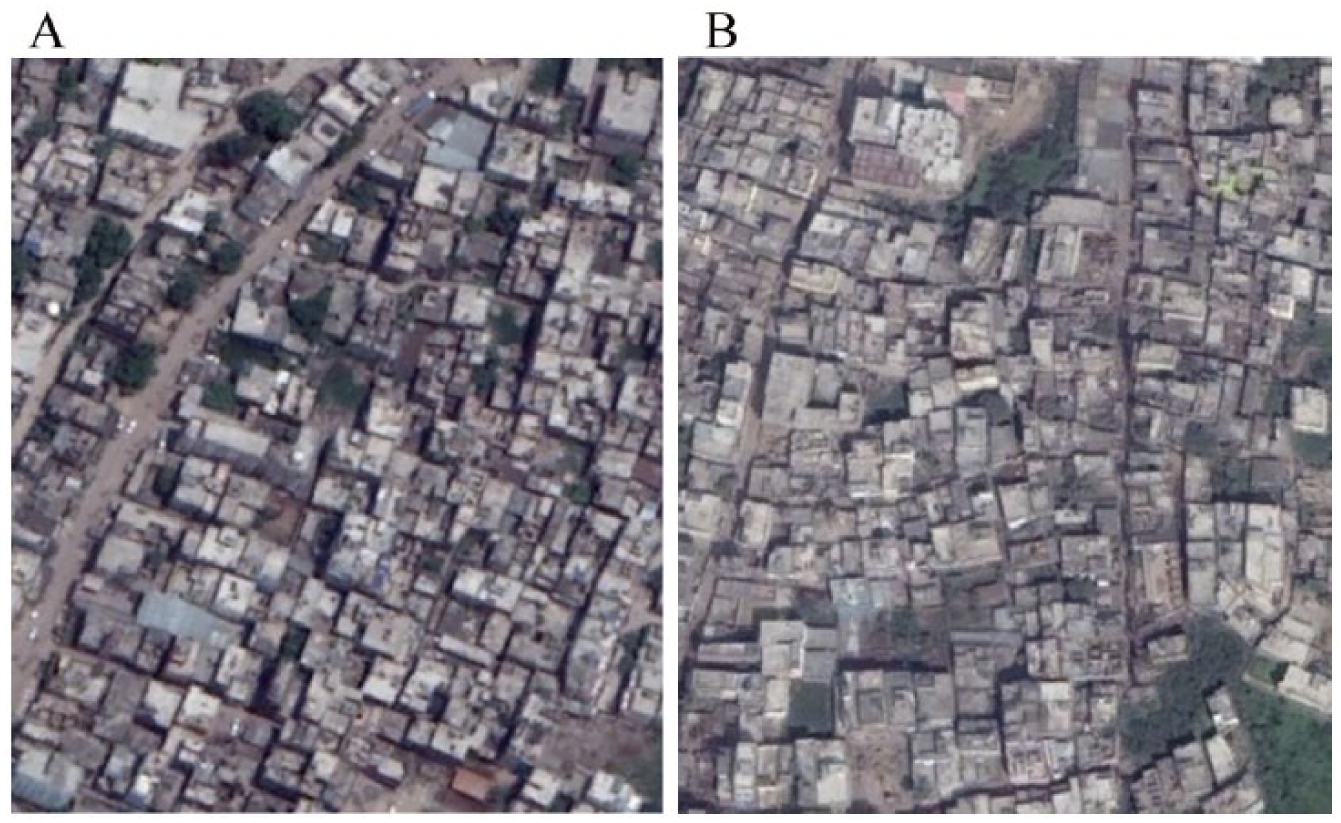
Satellite images of Patna slums
c. Sampling and surveying neighbourhoods and households
After the initial survey wave conducted in notified slums in Bangalore in 2010, we conducted five additional waves of original surveys in Bangalore, Jaipur and Patna. Of the four waves undertaken in Bangalore – in 2010, 2012, 2013 and 2015 – the first two were documented in the earlier paper.(30) The next two waves were undertaken in Jaipur and Patna in 2016. Incremental improvements were made to a pretested set of survey instruments across successive waves.
As already noted, in our first round of household surveys, we randomly selected notified slums from an official government list and randomly selected households to visit within these neighbourhoods. We began relying on a satellite-based sampling methodology with our second survey round. In this second round, we focused on the neighbourhoods we identified in Bangalore with all five discernible slum criteria (as shown in the slum in Figure 1A). We dubbed this group the “blue polygons,” as the blue tarp roofs of these tent neighbourhoods are distinctive in the satellite images. We identified 61 such settlements in all, and our ground-verification exercises revealed that these initial identifications were accurate in nearly all cases.
We then stratified by quadrant and randomly selected 18 of the 61 identified “blue polygon” slums to sample. Within these 18 slums, we conducted focus group surveys, asking about slum histories, available neighbourhood amenities, and an estimate of the number of households in the settlement. We planned to survey one-third of the total households in a neighbourhood, adjusting the sampling interval in smaller slums to get a minimum of 60 households. Based on the settlement size, we developed a sampling interval (i.e. every third, fourth or fifth home), randomly selected a starting point, and then followed a right-hand rule to sample households. Because both men and women in these households were at work during daylight hours, we conducted surveys early in the morning. We alternated between surveying men and women regardless of who the household head was. Our household surveys spanned topics including demographics, migration histories, livelihoods, tenure and work insecurity, monthly expenditures, policy priorities, political preferences, and participation in neighbourhood activities.
In order to learn more about conditions between these two poles – the notified slums sampled in 2010 and the “blue polygons” sampled in 2012 – we turned to a third round of surveys. In 2013, we conducted neighbourhood surveys in 157 slums that we first identified from Google Earth. We then verified from ground observations that these slums were not in our original non-satellite-based sample, and did not appear to be “blue polygons”. These neighbourhood surveys helped fill important data gaps. Most importantly, we generated a more complete map of Bangalore’s slum population, identifying a range of places where people were living in slum-like conditions, but in settlements not on the official list of slums – either because they had not applied for official notification, or because their applications were in process or had been rejected. These first three waves helped us pinpoint the range of slums in Bangalore and the varied living conditions they represented. In our fourth wave of data collection, undertaken in Bangalore in 2015, we selected slums representing the full range of living conditions. For these waves, we followed the same sampling methodologies to select neighbourhoods and households as in the prior waves, and we utilized nearly identical neighbourhood and household survey instruments.
For our fifth round, in Jaipur in 2016, we maintained methodological consistency with our previous waves by randomly selecting slums, stratified according to location in the city and discernible satellite characteristics. For example, if 10 per cent of all slums were located in the northeast quadrant and were of the type with the most discernible slum-like characteristics according to satellite images, then four out of 40 slums of the poorest type from the northeast quadrant were randomly selected for the study sample. In total, we conducted 2,718 household surveys and 45 neighbourhood focus group discussions.(31) We followed the same household sampling protocol as in Bangalore, and used nearly identical survey instruments. In this wave, we also conducted qualitative interviews with 91 local slum leaders and collected data on social networks for every household within four slums.(32)
Finally, in our sixth survey round in Patna in 2016, we were not able to rely on satellite images. Instead we utilized survey data available from our partner organization to classify slums into rudimentary groups. The data included metrics on durability of housing, access to sanitation, and access to streetlights – characteristics that could be distinctly visible to the naked eye in other cities. We used these data to classify slums into two groups – those with higher and lower infrastructure quality, based on the results of a cluster analysis.(33) In this round, we again added three more slums to our sample based on discussions with local partners, who provided the locations of newer slums of varying conditions spread throughout the city. To maintain consistency with our methods in the other cities, we randomly selected slums, stratified by location in the city and physical characteristics. For example, if 20 per cent of the sample frame consisted of slums with lower infrastructure quality located in the northeast quadrant of the city, then 20 per cent of our randomly selected sample would be from the northeast quadrant and would have lower infrastructure quality. In total for Patna, we conducted 2,155 household surveys, 43 neighbourhood focus group discussions, 78 qualitative interviews with local leaders, and four social network census surveys.(34)
All data waves are summarized in Table S1 in the supplementary information available online. This subsection has described our sampling strategy in detail; refining and implementing a satellite methodology to identify and sample slums is a major contribution of this work. We are currently working to develop remote sensing tools to enable slum detection and classification from higher resolution satellite images, enabling a more complete depiction of sites of urban poverty than can be gained from official maps and lists.
d. Calculating a “slum score”
While building our sample, we remained agnostic on how to define slums in order to inductively identify visible criteria. However, in order to precisely measure the spectrum of conditions within and across these three cities – as revealed by our survey data – we adapt the UN-Habitat definition of slum living conditions presented in Section II of this paper.(35) We build upon the definition in several ways to create operationalizable definitions at the household and neighbourhood levels.
The UN-Habitat definition simply indicates whether or not a household meets each living condition or not, whereas we develop a score based on the quality of each indicator. For instance, the UN defines “crowding” as having more than three people per room, but it does not account for the size of the room. We adjust by measuring square footage available to each person. We choose to exclude security of tenure from the score so that we may explicitly examine the relationship between tenure status and relative deprivation. The indicators used to score each household and slum are summarized in Table 1. Of the seven indicators we utilize, five are measured at the household level and two are measured at the neighbourhood level.
Summary of indicators used to calculate slum score
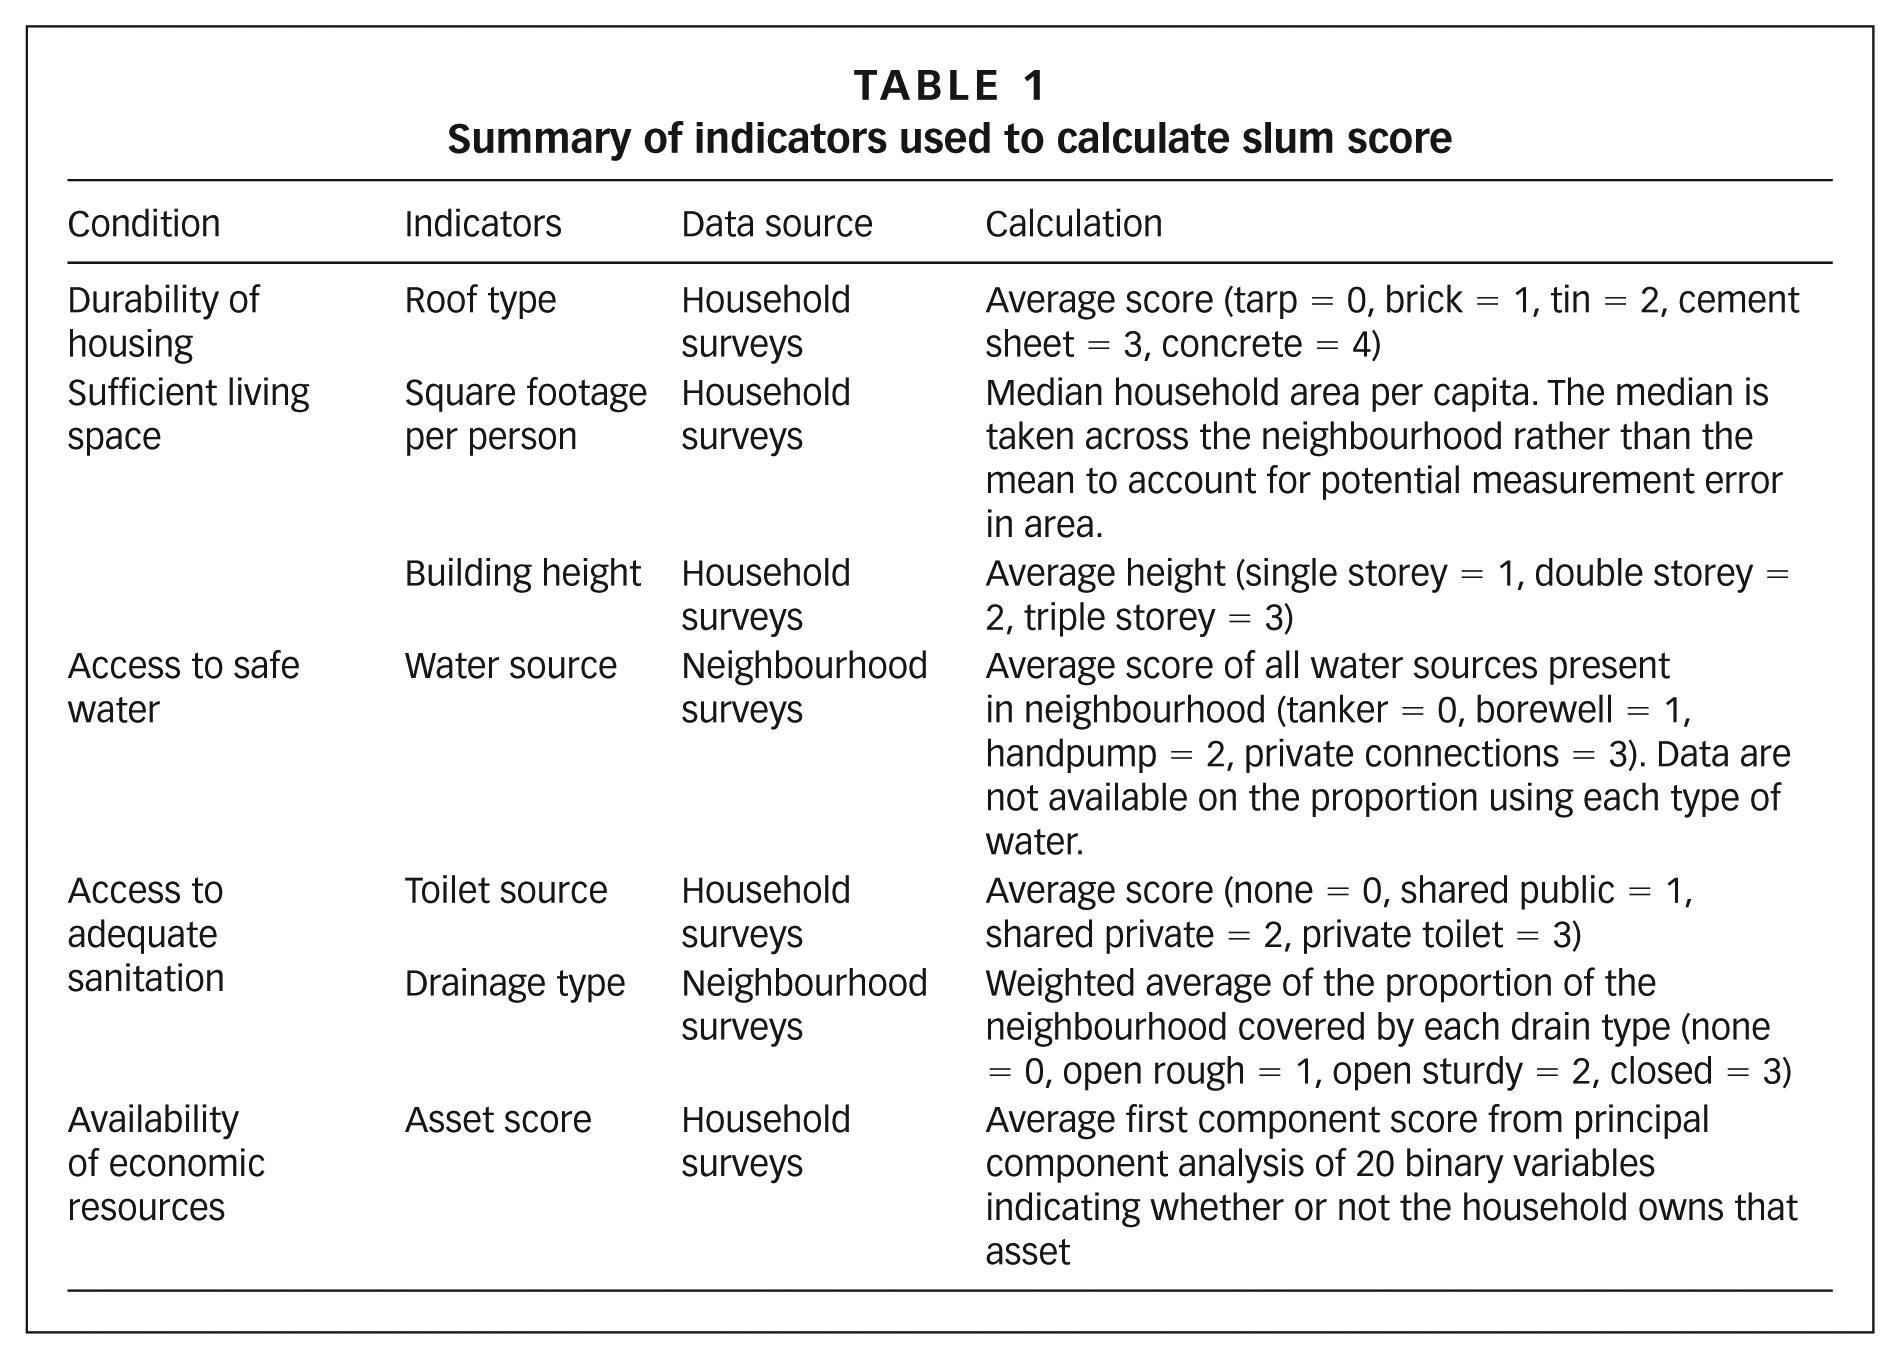
We calculate scores from the wellbeing indicators for data collected in 2015 in Bangalore and in 2016 in Jaipur and Patna.(36) We create household-level scores from the five variables measured at the household level in Table 1 – roof type, square footage per person, building height, toilet source, and asset score. We calculate scores by running principal components analysis on the indicators. Principal components analysis is frequently used to reduce multiple indicators to a single score, essentially weighting each indicator by how well that indicator explains differences across observations.(37)
We create slum-level scores from the neighbourhood-level indicators. For the five indicators measured at the household level, we first compute the average by slum. We again calculate the score using a principal components analysis of the slum-level values for the seven indicators.(38) The slum-level score is hereafter referred to as “slum score”. Households in slums with higher scores have sturdier roofs, better toilets, better water and drainage infrastructure, and more spacious and taller homes, and they hold more assets on average.(39)
e. Examining the characteristics that vary with “slum score”
Undertaking a series of regression analyses, we investigate the relationships between a slum’s score (reflecting its position on the slum continuum) and neighbourhood-level characteristics, household characteristics, tenure security and presence of informal slum leadership. The independent variables are described in Table S2 in the online supplement. Understanding the relationships between slum score and each of these independent variables is an important first step in developing targeted policy prescriptions.
A slum’s ability to attract and procure government services may be related to neighbourhood-level characteristics.(40) In interviews, policymakers and activists speculated that both age and size may contribute to de facto acceptance of the slum by the government, so we include slum age and number of households.(41) We also include a score for services other than water and sanitation, the two services integral to the UN-Habitat definition of a slum. We do not include whether permission was obtained to settle on the land because interviews reveal that permissions can be unclear and reversible.
Household characteristics are likely related to household wealth.(42) We examine differences by caste and religious group. We also examine migration status to determine whether migrants are collectively less well-off, years in the current slum to determine whether there is a relationship between time settled and wellbeing, and expenditures on travel to rural villages to identify circular migrants as a special class of transient migrants. Human capital measures – education and job type – are commonly employed in analyses of wealth, and we incorporate these measures into our model. Finally, we include a measure of social mobility to examine whether upwardly mobile individuals are more likely to live in slums with higher scores.(43)
Tenure security may be a prerequisite to wellbeing.(44) We include three measures relevant to security. First is the proportion of residents who perceive their slum to be notified. We use the household perception variable rather than actual status because ascertaining the actual status of official notification proves to be well near impossible. Diverse official agencies work within Bangalore, for instance, and each agency provided a different list of slums with notified status.(45) Furthermore, the notification process takes years; depending on where the slum is in the process, it may experience varying levels of security.(46)
We also include measures of individual-level security. House and land titles are included as tangible evidence of formal access to land. Ration cards are included as tangible examples of formal individual identification. We include ration cards rather than voter ID cards or unique IDs because variation is highest for ration cards.
We include an indicator for whether or not the slum has a local leader. There is a growing body of literature on the crucial role that informal slum leaders play in procuring services for their neighbourhoods, and helping residents navigate bureaucratic hurdles to access services.(47)
We regress slum score on each of these independent variables and cluster standard errors by city to account for characteristics that could systematically influence errors within each city. The regression coefficient on each independent variable can be interpreted as the extent to which the slum score increases when that variable has increased by one unit.
f. Examining changes over time
We also examine whether – on average – there are improvements in conditions over time. We employ multiple analyses to examine whether entire neighbourhoods experience improvements, as well as whether, as individuals become wealthier, they move to neighbourhoods with higher slum scores.
To provide evidence on neighbourhood dynamics, we examine the relationship between slum age and slum score from our regression analyses, and we qualitatively examine longitudinal satellite images from a random sample of slums.
To provide evidence on individual dynamics, we examine the relationship between individual-level economic mobility and slum score from our regressions. We also measure social mobility as the difference between the ranking of occupational prestige of the (male) respondent and that of his father, using an index developed specifically for India.(48) We calculate whether slums with higher scores have experienced greater intergenerational mobility as captured by these occupational prestige scores. Finally, we utilize neighbourhood-level data to provide a rough estimate of how often individual families move in and out of slums with different scores.
These analyses and our findings are discussed further in the next section.
V. Findings
To shed light on the differences between official data and our sample, we compare some key statistics. Because official data are not easily available for these three cities, we compare our sample instead to the average for slum households for India as a whole, as described in the 2011 census. Given the range of conditions across Indian cities, this comparison can be considered roughly indicative.
We find that respondents in our sample are considerably less well-off than is the case for this average. For example, while the 2011 Census of India estimates that 66 per cent of slum households have toilets, only 55 per cent of households in our sample do. The census reports that 94 per cent of slum dwellers live in sturdy or semi-sturdy households, but only 72 per cent of our sample live in houses made of bricks, wood or cement, while nearly 30 per cent reside under tarps or in mud or tin huts. The census also estimates that 53 per cent of households store money in banks, but our sample reveals approximately half of that figure.
Moving beyond comparing simple averages, we utilize the household and slum-level scores to provide evidence on the range of conditions. To evaluate the extent to which household conditions vary within and across slums, we calculate the proportion of variation in household scores attributable to variation within neighbourhoods, across neighbourhoods, and across cities.(49)
Table 2 shows that the largest share of the variance in household conditions can be attributed to differences across slums. This has important policy implications, as it suggests that policies should be targeted at the slum level rather than the individual level. It also suggests there is a wide range of conditions across neighbourhoods within the same city. Given this, we next turn to slum-level analyses.
Variation in household scores within and across slums
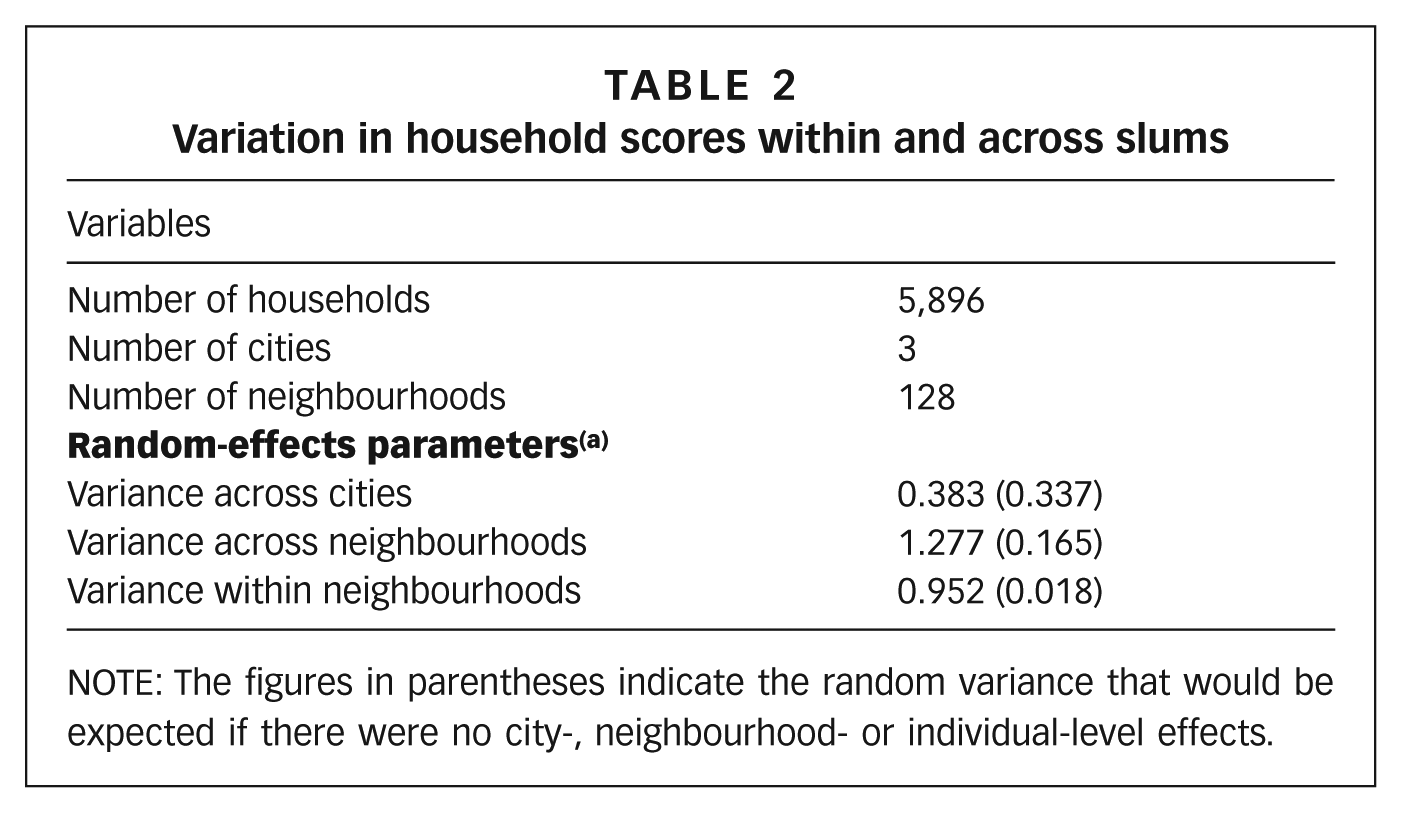
NOTE: The figures in parentheses indicate the random variance that would be expected if there were no city-, neighbourhood- or individual-level effects.
Figure 4 plots the range of slum scores in ascending order. There is a distinct pattern: slums fall along a defined continuum, rather than constituting a small number of distinct groups, which we also checked with cluster and factor analysis.(50) If the change in score were constant from one slum to the slum with the next highest score, then the scores would fall along a 45-degree line. Instead, in the bottom quartile of the spectrum, there is a greater difference in wellbeing from one slum to the next, and the incremental increase tapers off after that. Slums toward the top of the continuum are differentiated by much finer differences. Slums toward the top also blend in with planned lower-middle class neighbourhoods in terms of livelihood patterns and physical character, which makes it hard to distinguish between them from satellite images alone.
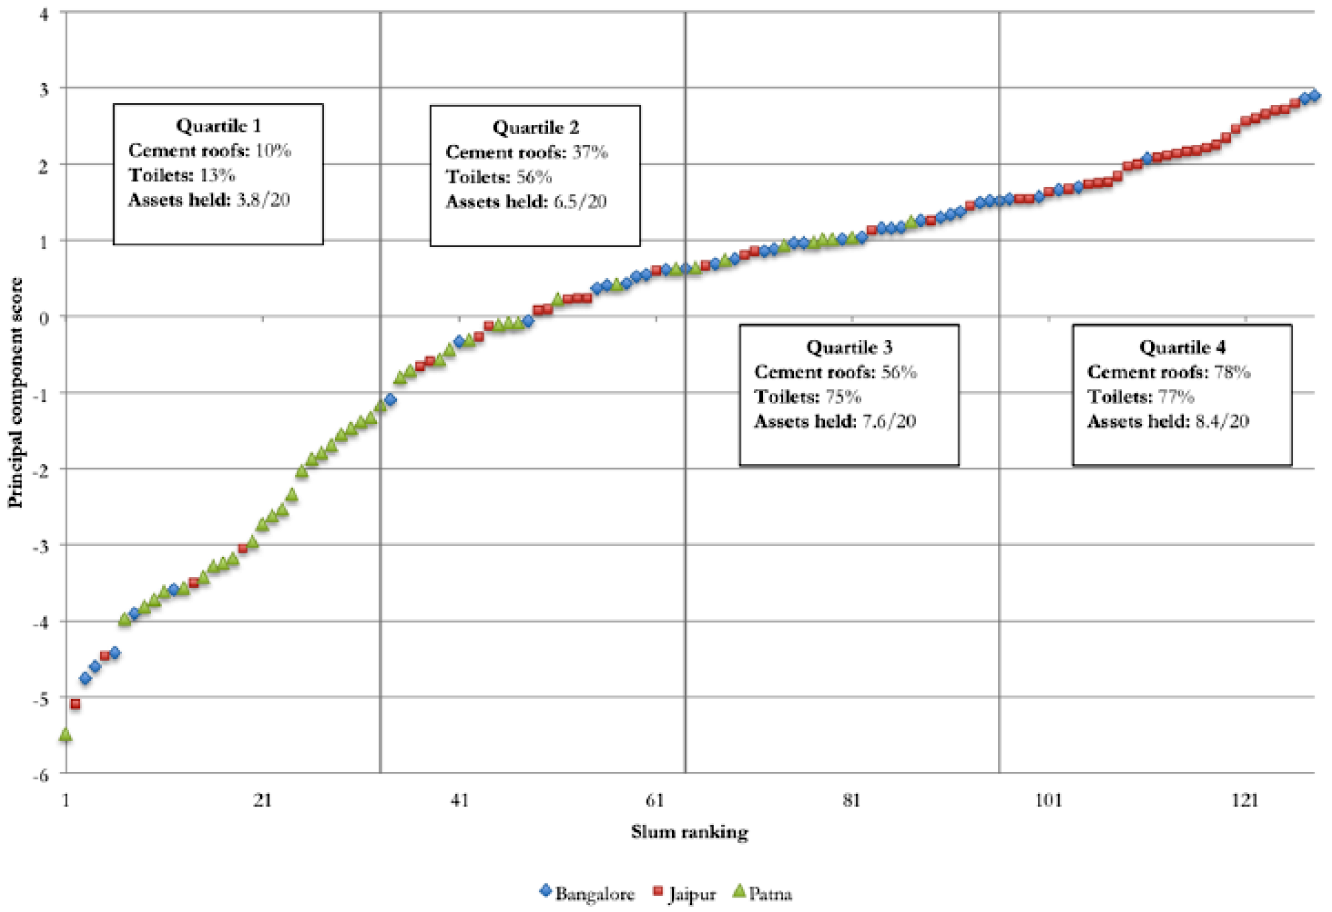
Slum rankings and associated continuum scores
We provide three ethnographic descriptions of slums at different positions on the continuum to illustrate the substantive differences across principal component scores. Harding Park, in Patna, is located at the very bottom of the continuum and is the worst-off slum in our sample. Life in Harding Park is precarious. The 40 families that live there are accustomed to the cycle of displacement and relocation within a one-kilometre radius. Their current location is between the railway tracks and a busy road. To enter the settlement, they climb either up a mound of trash or through a hole in the roadside wall. There are no modern conveniences here. Five people sleep to a “room”: a 9-foot by 13-foot hut with mud floors and recycled political posters wrapped around posts. There are no toilets, drains, electricity or water. To subsist, men, women and children beg and pick trash, as their parents did before them. None of the respondents have spent a day in school and only two children have cumulatively spent three years in school. No households have ration cards or receive any government benefits. Several women tell us they have been scammed by people who promise ration cards in exchange for money but never return.(51) All respondents report conflicts with other residents over water or other resources in the slum. There are no community meetings or organizations.
Govardhanpuri Dhalan, in Jaipur, near the top of the continuum, provides a sharp contrast.(52) Residents enjoy greater physical and subjective wellbeing. Set back from the main road at the base of a hilltop temple, this settlement provides many more comforts. Multi-storey concrete buildings are carefully planned around four main streets. Buildings are painted bright colours and adorned with decorations; several buildings have balconies. Cars, motorbikes and trees line the streets. Looking up, one sees electricity wires and satellite dishes. Almost all households have piped water and metered electricity connections. Only 8 per cent of survey respondents work in manual labour, 88 per cent have ration cards, and 85 per cent of respondents say they feel very safe from eviction.
Patna’s Nehru Nagar Musahar Toli is an example of a slum with intermediate conditions.(53) Houses are multi-storey and sturdy; 48 per cent have private water connections and 67 per cent have toilets. Almost all respondents (88 per cent) report having a ration card. However, half of the respondents feel very insecure from eviction. The majority of respondents have not gone to school, and men largely toil in daily wage labour. Sewage runs uncovered through the neighbourhood despite frequent complaints from the residents.
a. Policy needs vary
Life varies tremendously for the residents living in these three exemplar slums. Disparities extend beyond the differences in physical indicators used to calculate the slum score, as illustrated in Figure 5.
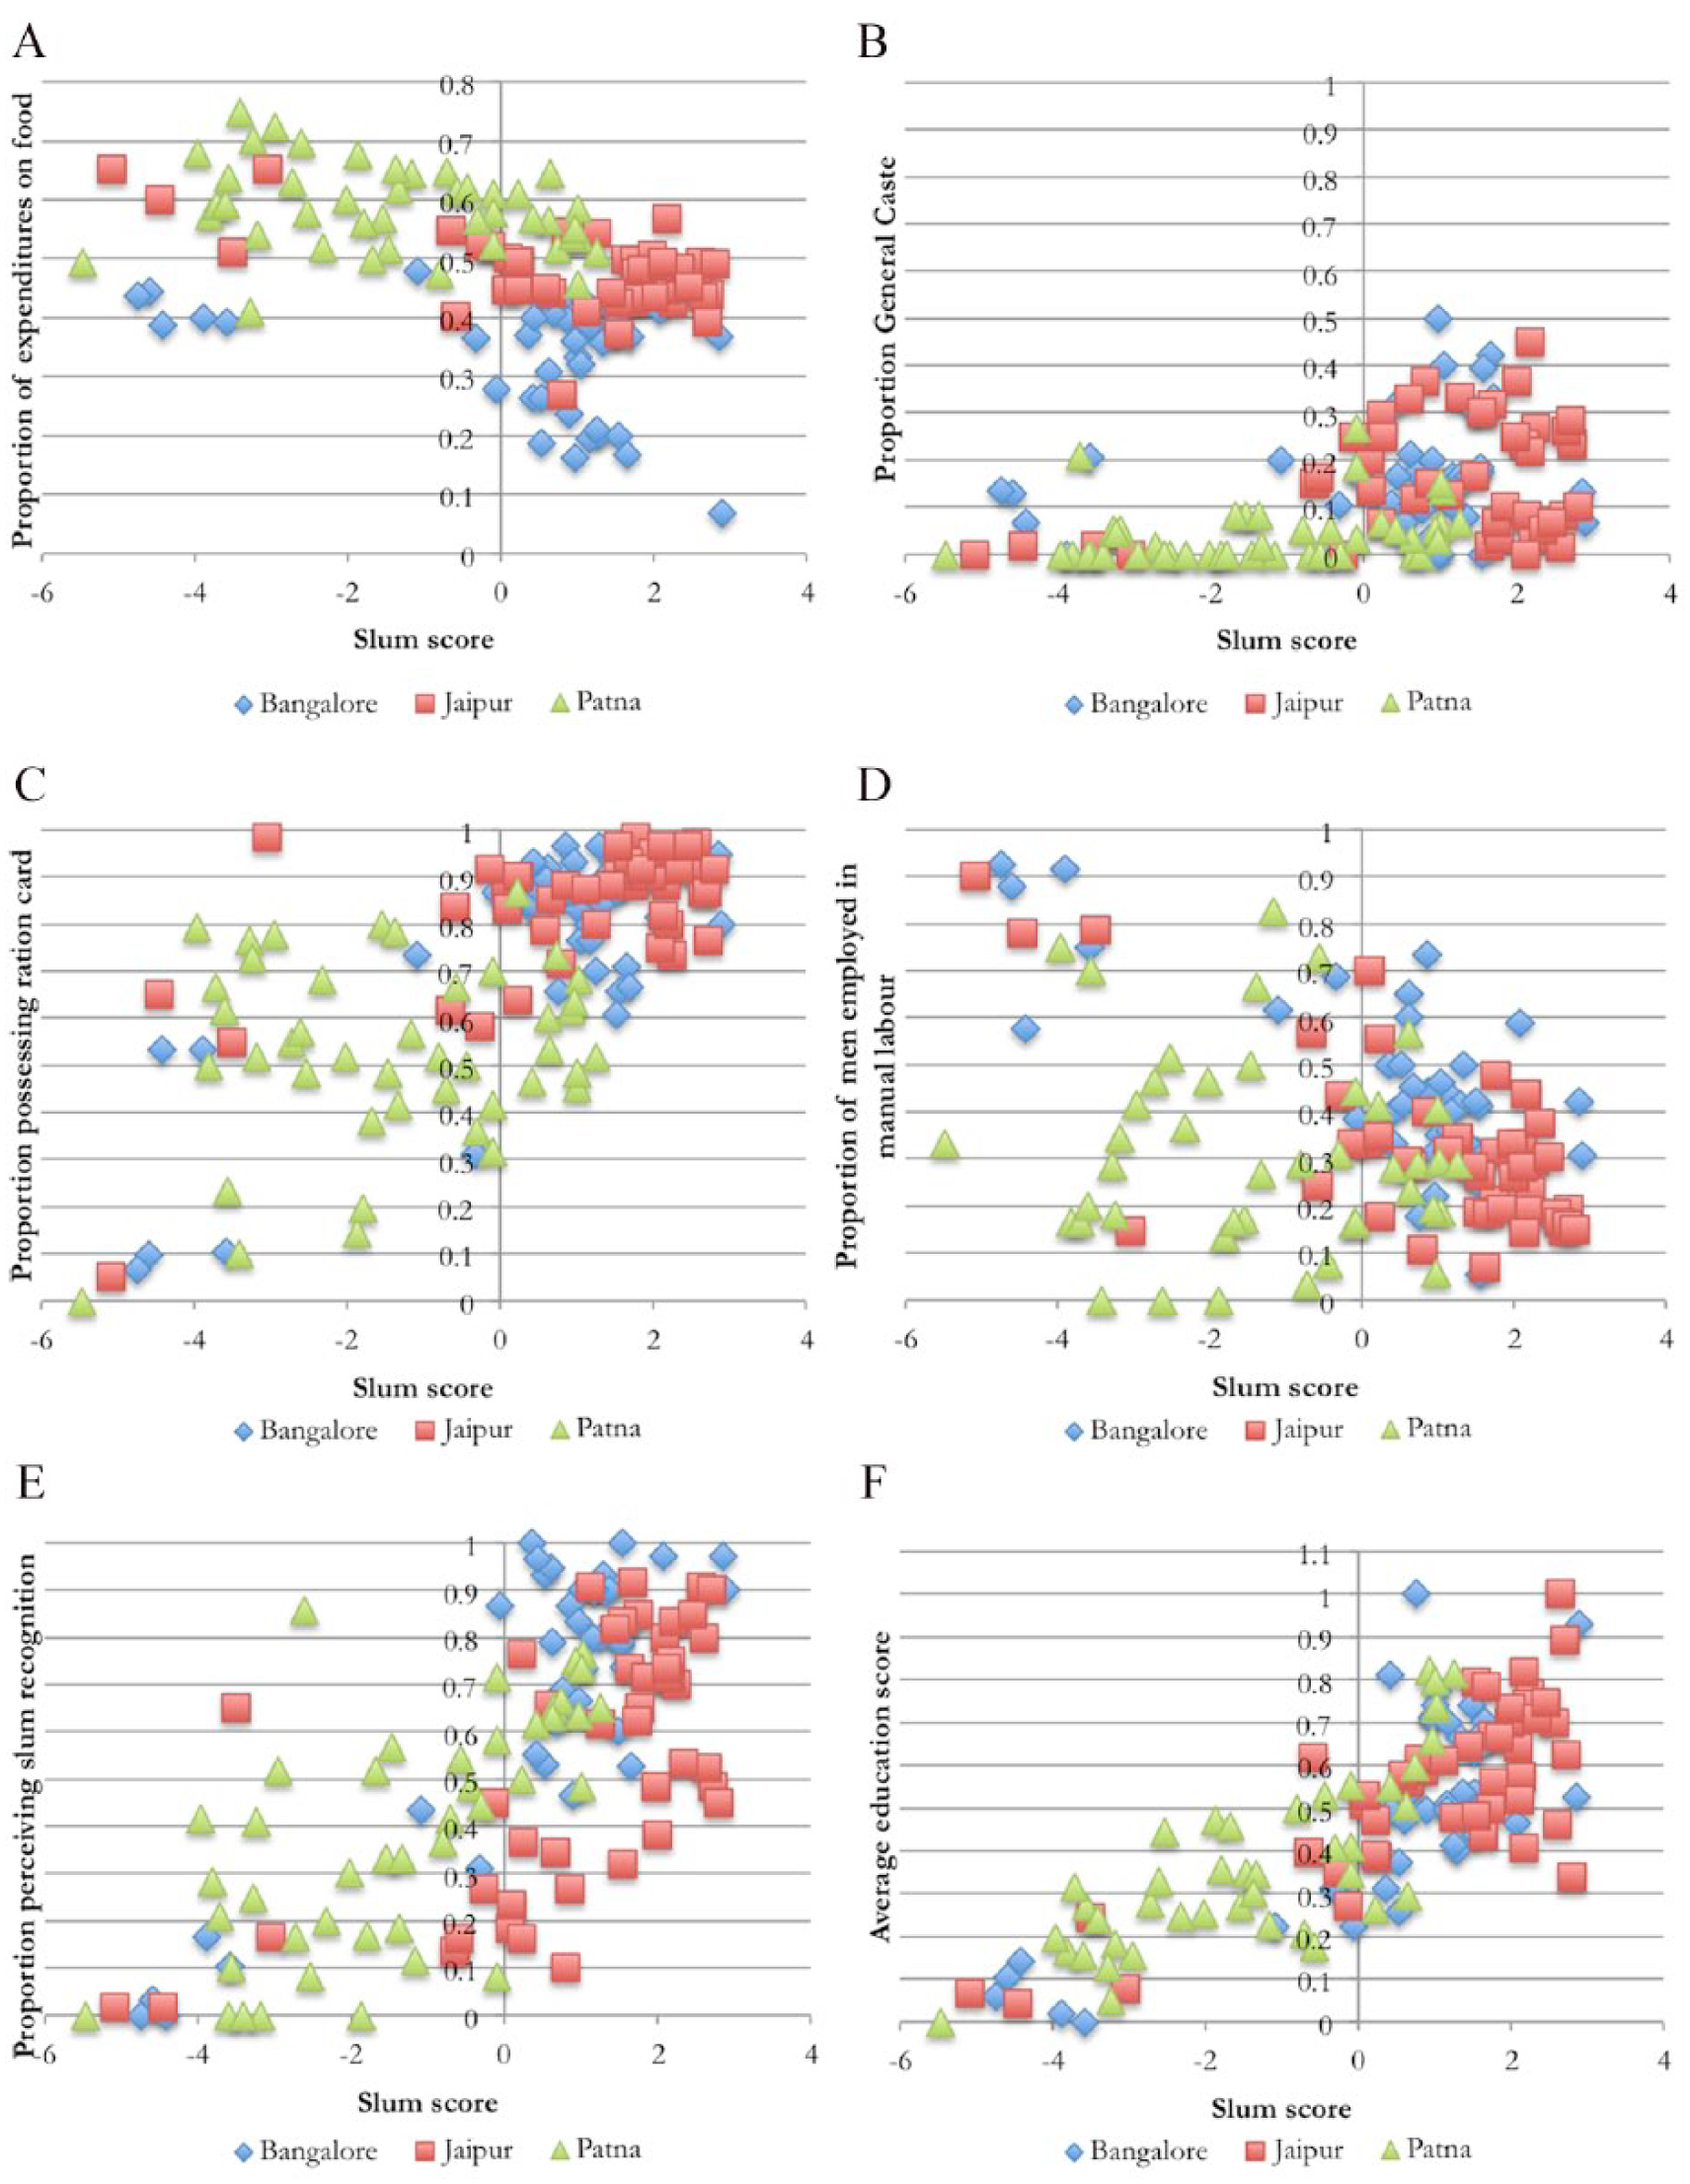
Characteristics across the continuum
Levels of food and housing security vary along the continuum. In the bottom quartile, households allot an average of 59 per cent of all expenditures to food. This figure decreases to 47 per cent for houses in slums in the top quartile. Similarly, only 22 per cent of households in the bottom quartile perceive their slum to hold collective tenure (slum recognition), compared with 71 per cent for slums in the top quartile. Only 51 per cent of households in bottom-quartile slums possess ration cards, which are a prerequisite to collect government entitlements. In contrast, 88 per cent of households in top-quartile slums have ration cards – which may seem like a perverse finding, except that, in general, residents of better-off slums are better provided with diverse official documents.
Respondents also express different public needs at different points along the continuum. For slums in the bottom quartile, households are divided on whether they believe the most pressing public need is water (27 per cent), housing (27 per cent), or toilets (25 per cent). Neighbourhoods in the top quartile have different concerns. The most commonly stated need for those in the top is waste management (30 per cent); and the second most cited need is employment training (14 per cent). Knowing where along the continuum a slum is located helps to target public services more effectively.
b. Demographics vary
Scheduled Castes and Scheduled Tribes (SCs and STs) are overrepresented across all slums relative to the Indian average (consistent with Shah(54)). Even larger concentrations of historically marginalized castes are found in the poorest slums. In bottom-quartile slums, only 3 per cent of residents are General Caste (a residual category, after excluding SCs and STs and other backward castes [OBCs]), and 62 per cent of people are Scheduled Caste or Scheduled Tribe. In contrast, in the top-quartile slums, 17 per cent of households are General Caste and 46 per cent are Scheduled Caste or Scheduled Tribe. Religious demographics do not vary in the same way. The sample is majority-Hindu across the continuum.
The majority (70 per cent) of slum dwellers in our sample were born in the city where they currently reside. Of the 30 per cent who were not born in the city and have migrated there, 77 per cent migrated from within the same state. These statistics contrast with the rhetoric employed by policymakers in interviews who perceive slum dwellers to be mostly migrants travelling from other states and even countries.(55) Yet, on average, slum dwellers in our sample have lived in their current home for 21 years. While there is not a uniform relationship between position on the continuum and the proportion of migrants in a slum, a greater share of bottom-quartile slum residents are migrants than are top-quartile residents (37 per cent versus 28 per cent).
Notably, nearly all slum residents are employed in the informal sector. Fewer than 5 per cent of respondents report having jobs that come with health care and retirement benefits. However, the proportion of male slum dwellers employed in some of the most gruelling jobs decreases with slum score. In bottom-quartile slums, 48 per cent of men rely on daily wage labour, factory work or construction work; this number reduces to 25 per cent for men in top-quartile slums. Correspondingly, human capital levels, as captured by education levels, systematically increase along the continuum. The average education level is 1.9 standard deviations higher in the top quartile than the bottom.
c. Geographic differences
Wellbeing varies across our sample cities. Figure 4 shows that slums in Patna are more likely to score along the bottom half of the continuum, Bangalore slums dominate the third quartile, and Jaipur slums are most common in the fourth quartile. Though Bangalore and Jaipur slums cluster along the top half of the continuum, there are slums in both cities with squalid conditions as terrible as those found in Patna’s poorest slums. Figure S1 in the online supplement plots the distributions of slum scores within each city.
Conditions span a wide range in all three cities, but not all sections of the continuum are represented in every city. The boxplots in Figure S1 reveal a gap between the poorest slums in Jaipur and Bangalore and the rest of the slums in those cities that proves to be statistically significant. In Patna, however, the range of difference is narrower; overall, service provision levels are lower than in the other two cities.
While there appear to be two highly distinct groups in Bangalore, the groups are fuzzier in Jaipur. Who lives in these outlier groups and why are they distinct?
The outliers in Bangalore are blue polygon slums. These slums are comprised of recent migrants with one foot in the city and one foot in the rural village. On average, these slums are smaller (104 versus 802 households) and younger (settled 8 versus 52 years ago) than other Bangalore slums. In Jaipur, the poorest slums are more rooted in the city than Bangalore’s blue polygons, but they remain just as segregated from city infrastructure. Residents have lived in Jaipur’s least well-off slums for 21 years on average, which is more than three times the average length of the residents of Bangalore’s blue polygons. While less transient than Bangalore’s blue polygons, Jaipur’s poorest settlements remain as peripheral to government services as Bangalore’s poorest circular migrants.
d. A slum’s position on the continuum
We see that slums in Patna are generally quite deprived, with Jaipur and Bangalore slums generally better-off in comparison. There are clusters of slums in Bangalore and Jaipur, though, that are as deprived as Patna’s poorest slums, consistent with our finding that conditions vary more across neighbourhoods than across cities.
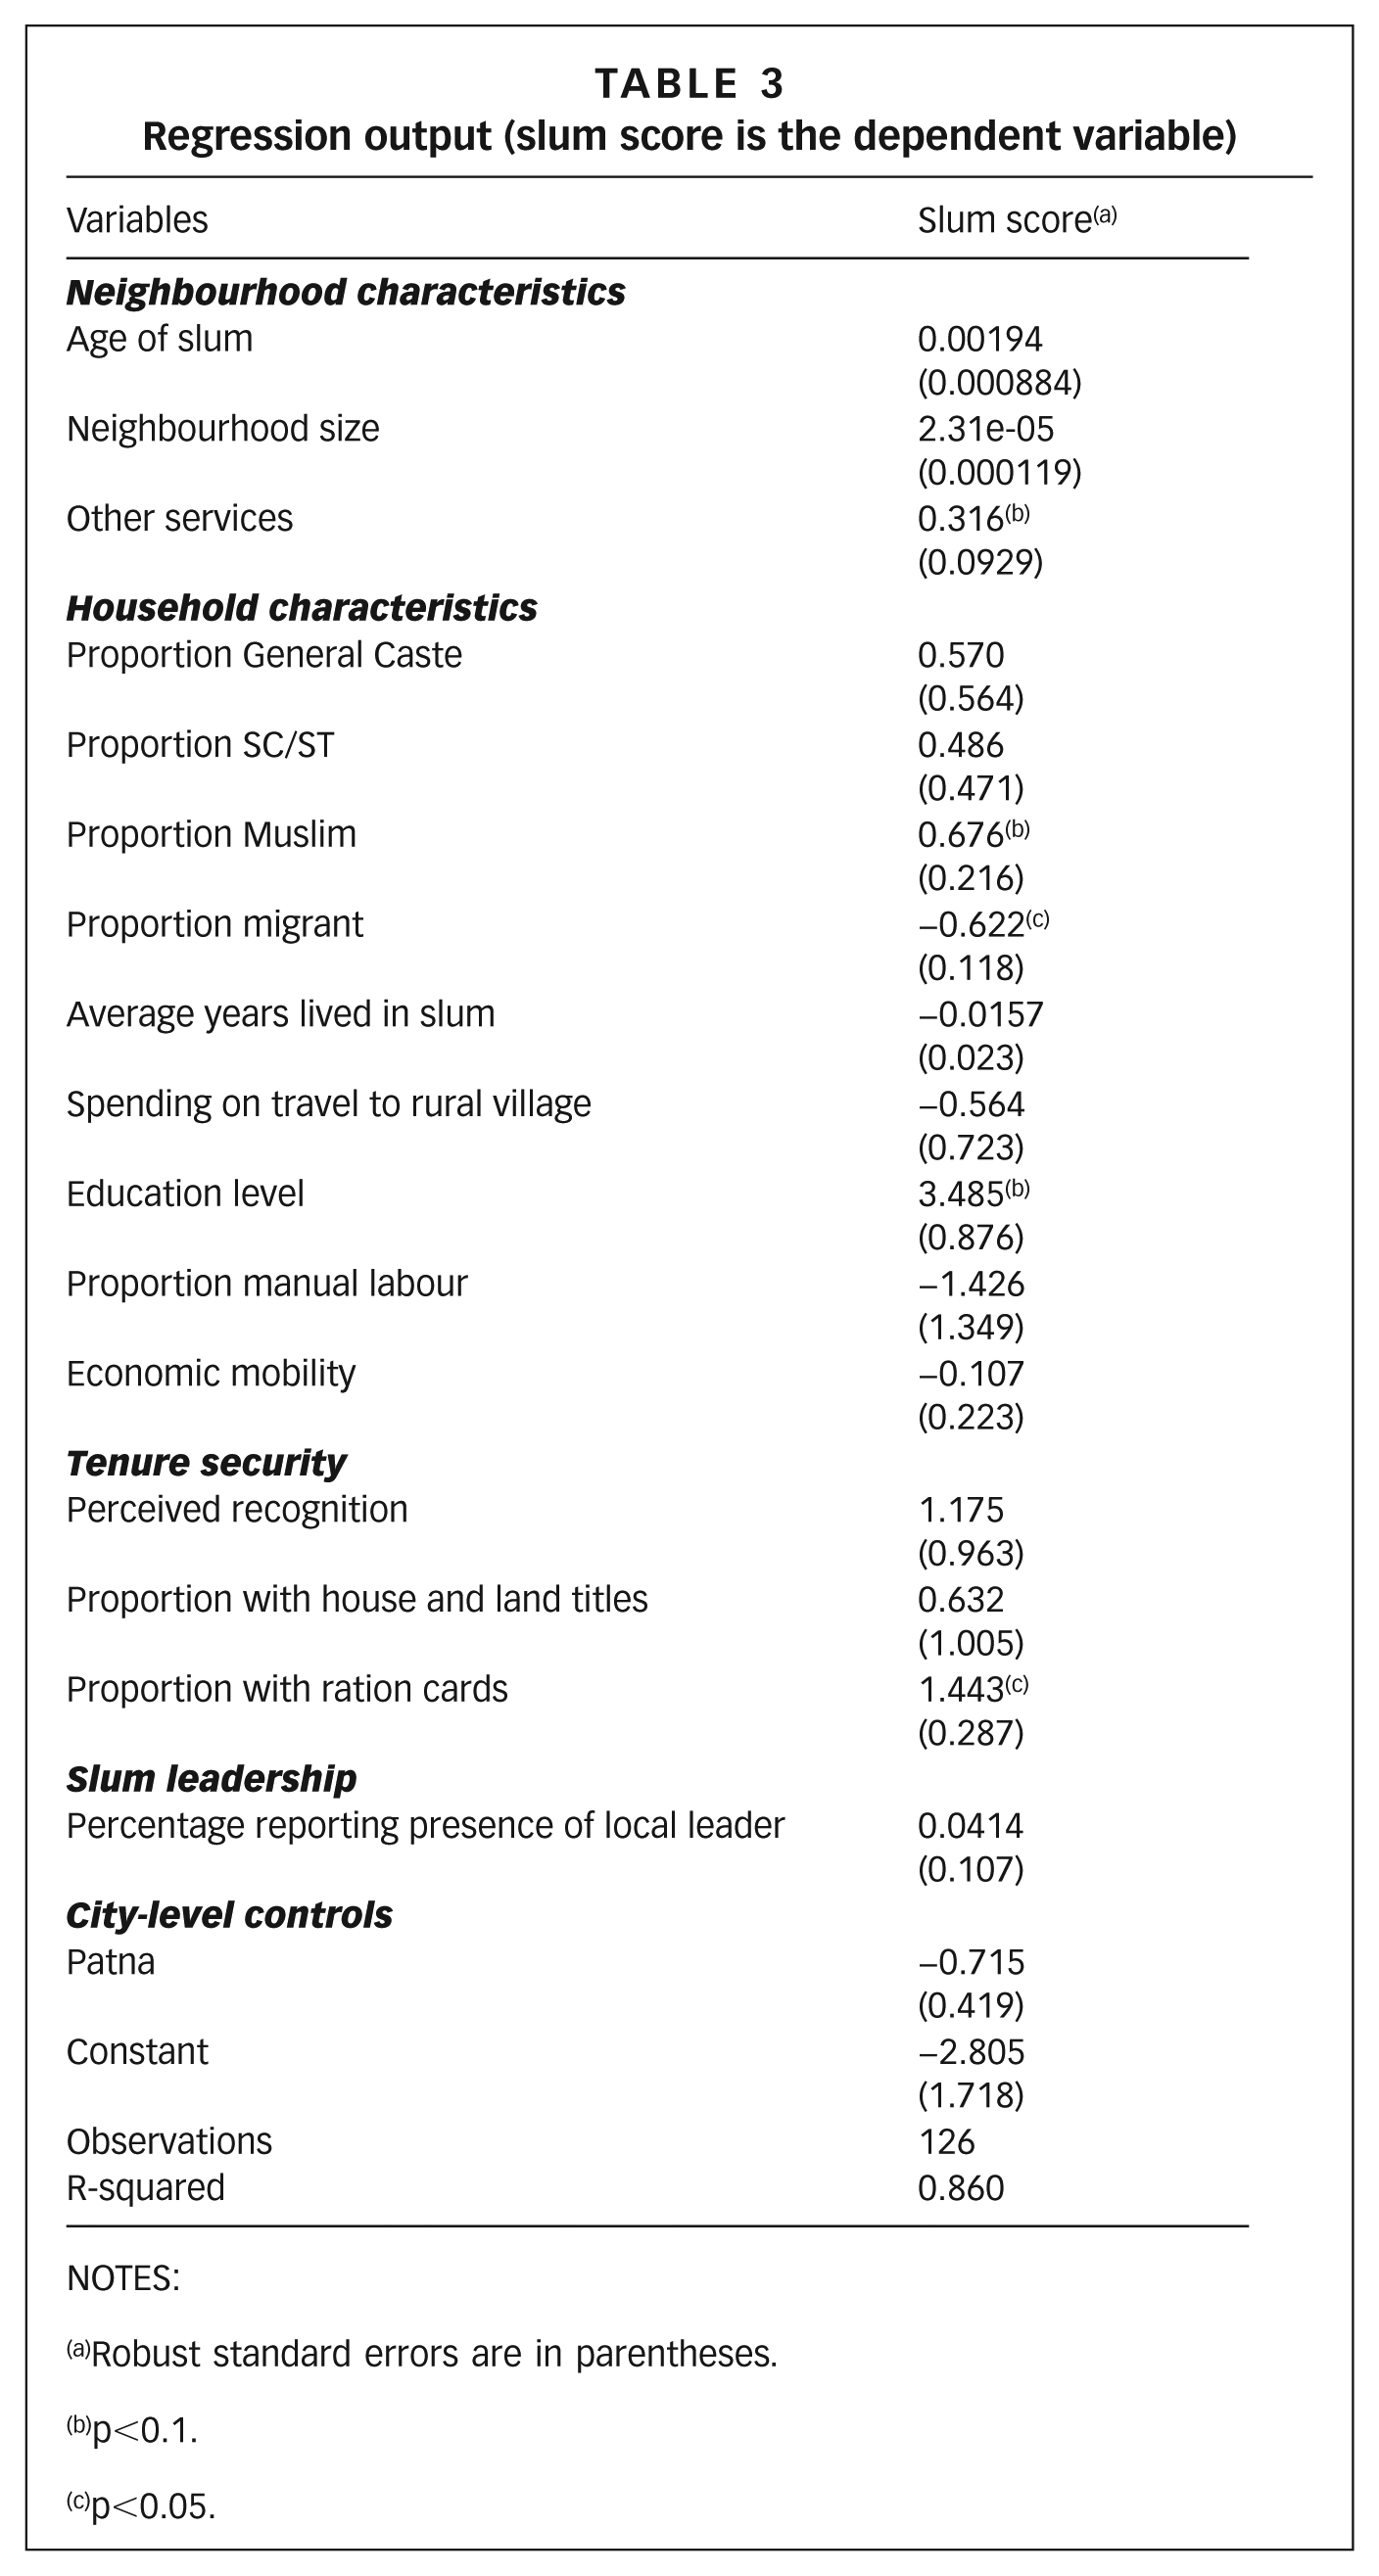
The regression relationship between slum score and the independent variables is reported in Table 3. The model explains 86 per cent of the variation in the data. Two slums are dropped because data are missing on the age of the settlement.
Regression output (slum score is the dependent variable)
NOTES:
Robust standard errors are in parentheses.
p<0.1.
p<0.05.
Notably, we do not find a significant linear relationship between perceived tenure security and slum score. However, the proportion of slums indicating they are notified increases for each quartile. Furthermore, of the 20 slums with the lowest scores, only one reports being notified by the government. In contrast, of the 20 slums with the highest scores, 15 report being notified by the government.
The regression analysis shows a significant negative correlation between slum score and proportion of migrants, but this trend is largely driven by Bangalore’s blue polygon slums. When Bangalore’s five blue polygon slums are dropped from the sample, the coefficient on migration is no longer significant. Apart from Bangalore’s bottom end, therefore, the slum continuum is relatively equally populated by native-born residents and recent migrants. This finding is consistent with evidence from our focus group discussions. Thirty-eight per cent of slums experienced inward migration in the past two years. Of these, half came from outside the city, and half relocated from within the same city. Migration was dispersed along the continuum.
We turn instead to an exploration of the three variables that are systematically positively correlated with slum score: average education level, access to additional services, and proportion of households possessing ration cards.(56) These results suggest that slums with higher scores either have higher human capital levels or have had other success with government, or both. The magnitudes of these relationships are illustrated in Figure S2 in the online supplement. Figure S2 shows the slum scores predicted by the regression for slums with various levels of education, the proportion of residents with ration cards, and access to additional infrastructure. For each of these three variables of interest, we use the regression output to predict the continuum score for slums with variation in the variable of interest, with all other covariates held constant at their mean values. For example, to examine the magnitude of the relationship between education and slum score, we predict the expected score for a slum with education levels at the observed minimum, median and maximum education levels, with all other covariates held constant at their average values. As shown in Figure S2, the predicted score of a slum with average covariates increases from -1.66 to 1.83 as the education level ranges from the minimum to maximum education levels observed in the sample. This corresponds to an increase in position on the slum continuum from the bottom to the top quartile.
For the other two variables, an increase from their minimum to maximum values corresponds to an expected shift in the slum score from one part of the second quartile to another. The figure suggests that variation in education levels has the largest substantive effect on slum score.
e. Limited evidence of upward mobility
So far we have shown that the depth and breadth of urban poverty exceeds what is captured in the official data, and that these and other conditions vary regularly along a slum continuum. We now turn to whether we observe changes in conditions over time.
f. Neighbourhood dynamics
The regression analysis in Table 3 reveals no overall relationship between the age of the settlement and slum score. All slums formed within the past 20 years score in the bottom half of the continuum, but these younger slums comprise less than 10 per cent of the sample. It is not necessarily the case that slums become better-off with age. The average age of the other slums in the bottom quartile is 57 years. Nor is there is a relationship between slum age and slum score in any of the three cities considered individually.
We also examine longitudinal satellite images of a random sample of 40 slums. Comparing images from different years, we were able to identify the changes that had occurred in each of these slums between 2000 and 2015.(57) In 17 of these slums, there was no change in essential physical characteristics (building height, roofing materials, external roads, width of inner lanes, etc.). In another 17 slums, there were small positive changes over this period. Some experienced a transition from unpaved to paved roads; in others, buildings grew taller as additional stories were constructed; in the remaining slums, roofs changed from a brown colour (signifying cheaper construction) to a grey or white colour (signifying a better type of roofing material). These changes are not emblematic of any huge improvement in lifestyles. In only three of the 40 cases was there evidence of substantial improvement. Some other slums, which had existed 15 years earlier, showed evidence of having been relocated; others had remained without experiencing improvements. Overall, thus, the thesis of across-the-board improvement does not receive unqualified support. Few of the lower or intermediate types of slums are progressing toward clearly improved conditions.
As an additional check, we examine longitudinal satellite data for the slums with households that have experienced the greatest levels of economic mobility in our sample. There are 17 slums where at least three households were in the 99th percentile in terms of economic mobility. We examine satellite data from 2015 and 10 years prior, in 2005, for each of these slums.(58) We find no evidence of neighbourhood-level improvements for 10 of these settlements (59 per cent).
g. Individual dynamics
While the regression and satellite evidence suggests that conditions in neighbourhoods do not necessarily improve over time, it is possible that individuals relocate to nicer slums as they improve their individual status. To shed light on this possibility, we examine basic temporal and migration data.
First, the regression output shown in Table 3 reveals no relationship between economic mobility over the past 10 years and slum score.(59) The regression output suggests that people living in nicer slums have not necessarily experienced more mobility on average. We also measure social mobility as the difference between the occupational prestige ranking of the (male) respondent and that of his father, and find that the majority of respondents remain in the same occupational class as their father. For those employed in a more prestigious occupation, we find no relationship with position on the continuum.(60) These analyses suggest that nicer slums are not usually comprised of residents who have experienced greater intergenerational mobility.
Additionally, we examine the extent to which households move in and out of different slums. In the focus group discussions, we asked whether families had moved in or out of the slum in the past two years. The majority of slums did not have families move in or out recently; 38 per cent had experienced inward migration in the past two years. Of these, half came from outside the city, and half relocated from within the same city. Migration was dispersed along the continuum. In 29 per cent of slums, families had moved out in the last two years. On average, focus group discussants believed that at most 3 per cent of households had moved somewhere nicer. Taken together, these perceptions suggest that there may be some within-city relocation to nicer slums, but it is certainly far from the norm.
None of the evidence presented here is definitive on its own, but it all points in the same direction: slums and slum dwellers are more likely to experience stasis than upward mobility. The evidence is summarized in Table 4.
Summary of evidence on mobility
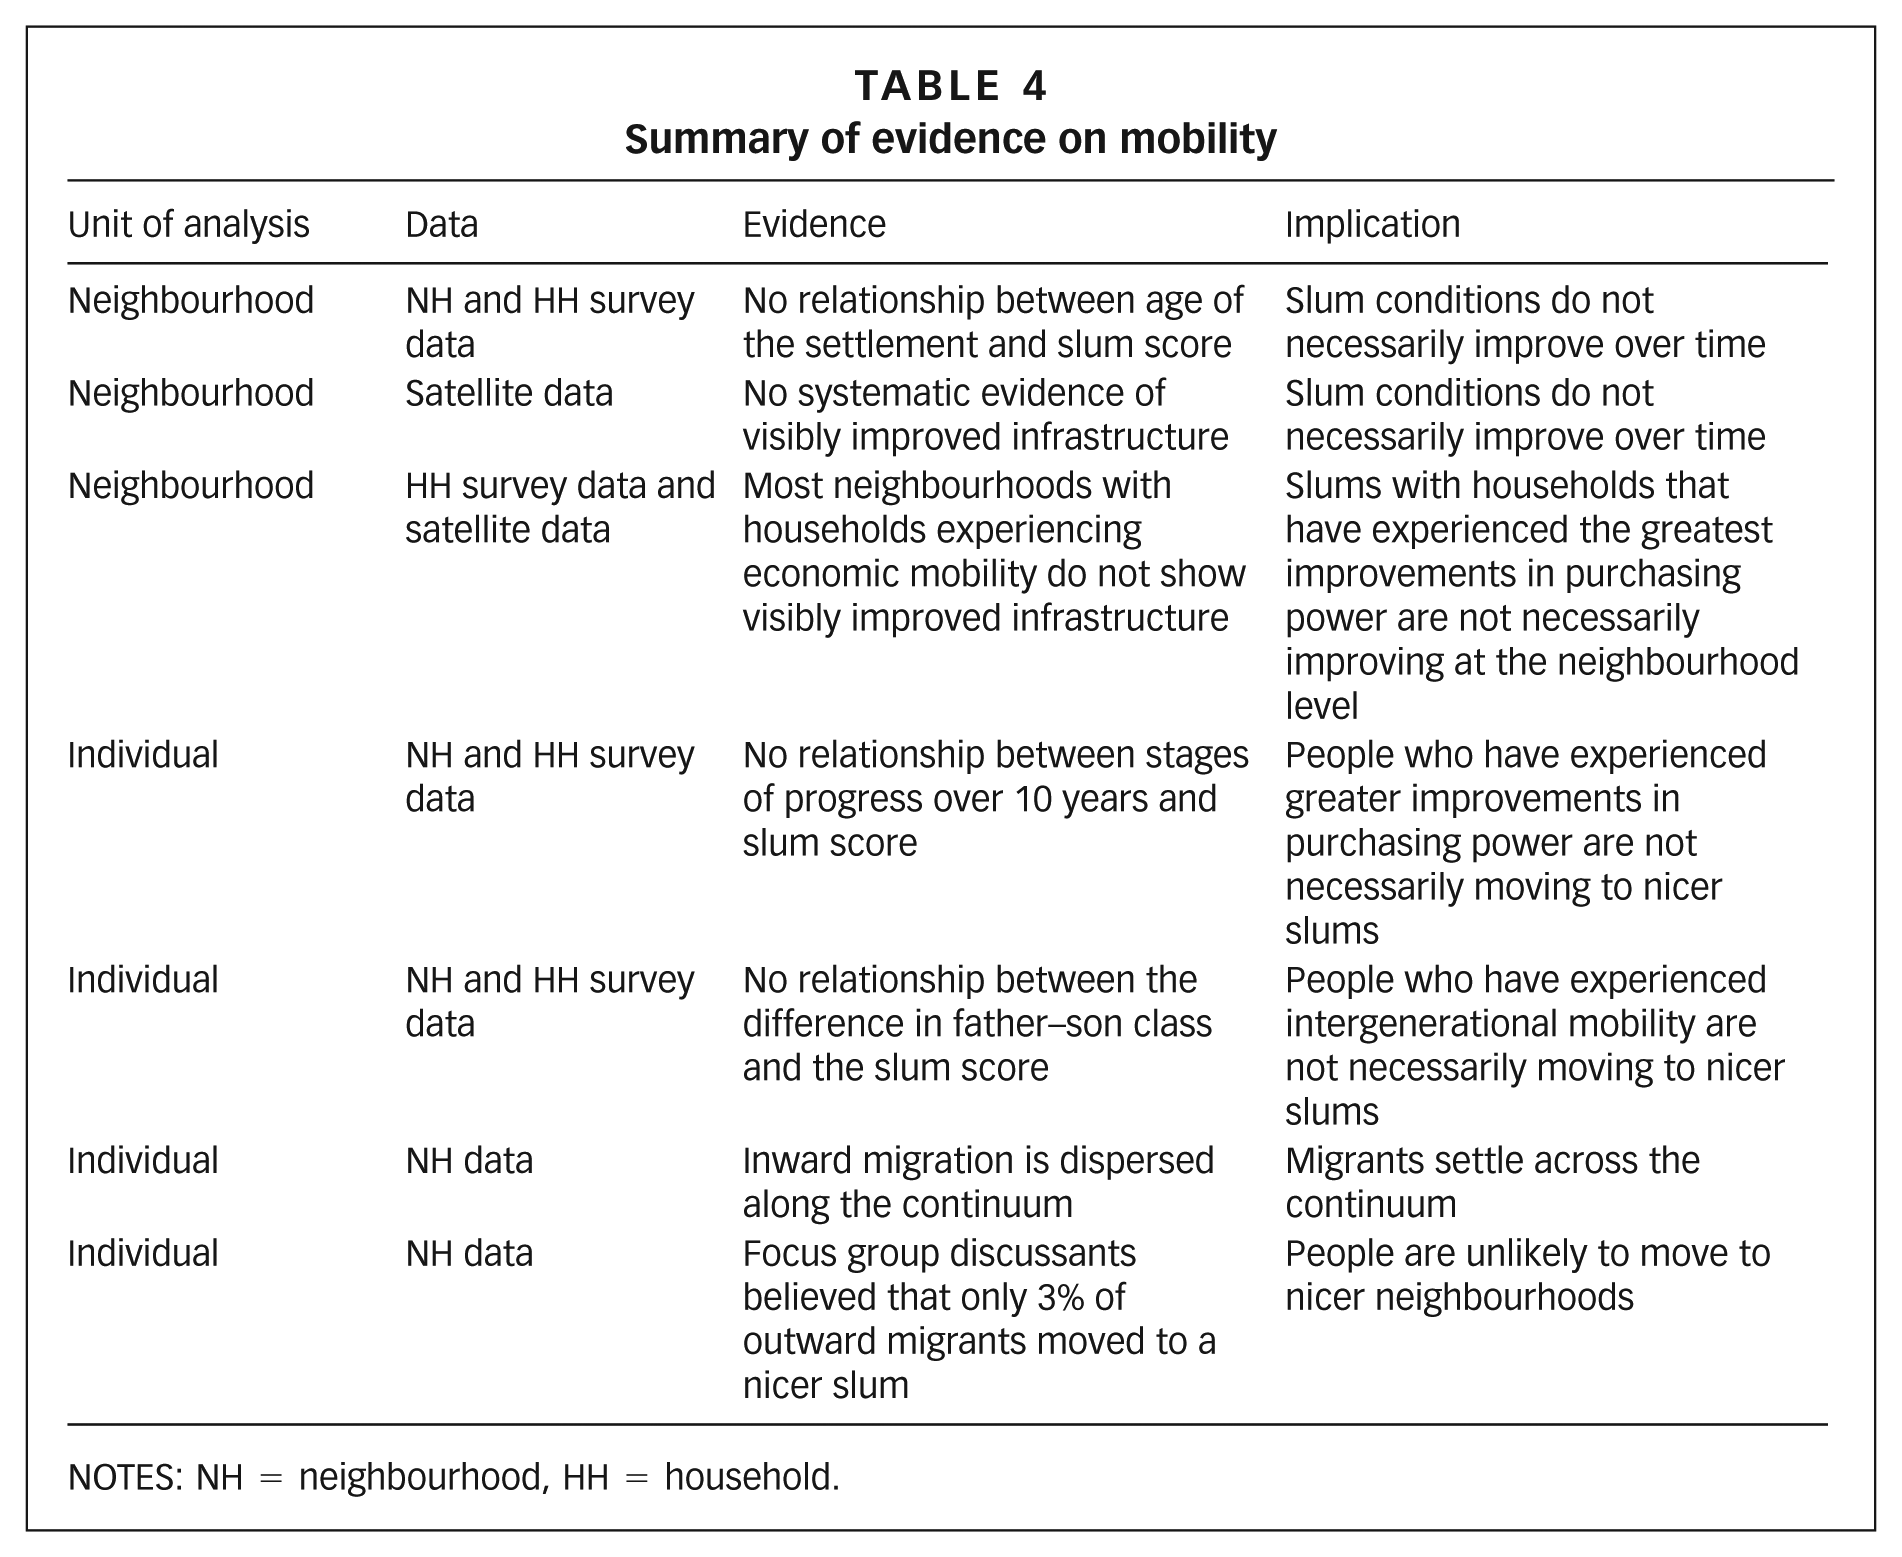
NOTES: NH = neighbourhood, HH = household.
VI. Discussion
The inference from our regression output is that better living conditions, as seen in the slum score, tend to go together with higher education levels, stronger connection with government, and greater access to official papers. On multiple dimensions, conditions of life are consistently better in slums higher along the continuum.
The survey data, collected at one point in time, do not clarify whether individual settlements move up the continuum over time, whether class is overcome, and what factors assist with these transitions. The notion that connections and political savvy can result in improvements in the settlement came through, however, in interviews with long-term slum residents, and in the slum histories narrated by neighbourhood focus groups. We were told of numerous occasions when a particular service – such as streetlights, drinking water, or stormwater drainage – had been provided to a slum because of the intervention of a powerful politician. This is supported by the emergent literature on the importance of local leaders acting as intermediaries between slums and the government.(61) We also see examples in our data of slums with much higher scores than would be predicted by education levels; these slums have long histories of prominent, politically connected activists residing in their neighbourhoods.(62) However, it is not merely the presence of a local leader that explains variation in slum wellbeing. Most slums have local leaders, regardless of position on the continuum. Interviews with local leaders in Patna and Jaipur reveal that 94 per cent of these intermediaries know someone in the government. Why some leaders are more successful than others is an important area for future inquiry.
What are the implications for whether urbanization can lift those in the global South out of poverty? Our initial analyses show little evidence either of improvements across neighbourhoods or of individual social mobility. The variation in the continuum seems to tell a story of assortative residential selection – slums and their residents enter the continuum at different points and tend to remain where they started. The satellite image record that we have examined shows that sustained improvements have occurred relatively rarely. And households’ accounts of occupational characteristics across generations as well as patterns of asset accumulation point in the same direction. Our ongoing analyses should shed additional light on these conclusions. In other cities, too, scholars have found that relatively little has changed for the majority of slum settlements, which have mostly remained as they were, experiencing little notable or sustained progress.(63)
VII. Conclusions and Policy Implications
We collect and analyse a variety of evidence in three large Indian cities with diverse economic and political histories to demonstrate that slum neighbourhoods span a continuum of wellbeing. Official data omit the neighbourhoods at the bottom of this continuum. There is no official record of conditions in these slums. Some cities – like Bangalore and Jaipur – maintain dated and/or incorrect lists, omitting large numbers of the poorest slums, and even these lists provide little or no information on conditions. Even for the long-existing notified slums that are at the top of the continuum, multiple official agencies maintain separate lists of slum names containing conflicting information. Other cities – like Patna – do not maintain lists at all. These omissions and inaccuracies lead to faulty conclusions about the depth, breadth and persistence of urban poverty. Each of these data inaccuracies has important and distinctive policy implications.
These omissions lead to underestimates of the overall number of people living in poverty as well as of the depth of deprivation. For instance, official data estimate that only 3 per cent of Patna’s households reside in slums. It is not difficult to imagine how unreliable estimates can have dangerous consequences. Basing budgetary allocations and planning priorities on flawed figures leads to deprioritizing urgent poverty challenges.
The official data also obscure the wide range of practical needs and their policy implications. Those at the bottom of the continuum indicate that they need sturdier shelter to protect them from summer monsoons and winter frostbite before they can consider taking advantage of vocational training. Meanwhile, a well-intentioned latrine delivery policy would be futile for those at the top of the continuum. Effective local policies must appreciate the wide range of living conditions. Greater clarity and better targeting may also serve to reduce the inertia resulting from ambiguous policies and responsibilities.
We do not find that lived experiences reflect evidence of urbanization as a path to upward mobility for the poor. Instead, there is evidence of assortative residential selection, with conditions varying considerably across neighbourhoods. The majority of slum residents across the continuum, 70 per cent, were born in slums. Better-off slums either have more educated residents or are more politically connected than slums occupying lower positions on the continuum. Disconnected neighbourhoods must be integrated into the city – to the education system and to basic services. There must be greater accountability, so that a neighbourhood need not be politically connected to secure access to basic water and sanitation services. More inclusive plans must be developed if the poorest are to see benefits.
Supplemental Material
rains-supplement – Supplemental material for Combining satellite and survey data to study Indian slums: evidence on the range of conditions and implications for urban policy
Supplemental material, rains-supplement for Combining satellite and survey data to study Indian slums: evidence on the range of conditions and implications for urban policy by Emily Rains, Anirudh Krishna and Erik Wibbels in Environment & Urbanization
Footnotes
Acknowledgements
The authors would like to thank the anonymous reviewers for their feedback. Janalakshmi Financial Services, a non-profit microfinance company, the Institute of Development Studies Jaipur, the Support Programme for Urban Reforms in Bihar, the Asian Development Research Institute, IGC India, IGC Bihar and Omidyar Network provided crucial support with field advice and investigations. Financial support provided by the Omidyar Network and by IGC India is gratefully acknowledged. Earlier versions of this paper were presented at the Duke University Workshop on Urban Poverty, the IGC-ISI India Development Policy Conference, and the University of Pennsylvania Health and Society in South Asia Conference. Comments provided by workshop participants and separately by Diana Mitlin, Shreya Deb, Sriparna Iyer, Amitabh Kundu and Sureshkumar Nair are gratefully acknowledged. We would also like to thank Sujeet Kumar for overseeing surveys and conducting qualitative interviews with slum leaders in Jaipur and Patna, and Jeremy Spater and Saumya Jain for providing analytical support on earlier versions of this paper. The usual disclaimers apply.
1.
The term “slum” usually has derogatory connotations and can suggest that a settlement needs replacement or can legitimate the eviction of its residents. However, it is a difficult term to avoid for at least three reasons. First, some networks of neighbourhood organizations choose to identify themselves with a positive use of the term, partly to neutralize these negative connotations; one of the most successful is the National Slum Dwellers Federation in India. Second, the only global estimates for housing deficiencies, collected by the United Nations, are for what they term “slums”. And third, in some nations, there are advantages for residents of informal settlements if their settlement is recognized officially as a “slum”; indeed, the residents may lobby to get their settlement classified as a “notified slum”. Where the term is used in this journal, it refers to settlements characterized by at least some of the following features: a lack of formal recognition on the part of local government of the settlement and its residents; the absence of secure tenure for residents; inadequacies in provision for infrastructure and services; overcrowded and sub-standard dwellings; and location on land less than suitable for occupation. For a discussion of more precise ways to classify the range of housing sub-markets through which those with limited incomes buy, rent or build accommodation, see Environment and Urbanization Vol 1, No 2 (1989), available at ![]() .
.
2.
Krishna, Anirudh, M S Sriram and Purnima Prakash (2014), “Slum types and adaptation strategies: identifying policy-relevant differences in Bangalore”, Environment and Urbanization Vol 26, No 2, pages 568–585.
5.
Amis, Philip and Sashi Kumar (2000), “Urban economic growth, infrastructure and poverty in India: lessons from Visakhapatnam”, Environment and Urbanization Vol 12, No 1, pages 185–196; also Harriss, John (2005), “Political participation, representation and the urban poor: findings from research in Delhi”, Economic and Political Weekly Vol 40, No 11, pages 1041–1054; Khasnabis, Ratan and Tania Chatterjee (2007), “Enrolling and retaining slum children in formal schools: a field survey in eastern slums of Kolkata”, Economic and Political Weekly Vol 42, No 22, pages 2091–2098; Mahadevia, Darshini (2010), “Tenure security and urban social protection links: India”, IDS Bulletin Vol 41, No 4, pages 52–62; Mitra, Arup (2006), “Labour market mobility of low income households”, Economic and Political Weekly Vol 41, No 21, pages 2123–2130; and Unni, Jeemol and Uma Rani (2007), “Informal workers in Ahmedabad City”, in Annapurna Shaw (editor), Indian Cities in Transition, Orient Longman, Chennai, pages 217–237.
6.
The national census of 2001 for the first time separately assessed the slum population in a few cities of India, considering three separate categories: (i) all areas in a town or city notified as a “slum” by a state or local government; (ii) all areas recognized as a “slum” by a state or local government, which may not have been formally notified; and (iii) “a compact area of at least 300 population or about 60-70 households of poorly built congested tenements, in unhygienic environment usually with inadequate infrastructure and lacking in proper sanitary and drinking water facilities”. While slums of Categories (i) and (ii) exist in official records, Category (iii) slums are of a different type. Such types of slum settlements – neither notified nor recognized – are springing up all the time, rarely forming part of government records or city maps. Census estimates of both 2001 and 2011 missed out on the shabbiest settlements. See Bhan, Gautam and Arindam Jana (2013), “Of slums or poverty: notes of caution from Census 2011”, Economic & Political Weekly Vol 48, No 18; also GOI (2010), Report of the Committee on Slum Statistics/Census, Government of India, Ministry of Housing and Urban Poverty Alleviation, New Delhi; and Krishna, Anirudh (2017), The Broken Ladder: The Paradox and Potential of India’s One-Billion, Cambridge University Press, New York.
7.
Mitlin, Diana and David Satterthwaite (2013), Urban Poverty in the Global South: Scale and Nature, Routledge, page 279.
8.
See reference 7.
9.
Auyero, Javier (2000), “The logic of clientelism in Argentina: an ethnographic account”, Latin American Research Review Vol 35, No 3, pages 55–81; also Breman, Jan (2013), At Work in the Informal Economy of India: A Perspective from the Bottom Up, Oxford University Press, Delhi; Marx, Benjamin, Thomas Stoker and Tavneet Suri (2013a), “The economics of slums in the developing world”, The Journal of Economic Perspectives Vol 27, No 4, pages 187–210; Marx, Benjamin, Thomas Stoker and Tavneet Suri (2013b), There Is No Free House: Ethnic Patronage and Property Rights in a Kenyan Slum; and Perlman, Janice E (2006), “The metamorphosis of marginality: four generations in the favelas of Rio de Janeiro”, Annals of the American Academy of Political and Social Science Vol 606, No 1, pages 154–177.
10.
Kundu, Amitabh (2013), “Making Indian cities slum-free: vision and operationalisation”, Economic & Political Weekly Vol 48, No 17.
11.
See reference 10.
12.
City-level governments are dependent for their revenues and for their senior personnel upon the state government. There are several aspects of city government that fall within the jurisdiction of state rather than city governments. Urban policies therefore are partly dependent on city policies, but are also largely dependent on state policies.
13.
Auerbach, Adam Michael (2016), “Clients and communities: the political economy of party network organization and development in India’s urban slums”, World Politics Vol 68, No 1, pages 111–148.
14.
Jayatilaka, Bandula and Manas Chatterji (2007), “Globalization and regional economic development: a note on Bangalore City”, 地域学研究 Vol 37, No 2, pages 315–333.
15.
Benjamin, Solomon (2000), “Governance, economic settings and poverty in Bangalore”, Environment and Urbanization Vol 12, No 1, pages 35–56; also Ghosh, Asha (2006), “Banking on the Bangalore dream”, Economic and Political Weekly Vol 41, No 8, pages 689–692.
16.
Parmar, Malvika Singh (2009), A Case Study of Slum Redevelopment in Jaipur, India: Is Neglecting Women an Option?
17.
Vibhuti, Sachdev and G H R Tillotson (2002), Building Jaipur: The Making of an Indian City, Oxford University Press, New Delhi and New York.
18.
Kavilkar, Rupali D and Ravindra Deshmukh (2014), “Interaction between political ideologies and emerging urban patterns of Indian planned cities: a case study of Jaipur”, Journal of Civil Engineering and Environmental Technology Vol 1, No 2, pages 73–79.
20.
Mathew, Santhosh and Mick Moore (2011), “State incapacity by design: understanding the Bihar story”, IDS Working Paper 366, 31 pages; also Witsoe, Jeffrey (2013), Democracy against Development: Lower-Caste Politics and Political Modernity in Postcolonial India, University of Chicago Press, Chicago.
21.
Rodgers, Dennis and Shivana Satija (2012), Understanding the Tipping Point of Urban Conflict: The Case of Patna, India.
22.
Census data indicate that 3 per cent of households are located in slums (13,696 out of 413,049). In contrast, Rodgers and Satija (see reference 21) estimate that 64 per cent of Patna’s population lives in slums.
23.
The official list in Bangalore included only notified slums. We were not able to get a reliable or authorized list of non-notified slums in Bangalore.
24.
Krishna, Anirudh (2013), “Stuck in place: investigating social mobility in 14 Bangalore slums”, Journal of Development Studies Vol 49, No 7, pages 1010–1028.
25.
Livengood, Avery and Keya Kunte (2012), “Enabling participatory planning with GIS: a case study of settlement mapping in Cuttack, India”, Environment and Urbanization Vol 24, No 1, page 77–97; also Oleksandr, Kit, Matthias Lüdeke and Diana Reckien (2013), “Defining the bull’s eye: satellite imagery-assisted slum population assessment in Hyderabad, India”, Urban Geography Vol 34, No 3, pages 413–424; and Sudhira, H S, T V Ramachandra and K S Jagadish (2004), “Urban sprawl: metrics, dynamics and modelling using GIS”, International Journal of Applied Earth Observation and Geoinformation Vol 5, No 1, pages 29–39.
26.
We found that examining images at an altitude of 4,000 feet (1,220 metres) was most helpful for our purposes. More details are provided by Krishna, Sriram and Prakash; see reference 2.
27.
This list was provided to us by Adam Auerbach, who received a map of slums from a government of Rajasthan joint venture, which he then built on for his fieldwork.
28.
Support Programme for Urban Reforms (SPUR) is a partnership between the Government of Bihar and the UK Department for International Development (DFID). SPUR works on issues of urban poverty and slum mapping.
29.
We have recently begun looking at higher-resolution images, including through a collaboration with an urban geographer and a computer scientist.
30.
See reference 2.
31.
We worked with our local partner, IDS, and a survey company, MORSEL, which we trained and monitored. Sujeet Kumar, a PhD student, conducted all qualitative interviews.
32.
We began collecting more detailed data on informal slum leaders and social networks in response to a growing sense of the importance of leaders and networks for individual service access documented in the literature. For example, see reference 9, Auyero (2000); reference 13; Auerbach, Adam and Tariq Thachil (2016), “Who do brokers serve? experimental evidence from informal leaders in India’s slums”, Paper presented at the Annual Meeting of the American Political Science Association, Philadelphia, 1–4 September; and Paller, Jeffrey W (2015), “Informal networks and access to power to obtain housing in urban slums in Ghana”, Africa Today Vol 62, No 1, pages 30–55.
33.
These results are available upon request.
34.
We again stratified slums into groups and randomly selected slums to be representative of the proportions in each group. We stratified by infrastructure quality based on survey data, the quadrant within the city, and population, and we randomly selected 40 slums for the sample. We also added three slums based on discussions with local organizations.
35.
Other scholars have similarly adopted and refined this definition to map health disparities in Accra, Ghana. See Jankowska, Marta M, John R Weeks and Ryan Engstrom (2012), “Do the most vulnerable people live in the worst slums? A spatial analysis of Accra, Ghana”, Annals of GIS Vol 17, No 4, pages 221–235.
36.
We do not include the pre-2015 Bangalore waves in the score because the 2015 wave includes slums from all sampling categories, and the survey instrument in 2015 was nearly identical to the survey instrument used in Jaipur and Patna in 2016.
37.
James, Gareth, Daniela Witten, Trevor Hastie and Robert Tibshirani (2013), An Introduction to Statistical Learning with Applications in R, Springer, New York.
38.
The first component from the principal component analysis explains the majority of the variance (62.42 per cent). Therefore, we utilize the predicted first component score in our analyses. We refer to the predicted first component score as the “slum score”. As a robustness check, we verify that the principal component score and the simple average of the indicators are highly correlated (.80), and that the position on the continuum does not meaningfully change between the two measurements.
39.
It is possible that our measurements for building height omit instances where different floors are rented to or owned by different families, or that having a piped water connection is not better than having access to other types because of intermittent access. As further robustness checks, we calculate the index scores by a) dropping height from the calculation, b) dropping water source from the calculation, and c) dropping both. The correlations with the slum score including all of these variables are .99, .99 and .98.
40.
See reference 2; also Fox, Sean (2014), “The political economy of slums: theory and evidence from sub-Saharan Africa”, World Development Vol 54, pages 191–203.
41.
Interviews with policymakers and implementers from Jaipur’s Department of Urban Legal Bodies, the Jaipur Development Agency, and the Jaipur Municipal Corporation from 27 to 29 June 2016 and with activists from the Society for the Promotion of Area Resource Centers (SPARC) in Mumbai, 31 July–1 August 2016.
43.
The measure of social mobility that we utilize is based on a robust recall method, Stages of Progress, linked to assets and core capabilities less susceptible to recall bias. For a fuller description of this methodology and its applications, see Krishna, Anirudh (2010), “Who became poor, who escaped poverty, and why? Developing and using a retrospective methodology in five countries”, Journal of Policy Analysis and Management Vol 29, No 2, pages 351–372.
44.
Subbaraman, Ramnath, Ramnath Subbaraman, Jennifer O’brien, Tejal Shitole, Shrutika Shitole, Kiran Sawant, David E Bloom and Anita Patil-Deshmukh (2012), “Off the map: the health and social implications of being a non-notified slum in India”, Environment and Urbanization Vol 24, No 2, pages 643–663.
45.
Three official agencies in Bangalore include the Karnataka Slum Development Board (KSDB), Brihut Bangalore Mahanagar Palike (BBMP), and the Bengaluru Development Authority (BDA). Each agency is responsible for different aspects of urban land management and has different responsibilities with respect to slum management.
46.
Field visits reveal dozens of different types of papers that correspond to differing levels of perceived security, independent of actual legal meaning. Field visits also reveal that absent formal government recognition, informal markets may emerge with their own paperwork. Ongoing work investigates how to best measure tenure security.
47.
See reference 9, Auyero (2000); reference 13; reference 32, Auerbach and Thachil (2016); reference 32, Paller (2015); and Auerbach, Adam (2013), “Demanding development: democracy, community governance, and public goods provision in India’s urban slums”, PhD dissertation, University of Wisconsin-Madison.
48.
Iversen, Vegard, Anirudh Krishna and Kunal Sen (2016), “Rags to riches? Intergenerational occupational mobility in India”, University of Manchester working paper, Manchester.
49.
To decompose variation in scores, we ran a random-effects model on the first component score from the household indicators. As an additional check, we calculated the simple average of each of these indicators scaled from 0 to 1, and ran a random effects model on the simple averages. The results do not meaningfully differ.
50.
Exploratory factor analysis and cluster analysis reveal that there are no statistically distinct groups among the aggregated slum data. The analysis did robustly identify blue polygons as distinct from the rest of the continuum within Bangalore, but the blue polygons are not distinct from other slums in Jaipur or Patna.
51.
Interview with residents, 12 July 2016.
52.
The slum ranking is 13 out of 128.
53.
The slum ranking is 78 out of 128.
54.
Shah, Svati Pragna (2014), Street Corner Secrets: Sex, Work, and Migration in the City of Mumbai, Duke University Press, Durham.
55.
Interviews with policymakers and implementers from Jaipur’s Department of Urban Legal Bodies, the Jaipur Development Agency, and the Jaipur Municipal Corporation from 27 to 29 June 2016.
56.
The regression analysis shows a significant and positive correlation between slum score and proportion of Muslim residents. This trend is driven by three majority-Muslim outliers in Jaipur. When these three slums are dropped from the sample, the coefficient is no longer significant.
57.
The year 2000 is as far back as we can compare to subsequent years, using publicly available Google Earth images. We have just started working with higher-resolution images going further back in time.
58.
Economic mobility is assessed with the help of the stages of progress method (see reference 43, ![]() ), involving 10 or more sequentially achieved “stages of progress”, comprised of core capabilities, such as sending children to school, or lumpy assets, such as two-wheelers. Respondents identified the level they had achieved 10 years ago and at the present time.
), involving 10 or more sequentially achieved “stages of progress”, comprised of core capabilities, such as sending children to school, or lumpy assets, such as two-wheelers. Respondents identified the level they had achieved 10 years ago and at the present time.
59.
Reference 58 describes the metrics that we used for these comparisons.
60.
We regress the slum score on the difference between father and respondent occupation, clustering standard errors by city. The p-value of the coefficient on class difference is .127.
61.
See reference 9, Auyero (2000); reference 13; reference 32, Auerbach and Thachil (2016); reference 32, Paller (2015); and reference 47, ![]() .
.
62.
For example, based on human capital levels, we would expect the 3rd most well-off slum to be ranked 94 out of 128. The Congress Party helped the local leader secure his position as a leader in the slum, and he has been leading for 20 years. In Patna, the slum ranked 39 would be ranked 96 based on human capital levels. There are two politically connected local leaders in this slum – a long-time, politically connected activist and a local businessman whose brother is active in the Bharatiya Janata Party (BJP).
63.
These include reference 9, Marx et al. (2013a); and reference 40, ![]() .
.
References
Supplementary Material
Please find the following supplemental material available below.
For Open Access articles published under a Creative Commons License, all supplemental material carries the same license as the article it is associated with.
For non-Open Access articles published, all supplemental material carries a non-exclusive license, and permission requests for re-use of supplemental material or any part of supplemental material shall be sent directly to the copyright owner as specified in the copyright notice associated with the article.