
Abstract
This paper applies an Adaptation Tipping Point (ATP) approach for the assessment of vulnerability to flooding in the city of Dhaka, Bangladesh. A series of rigorous modelling exercises for fluvial and pluvial flooding was conducted to identify the critical ATPs of the physical system, under both existing and proposed flood risk management strategies, for different urban and climate change scenarios. But a standalone assessment of the physical system’s ATPs is insufficient to gain a complete understanding of flood risks; community resilience also depends on people’s adaptability and the acceptance of risks by the community in question. Through participatory public consultations, this study determines the critical ATPs for community risk acceptance. The concept of the “Integrated Adaptation Tipping Point (IATP)”, introduced here, combines the accepted level of risk to the community with the ATPs for physical systems. This approach reveals that the assessed vulnerability to flooding increases when social tipping points are considered.
I. Introduction
Urban areas are hotspots for flood disaster, a result of both urban development and the impacts of climate change. Encroachment on wetlands and floodplain areas in the process of urban growth, both planned and unplanned, contributes considerably to intensifying flooding.(1) The expansion of the urban area also affects its microclimate and often increases stormwater runoff.(2) The scope for adaptation through new flood control infrastructure is limited. Traditionally, policymakers have relied on the static “predict and act” approach,(3) which considers only a single scenario over a planning period, and which is incapable of providing flexible alternative solutions to changes in land use and climate.
In contrast to the static approach, this paper looks at flooding from the perspective of vulnerability, adopting a more resilience-based dynamic approach around the concept of tipping points. Resilience as persistence has been defined as “the magnitude of disturbance that can be absorbed before the system changes its structure by changing the variables and processes that control behaviour”.(4) Resilience can also be termed “the capacity of a system to experience shocks while retaining essentially the same function, structure, feedbacks, and therefore identity”.(5)
To evaluate flood risks and impacts in a complex system such as a major city, an important task is to define the tipping points (thresholds). The Adaptation Tipping Point (ATP) approach gives insight into how much pressure a system (physical or social) can absorb, what the acceptable limits are for impacts, and when they are reached. The impact level is defined as reaching a threshold when the impact indicator exceeds the acceptable limit for the physical or social system. In this paper, thresholds for physical and socioeconomic systems are identified by combining the modelling exercises for the two, along with an in-depth analysis of the views of stakeholders (e.g. institutions, local people) and expert opinion. The allowable flood depth defined in the existing plan is used here as the threshold to calculate the adaptation tipping points. We conducted an integrated assessment of the tipping points of the physical as well as social systems, relative to the allowable flood depth, to ascertain their correlation and to identify the boundaries of the accepted level of flood risk.
The main objective of this research is to see how physical and social tipping points can help decision makers understand acceptable levels of urban flood risks, using the case study of Dhaka in Bangladesh. To address this question the following sub-questions were developed:
What are the critical ATPs for flooding in Dhaka?
What does flood resilience mean for the communities at risk?
How are the critical ATPs influenced by the risk acceptability?
This paper explores how this knowledge relates to the current flood risk management (FRM) strategies of Dhaka. After explaining the approach (Section II), methodology (Section III) and characteristics of the study area in terms of flood risk and drainage (Section IV), the socioeconomic characteristics of these areas and the results of participatory workshops are presented. This allows the assessment of their ATPs in historic and future flood scenarios (Section V). Then the outcome is related to a recent World Bank study of socioeconomic resilience in historic floods (Section VI), combining the physical and social ATPs into a single indicator, the Integrated ATP. Section VII concludes.
II. Background On Adaptation Tipping Points
“Adaptation Tipping Points” are vital for ascertaining the resilience and adaptation capacity of physical as well as social systems under current or future policy regimes. The system may exceed a tipping point due to either a slow-moving variable (e.g. climate change) or a sudden extreme event (e.g. flash flood),(6) and due to either exogenous or endogenous, mono-driver or multi-driver variables.(7) The analysis of tipping points can inform the adoption of preventive measures in the pre-disaster phase and choice of recovery options for the post-disaster period. According to Gao et al.,(8) if the parameter that influences a system’s resilience can be properly identified, then appropriate measures can be taken on that basis to either enhance or restore the level of resilience.
Although “tipping points” are a well-established concept, often associated with the sustenance of ecosystems, tipping points are relatively new for technical (engineering) systems, as well as for climate change adaptation and planning. According to Lenton and Ciscar, “Only recently a start was made to translate climate tipping points into socio-economic impacts on particular sectors or regions”.(9) Social tipping points are significant in defining risk acceptability at a local or community level. In this sense, a tipping point or threshold value determines stakeholders’ acceptance or rejection of a particular system condition, which may even shift their locus of decision making to other factors.(10)
Social tipping points are a contested subject. People who are regularly exposed to flooding have generally developed coping mechanisms over time, and can be expected to be more “flexible” in managing flood events. Many live in flood-prone areas because they have limited options: they are systematically excluded from safer and central parts of the city by cost, and need to balance access to employment/services with exposure to flood risk. They are flexible because – in the absence of supportive state interventions – they are not given any other choice.(11) Therefore social tipping points may vary among different groups depending on their expectations of state support and own capacities to mitigate risks.
“There is currently a huge gulf between natural scientists’ understanding of climate tipping points and economists’ representations of climate catastrophes in integrated assessment models (IAMs). In particular there are multiple potential tipping points …”(12) It is very difficult to segregate biophysical from social systems, as they are ultimately integrated and interdependent on each other. So it is a difficult task to predict the social tipping points because of the feedback and multiplier effects following changes in the technical, economic and ecological systems.(13)
A “tipping point” in biophysical terms means the point of no return, while an “Adaptation Tipping Point” is the threshold value or specific boundary condition where ecological, technical, economic, spatial or socially acceptable limits are exceeded.(14) Werners et al.,(15) referring to the ATP as the “Adaptation Turning Point”, defined it as the situation in which socio-political thresholds like policy objectives or societal preferences are reached due to alteration in the biophysical system by climate change. However, both the “Adaptation Tipping Point” and “Adaptation Turning Point” refer to the threshold value beyond which alternative strategies are required.
The Adaptation Tipping Point (ATP) approach was developed and applied to assess water management strategies in Dutch case studies, as well as being used in climate change research.(16) Similar planning approaches were also applied in the UK, US, Colombia and Vietnam.(17) A more recent application of the ATP approach can be seen in the Bangladesh Delta Plan (BDP 2100), where historical tipping points were assessed and future tipping points explored for strategizing the adaptation pathways to ensure climate-adaptive and disaster-resilient economic growth.(18) Historical tipping points are useful for learning from the past and visualizing the risks the community might encounter in the future.
Risk assessments, says Slovik, are “a blending of science and judgment with important psychological, social, cultural, and political factors”.(19) According to Peters and colleagues, “the accumulated knowledge and perceptions of communities ‘at risk’ are recognized as key elements in ameliorating or managing disaster risk at local level particularly in places where much of the crucial information as well as the technical and economic resources for risk assessments are not otherwise available”.(20)
III. Methods
In the present paper, the “bottom-up” approach elicited socio-political preferences and risk perceptions of local people, which have been combined with “top-down” assessment of flood impacts for obtaining the Integrated Adaptation Tipping Points (IATPs) of the socio-technical system. A number of technical tools and social survey techniques, such as rapid rural appraisal (RRA) and participatory consultation meetings (PCMs), have been used (Figure 1). Information was collected from different government agencies.(21)
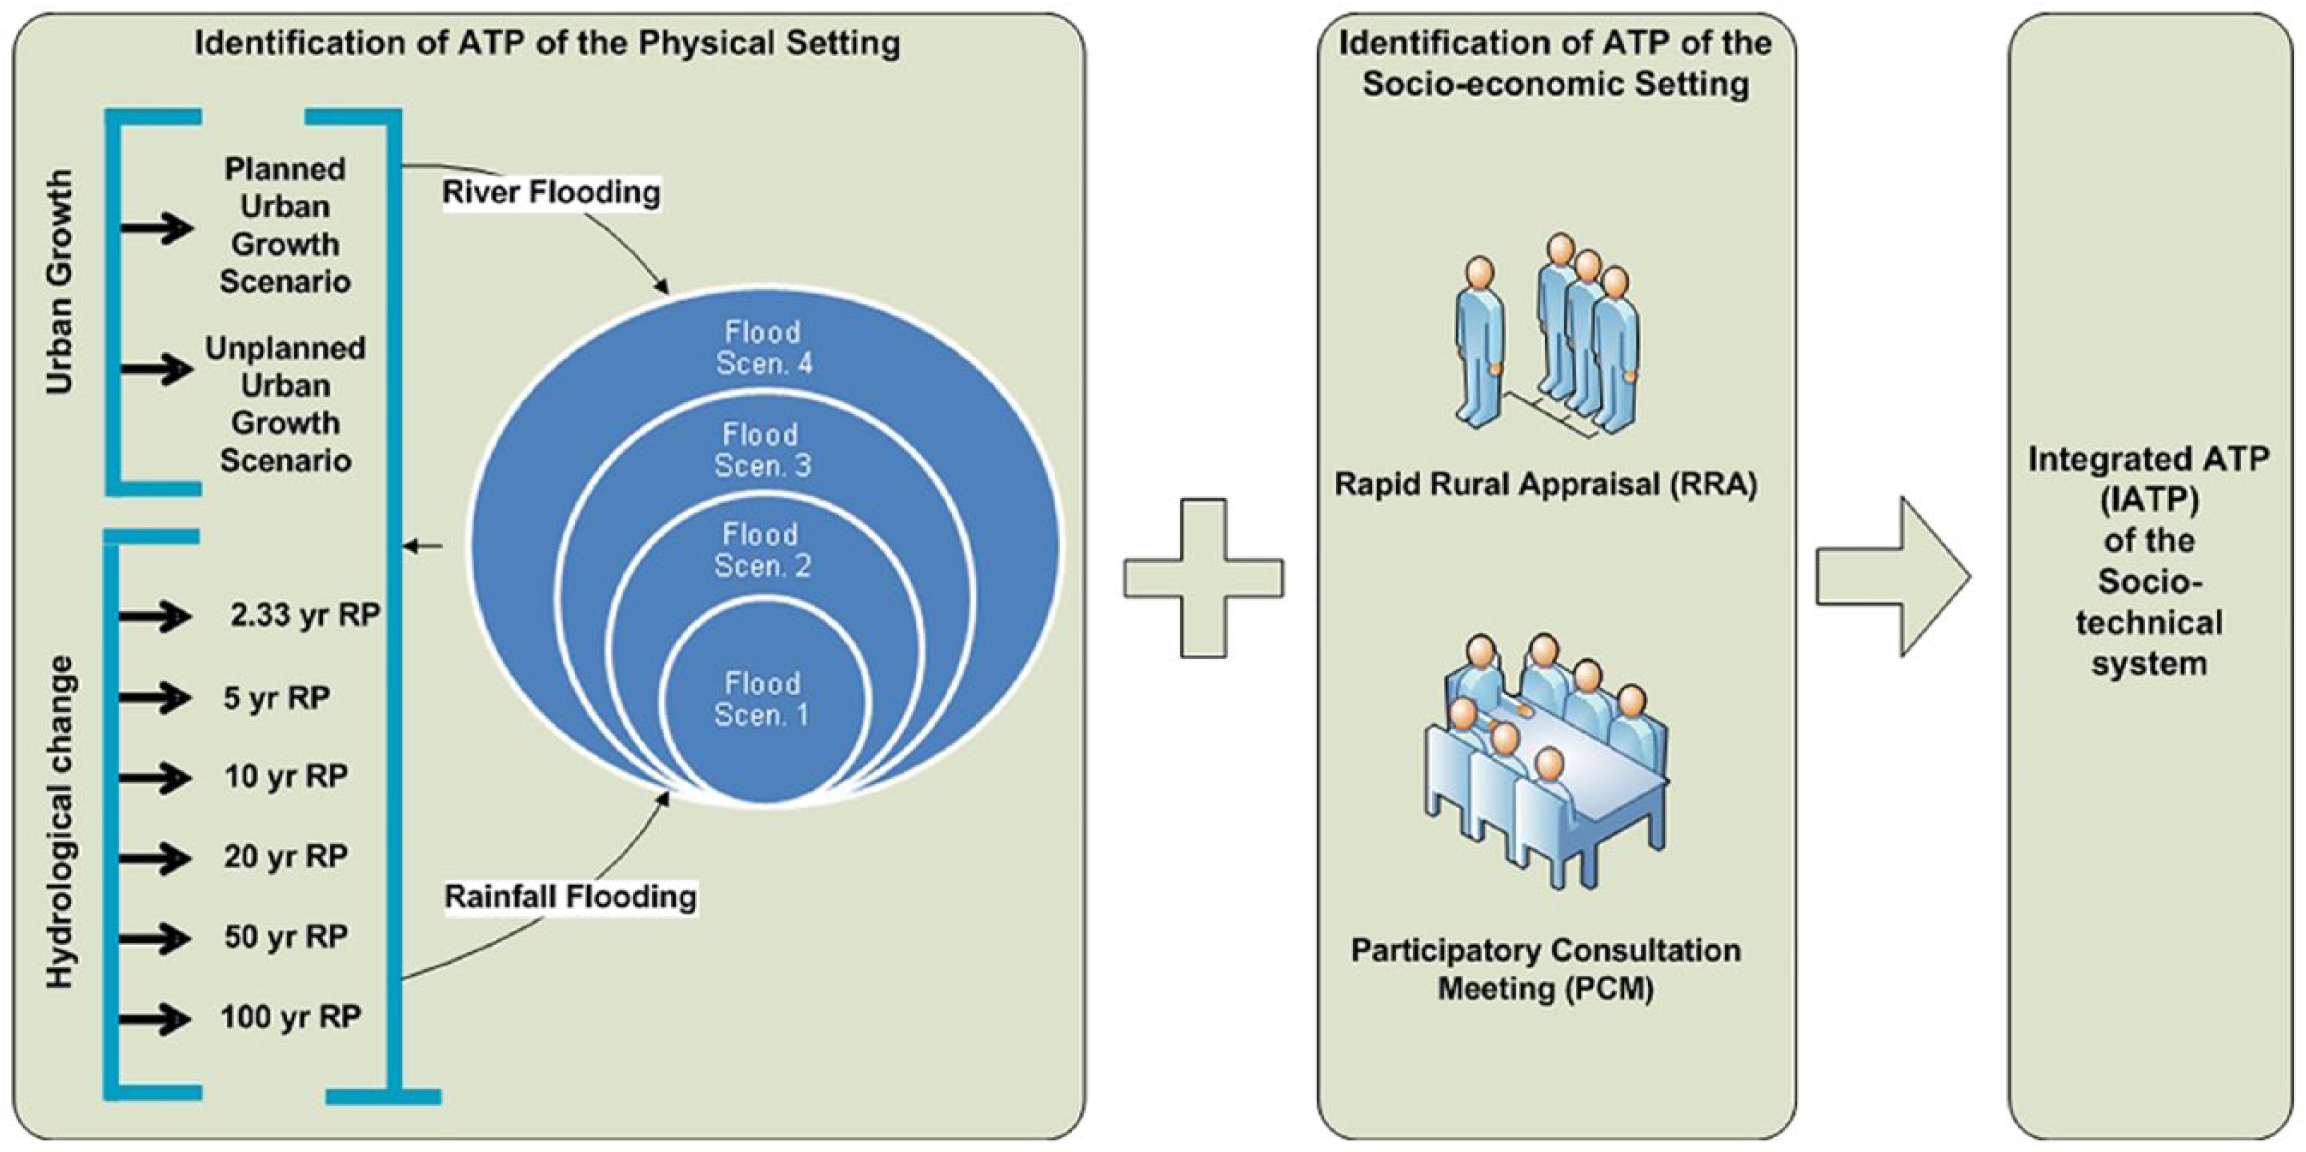
Methodology for assessing the ATPs for the bio-physical and social systems
A hydrodynamic coupled model for both fluvial (river) and pluvial (stormwater) flooding was developed for different return periods (RPs) of river water level and rainfall, using the modelling software Sobek 2d (River and Urban). A single model simultaneously generated both rainfall and river flood scenarios for a two-day period. To see the impacts of climate change and urbanization, rainfall predictions reported in the Intergovernmental Panel on Climate Change (IPCC) report(22) and urban growth projections from Ahmed et al.(23) were used. A digital elevation model (DEM) of 10-metre resolution was prepared and used for the study. Then the threshold values for different flood management structures (e.g. embankments, stormwater drainage) defined in the existing plans were used to identify the biophysical ATPs for four different parts of Dhaka City (Map 1).
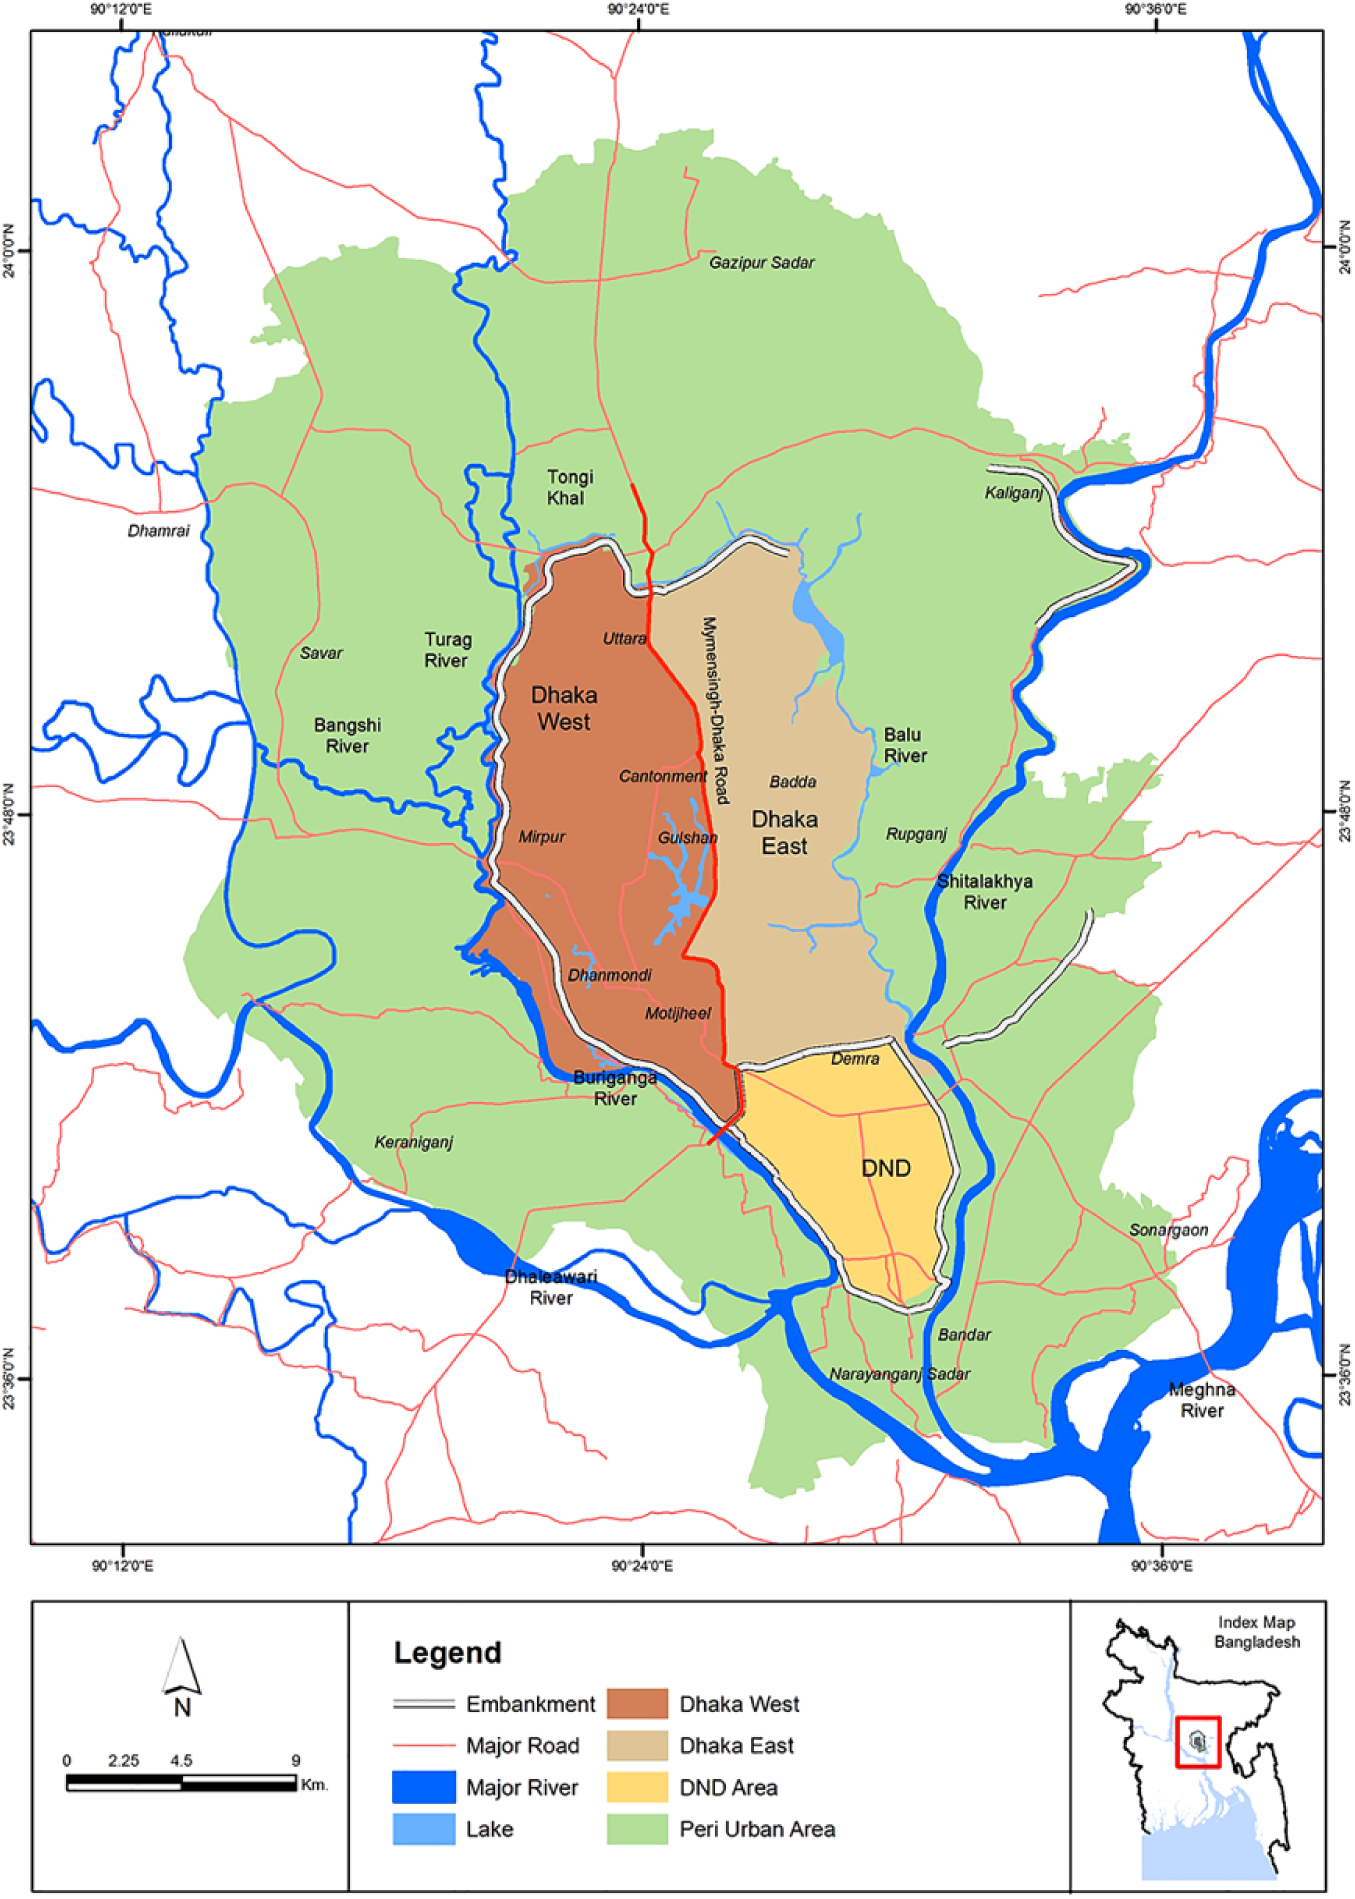
The four zones of Greater Dhaka based on the hydrological aspects
The social ATPs were determined with the aid of rapid rural appraisal (RRA) and participatory consultation meetings (PCMs). RRA(24) and PCMs are established social survey methods for collecting people’s opinions in water management(25) and social and environmental impact assessment studies.(26) Initially, RRA was carried out in some randomly selected places previously affected by floods. PCMs were then conducted in five pilot areas in the four hydrologically differentiated zones (Map 1). The pilot areas were carefully chosen on the basis of the existing flood management structure, flood vulnerability and socioeconomic characteristics.
Each PCM, involving 25–30 participants, was held in the ward commissioner’s office or Union Council office.(27) Attendees were from different backgrounds, including, for example, businessmen; office workers; representatives of public, private and non-governmental organizations, housewives; schoolteachers; government employees; farmers; fishermen; labourers; and senior citizens. Scenarios of different flood heights and durations were presented to gain historical insights, knowledge about current risk experiences, and perceptions of future flood risks. Flood depths were translated into terms understandable to local people: ankle deep (0–0.15 metres); lower than knee deep (0.16–0.29 metres); knee deep (0.30–0.49 metres); waist deep (0.50–0.91 metres); chest deep (0.92–1.07 metres) and higher than chest deep (1.08–2.5 metres).
The questionnaire for the social survey was designed based on protection motivation theory. Introduced by Rogers in 1975,(28) this theory considers people’s subjective “threat appraisal” (how they perceive the current situation with regard to a specific type of hazard) and “coping appraisal” (a person’s view of the recommended coping responses, aimed at a specific type of hazard). People perceive a certain amount of threat when they live in unprotected, un-embanked areas, and may rate their scope for coping as limited in the face of high flood risk. Flood-affected people’s appraisal of the flood threat and coping capacity in a flood event has a strong bearing on the acceptability and manageability of a flood event and measures to respond to it.
The ATPs of the biophysical and the social system were then combined to determine the IATPs. These supplement “objective” risk-based time series, models and maps with “subjective” surveys in which respondents indicate the manageability of floods.(29) The hydrodynamic model results of ATPs of the biophysical system were complemented by people’s perceptions of risk obtained from RRA and PCMs. These stemmed from experiences during extreme flooding events over the years, of physical impacts (building structures, household goods), socioeconomic impacts (e.g. daily lives, livelihoods) and environmental impacts (e.g. water pollution, health).
IV. The Study Area
The study focuses on Greater Dhaka, also known as the Detailed Area Plan (DAP) area, covering an area of 1,528 square kilometres. It is surrounded by eight rivers (Buriganga, Bangshi, Turag, Tongi, Balu, Shitalakhaya, Dhaleswari and the downstream Meghna). Based on the flood management characteristics, Greater Dhaka was divided into four major parts (Map 1): Dhaka East, Dhaka West, Dhaka-Narayanganj-Demra (DND) and Peri or Outer Urban Area (OUA).
a. Hydrological aspects of each zone
For delineating the hydrological boundaries of the study area, the flood risk management strategies currently in place were considered. The FRM strategies here mainly refer to protective or infrastructural measures (e.g. embankment, flood walls), drainage structures (pipes, pumps, sluice gates), flood-proof roads, etc. The flood control and drainage system of Dhaka East and Dhaka West is described in detail below (and shown in Map S1 in the online supplementary information).
Dhaka Western Area
Flood control: The western part of Dhaka City is protected by a flood control embankment that was constructed in response to the 1988 flood, from the Tongi railway bridge to Old Dhaka. Western Dhaka’s drainage zone covers 145.08 square kilometres. Reinforced concrete flood walls were constructed along the Buriganga River, and the road from Tongi Bazar to Jatrabari was provided with various floodproofing structures. There are 11 sluice gates along the western embankment. The major drainage khals (canals) are the Abdullahpur, Degun, Diabari, Kallyanpur and Dholai khals. Wastewater and stormwater runoff is carried through these drainage channels into the Tongi Khal, Turag River and Buriganga River.(30)
Drainage system: Drainage for the Dhaka City West area is provided by pump stations located at Goranchand Bari, Kallyanpur, Narinda and Rampura. The 11 sluices on the embankment also drain stormwater from the city area. The Kallyanpur pumping station, with a capacity of 10 cubic metres per second, evacuates stormwater from a catchment area of 17.6 square kilometres. The Kallyanpur pump (capacity of 22 cubic metres per second) is associated with a regulating pond of about 40 hectares, and evacuates stormwater from a catchment area of approximately 53.33 square kilometres, comprising the Mirpur, Cantonment and Uttara areas. A regulating pond of 243 hectares has also been constructed at Goranchandbari. A third pumping station at the mouth of Dholai Khal at Mill Barak has a capacity of 22 cubic metres per second. It is designed to evacuate stormwater from a catchment area of approximately 8 square kilometres covering Old Dhaka.(31)
Dhaka Eastern Area
Flood control: To make Dhaka City East flood free, an embankment from the Tongi railway bridge on the south (right) bank with a sufficient setback (minimum 1 kilometre from the centre of the river) is proposed in the Storm Water Drainage Master Plan for Dhaka City to enclose the area up to the Demra landing station – approximately 25 square kilometres. There is an existing embankment-cum-road in DND about 8 kilometres long, which also serves as flood control for the Dhaka City East area. The road between Dhaka West and East is raised to flood level, like the Tongi highway bridge.(32)
Drainage system: Dhaka East, with a land area of 124 square kilometres, drains to the outer rivers, Tongi Khal and Balu River, which are mainly responsible for the drainage of the whole area. Around 8.5 square kilometres drain north into Tongi Khal, and the rest is drained through Balu River. The area has 80 square kilometres of drainage channels. Of them, Begunabari Khal drains most of the rainfall runoff into the Balu River. Many other canals also play a significant role in drainage. At present the total area is flooded during the monsoon months.(33)
Dhaka-Narayanganj-Demra (DND) area
Flood control: This area has been protected from floods by a flood wall and railway-cum-embankment along the trunk road on the boundary of most of this area since 1946. There is a pumping station at Shimrail, with a total design discharge capacity of 14.52 cubic metres per second, which functions as both stormwater drainage and irrigation water supply for the DND area.(34)
Drainage system: The DND project area is about 60 square kilometres and was developed as a flood-protected irrigation project comprising a pumping drainage system. This area was low-valued urban fringe land but has undergone massive transformation from agricultural to urban use. There are no natural canals in this area, and a network of previously developed irrigation canals serves as a natural drainage system.
Outer Urban Area (OUA)
Flood control and drainage: This area has vast linear flood flow and sub-flood flow areas from north to south. These lowlands are inundated with water during monsoons and serve as a drainage path for water from the north and for the accumulated rainwater within the catchment areas. During the dry season, these areas are used as seasonal farmland. Narrow and meandering permanent watercourses contain water the whole year. The drainage systems in this area are about 70.49 kilometres in length, which includes both rivers (7.21 kilometres) and canals (63.22 kilometres).(35) There is no stormwater drainage in this area.
b. Socioeconomic aspects of each zone
Population density
Dhaka City is one of the most densely populated cities in the world. With the growth of high-rise buildings due to rapid urbanization, population density is increasing day by day. Nearly 60 per cent of Dhaka City’s area has about 300 to 15,000 persons per square kilometre (Map 2). Of the four zones, Dhaka West is the most densely populated: 34 per cent of Dhaka West has a density of 15,001–40,000 persons per square kilometre and 16 per cent has over 75,000. OUA has the lowest density of the four zones, with 96 per cent of its area having a population density of less than 15,000 persons per square kilometre. Most of Dhaka East (87 per cent) and the DND (92 per cent) area has relatively low density. Areas in and around central Dhaka, which are highly vulnerable to flooding hazards, have the highest population density, with about 100,000 to 175,000 persons per square kilometre.
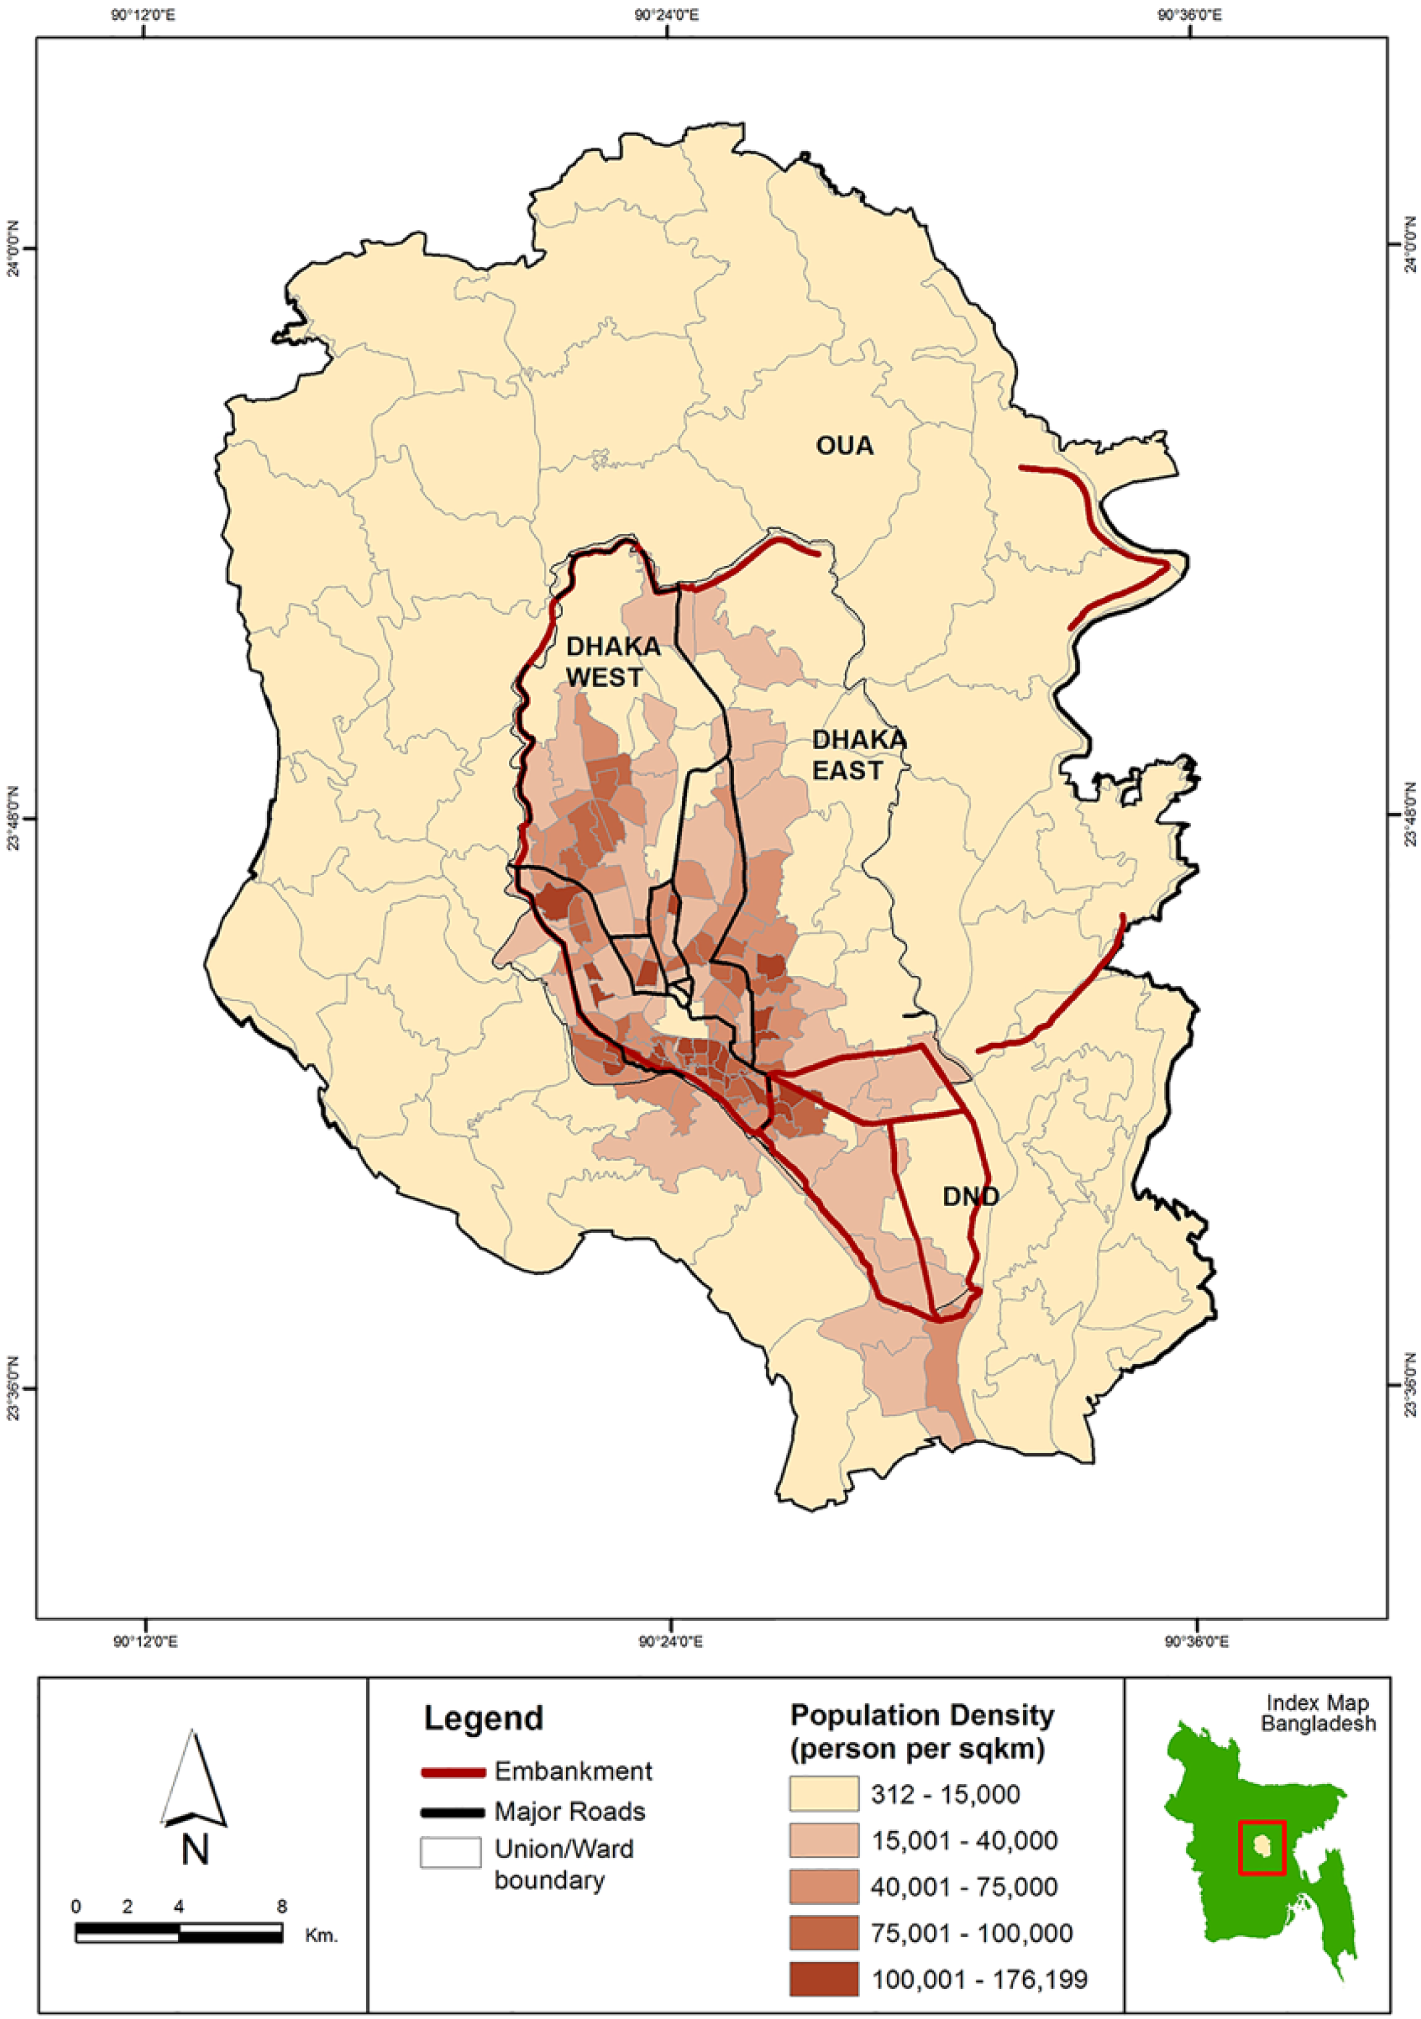
Greater Dhaka’s population density (persons/square kilometre)
Income level
Socioeconomic status in Dhaka can be classified into five categories using monthly per capita income (Figure 2):
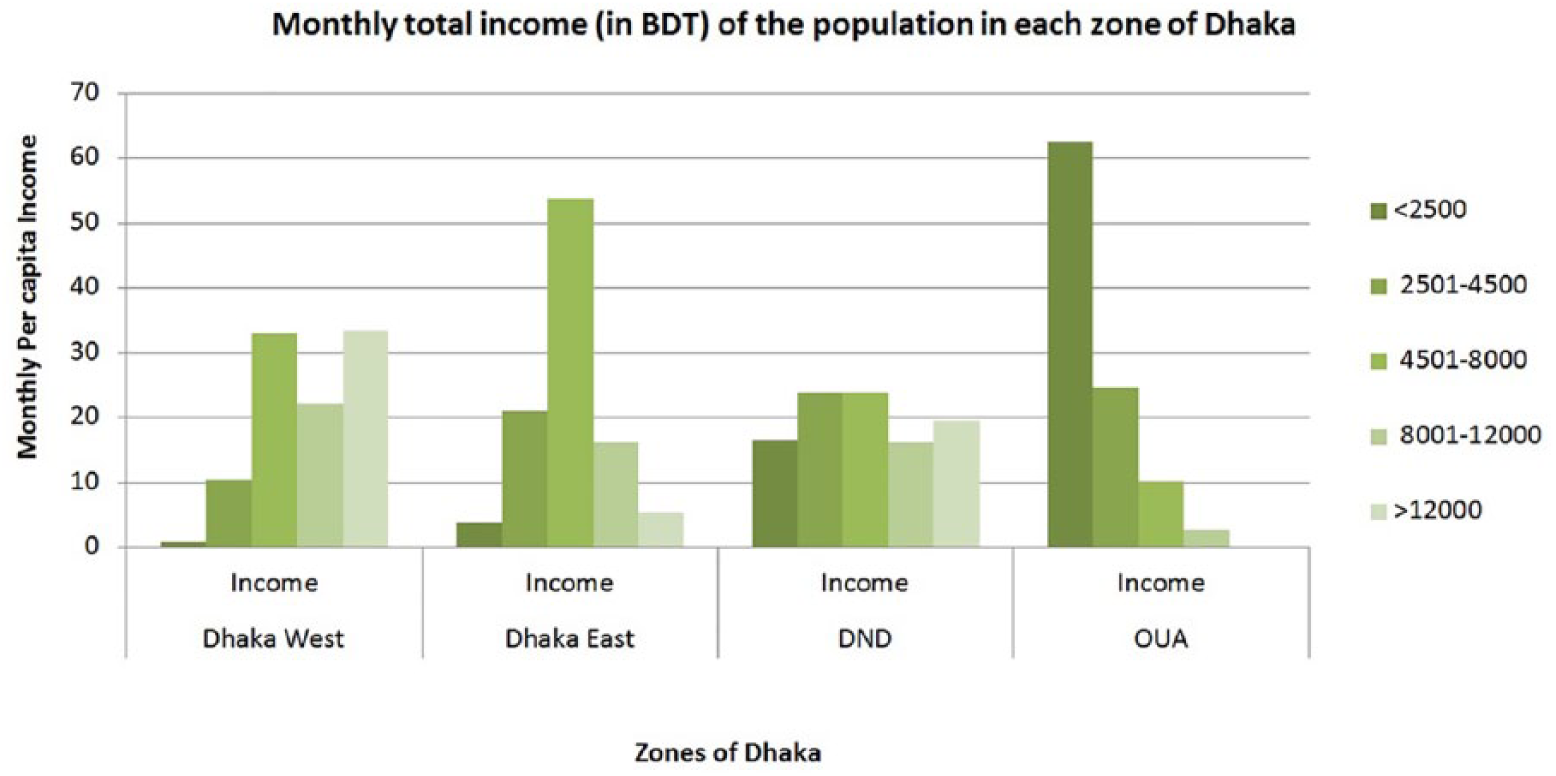
Monthly total income (in BDT) of the population in each zone of Dhaka
very low (< Bangladeshi tarka [BDT] 2,500 or < US$ 32.6)
low (BDT 2,501–4,500 or US$ 32.6–58.7)
middle (BDT 4,501–8,000 or US$ 58.7–104.4)
high (BDT 8,001–12,000 or US$ 104.4–156.6)
very high (> BDT 12,000 or > US$ 156.6)
Areas outside Dhaka City along the Balu and Buriganga rivers have a higher percentage of low-income residents (87 per cent) than other zones. Dhaka West has the highest percentage of high-income residents (56 per cent), followed by 33 per cent middle income and only 11.23 per cent low earners. Dhaka East mainly has a concentration of middle-income people (54 per cent), with a 24 per cent and 21 per cent low and high income-earning population respectively. The residents of the DND area belong to all income groups.
V. Tipping Point Assessment
a. Adaptation Tipping Points for physical systems
For this study, the Storm Water and Drainage Master Plan of Dhaka City and Dhaka Detailed Area Plan were reviewed, with the intention of identifying the threshold value for assessing ATPs for the physical (natural and artificial) system for flooding and drainage. A review of the plans revealed that the flood protection embankments around the major rivers of Dhaka are specially built for a 50-year high water return period. The stormwater drainage system is designed for rainfall of a five-year return period. About 1 to 1.5 metres of ponding depth in unfenced areas and a 0.5-metre depth of floodwater are considered acceptable on the roads.(36) Considering these design criteria, the ATPs for each of the four zones were identified. Hydrodynamic models (both one dimensional and two dimensional) were set up for different return periods of water level and rainfall to simulate both river- and rainfall-induced flooding for a two-day cumulative event. To assess the impact of river flooding, average rainfall was used for all the scenarios of river flooding. To see the variation in stormwater flooding, average water level data were used with rainfall data for different return periods.
Figures 3 and 4 show the ATPs derived for the four zones of Dhaka City for river flooding and rainfall flooding under different return periods. Here, ATPs assessed for the floods simulated for 50-year and 100-year return periods (RPs) can be considered to represent the effects of climate change. This assumption is supported by the cases for the 1998 and 2004 floods, which represent a 100-year RP of river water and 100-year RP of rainfall, respectively (based on data collected from the Bangladesh Meteorological Department). With the increase in the river water level and the intensity of rainfall, the extent of flooding increases. River flooding is much higher than the flooding at higher return periods of rainfall. Un-embanked areas (Dhaka East and OUA) are more vulnerable to river floods than the protected areas (Dhaka West and DND). Embanked areas are affected by rainfall flooding due to congested internal drainage. The DND is the area worst affected by rainfall flooding, and its inadequate drainage system is evident in the sharp increase in the extent of flooding. The OUA is completely unprotected with its intricate network of canals and wetlands, which act as a huge drainage basin. Therefore it has huge flood exposure.
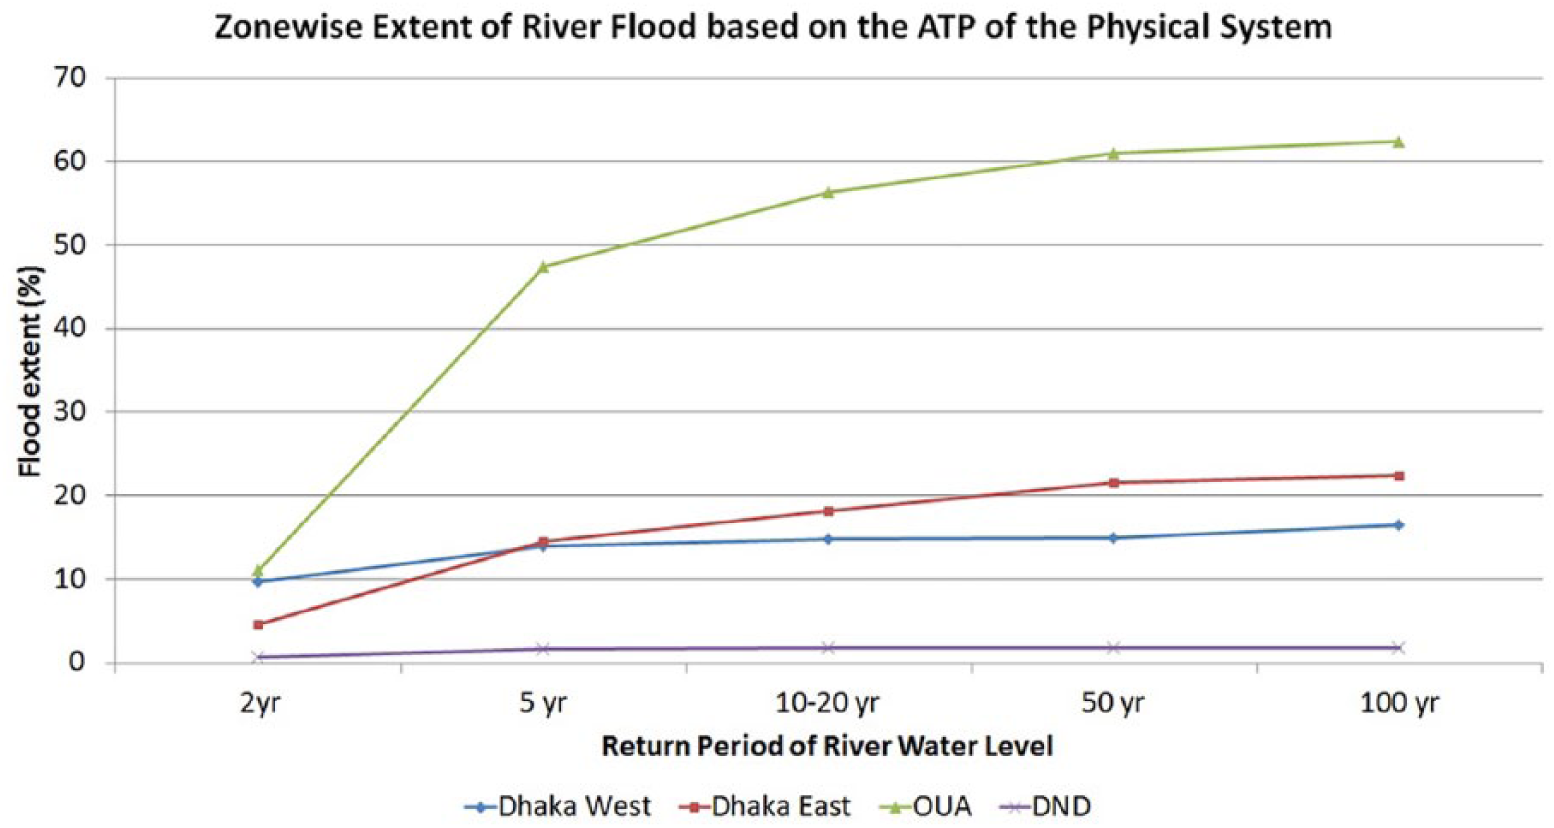
Zone-wise extent of river flooding exceeding the ATP of the physical system, as a percentage of the zonal area
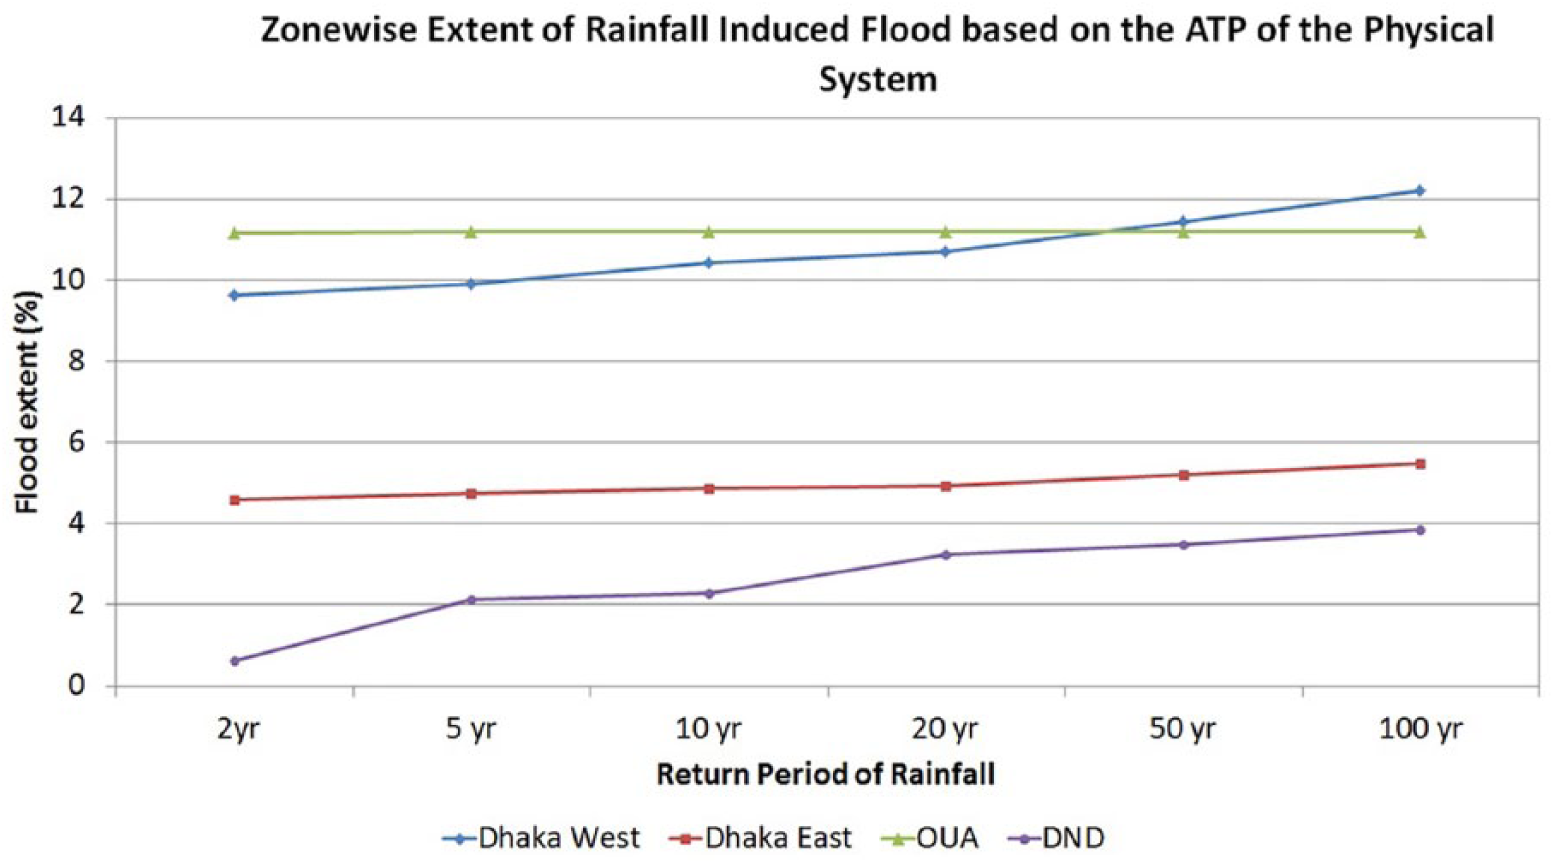
Zone-wise extent of rainfall flooding exceeding the ATP of the physical system, as a percentage of the zonal area
To see the effects of rainfall and river flooding separately, one of the parameters (either the rainfall or river water level) in flood models has been held static. If other combinations had been considered – say, if high rainfall data had been used with a high water level – that would have resulted in an unprecedented extreme event, as was observed during the historic floods in 1988, 1998 and 2004. Climate change might lead to floods that exceed historical records as well. Under such a scenario, the resulting flood extent, depth and duration would be greater and the ATP would have been reached earlier than has been assessed here.
b. Adaptation Tipping Points for social systems
To shed light on how people’s perception of risk changes with the occurrence of tipping points on the eve of extreme events like floods, participatory consultations were conducted in the pilot sites in the four zones of Dhaka City (Map S2 in the online supplement):
Dhaka West: Mirpur Thana and Ramna Thana (fully protected by the western embankment and internal drainage network)
Dhaka East: Beraid Union under Badda Thana (partially unprotected: no embankments and inadequate coverage by a stormwater drainage network)
DND: Ketabpur Union (fully protected with a circular embankment)
Outer Urban Area: Kashipur Union (unprotected with no embankment or stormwater drainage network)
The perceptions of local communities vary based on their socioeconomic conditions. The consultations carried out at community level revealed a number of critical issues that enhance flood risks and contribute to tipping points being reached. These include:
Decrease of urban water bodies and flood flow areas
Inadequate stormwater drainage
Unplanned development of residential, commercial and industrial areas
Absence of and encroachment of natural drainage systems
Conflict of drainage and waterways with roads
The damage caused by major flooding events (1988, 1998 and 2004) is presented in the following sections and in Table S1 (see the online supplement), drawing from published reports and journal articles as well as people’s recollections. About 47.1 per cent of Greater Dhaka was inundated in 1988, 53 per cent in 1998 and 43 per cent in 2004.(37)
Dhaka West
Most of this area (75 per cent) was submerged in the 1988 mega-flood.(38) Most people moved to relatives’ homes or to higher ground in different parts of the city. The socioeconomic and infrastructural damage was especially large in the 137-square kilometre built-up area of Dhaka City, estimated by the Japan International Cooperation Agency (JICA) at BDT 500 to 1,000 million (approximately US$ 9.8 to 19.6 million, where US$ 1 = BDT 48).(39) In 1998, this area was protected from river flooding by the western embankment and flood walls along the Turag and Buriganga Rivers, but rainfall flooding inundated 23 per cent of the area.(40) Rainfall also caused internal flooding inside the embanked area in the 2004 flood.
Dhaka East
Both the 1988 and 1998 floods inundated most of eastern Dhaka. In 1998, 384 kilometres of paved roads were under floodwater, and almost the entire eastern area and about 20 per cent of the western block were deluged. This flooding was primarily due to heavy rainfall, all in the catchment areas of the major rivers. Water supplies from deep tube wells were disrupted and water supply suspended in the Thana, Gulshan and Uttara cantonments.(41)
Because of the long duration of the 1998 flood, many people were unable to work at their usual jobs. High-income people stayed in hotels and guest houses, but lower-income households did not have this option. In 2004, residents complained of floodwater up to waist level.
Dhaka-Narayanganj-Demra (DND) area
The DND area was not flooded in 1988, but was partially inundated in 1998 and severely affected in 2004. People perceived as responsible factors the sedimentation of drainage canals, reduction of the canal width due to encroachments, development of residential and industrial areas, and dumping of wastes in the canals. The closing and blocking of drainage canals for local people’s fishing activities also causes flooding and creates artificial drainage congestion, even during the dry season. The DND area was originally planned as an agricultural zone and canals were designed for irrigation; no piped drainage system was planned. As settlements and industries started to replace agriculture, the inadequate drainage increased the vulnerability to flooding.
Outer Urban Area (OUA)
The flood of 1988 completely inundated low-lying floodplains. Near the wetlands, water remained on the ground; in settlements, it entered households. In 1998 floodwater entered the courtyards of rural households, and many people took shelter temporarily in relatives’ houses on higher land in the central part of the city. The low-income population, including hawkers, day labourers, garment workers and street children, took shelter in embankments, relief camps and schools turned into shelters. After the 1988 experience, people started building their houses on a higher plinth level. In 2004, wetlands and agricultural lands were completely flooded; floodwater overtopped and inundated roads and entered houses in low-lying areas.
In general, floods had severe implications for the health of the people in all four Dhaka zones. A health survey conducted during the 1998 flood revealed that 20.91 per cent suffered from diarrhoea or dysentery, 23.85 per cent from respiratory tract infections and 9 per cent from skin disease,(42) especially schoolchildren exposed for more than two days to knee-deep floodwater mixed with sewage water. The sudden onset of the flood left healthcare teams unprepared to deal with a situation of such a massive scale. However, field healthcare centres were set up by NGOs and government, and people came forward spontaneously to help the sick and affected through distribution of medicines, relief, food and water. There are no precise statistics about the extent of health impacts for Greater Dhaka.
c. Stakeholders’ level of risk tolerance
Dhaka West
Different types of responses were obtained from the two pilot areas: Mirpur Thana, far from central Dhaka; and the central Dhaka area of Ramna Thana. In Mirpur (e.g. in Wards 12, 5, 8, 10 and 11), people can experience waist-high flooding after a few hours of intensive rainfall, due to clogged drains and filled water bodies and canals. Residents temporarily move to higher floors of the buildings or to other parts of the city when the water reaches waist high, enters their homes and remains for extended periods. Some people prefer not to leave their property and belongings.
In Ramna Thana in central Dhaka, people become uncomfortable when floodwater is above 0.3 metres and reaches knee high (0.5 metres), and it becomes difficult to move either on foot or by car. Various road repair and maintenance works in the last 10–15 years have raised the road level above the ground level of buildings, so floodwater easily enters the ground floor of the buildings/shops and causes damage. As long as floodwaters are under 0.3 metres and stay on the road, they are manageable for the middle- to high-income population of this area.
Dhaka East
In the last decade several new high-quality housing projects have been developed here and the area is occupied mostly by middle- to high-income people expecting a flood-free residential area. Although the area is un-embanked, flooding occurs here more frequently due to extreme rainfall than to river flooding. When water reaches 0.3 metres high on the road, residents become impatient, and at waist level, it becomes impossible for office workers and students to reach their destinations.
Dhaka-Narayanganj-Demra (DND) area
When local residents were mostly farmers, they were not bothered by floodwater if it remained primarily within the wetland areas. Nowadays, with the decrease of agricultural land, people have turned to other livelihoods – industrial work, business, small trading, driving, etc. As long as the floodwater is no more than 1–2 metres high and does not enter the factories or other buildings, people do not complain.
Outer Urban Area (OUA)
Wetland areas are currently being filled for new housing developments,(43) and rural people are gradually being displaced by middle- to high-income residents, who have migrated from other places with the hope of living in a hazard-free environment. These newcomers are uncomfortable when water gets inside their houses, and especially worried when flood levels exceed 1 metre and damage goods and properties.
d. Integrated Adaptation Tipping Points (IATPs) of urban flood risk
The assessment of ATPs of the physical system has been merged with the ATPs of the social system to assess the effect and acceptability of flood risks on a combined system – we call this the “Integrated Adaptation Tipping Point (IATP)”.
The threshold values for the identification of critical IATPs are given in Table S2 (in the online supplement). For the physical system (e.g. embankments, stormwater drainage system, ponding of wetlands) these values were obtained from design criteria set for the flooding and drainage structures in the Dhaka Storm Water Drainage Master Plan.(44) For the social system, it was difficult to obtain a single threshold value since there are several tipping points within each zone that vary according to socioeconomic characteristics. Above ankle height on the road is a tipping point for higher-income people because beyond that it intrudes into their homes, shops and cars. For lower- to middle-income people, knee-deep floodwater is tolerable if it remains in the road. Knee-deep water was especially identified as the tipping point for people living or working in low-lying areas or whose buildings are at or below road level and vulnerable to damage. Instead of a single value, a range has been fixed that corresponds to the socioeconomic strata (Figure S1 in the online supplement) of the majority of people living there.
When we consider the Integrated Adaptation Tipping Points instead of singular ATPs for either the physical or social system, the picture is somewhat different, as can be seen from the graphs (Figures S1 and S2 in the online supplement). These figures compare areal flood coverage based on the ATP of the physical system (Figures 3 and 4) with that of the integrated physical and social system (Figures S1 and S2 in the online supplement). As the tipping point is reached earlier (which means that the threshold value is lower), when the social tipping point is considered with the physical tipping point in determining IATP, the assessed flooding extent is higher for IATP than the tipping point of the physical system. It can be seen that the assessed vulnerability to flooding in all four zones increases when social tipping points are included along with the physical ATPs.
It is noteworthy that the IATP indicates that the perceived tipping point for fluvial or river flooding (Figure S1 in the online supplement) in Dhaka East is higher than that of Dhaka West, since Dhaka East is unprotected from river floods. Also, in terms of rainfall flooding extent (Figure S2 in the online supplement), Dhaka West has tipped over the OUA, as the drainage system in Dhaka West gets clogged, causing internal flooding problems. Similarly, the DND area becomes inundated within a few hours of rainfall due to internal drainage congestion caused by silted and filled-up drainage canals resulting from unplanned urbanization. So the zones that are partially or fully protected from riverine flooding with embankments (Dhaka West and DND) are highly impacted by intensive rainfall events. The un-embanked zones (Dhaka East and OUA) remain vulnerable to river flooding due to extreme rainfall, high river discharge from upstream, and reduced wetlands owing to urbanization.
To see the specific effects of climate change on Dhaka, we used data from the Coupled Model Intercomparison Project, phase 5 (CMIP5), based on IPCC projections,(45) for the monthly maximum precipitation. For the assessment of urbanization impacts, we used scenarios of planned and unplanned growth for the year 2035, derived from an urban growth model.(46) (The revised Dhaka Structure Plan(47) is expected to be implemented by 2035.)
Figures 5 and 6 show the extent by zone of average flooding and climate change-induced flooding, analysed based on the IATP of the combined socio-physical system for planned and unplanned urban growth scenarios. Compared to the average flooding scenario, vulnerability in all four zones is much higher when climate change is considered. Dhaka West is already developed, and not much difference is expected under planned and unplanned growth. Dhaka East will lose much of its wetland area if unplanned growth prevails, which will increase flooding. The effect of unplanned growth is visible in the DND area, which will face more drainage congestion under the climate change scenario. Under average conditions no flooding is expected in the DND area. The OUA will experience a mix of planned and unplanned growth, and vulnerability to flooding is expected for both scenarios. So, apart from the impact of climate change, the IATP is also influenced by urbanization.
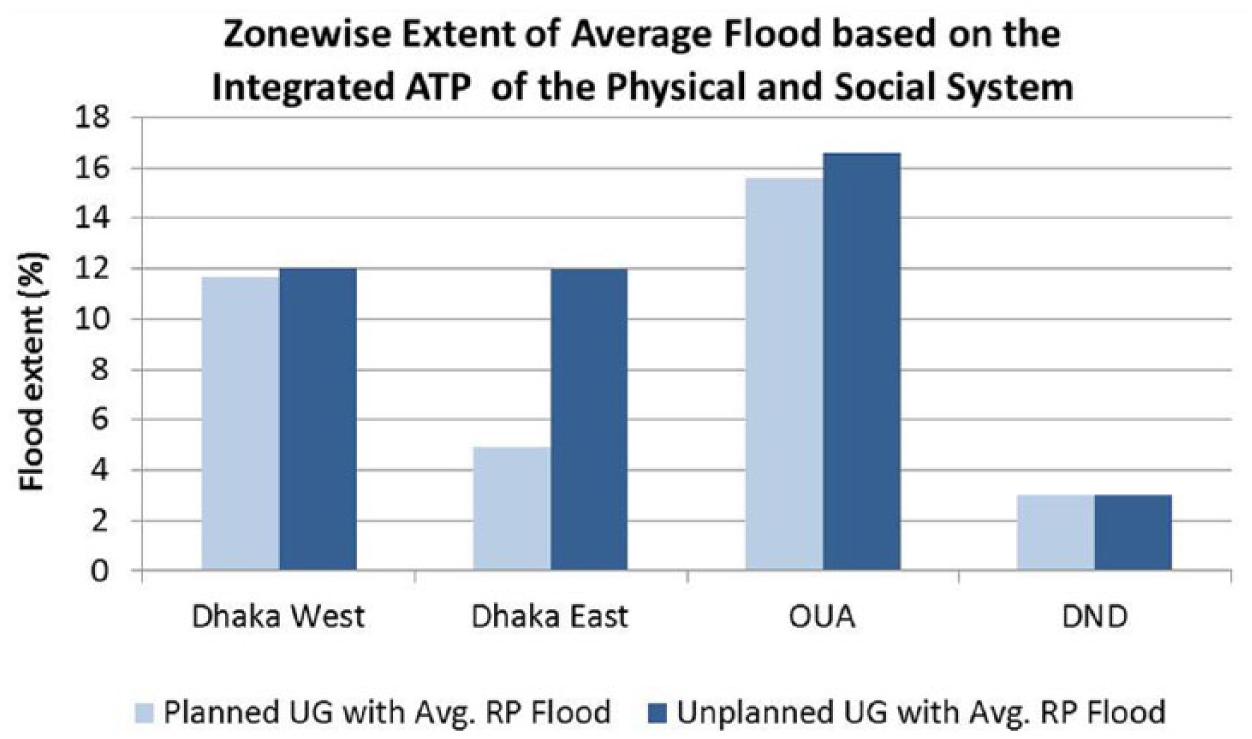
Extent of average flooding based on the IATP of the socio-physical system due to urbanization, by zone, projected for 2035
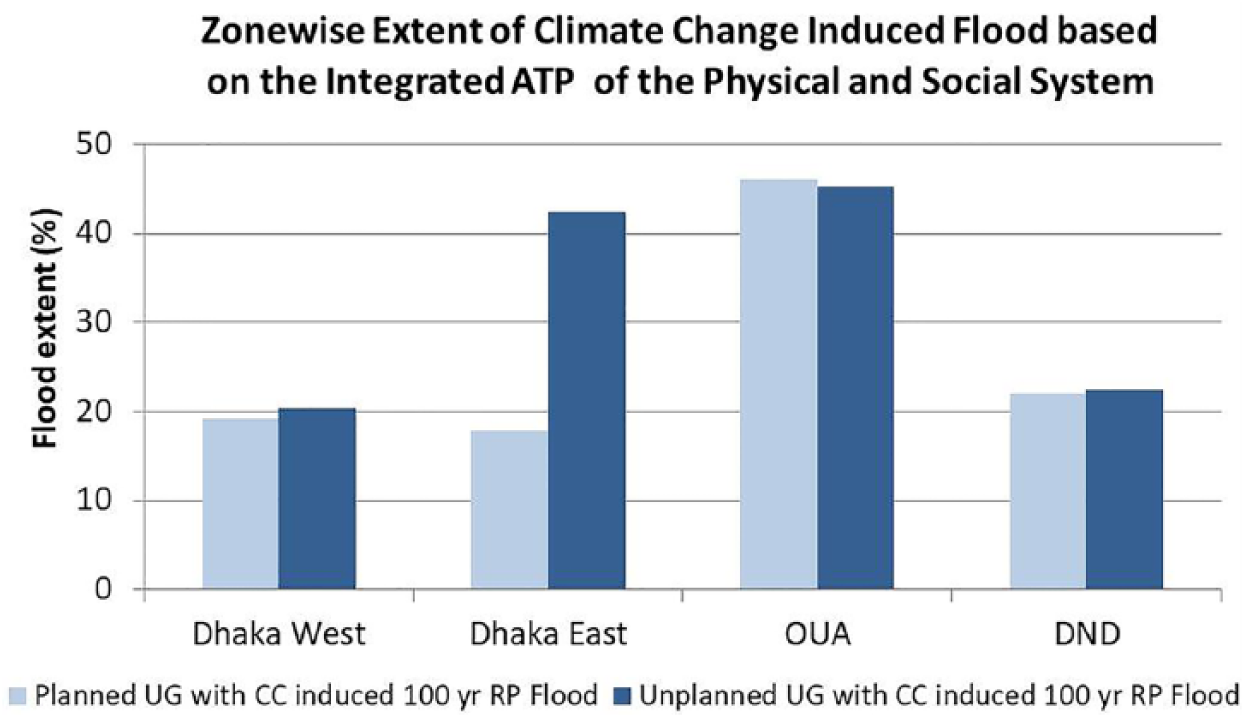
Extent of climate change-induced flooding based on the IATP of the socio-physical system due to urbanization, by zone, projected for 2035
VI. Iatp And Urban Resilience
This section compares the outcomes of the IATP analysis with the socioeconomic resilience status(48) in Dhaka, in the face of climate change and both planned and unplanned urban growth, to determine their relationship.
Recently a micro-level World Bank study(49) on climate and disaster resilience of the Greater Dhaka Area revealed that different variables play a major part in determining community resilience to flooding. Exposure to flooding is a main factor in determining vulnerability, which is further influenced by other dimensions of resilience – social, economic, physical, natural and institutional. For our paper, ward-level data on income and density were used as the socioeconomic dimensions to determine integrated ATPs of the socio-physical system. The World Bank study(50) additionally considered population, health, education and awareness, social capital and community preparedness (as parameters for social resilience), employment, household assets, finance and savings, and budget and subsidies (as parameters for economic resilience). If we classify the socioeconomic resilience for the four Dhaka zones using data from the World Bank study,(51) we find that locations in three of the zones used in this paper (Beraid Union in Dhaka East, Kutubpur Union in DND and Kashipur Union in OUA) show moderate social and economic resilience on most parameters. However, they perform poorly on health as a result of inaccessible health care facilities and a lack of disaster preparedness, and on finance, savings and budgetary allocations. The central part of Dhaka has good social and economic resilience, while the most vulnerable wards performed poorly on many dimensions.
A community that is stronger, physically, socially and economically, could be expected to be more resilient to floods. However, comparative analysis of the tipping point of the integrated physical and social system revealed that these groups had a lower tolerance for risk than those who were actually less resilient. The expectations of local people were different from what scientists or engineers might assume, informed by their varied experiences of environmental hazards. Engineers and planners design drainage systems or structures mainly considering the hydrological aspects and the existing and planned land use of the particular area. Rather than ensuring a zero flood level, they allow a certain level of water onto roads because of the huge cost involved if they design for “no flooding” options.(52)
However, people who reside in the planned, flood-free area (especially from the high-income group) expect complete flood protection. Despite rating well on social and economic resilience, with the capacity to manage extreme conditions, they proved unwilling to accept or deal with unforeseen events. For them, the tipping point might be reached before it is even anticipated. Residents who have lived in unprotected areas for years are accustomed to flooding(53) and have little option but to adapt to prevailing conditions.(54) These lower- and middle-income groups are better at coping with sudden changes and challenges, and they come up with their own coping strategies.(55)
VII. Conclusions
Theoretically, the concept of Adaptation Tipping Points (ATPs) enables decision makers to identify the thresholds when impacts exceed acceptable limits. Methodologically, however, it is rather a challenging task to pinpoint exactly when the physical or social system will reach this moment. As separate entities, both the physical and the social system have different tipping points, which have been found from the hydrodynamic model results and field-level studies. It is easier to find the ATP of the physical system, compared to the social system. The ATP for the physical system varies with the hydrological characteristics and type of flooding. Assessment of ATPs under the current flood risk management regime reveals that areas protected from river floods can still be highly affected by rainfall-induced flooding, compared to the unprotected areas. This is exactly what happened in Dhaka West, Dhaka-Narayanganj-Demra, and to some extent in Dhaka East. Despite protection measures such as embankments and internal stormwater drainage, particular areas can still reach critical ATPs under extreme conditions after a certain amount of time (return period).
The accumulated knowledge and perceptions of communities “at risk” are recognized as key to ameliorating or managing disaster risk at local level. This paper has combined the “bottom-up” socio-political preferences and risk perceptions elicited from the local community with the “top-down” assessment of flood risks due to climate change and urbanization to derive the Integrated Adaptation Tipping Points (IATP) of the socio-physical system. This revealed that assessed vulnerability to flooding in all four zones increases when social tipping points are included, and critical ATPs are reached before they would be anticipated from a planning perspective. The reality on the ground is that the allowable flood level from the physical (engineering design) point of view may not be acceptable at the local or community level.
Correlating IATP with socioeconomic resilience shows that there are major discrepancies between local residents’ socioeconomic resilience and their willingness to tolerate flooding. Allocation of resources to middle- and high-income areas where residents are less comfortable with flooding is a regressive policy that perpetuates disadvantage. A certain risk level may be tolerated merely because of the different expectations of state support and different experiences in terms of physical structures, social settings, economic conditions and so on. A community that is both socially and economically resilient can be intolerant of the sudden onset of an extreme event, and therefore reach a tipping point earlier than other communities that may actually be more susceptible to hazards. This suggests that social tipping points need to be used in conjunction with other data to ensure an equitable approach to adaptation planning.
Supplemental Material
ahmed_supplement – Supplemental material for Integrated Adaptation Tipping Points (IATPs) for urban flood resilience
Supplemental material, ahmed_supplement for Integrated Adaptation Tipping Points (IATPs) for urban flood resilience by Farhana Ahmed, M Shah Alam Khan, Jeroen Warner, Eddy Moors and Catharien Terwisscha Van Scheltinga in Environment & Urbanization
Footnotes
Acknowledgements
We are extremely grateful to Wageningen University and Research – especially the Climate Change and Adaptive Land and Water Management division, Alterra – for providing the necessary support to conduct this research. Thanks to CEGIS for providing the required data and continuous assistance for this research. We are grateful to the editors and anonymous reviewers for their constructive feedback and insightful suggestions, which greatly improved this article. The assistance provided by Tamim Al Hossain, Saniruzzaman, Zulfiqar Rahman and Farhana Noor in developing the hydrodynamic model of river and stormwater drainage is also highly appreciated.
Funding
Funding for this research was provided under NWO-WOTRO grant W 01.65.339.00 for the integrated programme “Communities and institutions for flood resilience: enhancing knowledge and capacity to manage flood risk in the Bangladeshi and Dutch Deltas”.
1.
Alam, M J (2014), “ ‘The organized encroachment of land developers’—Effects on urban flood management in Greater Dhaka, Bangladesh”, Sustainable Cities and Society Vol 10, pages 49–58.
2.
Daniels, E E, G Lenderink, R W A Hutjes and A A M Holtslag, (2016), “Observed urban effects on precipitation along the Dutch West coast”, International Journal of Climatology Vol 36, No 4, pages 2111–2119.
3.
Walker, W E (2011), Policy Analysis, 1962–2012: From Predict and Act to Monitor and Adapt, Delft University of Technology, Delft.
4.
Gunderson, L H and C S Holling (2002), Panarchy: understanding transformations in systems of humans and nature, Island Press, Washington, DC.
5.
Walker, B, J Anderies, A Kinzig and P Ryan (2006), “Exploring resilience in social-ecological systems through comparative studies and theory development: introduction to the special issue”, Ecology and Society Vol 11, No 1, Art 12.
6.
See reference 2.
7.
Kinzig, A P, P Ryan, M Etienne, H Allison, T Elmqvist and B H Walker (2006), “Resilience and regime shifts: assessing cascading effects”, Ecology and Society Vol 11, No 1, Art 20.
8.
Gao, J, B Barzel and A-L Barabási (2016), “Universal resilience patterns in complex networks”, Nature Vol 530, No 7590, Art 307.
9.
Lenton, T M and J-C Ciscar (2013), “Integrating tipping points into climate impact assessments”, Climatic Change Vol 117, No 3, pages 585–597.
10.
Bekier, M, B R Molesworth and A Williamson (2012), “Tipping point: The narrow path between automation acceptance and rejection in air traffic management”, Safety Science Vol 50, No 2, pages 259–265.
11.
Nchito, W S (2007), “Flood risk in unplanned settlements in Lusaka”, Environment and Urbanization Vol 19, No 2, pages 539–551; also Adelekan, I O (2010), “Vulnerability of poor urban coastal communities to flooding in Lagos, Nigeria”, Environment and Urbanization Vol 22, No 2, pages 433–450; and Manda, M Z (2014), “Where there is no local government: addressing disaster risk reduction in a small town in Malawi”, Environment and Urbanization Vol 26, No 2, pages 586–599.
12.
See reference 9.
13.
Bentley, R A, E J Maddison, P H Ranner, J Bissell, C C S Caiado, P Bhatanacharoen, T Clark, M Botha, F Akinbami, M Hollow, R Michie, B Huntley, S E Curtis and P Garnett (2014), “Social tipping points and Earth systems dynamics”, Frontiers in Environmental Science Vol 2, No 35.
14.
Haasnoot, M, H Middelkoop, E van Beek and W P A van Deursen (2011), “A method to develop sustainable water management strategies for an uncertain future”, Sustainable Development Vol 19, No 6, pages 369–381.
15.
Werners, S, R Swart, E van Slobbe, T Bölscher, S Pfenninger, G Trombi and M Moriondo (2012), Turning Points in Climate Change Adaptation, Paper presented at “The Governance of Adaptation - An international symposium”, Amsterdam.
16.
Kwadijk, J C J, M Haasnoot, J P M Mulder, M M C Hoogvliet, A B M Jeuken, R A A van der Krogt, N G C van Oostrom, H A Schelfhout, E H Velzen, H Waveren and M J M de Wit (2010), “Using adaptation tipping points to prepare for climate change and sea level rise: a case study in the Netherlands”, Wiley Interdisciplinary Reviews: Climate Change Vol 1, No 5, pages 729–740; also Gersonius, B (2012), “The resilience approach to climate adaptation applied for flood risk”, PhD thesis, Delft University of Technology and UNESCO-IHE Institute for Water Education, CRC Press/Balkema, Leiden.
17.
Lavery, S and B Donovan (2005), “Flood risk management in the Thames Estuary looking ahead 100 years”, Philosophical Transactions of the Royal Society A: Mathematical, Physical and Engineering Sciences Vol 363, No 1831, pages 1455–1474; also Marchand, M and F Ludwig (2014), Towards a Comprehensive Framework for Adaptive Delta Management, Delta Alliance, Delft and Wageningen; Segura, L A and E Meurs (2014), Adaptation to Climate Change in Colombia: a tipping point analysis, UNESCO-IHE, FutureWater and Sarvision, Deltares; Berger, T and P Schreinemachers (2006), “Creating agents and landscapes for multiagent systems from random samples”, Ecology and Society Vol 11, No 2, Art 19; and Danh, V and H Khai (2014), “Using a risk cost-benefit analysis for a sea dike to adapt to the sea level in the Vietnamese Mekong River Delta”, Climate Vol 2, No 2, Art 78.
18.
19.
Slovic, P (1999), “Trust, emotion, sex, politics, and science: Surveying the risk-assessment battlefield”, Risk Analysis Vol 19, No 4, pages 689–701.
20.
Peters, G, M K McCall and C van Westen (2009), “Coping strategies and manageability: how participatory geographical information systems can transform local knowledge into better policies for disaster risk management”, Disaster studies working paper.
21.
These included the Bangladesh Meteorological Department (BMD), Bangladesh Water Development Board (BWDB), Bangladesh Bureau of Statistics (BBS), Dhaka Water Supply and Sewerage Authority (DWASA), Water Resources Planning Organization (WARPO), Rajdhani Unnayan Kartripakha (RAJUK), Dhaka North City Corporation (DNCC), Dhaka South City Corporation (DSCC) and Center for Environmental and Geographic Information Services (CEGIS).
22.
![]() , “Summary for policymakers”, in C B Field, V R Barros, D J Dokken, K J Mach, M D Mastrandrea, T E Bilir, M Chatterjee, K L Ebi, Y O Estrada, R C Genova, B Girma, E S Kissel, A N Levy, S MacCracken, P R Mastrandrea and L L White (editors) (2014), Climate Change 2014: Impacts, Adaptation, and Vulnerability. Part A: Global and Sectoral Aspects, Contribution of Working Group II to the Fifth Assessment Report of the Intergovernmental Panel on Climate Change, 32 pages.
, “Summary for policymakers”, in C B Field, V R Barros, D J Dokken, K J Mach, M D Mastrandrea, T E Bilir, M Chatterjee, K L Ebi, Y O Estrada, R C Genova, B Girma, E S Kissel, A N Levy, S MacCracken, P R Mastrandrea and L L White (editors) (2014), Climate Change 2014: Impacts, Adaptation, and Vulnerability. Part A: Global and Sectoral Aspects, Contribution of Working Group II to the Fifth Assessment Report of the Intergovernmental Panel on Climate Change, 32 pages.
23.
Ahmed, F, E Moors, M S A Khan and C T van Scheltinga (2018, under review), “Tipping points in adaptation to urban flooding under climate change and urban growth: the case of the Dhaka megacity”.
24.
McCracken, J A, J N Pretty and G R Conway (1988), Introduction to Rapid Rural Appraisal for Agricultural Development, International Institute for Environment and Development; also Crawford, I M (1997), Marketing Research and Information Systems, UN Food and Agriculture Organization, Rome.
25.
Wester, P and J Bron (1998), Coping with Water: Water Management in Flood Control and Drainage Systems in Bangladesh, International Institute for Land Reclamation and Improvement.
26.
Davis, J and D Whittington (1998), ““Participatory” research for development projects: A comparison of the community meeting and household survey techniques”, Economic Development and Cultural Change Vol 47, No 1, pages 73–94.
27.
A Union Council is a local government unit, generally responsible for about nine villages.
28.
Rogers, R W (1975), “A protection motivation theory of fear appeals and attitude change”, Journal of Psychology Vol 91, pages 93–114.
29.
See reference 20.
30.
31.
See reference 30.
32.
See reference 30.
33.
See reference 30.
34.
See reference 30.
35.
See reference 30.
36.
See reference 30.
37.
See reference 1; also Dewan, A M and Y Yamaguchi (2008), “Effect of land cover changes on flooding: example from Greater Dhaka of Bangladesh”, International Journal of Geoinformatics, Vol 4, No 1, pages 11–20.
38.
Alam, M and M D G Rabbani (2007), “Vulnerabilities and responses to climate change for Dhaka”, Environment and Urbanization Vol 19, No 1, pages 81–97.
39.
Jahan, S (2000), “Coping with flood: the experience of the people of Dhaka during the 1998 flood disaster”, Australian Journal of Emergency Management Vol 15, pages 16–20.
40.
See reference 38.
41.
Islam, N and K Ali (1999), “Housing damage in Dhaka City due to the 1998 flood”, in A Nishat, M Reazuddin, R Amin and A R Khan (editors), The 1998 Flood: Impact on Environment of Dhaka City, Department of Environment in conjunction with IUCN Bangladesh, Dhaka.
42.
Kafiluddin, A K M (2000), “Impact study on health”, in A Nishat, M Reazuddin, R Amin and A R Khan (editors), The 1998 Flood: Impact on Environment of Dhaka City, Department of Environment and IUCN, Dhaka.
43.
See reference 1.
44.
See reference 30.
45.
Alder, J R, S W Hostetler and D Williams (2013), “An interactive web application for visualizing climate data”, Eos Vol 94, No 22, pages 197–198.
46.
See reference 23.
47.
48.
Dasgupta, S, A Zaman, S Roy, M Huq, S Jahan and A Nishat (2015), Urban Flooding of Greater Dhaka in a Changing Climate: Building Local Resilience to Disaster Risk, World Bank.
49.
See reference 48.
50.
See reference 48.
51.
Jahan, S (2015), “Climate and disaster resilience of Greater Dhaka Area: a micro level analysis”, Background report, Urban Flooding of Greater Dhaka in a Changing Climate: Building Local Resilience to Disaster Risk.
52.
Huntington, H P, E Goodstein and E Euskirchen (2012), “Towards a tipping point in responding to change: rising costs, fewer options for Arctic and global societies”, Ambio Vol 41, No 1, pages 66–74.
53.
Jahan, F and S A Wahab (2015), “The role of fatalism in resilience to food price volatility in Bangladesh”, IDS Bulletin Vol 46, No 6, pages 60–67.
54.
See reference 53.
55.
Jabeen, H, C Johnson and A Allen (2010), “Built-in resilience: learning from grassroots coping strategies for climate variability”, Environment and Urbanization Vol 22, No 2, pages 415–431.
References
Supplementary Material
Please find the following supplemental material available below.
For Open Access articles published under a Creative Commons License, all supplemental material carries the same license as the article it is associated with.
For non-Open Access articles published, all supplemental material carries a non-exclusive license, and permission requests for re-use of supplemental material or any part of supplemental material shall be sent directly to the copyright owner as specified in the copyright notice associated with the article.