
Abstract
The problem of flooding in Warri, Nigeria is as old as the city itself. What has changed in recent years is the rapidly increasing magnitude and frequency of floodwater retention pools on urban streets as urban development expanded into low-lying swamplands within the city. Through the process of community urban risk assessments, urban flood zone occupants acknowledge the growing problem of on-street flood retention pools in a city once dominated by problems with off-street flood retention pools. A factor analysis of the perceived causes of flooding shows that Warri residents believe that human activities that reduced the floodwater storage capacity of its natural drainage sinks (i.e., its swamplands), violated building codes, changed local water levels, altered low-lying mangrove swamp terrain, and eliminated drainage facilities are responsible for the increasing retention of floodwater pools on city streets in the last few decades. Such local stock of flood knowledge has implications for a local participatory approach to community adaptations and mitigation methods to reduce urban flood risks from climate change and uncontrolled urban expansion. Local community adaptation choices guide how flood-affected residents cope with urban floods, especially how they use and alter their living space and respond to emergencies. However, such community views are often ignored by experts seeking solutions to flooding. If the views of flood zone occupants begin to inform flood adaptation choices, proposed solutions to flooding problems would be more likely to receive local support and acceptance, thus making the bottom-up solutions developed in this paper easier to implement and sustain. Once a well-formulated grassroots adaptation strategy for urban flood risk management for resiliency becomes the base for action, a more resilient national policy is sure to succeed, especially in low-income and lower-middle-income countries where informal settlement is the case and the role of government in flood management is still minimal.
Keywords
I. Introduction
The combination of climate change impacts and rapid urban expansion into floodwater storage zones is a real threat exacerbating flood risks and vulnerabilities for at-risk communities in cities across the globe, especially those in African low-lying coastal plains.(1) One such city is the colonial seaport city of Warri, a major hub of Nigeria’s petroleum industry. The city was founded on a flood-prone mangrove swamp terrain in 1893, and the site has a long history of flooding that pre-dates its foundation. In addition to its already high average annual rainfall of 2,803.6 millimetres, Warri swamplands receive large volumes of floodwaters through the numerous distributaries and creeks of the Niger River flowing through to the ocean. Hence, some of the early colonial office buildings in the city were built on stilts or raised foundations. In the last few decades, Intergovernmental Panel on Climate Change (IPCC) reports indicate a modest increase in precipitation across the globe and West Africa in particular and the Nigerian Meteorological Agency (NIMET) projects more severe flooding events associated with climate change impacts in southern Nigeria.(2)
Simultaneously, socioeconomic changes in the Warri metropolis have helped underpin the more than quadrupling of its population between 1960 and 2006, propelling urban expansion onto flood-prone swamplands that hitherto served as its natural floodwater storage sinks and exposing the residents to heightened flood risks and vulnerabilities. Yet the uncertainties of this emerging synergy of impacts from climate change and rapid urban growth pose a new challenge to flood managers and flood zone occupants because they also undermine the assumptions of stationarity that often underlie traditional flood risk understanding, assessment and adaptation practices.(3) Hence, an alternative, more resilient flood risk management system, based on the non-stationarity assumptions underlying the emerging trends in biophysical and social drivers across the globe, has become much needed. This is especially the case for long-term flood zone occupants in low-income and lower-middle-income nations who often claim to have been living with floods all their lives. For example, Tania Lopez-Marrero alluded to this when a Puerto Rican in her study group stated: “We have lived here a hundred years with the flood, and we can live that way a hundred years more.”(4) Even if such local coping strategies with regard to community flood risks have been successful in managing everyday flood risks under periods of a stable climate, the Warri situation offers a new opportunity to examine the continued resilience of the local range of adaptation choices under the growing influence of climate change and the rapid urban growth uncertainties of today.
This paper describes how Warri flood zone occupants assess the dominant type of flooding and its root causes, as well as how their experience and accumulated stock of knowledge of living with floods could be harnessed to make their existing adaptation choices more resilient. Such bottom-up flood risk adaptation management for achieving citywide flood resilience is advocated in this study. This focus is apt because the input of local knowledge is important for community acceptance and involvement in the implementation of flood management solutions arising from it. This way, a bottom-up urban flood management for resiliency may begin to emerge and, perhaps, become the future recipe for flood risk management in low- and middle-income countries where viable national urban flood risk management systems for resilience are still absent. In the past, such perspectives were not often well articulated in flood risk management solutions and empowering such communities as gatekeepers is likely to increase the acceptability and sustainability of flood mitigation policies.
II. Adaptation for Flood Risk Resilience
This study focuses on adaptation for flood risk resilience. Its goal is to identify how to reduce the vulnerability and harmful consequences of flooding while increasing people’s flood resilience to enable flood zone occupants to truly live with extreme floods and maintain the functionality of flood zones’ economies, facilities, services and communities. According to Pelling, “adaptation is defined as: the process through which an actor is able to reflect upon and exact changes in those practices and underlying institutions that generate root and proximate causes of risks, frame capacity to cope and further rounds of adaptation to climate change.”( 5 ) Pahl-Wostl puts it more succinctly: “adaptive management is a systematic process of improving management policies and practices by learning from outcomes of implemented strategies”.(6) Such iterative learning cycles ensure regular system updating and a re-assessment of the practical ways that Warri flood communities have adapted or maladapted to flood disaster risks over the years. Hence, the successes or failures of past flood risk adaptation choices become the database of the local stock of knowledge required to guide any long-term local or national framework for future, forward-looking flood risk management for resilience.
Furthermore, for any flood risk management to achieve resilience, the system-based concept of resilience is also required to manage the uncertainties of flood risk impacts under the current climate change and rapid urban growth scenarios. This gives a flood risk management system the “ability to re-organize itself so as to maintain functionality”(7) and benefit from the system’s capacity for restorative or adaptive resilience. Unfortunately, traditional flood risk management systems have only benefited from restorative resilience, which focuses mainly on infrastructural (technological) solutions using only the services of professionals. But given the dynamic (non-stationary) nature of environmental drivers in generating extreme flood risks, vulnerabilities and unpredictability, it has become imperative to focus more on adaptive resilience-seeking solutions involving effective public engagement and active learning to achieve more flexibility, adaptability and sustainability in flood risk management.(8)
Thus, adaptation for flood risk resilience is a “path-dependent trajectory of change”(9), based on positive and negative feedback, and frames modern flood risk management such that “the decisions of the past influence the adaptation options that are available in the present, and the decisions in the present have implications for the flexibility of which adaptation options can be implemented in the future.”( 10 ) This framework goes beyond traditional infrastructure-focused flood management to include participatory processes and existing local knowledge in educating on future adaptations for flood risk management for resilience in Warri, Nigeria.
III. Data Collection and Analysis
The map data on land use change in Warri between 1986 and 2002 were extracted from archival street maps of 1986 and 2002 produced from aerial photographs by Shell Petroleum Company. This involved the overlay of the 1986 on the 2002 map after geo-referencing. Three land use types were extracted from the overlay, namely: built-up urban areas, road networks, and natural drainage and swamplands. On the overlay map, the approximate locations of the old off-street flood retention pool sites were inserted close to their nearest street intersections on the ground and marked with triangles in Figure 1.
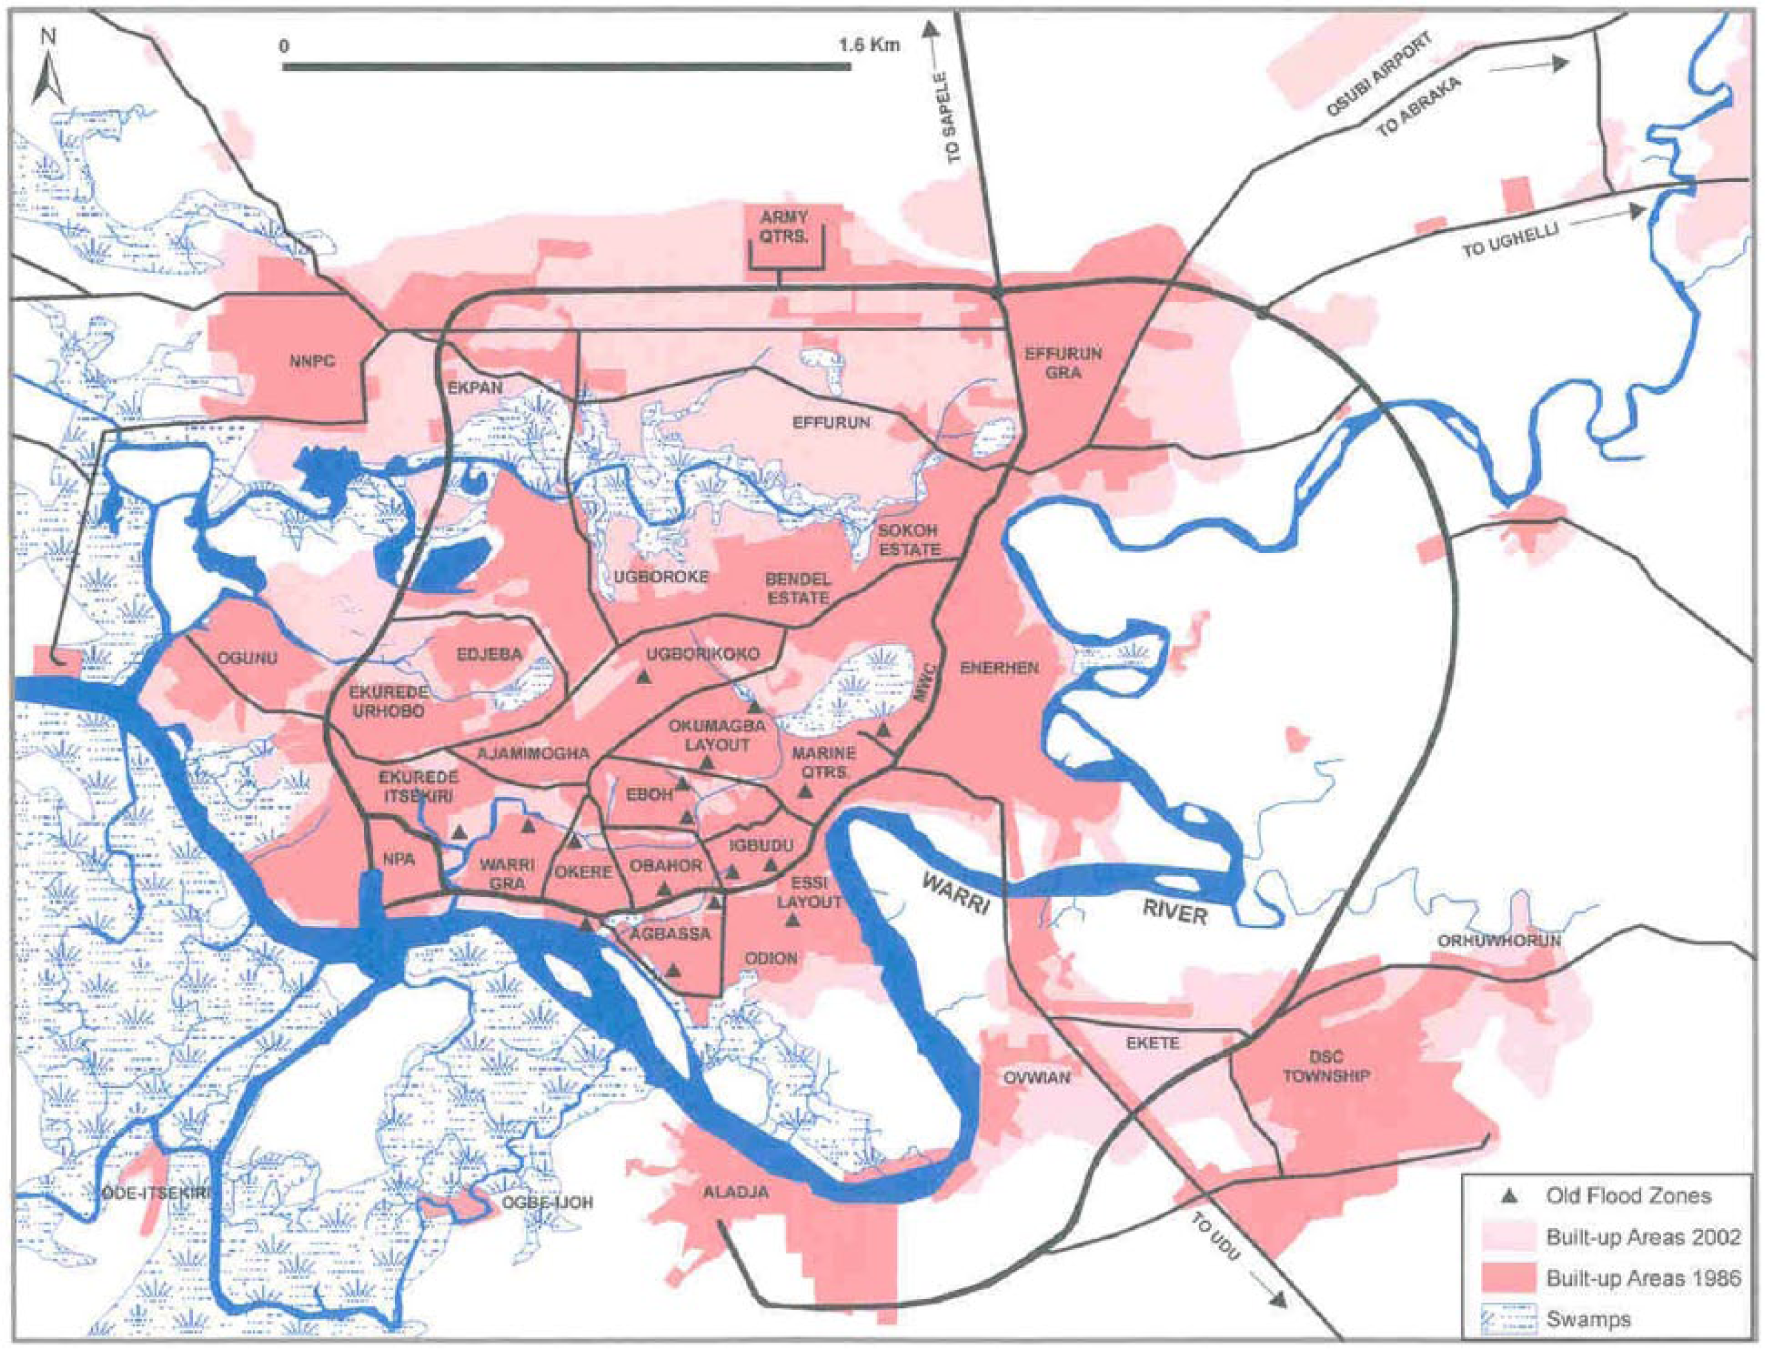
An overlay of 1986 and 2002 Warri maps showing the natural drainage system and changes in built-up areas after geo-referencing
The perceptual knowledge of flooding in Warri was obtained through a structured questionnaire survey of residents. For this purpose, the city was divided into nine research sampling units that matched the major city quarters. The survey was conducted in June and July during the rainy season when flood-prone zones are easier to identify and the flood experiences of flood zone occupants are still fresh in their minds. A weeklong reconnaissance visit to the city was conducted to identify flooding hotspots, calibrate sampling design and establish the number of questionnaires to be administered in each of the nine sampling units. The number of residents interviewed ranged from 8 to 23 persons in proportion to each unit’s percentage share of the flooded streets identified. A total of 129 respondents were identified and interviewed with 126 questionnaires fully completed (i.e., 98 per cent completion rate).
The questionnaire collected information on respondents’ property characteristics (e.g. built-up area, total impervious area(11) (tape-measured)) and drainage facilities), dominant flood type, time of first appearance and perception of main causes of flooding. The respondents were also asked to rate the standard causes of flooding in the area as identified in the work of Ojo(12) on a scale of 1 to 10 (1 being the lowest and 10 the highest rating of importance). Secondary data on rainfall and temperature for the Warri weather station were collected from NIMET.
In order to better understand the major factors underlying the root causes of flooding by flood zone occupants, the flood rating database was subjected to a principal axis factor analytical procedure as recommended by Gould.(13) This procedure is a statistical method of grouping variables (i.e., causes of flooding) objectively based on their close relationships or correlations. A chi-squared test was employed to establish if dominant flood types varied significantly across the city at the 0.01 level.
IV. The Ecology of Urban Flooding in Warri, Nigeria
Warri was built on low-lying flood-prone mangrove swamp terrain with a maximum elevation of less than 10 metres above sea level. It previously served as farmlands of the Agbara-Ame people, fishing grounds and a market of the riverside village of Ogbe-Ijaw.(14) Though dry land for urban development was very limited, it was chosen as the British colonial administrative headquarters for the Western Niger Delta. Access to the Atlantic coast and its huge hinterland population, which was important for British mercantile trade, informed the choice. As the Kingdom of Benin was defeated by the British in 1897, its mercantile trade along the Benin River was closed and the local mercantile traders immediately relocated to the new town of Warri and boosted its population.(15)
Within a decade of the founding of Warri, its premium dry lands had been compulsorily appropriated by the British colonial administration to build the new Warri Township for its subjects,(16) thereby making dry land a highly contested commodity in the city.(17) Meanwhile, the nearby pre-urban farm villages of Agbassa, Ogbe-Ijaw, Igbudu and Okere became home to the local Nigerians and migrant traders attracted to the new city. Hence, its dual city structure consists of a modern sector called the Warri Township or Government Reservation Area and an indigenous sector. While Warri Township was better drained by roadside open gutters, the indigenous sector was served by natural gravity flow to drain storm runoff to natural drainage sinks. However, the segmentation of natural swamps by city road networks has led to the formation of permanent off-street storm water detention pools in places like Agbassa, Igbudu, Sam Warri, Odion, Mciver, Okere-Ajamogha and Ginuwa (Figure 1).
Warri grew from fewer than 50,000 inhabitants in 1960 to over 300,000 by 2006.(18) The flood-prone swamplands are the only available land for urban expansion and became attractive and subsequently zoned for residential development by the land-owning families in conjunction with the Planning Division of the state’s Ministry of Lands and Survey. Hence, residential layouts, like Okumagba, Essi and Agaga Layouts, were subdivided into building plots for leasing to individuals who built single owner-occupier houses or multi-family rental properties on the sand-filled (reclaimed) swamplands (Figure 1). This led to the growth of the built-up area by 66.7 per cent between 1986 and 2002, with over 50 per cent occurring on flood-prone lands (Figure 1). Such uncontrolled “green field” development on flood-prone lands increased the exposure of its urban population to higher flooding risks and vulnerability.(19)
Simultaneously, the city’s flood risks are also further threatened as its temperature and precipitation data show an upward trajectory (Table 1). For example, the 1973–1992 and 1993–2012 data show that the difference in the mean annual rainfall between the two periods 1973–1992 and 1993–2012 is 150.4 millimetres, or 7.52 millimetres/year more in the later period than in the previous one. Similarly, the mean rainfall of 17.1 millimetres/rain-day for 1993–2012 is heavier with higher potential for stimulating higher flooding risks in the city. This is happening in a region for which the NIMET and IPCC reports mentioned earlier had attributed such modest increases in rainfall to climate change.(20)
Rainfall and temperature characteristics for the Warri weather station
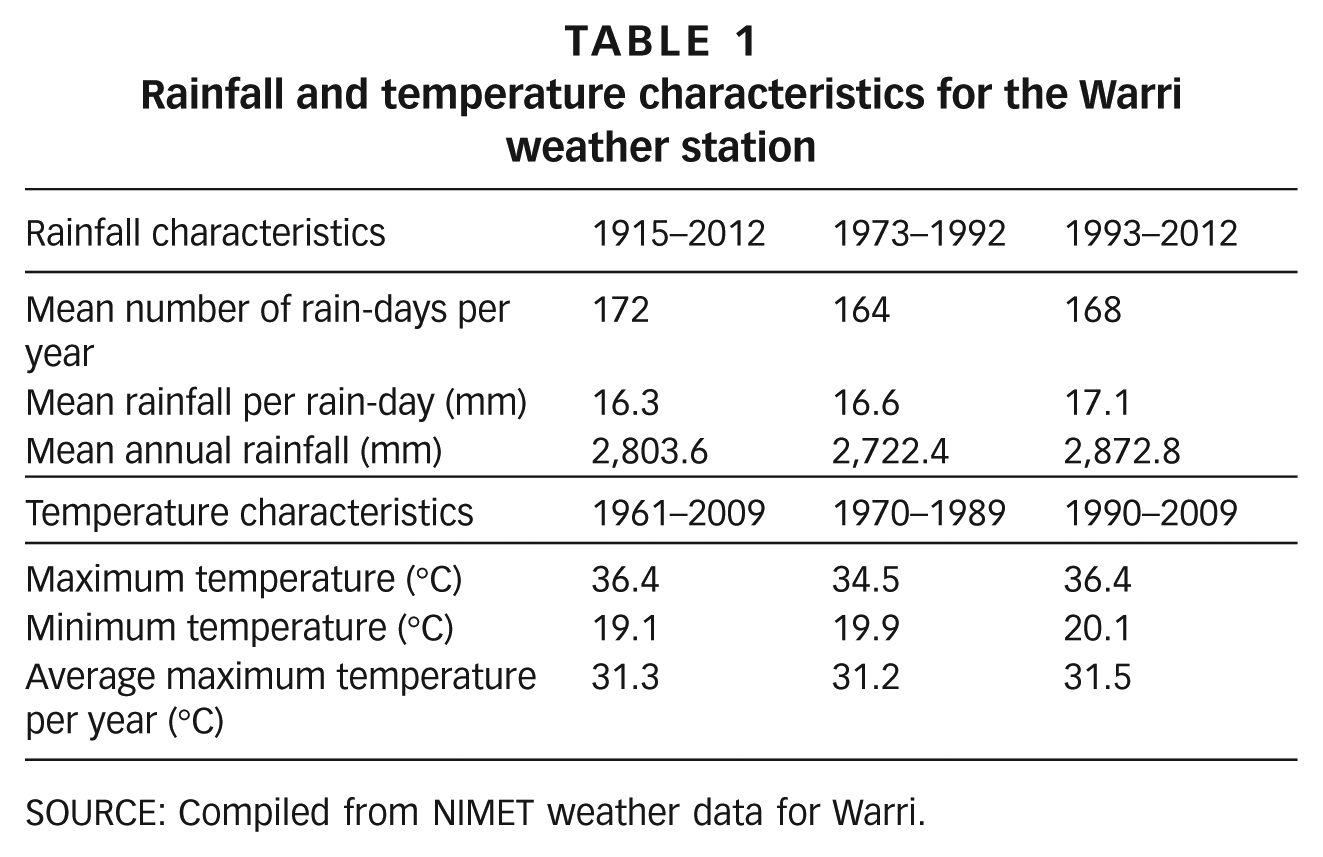
SOURCE: Compiled from NIMET weather data for Warri.
In the 1980s, when urban planning and development control weakened in the country,(21) illegal structures, indiscriminate refuse dumps and the emergence of informal settlements in flood-prone swamplands further magnified the city’s flood risks. These new uncertainties of flood risk drivers under a period of climate change and rapid urban growth greatly increased Nigeria’s flood risks, as can be seen in the 2012 Nigerian flood, which was the country’s worst flood in the last half-century.(22)
V. The Dominant Type of Flooding as Perceived by Warri Flood Zone Occupants
In Warri, flood risk and vulnerability reduction decisions are still the main responsibility of individuals at risk of flooding and have barely involved any major modern engineering works. As such, those who live with floods and the learning experiences of the at-risk flood zone communities are sure to benefit and inform the ways flood risks are assessed and managed. Warri flood zone occupants were asked to identify the dominant type of flood risk experienced in their respective neighbourhoods and when the flood type first occurred. For the purpose of data analysis and ease of interpretation, those neighbourhoods reporting a first-time flooding occurrence less than 10 years prior were grouped as Zone One, those between 10 and 30 years prior as Zone Two and those more than 30 years prior as Zone Three.
Overall, a citywide aggregation of the data shows that 68.3 per cent of the respondents recognized floodwater retention pools on city streets as the most dominant type of flooding. Off-street floodwater retention pools that once dominated the city’s flood landscape were identified by only 31.7 per cent of the respondents as still important in their respective neighbourhoods. Where the first flooding occurrence was perceived to be more recent or less than 10 years ago, 76.5 per cent of the respondents identified on-street flood retention pools as dominant, with only 23.5 per cent reporting off-street flood retention pools as important as well (Table 2). In contrast, in the older part of town, where the time flooding was first reported was more than 30 years ago (i.e., a long time ago), as much as 63.0 per cent of residents identified off-street flood retention pools as dominant, with only 37.0 per cent reporting that on-street flood retention pools have become important in more recent years as well (Table 2).
Dominant flood type identified in Zones One–Three at the time flooding was first observed
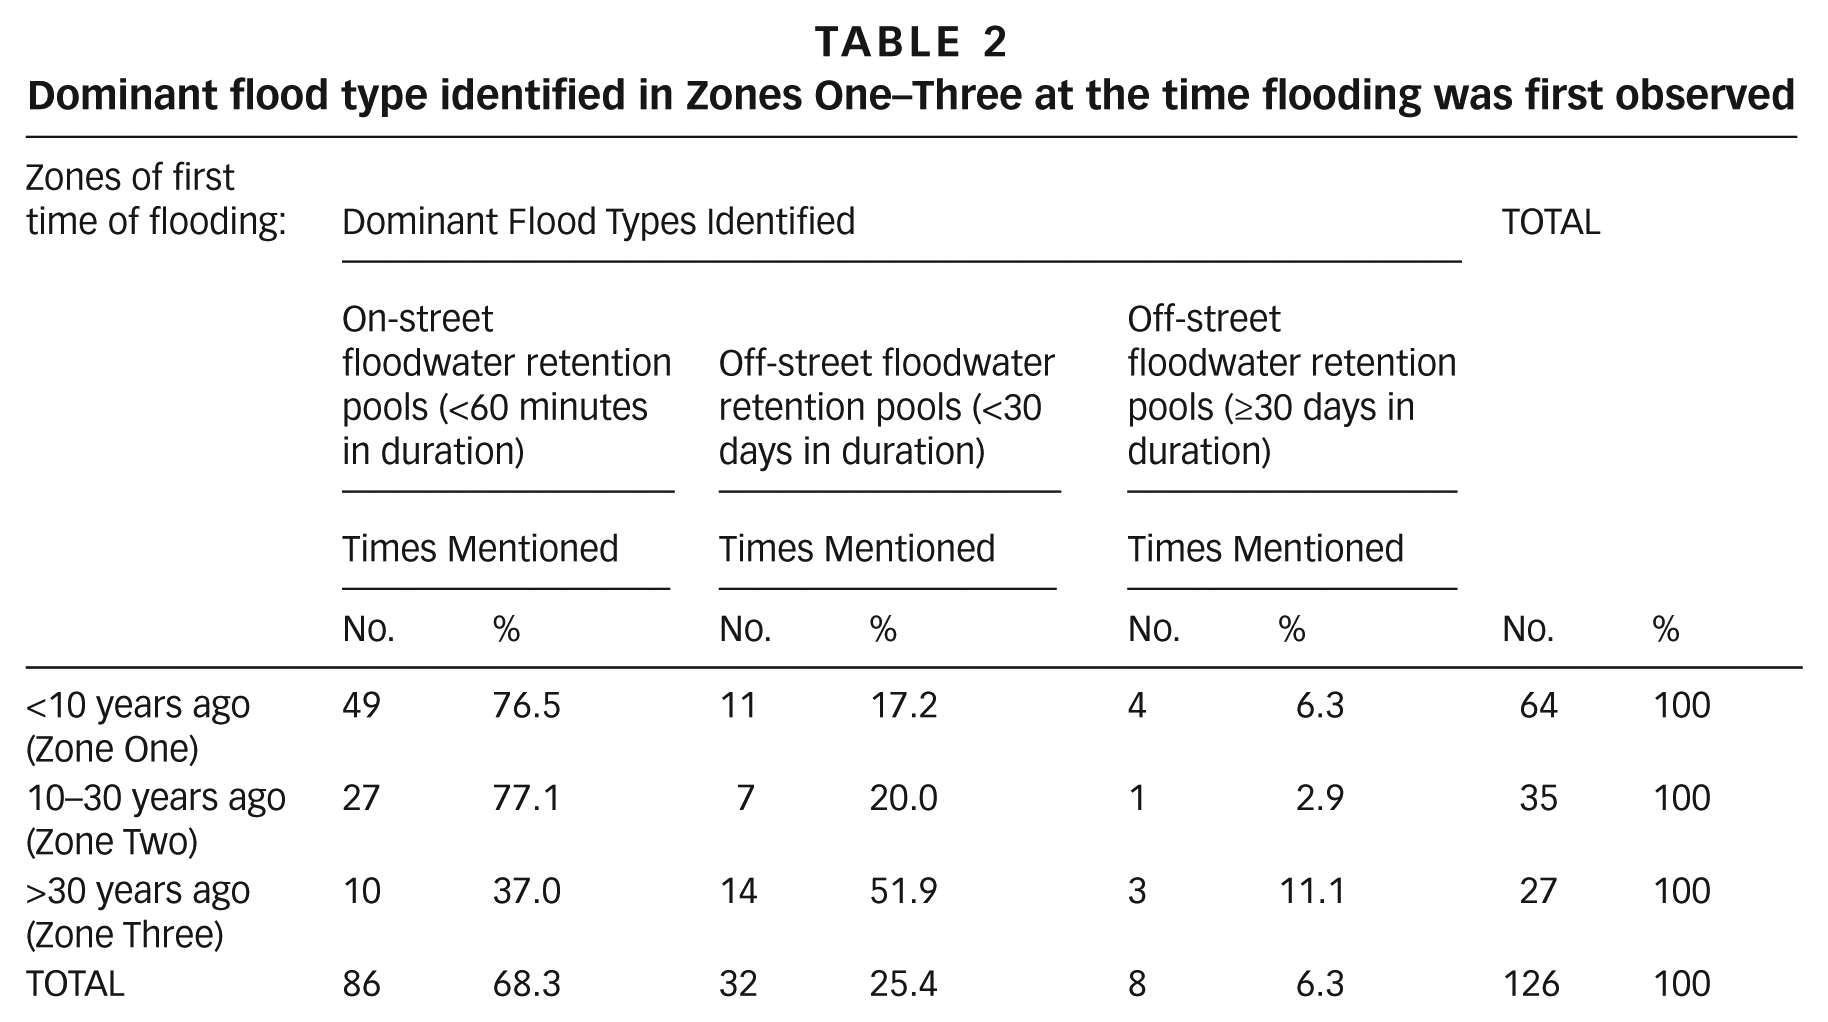
A chi-squared test using the data in Table 2 confirms that the dominant flood types across the city varied significantly at the 0.01 level according to the perceived time of the first flood type reported in their neighbourhoods. In other words, the dominant flood risk type perceived is related in some way to the time of the first flood occurrence (or the age of the flood zone) in city neighbourhoods. Thus, in these days when the city of Warri is witnessing uncontrolled rapid urban development and expansion into new “green fields” within swamplands along with a modest heightening of precipitation,(23) due to global warming trends in the wet tropics,(24) community-based urban flood risk assessment shows that the once dominant flood risk type (i.e., off-street flood retention pools) common in the older part of the city is gradually giving way to on-street floodwater retention pools, especially in the newer parts of town.
Such a tendency is anticipated in a number of hydrological studies and flood risk assessments where storm runoff type is often associated with land use and/or land cover changes as natural watersheds pass through different phases of urban development.(25) Table 3 summarizes and clarifies such relationships in order to better understand how off-street floodwater retention pools that once dominated Warri’s urban flood landscape during the early phase of its urban development shifted to increasing floodwater retention pools on city streets in the more recent years of the urban expansion and renewal phase. This is the phase when land reclamation by sand filling of marginal mangrove swamplands within and beyond the city limits is seen as the only option for urban expansion. These insights by the local flood zone occupants showing this trend towards the replacement of off-street floodwater retention with on-street floodwater retention pools, based on the use of only non-conventional methods of flood risk assessments, is indicative of the high quality of their stock of indigenous knowledge. It also reflects the long history of flood learning experiences that must have enhanced their ability to survive these many years of living in flood-prone neighbourhoods. These can no longer be ignored in framing appropriate adaptation strategies, especially where rapid urban expansion into flood-prone swamplands has exposed the residents to the impacts of climate change flood risks.
Potential impacts of urban development phases on urban flood risks in Warri
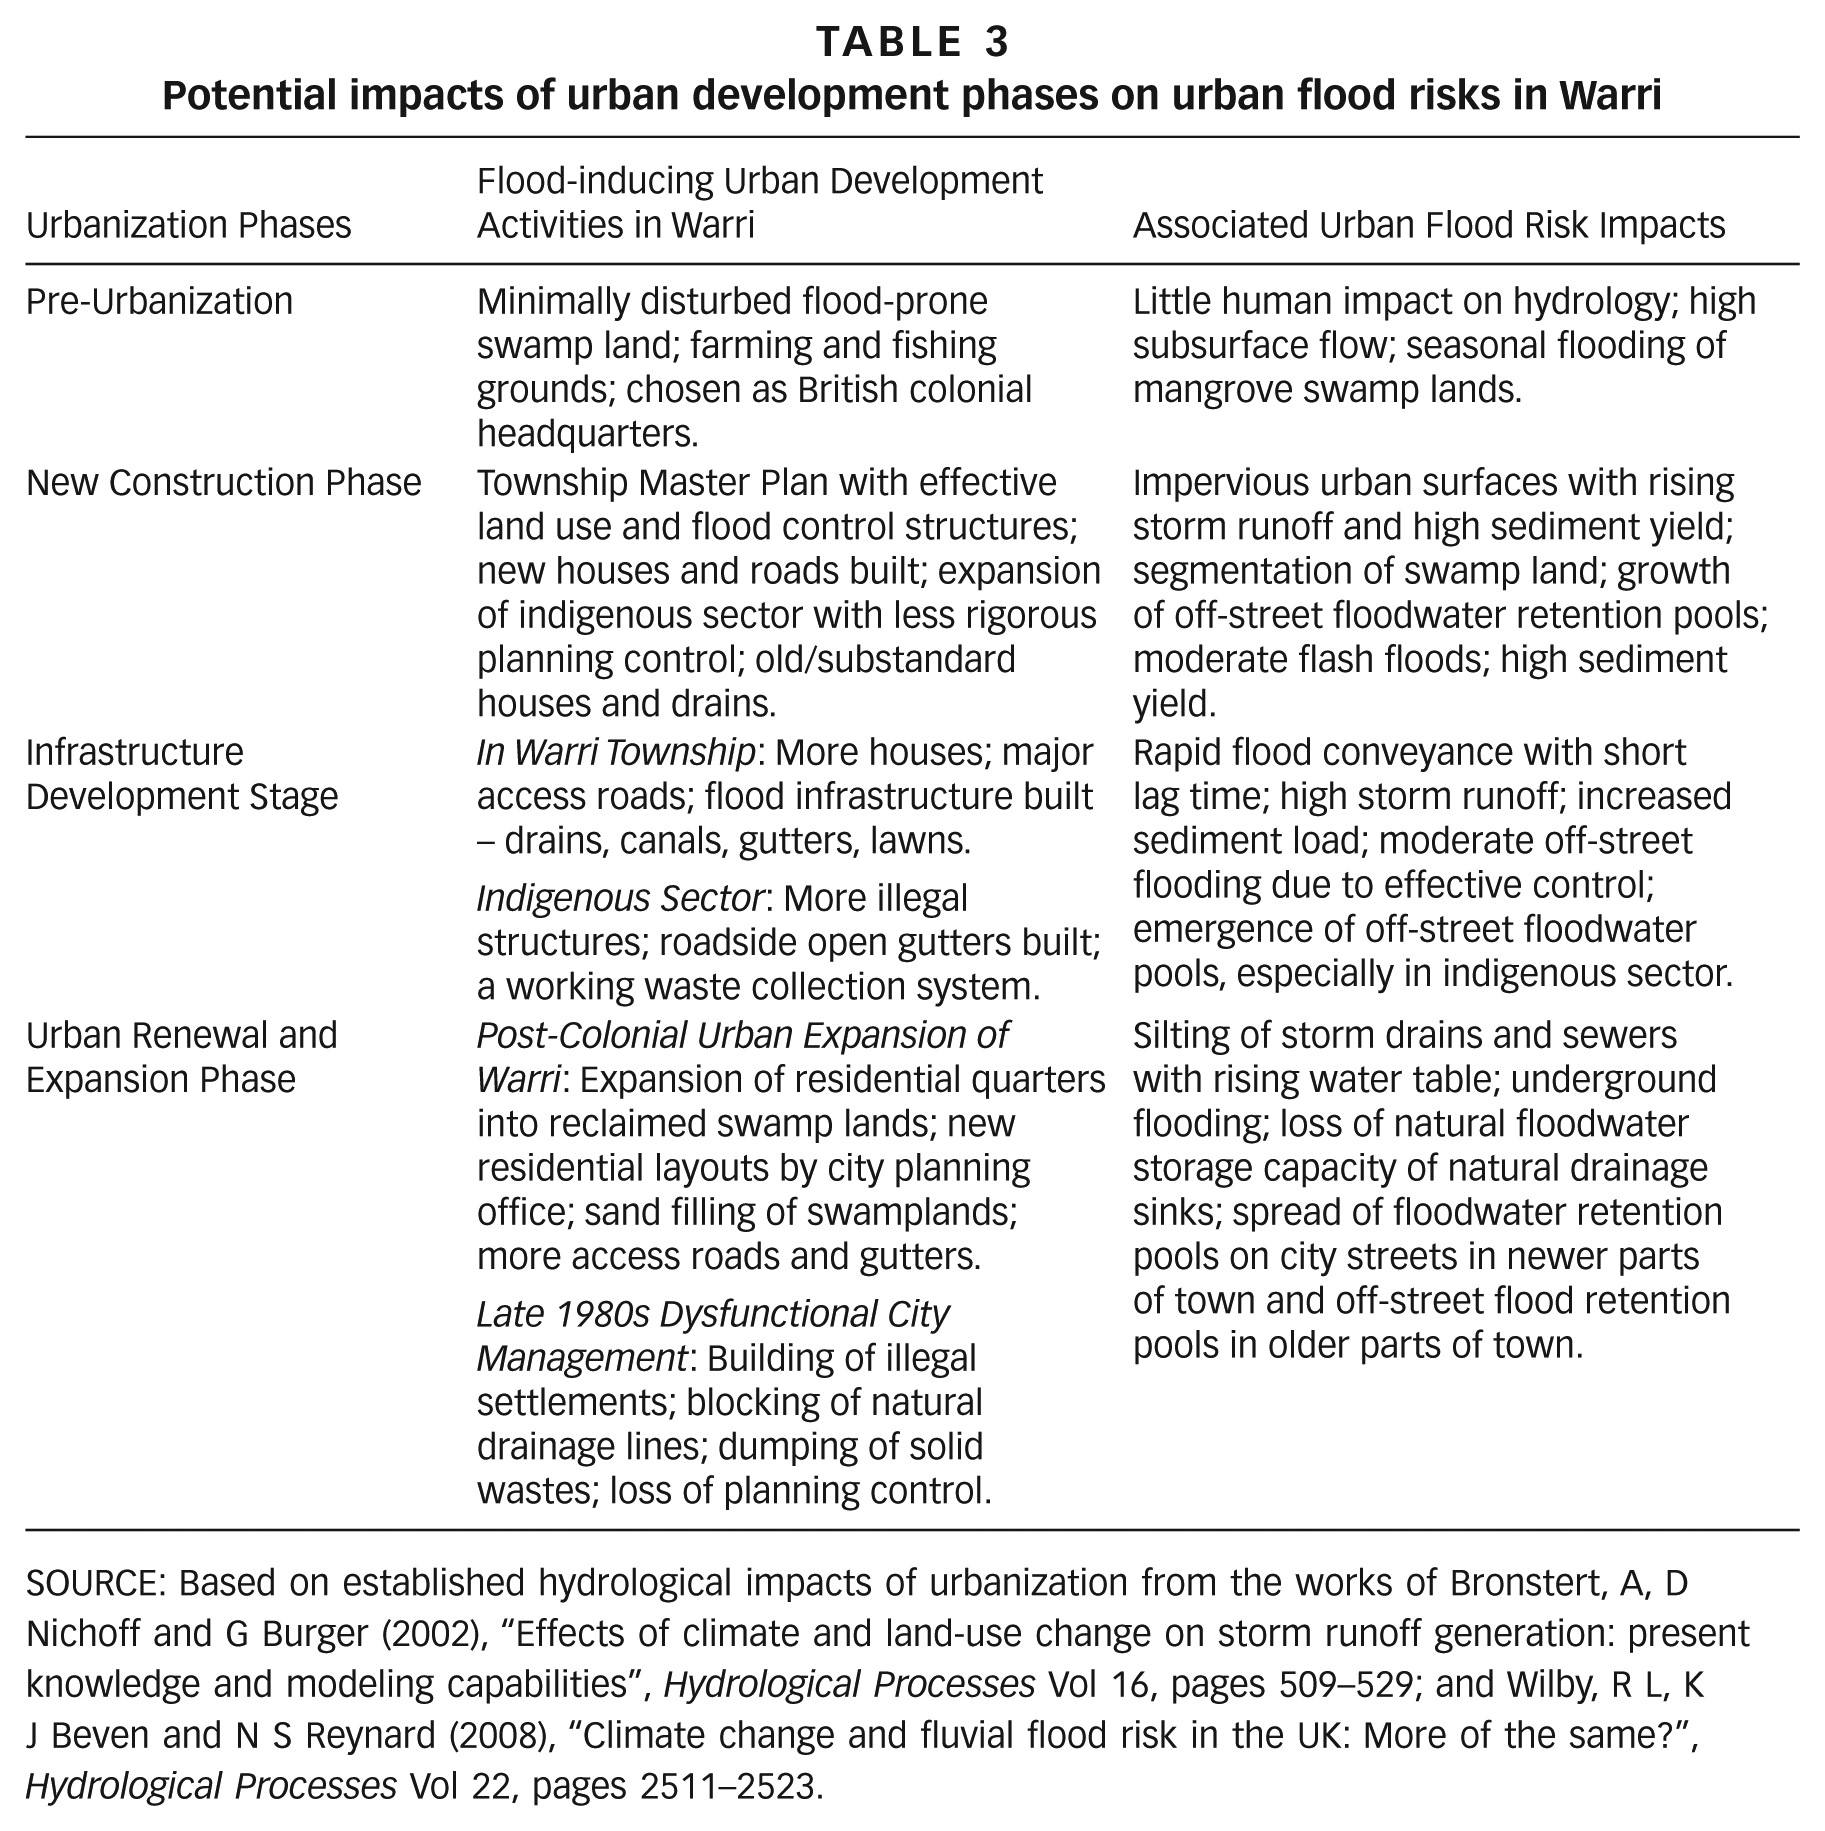
SOURCE: Based on established hydrological impacts of urbanization from the works of Bronstert, A, D Nichoff and G Burger (2002), “Effects of climate and land-use change on storm runoff generation: present knowledge and modeling capabilities”, Hydrological Processes Vol 16, pages 509–529; and Wilby, R L, K J Beven and N S Reynard (2008), “Climate change and fluvial flood risk in the UK: More of the same?”, Hydrological Processes Vol 22, pages 2511–2523.
VI. The Causes of Changing Flood Risk Types and Vulnerability in Warri, Nigeria
This section seeks to understand the main causes of the changing dominance of off-street flood retention pools to on-street floodwater retention pools and reveal the underlying causal factors (dimensions) at the root of how Warri residents perceive the growing threat. How the lessons learned may have benefited their adaptation practices are also presented. To achieve this goal, respondents were asked to list the three most important causes of flooding in the city. The top ten causes that emerged, in rank order, are:
lack of land use planning;
lack of drainage facilities;
blockage of natural drainage;
blockage of drainage facilities;
building on flood plains;
low-lying terrain/swamps;
high surface storm runoff;
inadequate drainage facilities;
reclamation of swamplands; and
poor drainage design without integration.
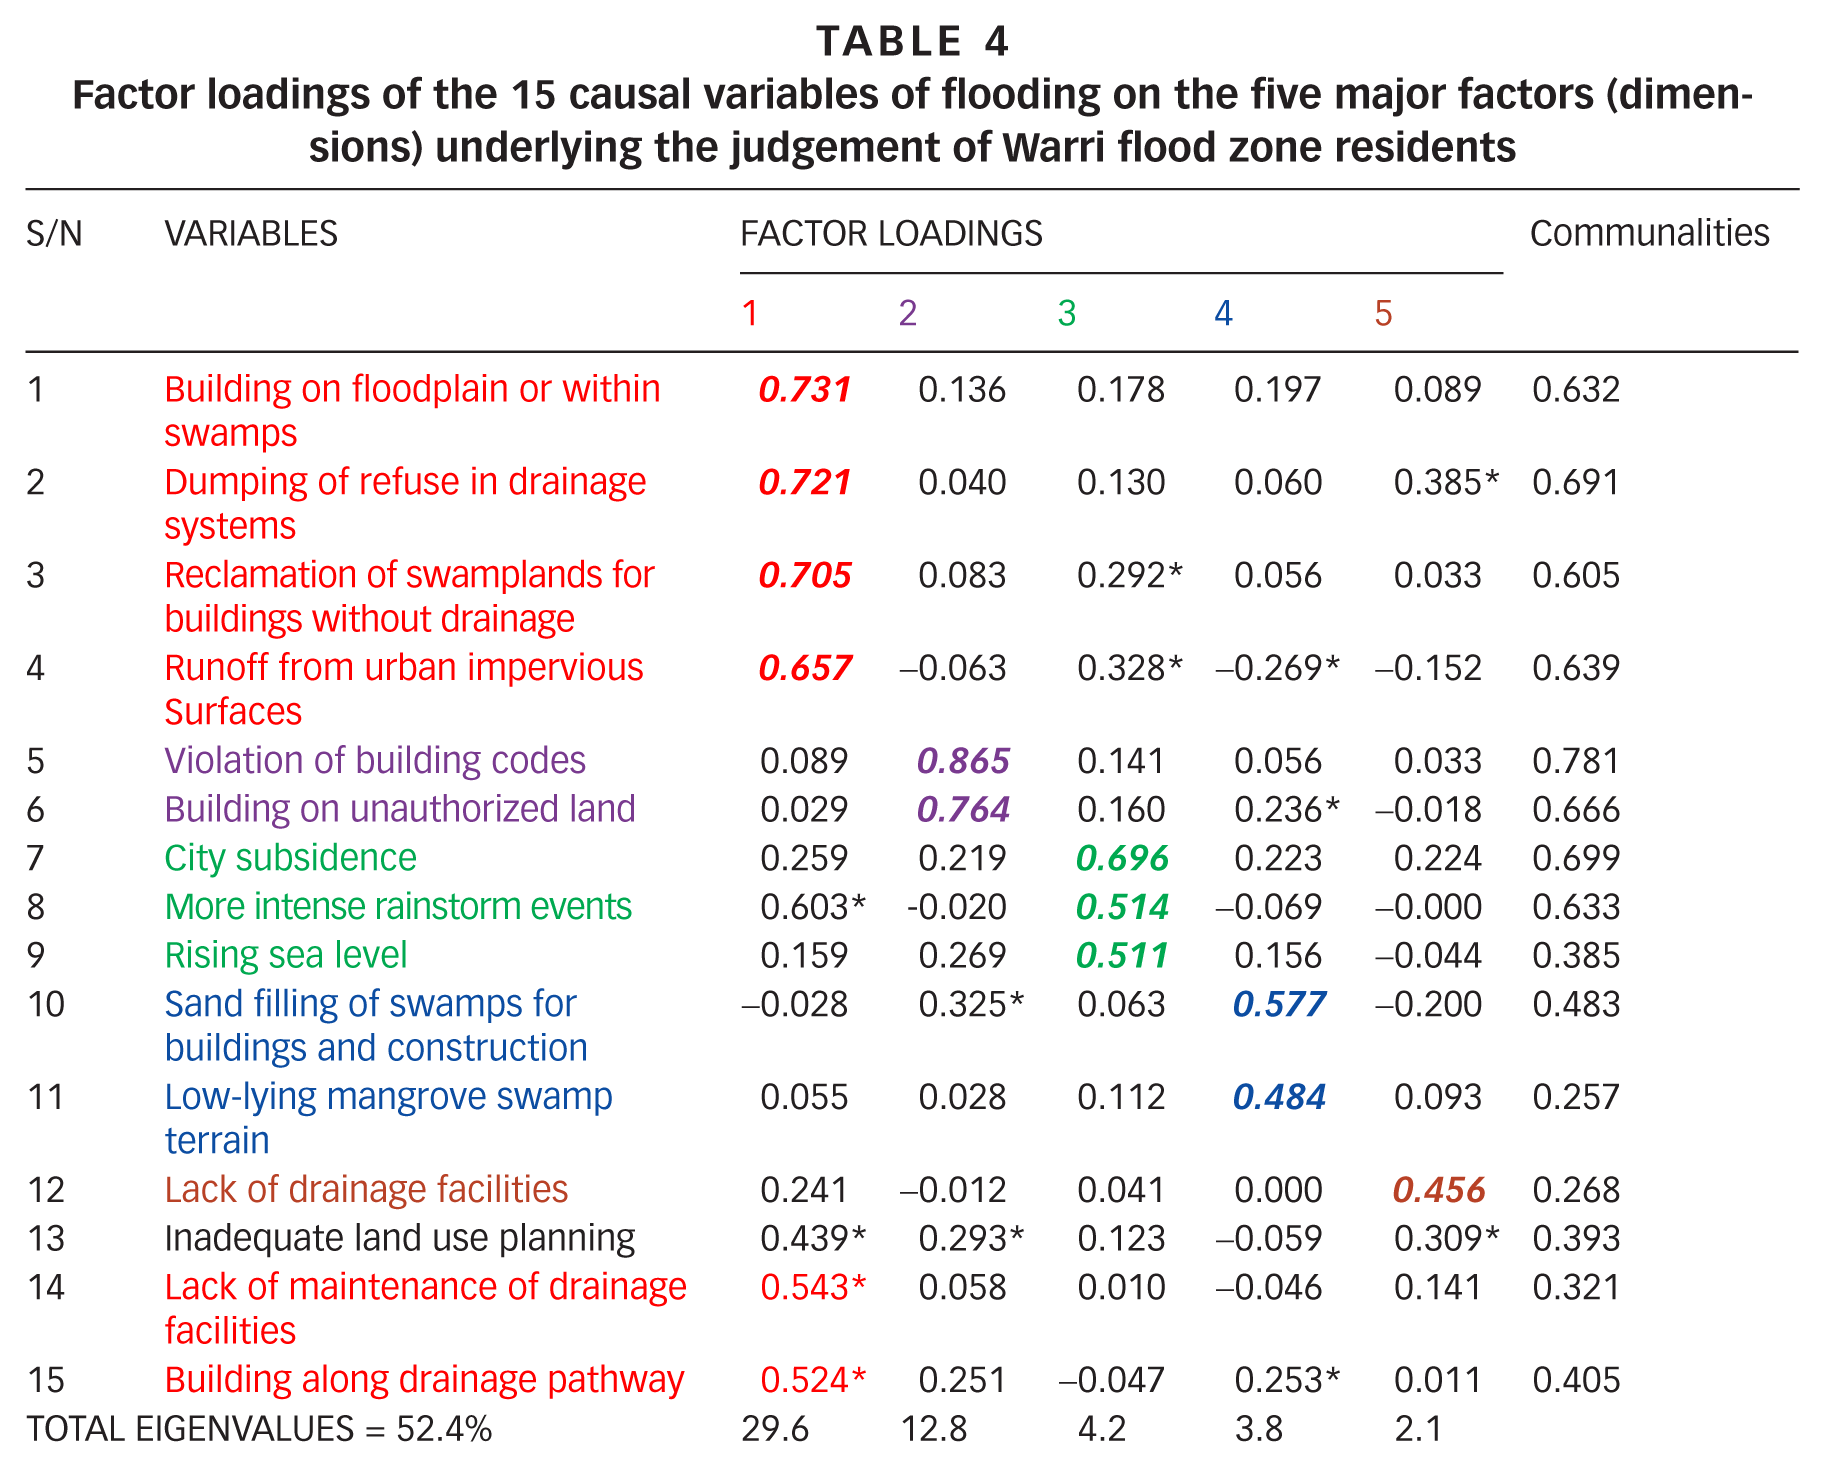
But most of the root causes of flooding are closely interrelated and needed further processing to uncover the underlying factors driving Warri flooding that can be drawn on for more effective management. To achieve this goal, the root causes of flooding listed were rated on a scale of 1 to 10 and the resultant causal dataset was subjected to a varimax rotated principal axis factor analytical procedure.(26) The result of the analysis is displayed in Table 4 and revealed that the original 15 perceived causes of flooding could be segregated into five major dimensions or factors that underlie the way urban flood zone residents structure their reasoning about the genesis of flood types in their local neighbourhoods. The five underlying factors jointly explained a total of 52.4 per cent of the variance in the causal dataset.
Factor loadings of the 15 causal variables of flooding on the five major factors (dimensions) underlying the judgement of Warri flood zone residents
The five underlying causal factors are labelled as follows:
Factor 1: reduction in floodwater storage capacity of swamplands;
Factor 2: violation of building codes;Factor 3: perceived changes in local water levels;
Factor 4: low-lying mangrove swamp terrain; and
Factor 5: lack of drainage facilities (Table 4).
The labelling and interpretation of each of the five underlying factors (dimensions) are based on the factor loadings achieved by each of the 15 causal variables on each of the five dimensions. The variables loading highly on each dimension (i.e. the bold and italicized loadings > 0.45) provided the clues for the labels. However, some variables with factor loadings higher than 0.45 but not bold or lower than 0.45 (i.e. variables with asterisked loadings) helped in further clarifying and reinforcing the accuracy of their labels and interpretations (Table 4).(27)
Factor 1 – reduction in floodwater storage capacity of swamplands – is perceived as the most important of the five underlying dimensions and accounts for 29.6 per cent of the total variance in the dataset. It adequately captures all those variables or urban practices, like building on floodplains or within swamplands, dumping of refuse in drainage rights of way, and reclamation by sand filling of swamplands, which contribute to reducing their floodwater storage capacity. This finding is consistent with that of Silveira,(28) who observed that the loss of storm water storage capacity of swamplands due to construction works and solid waste dumping are among the problems of modern urban drainage management in low- and middle-income countries. A total of five additional variables with lower loadings (i.e. asterisked factor loadings) on this dimension are urban practices the respondents see as additional catalysts for the growing threats of floodwater retention pools on city streets in more recent years (Table 4). The extent to which this causal understanding informs how communities formulate their choices of adaptation to disaster risk reduction are explored in Section VIIa of this study.
For Factor 2 – violation of building codes – the two variables loading very highly are: violation of building codes and building on unauthorized lands. These account for 12.8 per cent of the total variance in the causal dataset. Violation of building codes and the building of informal settlements on land not yet approved for urban development are commonplace, especially on swamplands where accessibility problems inhibit effective monitoring. Omuta(29) made a similar observation when he documented a widespread violation of building codes in Benin City. Furthermore, the Town Planners Registration Council (TOPREC) and Nigerian Institute of Town Planners (NITP) attribute the disorderliness of Nigerian cities and the chaotic physical planning of urban areas to the inability of federal, state and local governments to muster the political will to adhere strictly to regulations guiding town planning and urban development.(30)
For Factor 3 – changes in local water levels – two variables (more intense rainstorm events and rising sea level) have recorded high loadings and been labelled changes in local water levels. Warri’s already high average annual rainfall of 2,803.6 millimetres is commonly perceived by residents as making for a rainy city. They believe that the city is currently experiencing more intense rainstorm events and this is supported by the NIMET data showing an annual rainfall increase of 2–8 millimetres between 1941 and 2000 in the mangrove belt of southern Nigeria, where Warri is located.(31) This increasing trend of wetness in the city is further supported by fieldwork observations showing that some neighbourhoods in Marine Quarters, Okumagba Layout, Alderstown, the former Midwest College and Iyara that were known to be virtually dry lands in the 1970s are currently waterlogged. Further south of the city, the sea level is reported to have risen by up to 0.3 metres in the last 50 years(32) and is projected to rise from 1990 levels by up to another 0.3 metres by 2020 and up to 1.0 metres by 2050.(33) These observations lend further credence to the general feeling of a changing water level in the city.
For Factor 4 – low-lying mangrove swamp terrain – there is a recognition of the need to sand fill low-lying terrains subject to waterlogging prior to any form of urban development. This accounts for 3.8 per cent of the variance of the causal dataset. But when building on reclaimed land is unaccompanied by the provision of flood drainage infrastructure and waste disposal services, especially in the squatter settlements of the city, the problems of on-street floodwater retention pools are often reinforced. This is the case because sand filling activities tend to reduce floodwater storage capacity of natural drainage sinks in their low-lying terrain.
Factor 5 – lack of drainage facilities: Land without appropriate land use planning and drainage facilities is recognized in Factor 5 as a good reason for the emergence of on-street flood retention pools in a city once dominated by off-street floodwater retention pools. Such tendencies are indicated in places where dumping of refuse in drainage networks is uncontrolled. In this study, indiscriminate dumping of refuse in drains, which is the second defining variable of Factor 1, also loads weakly on Factor 5, thereby reinforcing its pivotal role in causing on-street floodwater retention pools in Warri. Thus, the lack of drainage facilities and the dumping of refuse in existing drainage networks combine to divert urban storm runoff to overrun city streets, as also reported in other Nigerian cities like Lagos.(34) Hence, refuse and illegal structure clearance in drainage networks has become a top priority in flood risk reduction in most Nigerian cities today.
VII. Flood Adaptation Choices in Warri and Implications for Flood Risk Resilience and National Poicy
According to the International Strategy for Disaster Reduction (ISDR), reduction in disaster risks and vulnerability could be achieved through careful analysis and management of its root causes.(35) But how much of the underlying root causes of flooding in Warri has informed the adaptation choices already implemented in reducing flood risk impacts and vulnerability or in improving community preparedness for the hazard? This is the subject of this section and it consists of three parts: local adaptation choices for living with flood impacts (including government-based and community-based choices), implications for a bottom-up adaptation strategy and implications for a national strategy.
a. Local adaptation choices for living with flood impacts in Warri
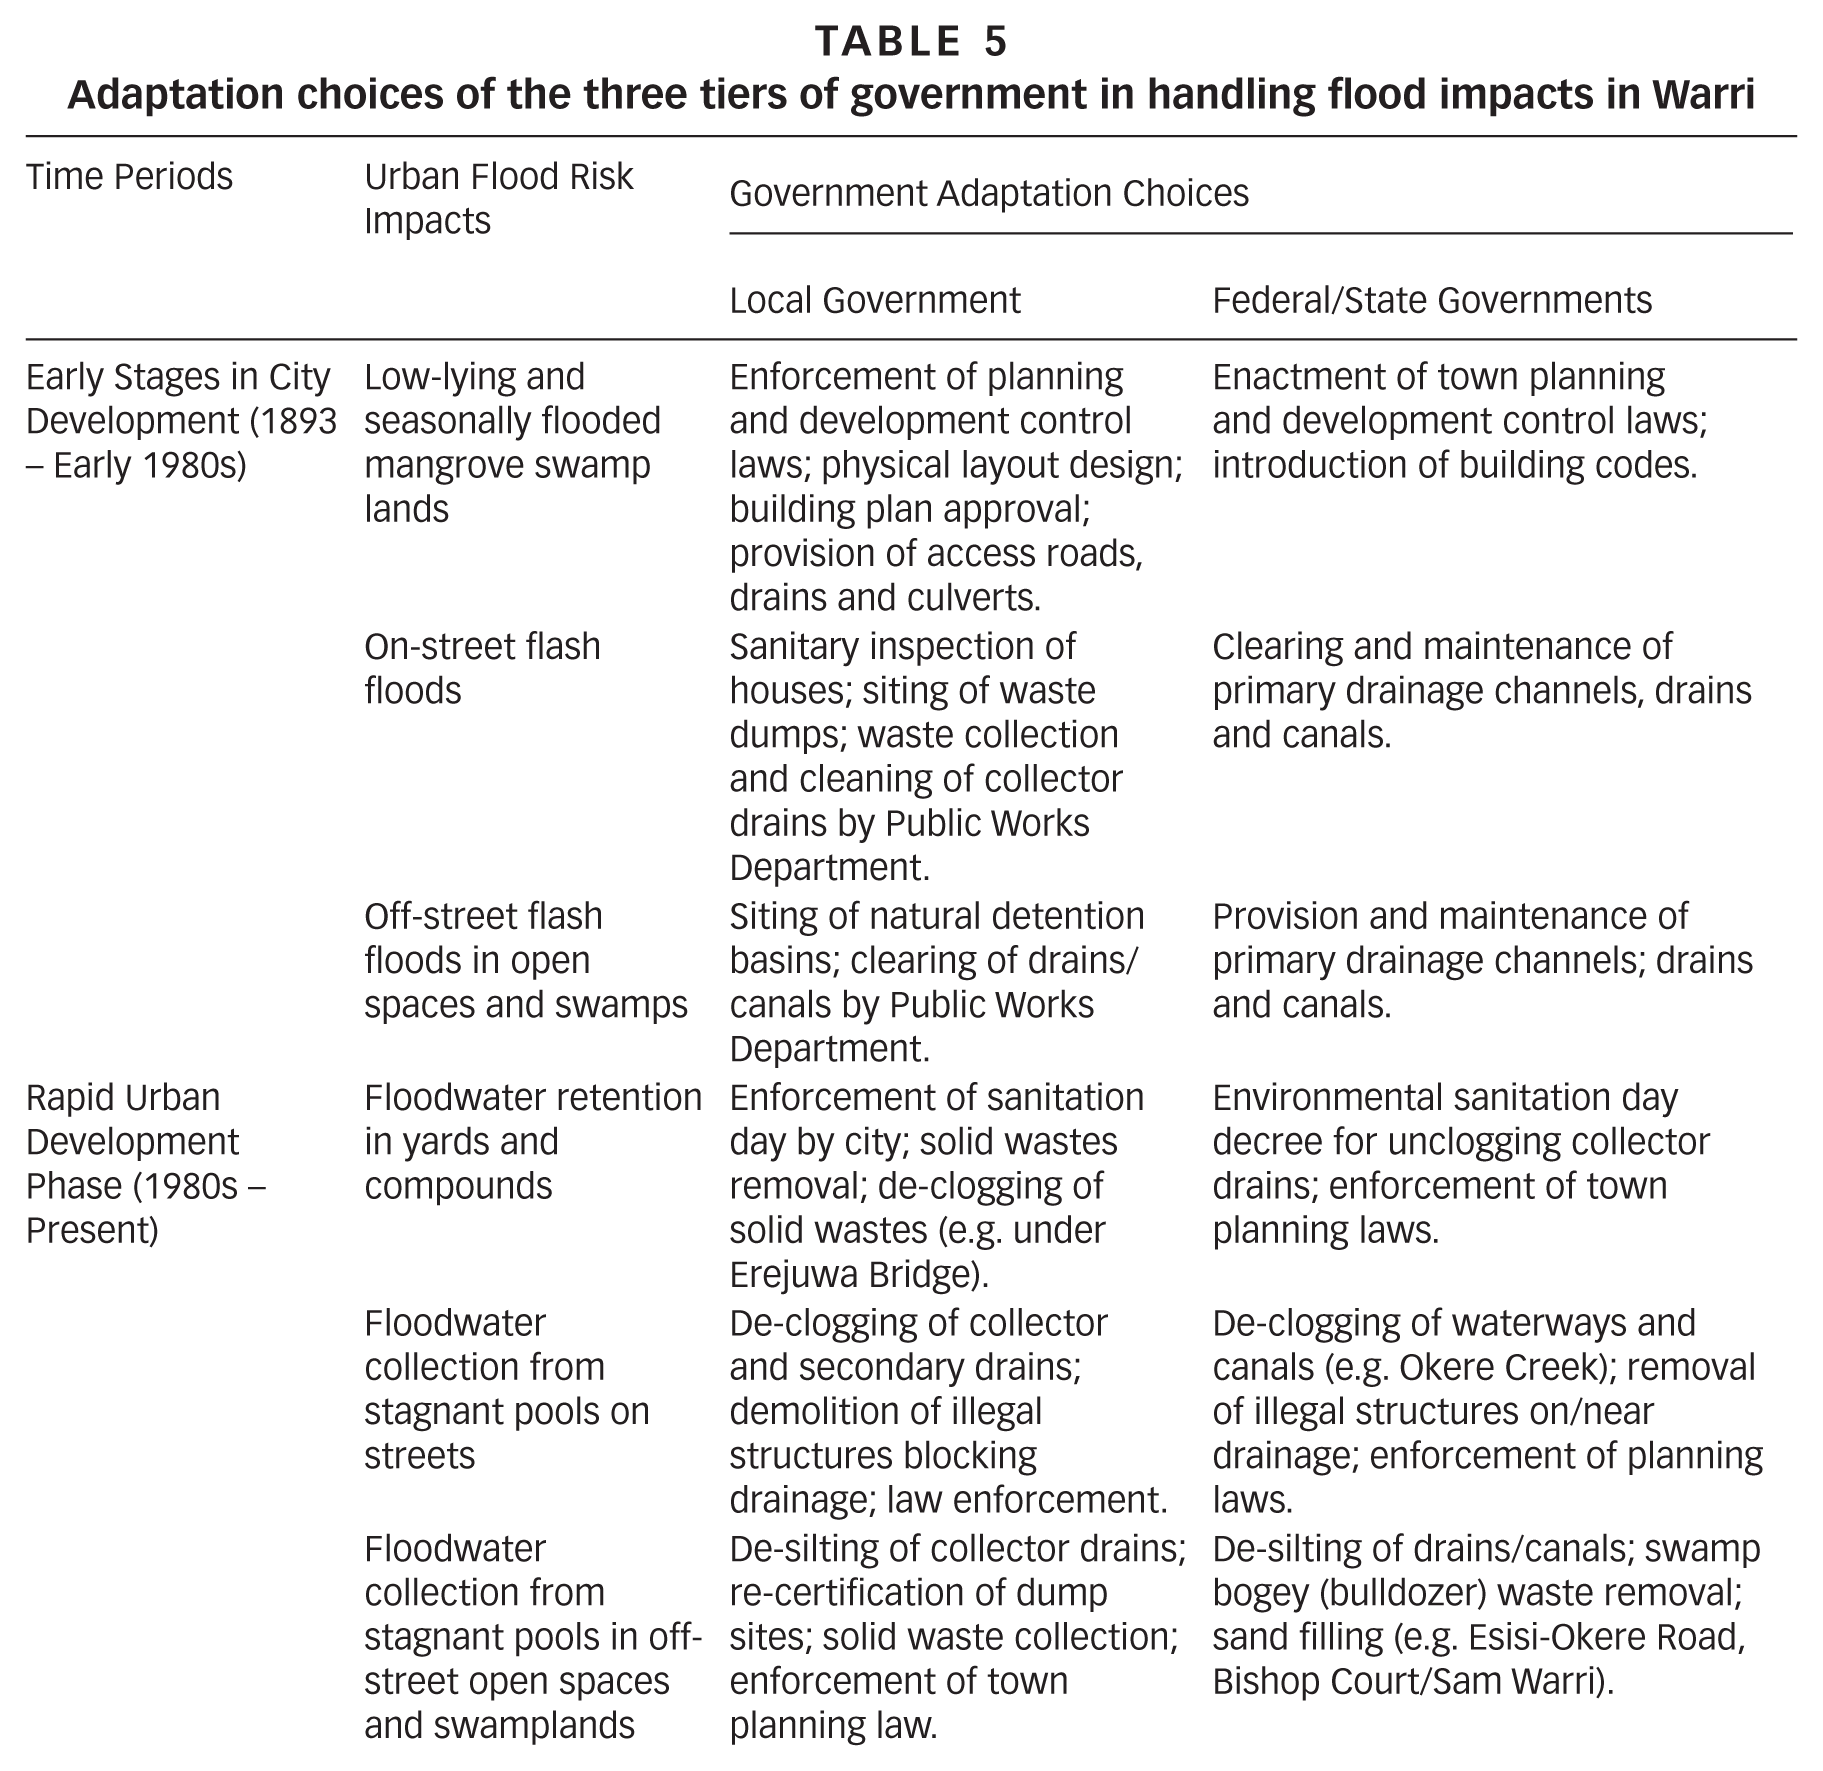
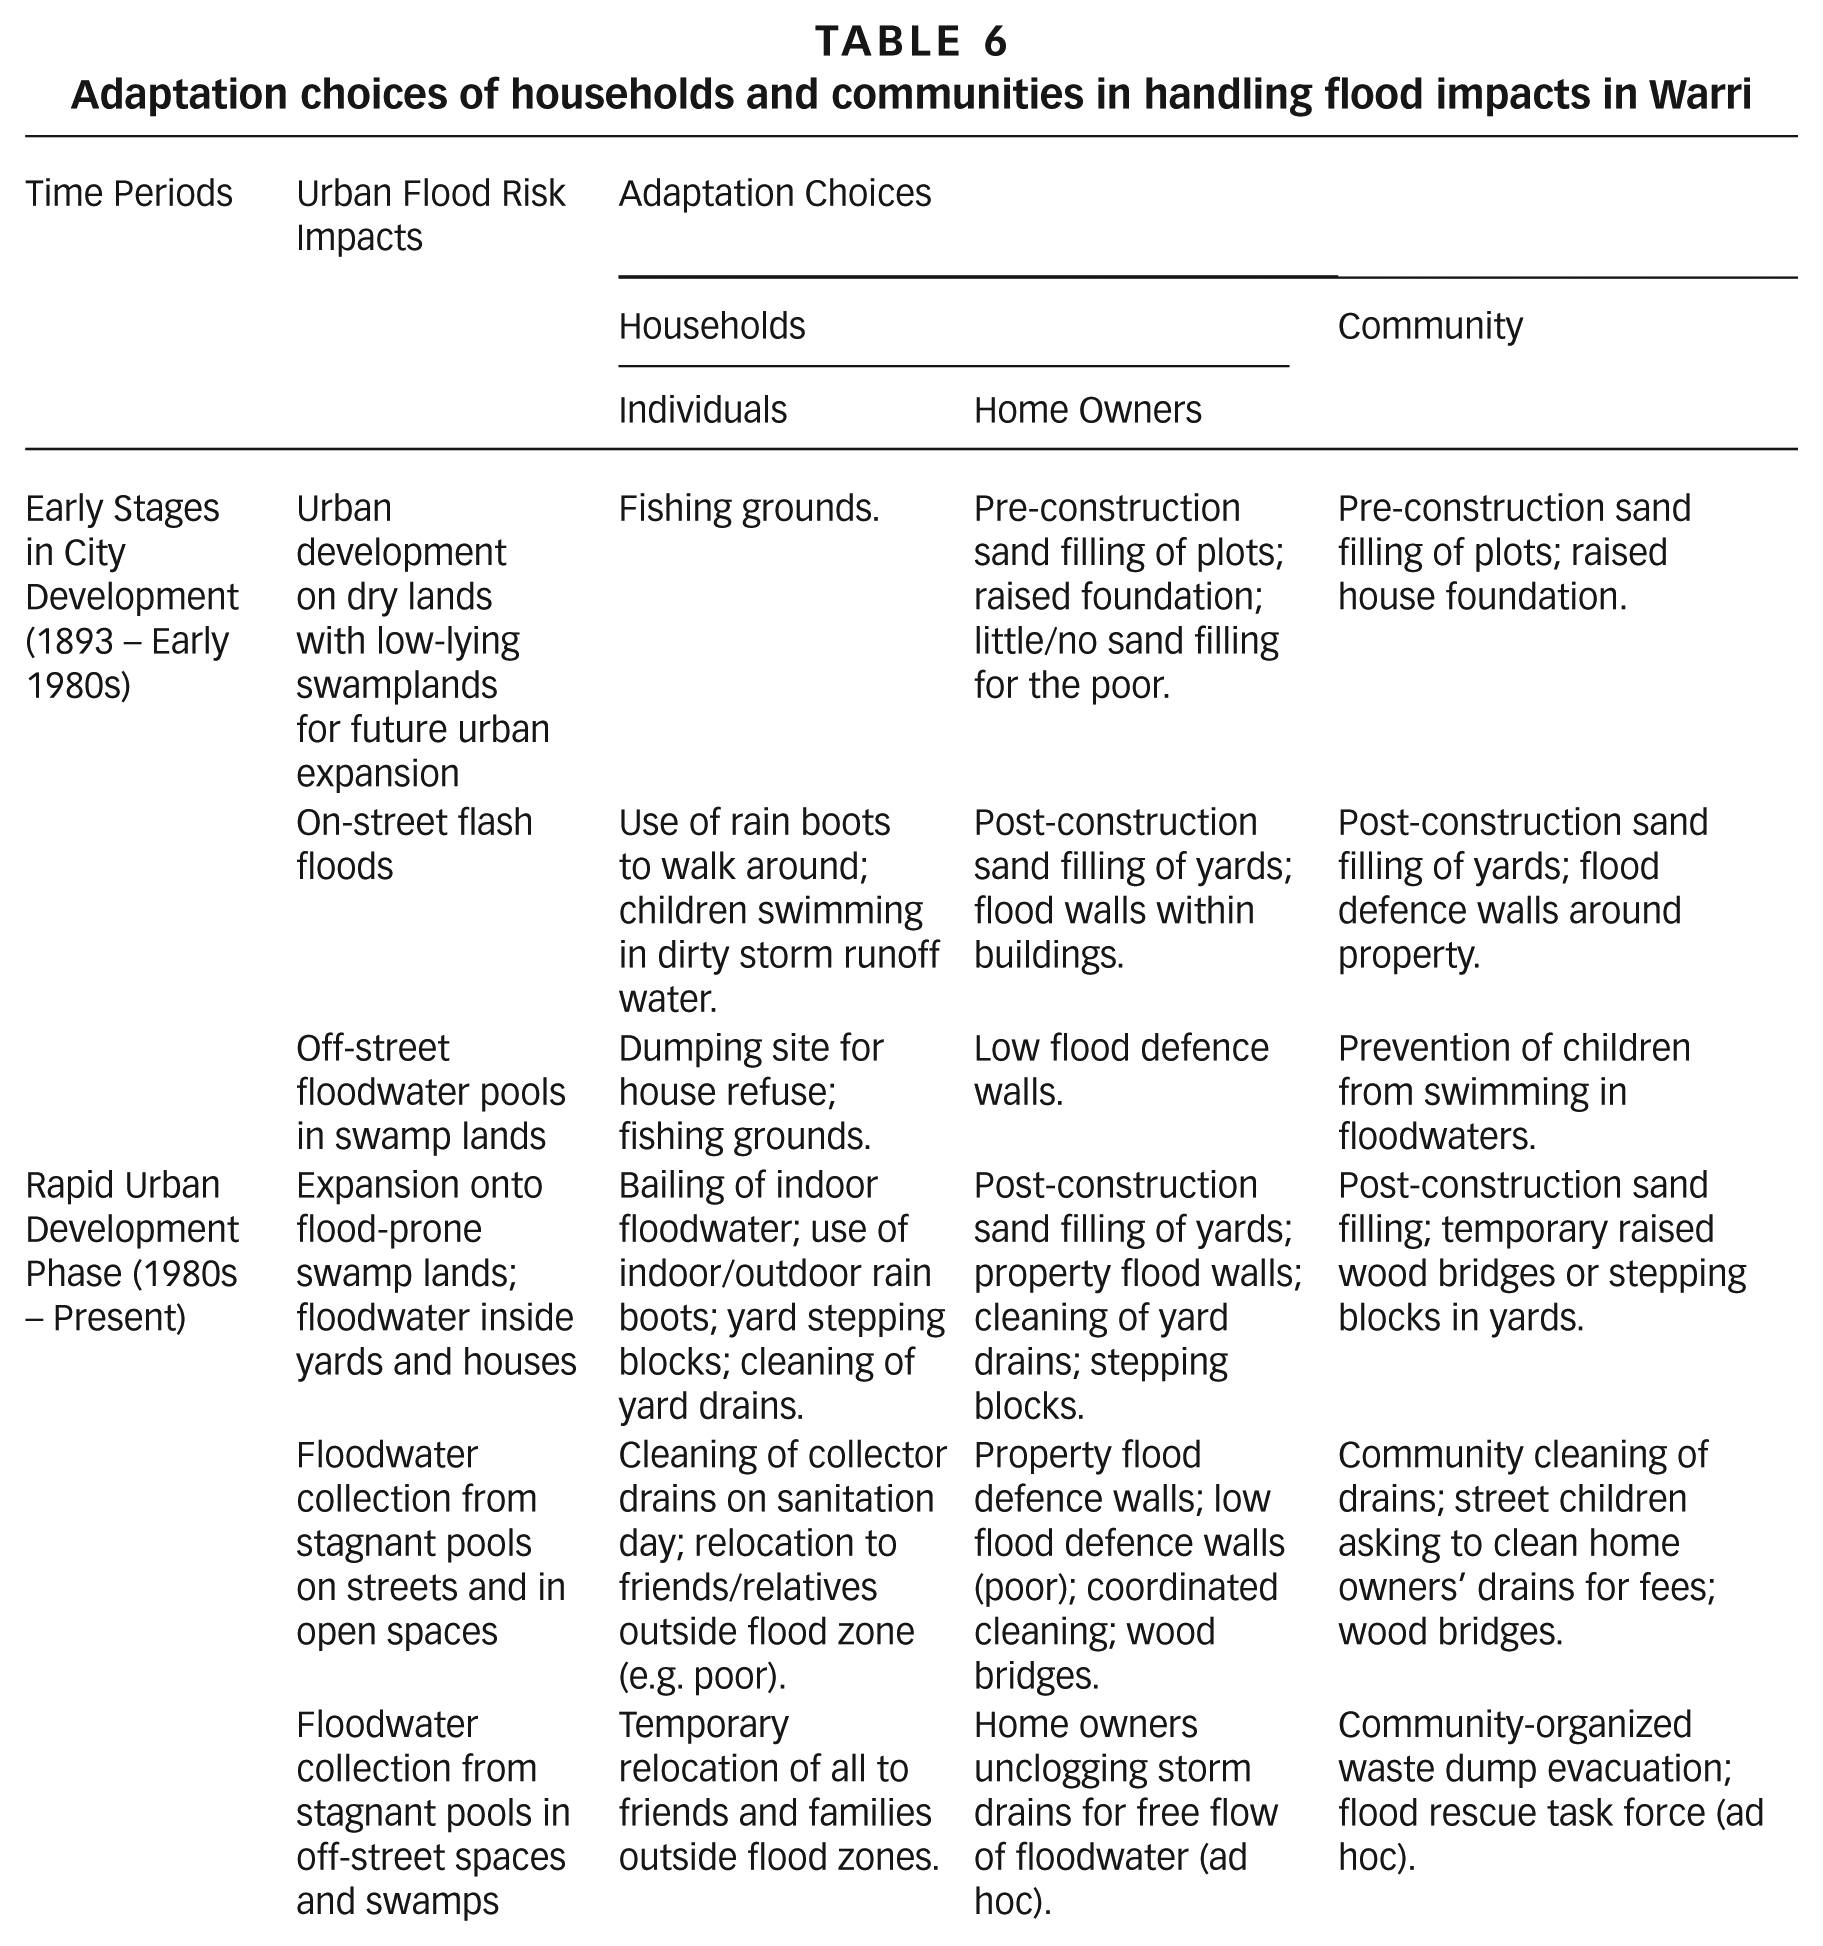
Although it has been argued that populations at risk of flooding are not the best suited or most prepared for handling such risks,(36) a complete lack of direct personal experience with flooding may constrain both understanding and motivation for taking personal or community actions prompted by such stimulus (i.e., reactive adaptation).(37) Tables 5 and 6 list some of the reactive adaptation choices already implemented in response to the re-occurring flooding stimuli by Warri flood zone occupants and the government.
Adaptation choices of the three tiers of government in handling flood impacts in Warri
Adaptation choices of households and communities in handling flood impacts in Warri
Government-based adaptation choices in Warri: The key flood adaptation choices for reducing flood risks and vulnerabilities in Warri by government are shown in Table 5. They include the formulation and enforcement of town planning and development control laws and the provision of structural flood control infrastructure. But because of the colonial policy of administrative cost minimization in Africa, the British relied heavily on the existing network of natural drainage systems, a mix of low-cost roadside gutters, drainage canals and gravity flow to drain urban storm runoff to designated natural floodwater storage sinks. In addition, the Public Works Department maintained and cleaned existing drainage networks to ensure their continued functionality, while the Public Health Department’s house-to-house inspection enforced all waste disposal laws and kept drainage networks flowing and free of refuse. The colonial flood control policies, institutions and infrastructure persisted and kept flooding as the third most serious environmental problem in Warri until the late 1980s.(38)
But from the early 1980s, a second phase of government adaptation choices was ignored, so the upward trajectory of Warri flood risks culminated in the 2012 flood disaster. Physical planning and development controls were seriously compromised. Consequently, government adaptation choices were refocused on re-invigorating extant planning control laws, maintaining existing flood drainage infrastructure and building a few new structures (Table 5). This period also witnessed the collapse of urban waste management systems and the clogging of drainage channels. Hence, de-clogging the drainage channels became a high-priority adaptation choice by governments in reducing the heightened urban flood risks and vulnerability (Table 5).(39)
Community-based adaptation choices in Warri: Flood adaptation choices of Warri flood zone occupants are presented in Table 6. They include pre-construction reclamation of swamplands by sand filling, raised building foundation with a damp proof course (DPC) well above the flood stage,(40) and installation of flood defence walls around and within buildings purely for the protection of personal property assets from flood hazards. For example, 88.5 per cent of the houses were built on reclaimed or sand-filled plots. In 44.3 per cent of these houses, building foundations were further raised, with the DPC level set above the local flood stage. In addition, 50.4 per cent of the houses had flood defence walls of less than 2.0 metres in height. In low-income flooded areas, 61.2 per cent of the houses are temporary in nature, thereby making relocation during hazard times easy. Only low-cost adaptation choices, such as minimal or no sand filling prior to construction, are often favoured. Only 8.1 per cent of the houses had low flood defence walls, which barely exceeded 0.3 metres.
With the stable climate and a functional flood control regime, these property-shielding adaptation measures kept floodwaters out of homes until the 1980s and perhaps might have informed their wide acceptance and adoption as standard practice at both the household and community levels. Thereafter, government flood control measures and institutions became dysfunctional. This resulted in a second set of stop-gap adaptation measures that merely reinforced earlier choices. These included post-construction sand filling of yards, flood defence walls within properties, and temporary raised wood bridges or stepping stones/blocks (Table 6). These new choices indicate that existing adaptation choices were unsustainable and required some form of community and government cooperation to restore system functionality and resilience. This may involve the re-assessment of each existing adaptation choice for its positive and negative flood feedback mechanisms in order to further understand their long-term flood protection effectiveness, as well as to learn from the hazard and the local stock of knowledge in producing a more resilient flood management system.(41)
b. Implications for a bottom-up adaptation strategy for urban flood risk resilience in Warri, Nigeria
Nigerian cities still lack requisite technical and institutional infrastructure for a sustainable reduction in flood risk impacts of climate change and rapid urban growth. Therefore, to wait for the resolution of this dysfunctional state at the national level before appropriate local community-focused adaptation strategies are developed is to deny flood zone occupants their right to safety and protection of their natural resource base.
Hence, given the current uncertainties of climate change and rapid urban growth on extreme flood vulnerabilities, “the enhancement of system resiliency is a rational strategy to deal with risk.”( 42 ) As a result, a portfolio of resilience-focused strategies for extreme flood management for Warri is presented in Table 7. Its framing is strongly guided by the need to maintain: effective public engagement of all stakeholders, active learning from the hazards and responses of local inhabitants, adaptive non-structural solutions, and utilization of the self-organizing properties of system theory to respond to the uncertainties of its external drivers in restoring the system’s functionality within a long-term framework. As a self-organizing system, all Warri flood system parts that work together to achieve system functionality and resilience are accounted for and appropriate adaptive non-structural choices proffered. These parts include its ecological systems (i.e., urban land, hydrology and ecosystems), physical/technical systems (i.e., flood drainage infrastructure) and social systems (i.e., people using and managing the land, local at-risk communities responding to flooding issues). These systems are presented in column one, “Adaptation Flood Risk Management for Resilience: Flood System Components”, in Table 7.
Bottom-up adaptation choices to reduce urban flood risk impacts of climate change and rapid urban growth in Warri
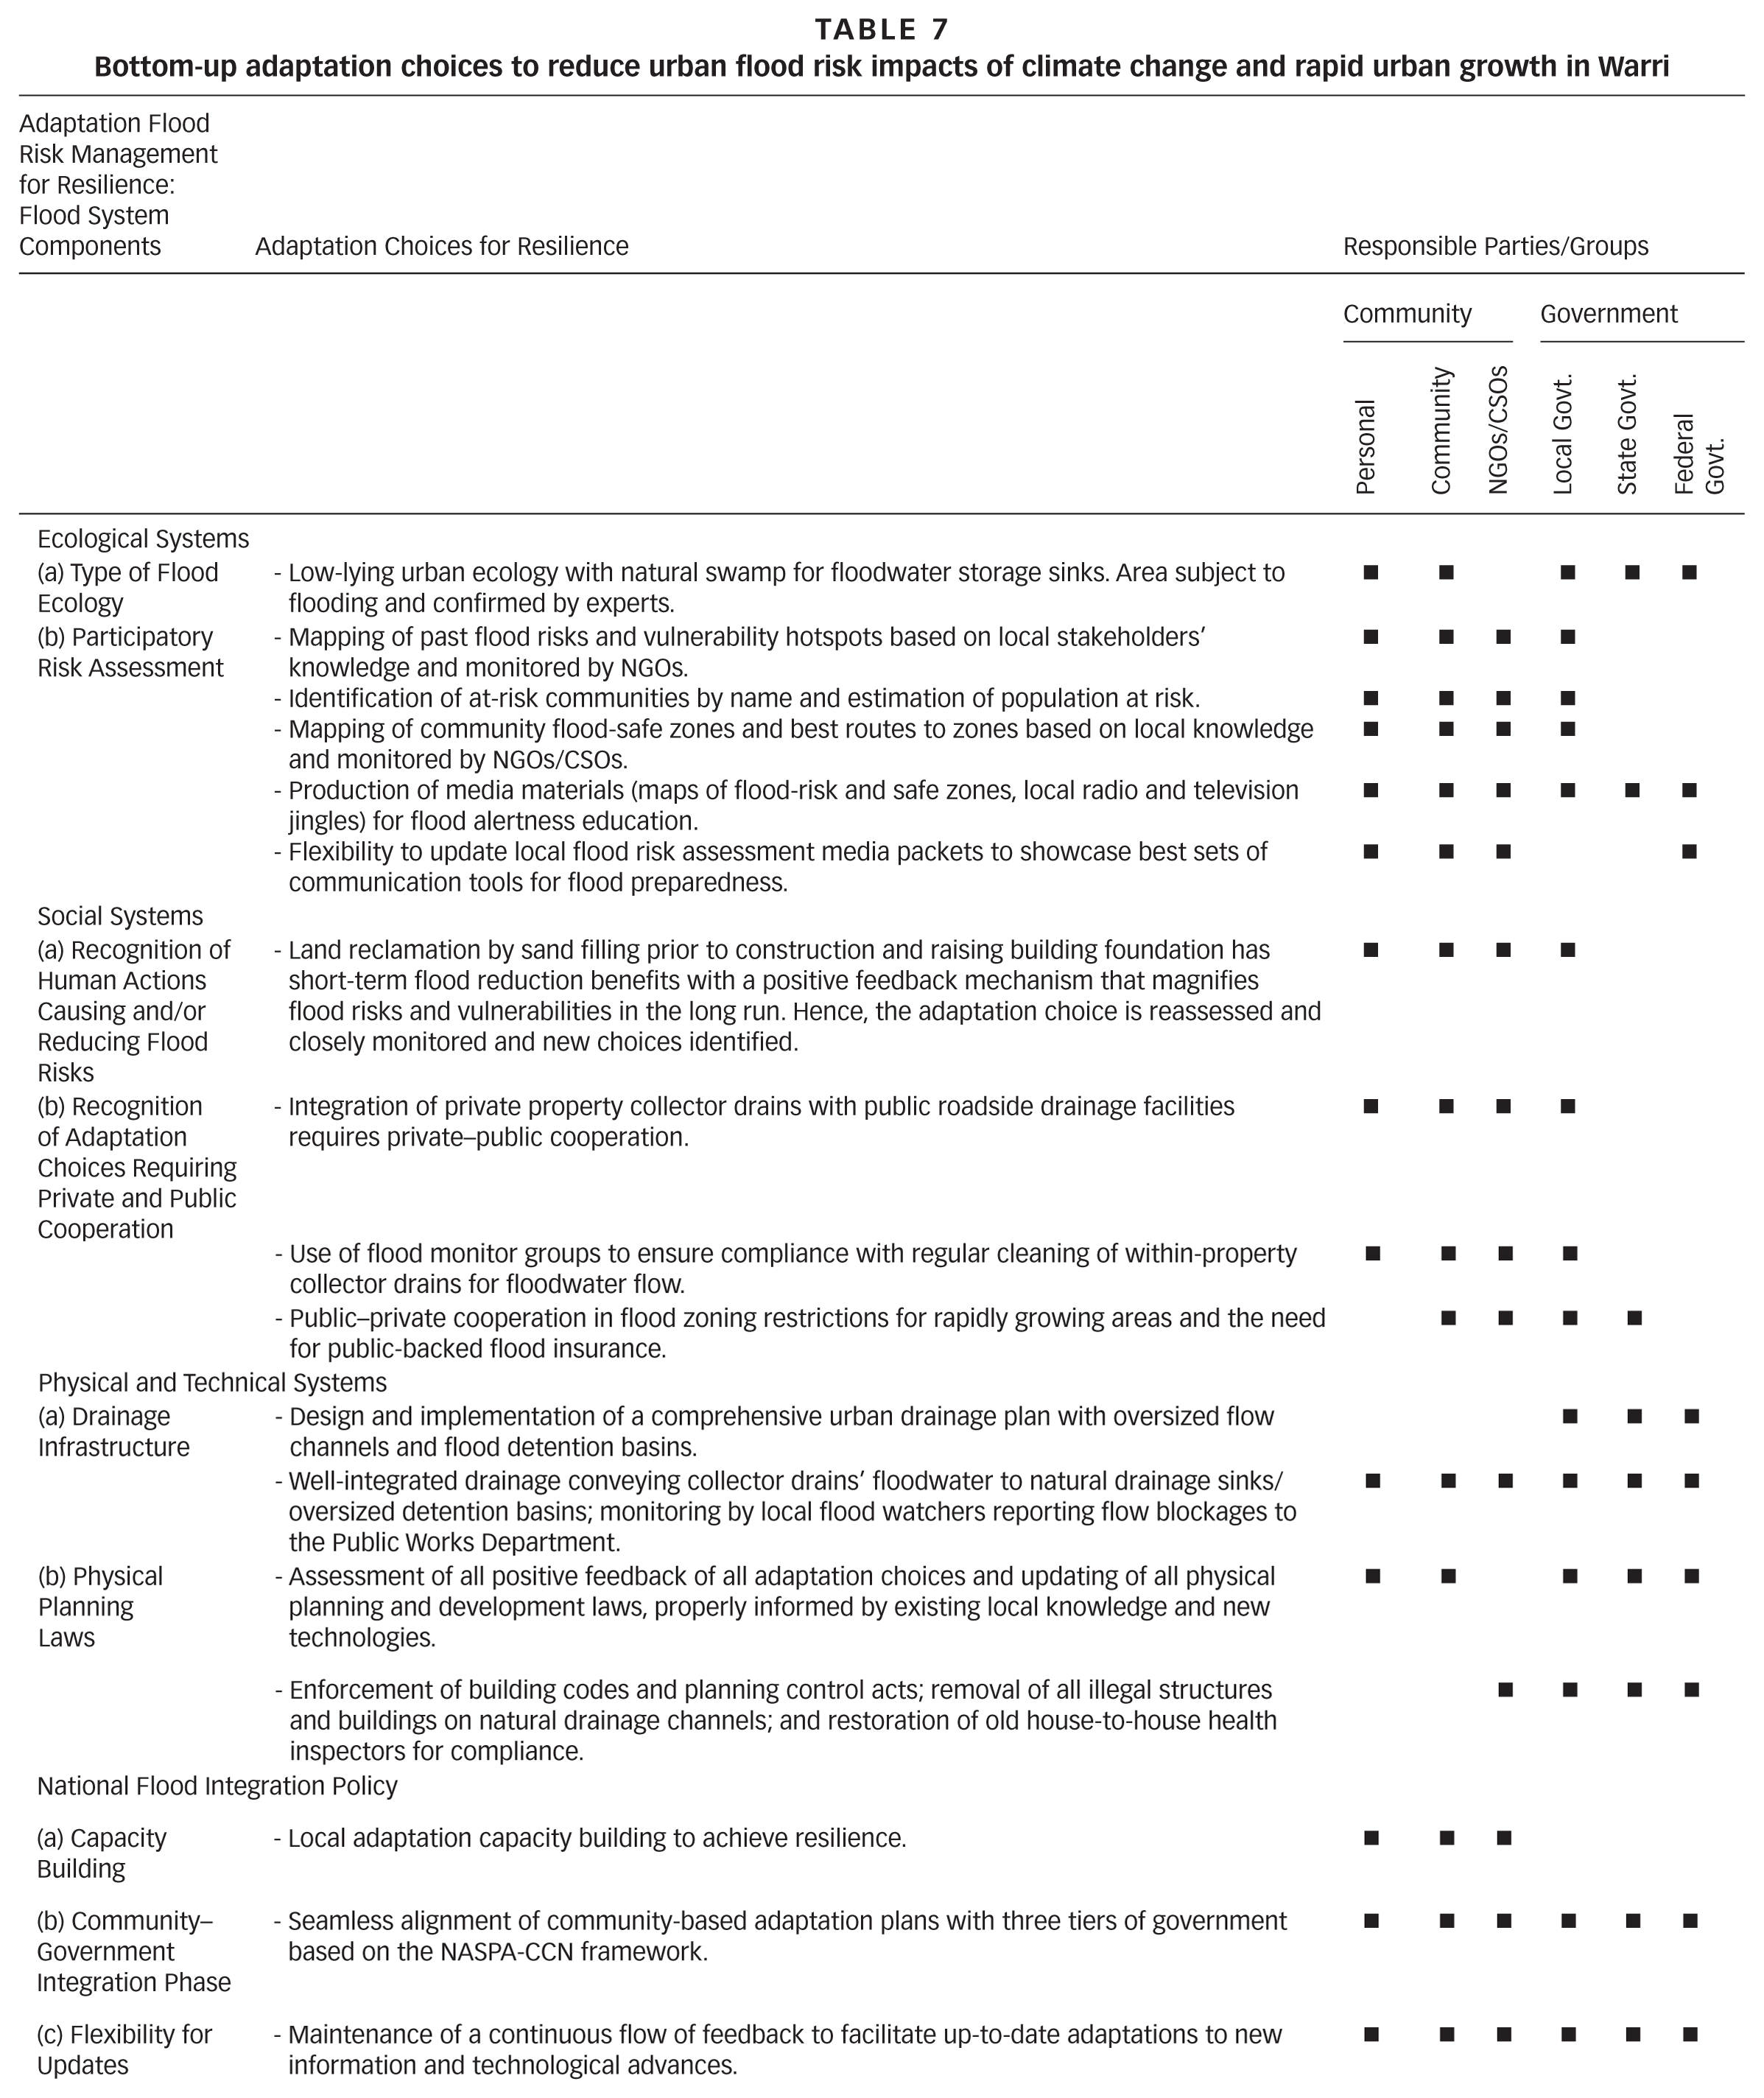
The system is further guided by a strong commitment to system monitoring, the translation of system feedback into new knowledge for further action, diversification of possible responses and technological flexibility in order to achieve system resilience within the portfolio of adaptation choices. Furthermore, the feedback mechanisms of the adaptation choices were re-assessed for their flood risk potential based on the root causes of flooding and local stock of knowledge in consonance with the best practices for building adaptive resilience for sustainable disaster risk reduction.(43) This means that where an adaptation measure was found to enhance rather than reduce flood risk, the portfolio is flexible enough to accept other complementary measures in achieving more resilience. For example, while reclamation by sand filling was found to keep floodwater away from property only temporarily, it also intensifies on-street floodwater retention pools on city streets in the long run because sand filling also reduces floodwater storage capacity of drainage sinks. Therefore, to make reclamation more robust and sustainable, complementary adaptation choices like the provision of drainage facilities to move floodwater quicker out of city streets to drainage sinks and/or the provision of new compensatory floodwater detention basins are needed (Table 7). In this format, this bottom-up adaptation strategy is flexible enough to incorporate valid new improvements in modern technology and tools for disaster assessment and implementation. Similarly, those social institutions and stakeholders required in monitoring system compliance or in identifying potential failure alerts in order to maintain continued system functionality are indicated within the portfolio (Table 7). Also, adaptation requires action from many decision makers and community involvement to convey its real meaning to threatened communities. Finally, this portfolio of adaptation choices is designed to fit seamlessly with the long-term goals of an overarching national policy, as currently contained in the 2011 National Adaptation Strategy and Plan of Action on Climate Change for Nigeria (NASPA-CCN) document for reducing urban flood risk impacts of climate change and rapid urban growth in Nigeria.(44)
c. A national strategy for urban flood risks management for resilience in Nigeria
In the last decade, Nigeria has responded to climate change issues by developing appropriate regulatory policies and institutional frameworks. Nigeria completed and submitted its First National Communication (FNC) in 2003 to the United Nations Framework Convention on Climate Change (UNFCC) as expected under the Kyoto Protocol.(45) Since then, it has made serious inroads in identifying and prioritizing adaptation strategies in different sectors of the economy and it has prepared a NASPA-CCN.(46) According to Nigeria, “NASPA-CCN seeks to minimize risks, improve local and national adaptive capacity and resilience … with a view to reducing Nigeria’s vulnerability to the negative impacts of climate change.”( 47 ) It established a clear path to new adaptation choices and a plan of actions for 13 priority sectors or themes, including sectors that broadly or tangentially addressed adaptation issues for the reduction of urban flood risk impacts of climate change at all levels. Unfortunately, the Climate Change Adaptation Strategy Technical Reports (CCASTR) did not include any detailed case studies of urban communities exposed to extreme flood risk impacts of climate change and rapid urban growth.(48)
The lack of institutional and technical response capacity on the ground to handle Nigeria’s 2012 floods, the country’s most catastrophic floods in decades, exposed the NASPA-CCN system’s inadequate response capacity and the lack of preparedness of both the responsible national (NEMA) and state (SEMA) statutory agencies.(49) It also revealed that the approved NASPA-CCN documents were at best mere theoretical propositions without any on-the-ground action plans and without the technical capacity and requisite funding to achieve any effective response at any level. As a result, local urban communities living with the possibility of being exposed to extreme flood hazards are still without adequate protection. In the absence of a working national policy on reducing climate change flood impacts, an alternative custom-made adaptation strategy based on the local stock of knowledge about the root causes of Warri flood, as developed in the last section as a logical first step before an overarching national policy that is properly informed by the long-term benefits of the NASPA-CCN framework, is ready for adoption in Nigeria.
VIII. Conclusions
The decision of the British colonial administration to establish Warri in low-lying flood-prone swamp terrain of the Niger Delta, without the provision of adequate drainage infrastructure, is at the heart of its unsolved flooding problems. Participatory urban flood risk assessment has shown that on-street floodwater retention pools have become the dominant feature of the city’s flood landscape. Warri respondents reasoned that urban practices that reduce the floodwater storage capacity of its drainage sinks and the violation of building codes, which allow buildings and waste materials to block the rights of way of natural channels, are the top underlying drivers responsible for the development and propagation of on-street urban floodwater retention pools in neighbourhoods that were once free of flooding. More recent causes of Warri flood risks and these risks’ upward trajectory are the uncertainties of climate change and rapid urban growth. These root causes and time-tested adaptation choices informed the formulation of a resilience-focused bottom-up adaptation strategy to sustainably reduce flood risk in the town. Such an approach allows horizontal linkages among city neighbourhoods to work cooperatively to deploy their unique sets of indigenous knowledge in creating a more robust flood-resilient city prior to its full integration with a fully developed national policy.(50)
Footnotes
1.
Adelekan, I (2010), “Vulnerability of poor urban coastal communities to flooding in Lagos, Nigeria”, Environment and Urbanization Vol 22, No 2, pages 433–450; also Douglas, I, K Alam, M Maghenda, Y McDonnell and J Campbell (2008), “Unjust waters: climate change, flooding and the urban poor in Africa”, Environment and Urbanization Vol 20, No 1, pages 187–205.
2.
Merz, B, J Hall, M Disse and A Schumann (2010), “Fluvial flood risk management in a changing world”, Natural Hazards and Earth System Sciences Vol 10, pages 509–527; also IPCC (2007), Climate Change 2007: Synthesis Report, available at http://www.ipcc.ch/pdf/assessment-report/ar4/syr/ar4_syr.pdf; Houghton, J (2004), Global warming: the complete briefing, third ed., Cambridge University Press, Cambridge, 382 pages; and ![]() , Nigeria Climate Review Bulletin 2007.
, Nigeria Climate Review Bulletin 2007.
3.
See reference 2, Merz et al. (2010); also Milly, P C D, J Betancourt, M Falkenmark, R M Hirsch, Z W Kundzeweiz, D P Lettenmaier and R J Stouffer (2008), “Stationarity is dead: whither water management?” Science Vol 319, pages 573–574.
4.
Lopez-Marrero, T (2010), “An integrative approach to study and promote natural hazards adaptive capacity: a case study of two flood-prone communities in Puerto Rico”, The Geographical Journal Vol 176, No 2, pages 150–161, page 150.
5.
Pelling, M (2011), Adaptation to climate change: from resilience to transformation. Routledge, Taylor & Francis Group, London and New York, 203 pages, page 21.
6.
Pahl-Wostl, C (2008), “Requirements for adaptive water management”, in C Pahl-Wostl, P Kabat and J Moltgen (editors), Adaptive and integrated water management, coping with complexity and uncertainty, Springer, Berlin and Heidelberg, pages 1–22, page 1.
7.
Zevenbergen, C, A Cashman, N Evelipou, E Pasche, S Garvin and R Ashley (2011), Urban Flood Management, CRC Press, 322 pages, page 259.
8.
See reference 7.
9.
Gersonius, B (2012), “The resilience approach to climate adaptation applied for flood risk”, PhD dissertation, Delft University of Technology and UNESCO–IHE Institute for Water Education, Delft, The Netherlands, 132 pages, page vi.
10.
See reference 9, pages vi–vii.
11.
An impervious area refers to land that has been covered by a material, such as concrete, that impedes the penetration of water into soil. Examples include car parks, rooftops and compacted soils.
12.
Ojo, A O (2007), The climatic dilemma, 32nd inaugural lecture series, Lagos State University, Ojo, Nigeria.
13.
Gould, P R (1972), “On mental maps”, in P W English and R C Mayfield (editors), Man, space, and environment, Oxford University Press, pages 260–282.
14.
Edevbie, O (2006), “Who owns colonial and post-colonial Warri?”, in P K Ekeh (editor), History of the Urhobo people of Niger Delta, Urhobo Historical Society, Buffalo, New York, pages 297–354.
15.
Ekeh, P K (2006), “Colonialism and the scramble for Urhobo lands: Introduction”, in P K Ekeh (editor), History of the Urhobo people of Niger Delta, Urhobo Historical Society, Buffalo, New York, pages 254–265.
16.
See reference 14.
17.
See reference 14; also Moore, W A (1936), History of Itsekiri, Frank Class and Company Limited, London, 224 pages; Obiomah, D A (1975), The land factor in inter-community feuds in Warri – A colonial legacy, self-published, Warri, Nigeria; and Obiomah, D A (1987), Warri: land, overlords and land rights (Ometan vs. Dore Numa). Fact, fiction and imperialism, GKS Press, Warri, Nigeria.
18.
National Population Commission of Nigeria (2010), 2006 Population and Housing Census: Priority Table Vol III, National Population Commission of Nigeria, Abuja, Nigeria, available at ![]() .
.
19.
See reference 7; also Sheppard, S C (2007), “Infill and the microstructures of urban expansion”, Homer Hoyt Advanced Studies Institute presentation, 12 January.
20.
See reference 2, IPCC (2007); also see reference 2, ![]() .
.
21.
NITP (n.d.), State of planning Report in Nigeria (Chapters 1–4), available at ![]() .
.
22.
Reuters (2012), “Nigeria floods kill 363 people, displace 2.1 million: agency”, available at ![]() .
.
24.
See reference 2, Houghton (2004) and ![]() .
.
25.
See reference 13; also Leopold, L B (1968), “Hydrology for urban land planning – A guidebook of the hydrologic effects of urban land use”, U.S. Geological Survey Circular Vol 554, pages 1–18; Hollis, G E (1975), “The effects of urbanization on floods of different recurrence intervals”, Water Resources Research Vol 11, pages 431–435; Bronstert, A, D Nichoff and G Burger (2002), “Effects of climate and land-use change on storm runoff generation: present knowledge and modeling capabilities”, Hydrological Processes Vol 16, pages 509–529; and Wilby, R L, K J Beven, and N S Reynard (2008), “Climate change and fluvial flood risk in the UK: More of the same?”, Hydrological Processes Vol 22, pages 2511–2523.
26.
See reference 13. The varimax (900) rotated principal axis factor analytical procedure ensures that the grouping of the variables is done in such a way that the resulting groups (or underlying dimensions or factors) are truly independent of one another. Hence the grouping algorithm kept the angle of separation of the groups of variables at 900 (varimax) during rotation.
27.
Communality is the variance of a variable explained by all the factors. Eigenvalue is the percentage of the flood data accounted for by all the factors combined (i.e., 52.4 per cent) or by each factor as indicated by the values at the bottom row of each column (e.g., 29.6 per cent for factor 1 or factor loadings column 1). Factor loading of >0.45 is the cut-off value for labelling each factor, while those with asterisks are additional variables for confirmation of the interpretation. The factor loadings columns numbered 1 through 5 represent five factors, dimensions or groupings of the 15 variables in column 2. The five colours represent the five underlying factors or groupings of the variables. For example, the six variables in red loaded highly (0.524 through 0.731) on factor 1 with values well above the study’s minimum cut-off value of >0.45. After a careful interpretation of how the six variables are interrelated, factor 1 was labelled as human activities that lead to the “reduction in floodwater storage capacity of swamplands” and factor 1 is the most important of the five factors because it explained 29.6 per cent of the variance in the dataset alone. Though variable 8 loaded highly on factor 1, it was included under factor 3 because it also loaded highly on factor 3 and helped in understanding or interpreting the underlying dimension of this factor. Also, variable 13 was not included in any of the five groups because its factor loadings were below the minimum required but was utilized in the confirmation of factors 1, 2, and 5. This is a simple guide to how the five factors in ![]() should be interpreted.
should be interpreted.
28.
Silveira, A L (2002), “Problems of modern urban drainage in developing countries”, Water Science and Technology Vol 45, No 7, pages 31–40.
29.
Omuta, G E D (1982), “Minimum versus affordable standards in the Third World cities: An examination of housing codes in Benin City, Nigeria”, Cities Vol 3, No 1, pages 58–71.
30.
Ugwu, E (2009), “Town Planners Blame Govt for Chaotic Cities”, This Day Online, 4 May, available at ![]() .
.
32.
Onofeghara, F A (1990), “Nigerian wetlands: an overview”, in T V I Akpata and D U U Okali (editors), Nigeria Wetlands, UNESCO Man and the Biosphere Programme (MAB), pages 1–15.
35.
36.
Burton, I and R Kates (1964), “The perception of natural hazards in resource management”, Natural Resources Journal Vol 3, pages 412–441.
37.
See reference 5.
38.
Odemerho, F O (1984), “The structure of urban environmental problems as perceived in Warri, Bendel State, Nigeria”, Journal of Environmental Management Vol 19, pages 65–77.
39.
See reference 1, Adelekan (2010); also see reference 21; and Delta State Government (2012), “Ministry of Environment”, available at ![]() .
.
40.
The flood stage is the level at which a rise in the water surface level becomes hazardous or inconvenient to people and property.
41.
See reference 7.
42.
See reference 7.
43.
See reference 35.
44.
NASPA-CCN (2011), National Adaptation Strategy Plan of Action for Climate Change in Nigeria (NASPA-CCN), BNRCC Project Report, available at http://nigeriaclimatechange.org/naspa.pdf; also Turbull, M, C L Sterrett, and A Hilleboe (2013), Toward resilience: a guide to disaster risk reduction and climate change adaptation, Practical Action Publishing, Warwickshire, UK, 180 pages.
45.
Federal Government of Nigeria (2003), Nigeria’s First National Communication under the United Nations Framework Commission on Climate Change (UNFCCC), available at http://www.unfccc.int/resource/docs/natc/nignc1.pdf; also Sayne, A (2011), Climate Change adaptation and conflict in Nigeria, United States Institute of Peace, Special Report.
46.
See reference 44.
47.
See reference 44, page i.
48.
CCASTR (2011), Climate Change Adaptation Strategy Technical Reports – Nigeria (CCASTR), available at ![]() .
.
49.
ActionAid (2012), Flood in Nigeria: Re-visiting States Accountability on Emergency Response/Preparedness and Disaster Reduction in Nigeria, Policy brief, available at ![]() .
.
50.
Pelling, M (1999), “The political ecology of flood hazard in urban Guyana”, Geoforum Vol 30, pages 249–261.