
Abstract
The Household Economy Approach (HEA) is a tool routinely used to monitor household-level vulnerability to food security shocks in rural sub-Saharan Africa. Efforts are now focused on applying the HEA in urban contexts. Previous work has shown specific limitations to this method when applied to cities, where livelihoods are diverse, social capital is especially important for managing shocks, and multiple hazards interact. The paper proposes a household resilience assessment tool that incorporates elements of the HEA to provide potential for a joined-up rural–urban output, but that includes additional data and specific analytical approaches in recognition of urban contexts. The tool is piloted in Niamey, Niger. The experience showed collection of the required data to be challenging. Results identified low levels of resilience amongst flood-exposed households associated with inequalities in social capital ties and variable access to food and security post-flood. Responding to loss, households expended savings and took on debt. This has implications for focused resilience building and flood response planning.
I. Introduction
This document presents the methodological logic and design, and the methodological and analytical findings, of a pilot study to measure household-level resilience in very poor urban neighbourhoods where it is difficult to distinguish households by economic assets or food security alone. The study originated from a desire to apply the Household Economy Approach (HEA) to an urban poor context. The HEA is commonly used for assessing rural household food insecurity.(1) The proposed method retains core HEA indicators so that data can be extracted to perform a joined-up HEA rural–urban food security assessment. In addition, and in recognition that food and economic security is but one expression of vulnerability/resilience in urban poor households, the method establishes a broader resilience measurement tool.
The proposed method uses statistically calculated resilience classes based on the stability of individual resilience components (social assets, shelter, health, food, economic assets, education and security), measured by their performance during a shock event. Households experiencing greater reduction in command over these components are described as being less resilient. This methodological advance responds to earlier HEA studies in Niamey that found the existing HEA method was unable to capture the full, and even some of the most important, dimensions of vulnerability experienced by the urban poor. In particular, it failed to show the centrality of social capital as an asset that differentiates risk and loss amongst the very poor.(2)
In Niamey, the capital city of Niger, principal risks include flooding, public health, food insecurity and economic precariousness.(3) In practice these risks often operate in conjunction.(4) Poor land planning, limited infrastructure and increasing population pressure, mainly due to rural–urban migration, have led to the increased occupation of flood-prone areas.(5) The associated risks are compounded by the variability and extremity of Africa’s changing climate.(6) The influence of climate variability was described by Casse et al.,(7) who attributed floods in Niamey to land-use/land-cover and drainage distribution over the last 60 years, with rainfall variability becoming the main explanatory variable for the last 30 years.
There is no standardized flood loss database for Niamey. Individual academic studies indicate a dramatic increase in the frequency and intensity of floods observed in the city over the last decade.(8) Extreme flood events occurred during 2010, 2012 and 2013. As a result of the 2013 floods, 26 people died, 75,347 people were affected, and 13,000 hectares of rain-fed and irrigated crops were flooded, with a consequent loss of 32 billion West African CFA francs (approx. US$ 53 million).(9) September 2015, the focus of this study, is considered an “average” flood year,(10) yet when the Niger River flooded, it affected 1,083 people and destroyed 60 homes in Niamey.(11)
Sections II and III present the logic and methodological framework for the tool. This is followed in Section IV by a presentation of results and methodological constraints experienced in the pilot study in Niamey.
II. Theory Context
Livelihoods and resilience are intimately linked. A wider livelihood portfolio may reduce the vulnerability of a household, given that different livelihood options within the portfolio present different degrees of robustness during a particular shock. In the Sahel and elsewhere, successive crises have resulted in the erosion of livelihood assets, compromising future opportunities.(12) The sustainable livelihood tradition conceptualizes resilience as a desirable outcome of households managing a portfolio of assets, adopting different livelihood strategies in a socioeconomic context that mediates access to resources.(13) This conceptualization acknowledges the effect of political context. However, it renders little attention to the internal capacity or agency of the household to learn and to challenge the context that limits its possibilities.
The UK Department for International Development (DFID) defines resilience as the capacity to adapt to changes, while conserving or transforming living standards when faced with shocks or stress, without compromising options in the long term. Resilience, then, is a property that allows households to absorb and respond to shocks without having assets eroded to the extent that dangerous livelihoods, debt, or chronic health or educational costs result. Resilience efforts share a commitment to working with people, groups, institutions and administrations to avoid recurring crises, by reinforcing local capacity and reducing vulnerability to risks.(14) Social–ecological systems thinking defines resilience as functional persistence.(15)
While a policy consensus has been reached on the need to work on resilience, how this should be done is still being discussed.(16) Efforts to quantify resilience address the capacity to absorb, adapt and transform. The capacity to absorb represents the household’s ability to persist with its current form in the event of a shock. The capacity to adapt is the result of post-disaster learning and anticipation of future events. A system capacity to transform requires fundamental internal changes.(17) Influencing factors are numerous, and what is emphasized differs from one observer to another. Save the Children, for instance, emphasizes food consumption (variations of food sources after a shock), whereas Oxfam is interested in balancing different forms of inequality, particularly gender.
The analytical framework used in this research describes resilience through a focus on absorptive capacity. In this light, it is hypothesized that households benefiting from a higher absorptive capacity will suffer less variation in resilience as a result of a shock. In other words, the stability of household resilience dimensions will be higher for those households with more absorptive capacity. Calculated resilience is tested against the performance of households during and after a flood event. Analysis includes discussion of the variable scope for adaptation and the ability of households within different resilience classes to challenge constraining relationships.
III. Methodology
a. Complementing the HEA approach
The aim in the proposed work is to develop a household resilience assessment tool that retains sufficient similarity to the existing HEA approach to be an effective complement to it. The proposed methodology was designed to meet the challenges of measuring resilience amongst urban households with very limited command over economic assets, yet expressing variable vulnerability and losses to flood events. Two methodological innovations were required, following consideration of an urban HEA study undertaken in Niamey in 2015(18):
1) Urban livelihoods are heterogeneous, and the specific sources of income available to the poor are likely to be fragile, multiple and changing. This is a dual challenge for the existing HEA, which in a rural context is able to rely on livelihood status information that is aggregated across large and relatively homogeneous livelihood zones, and collected via focus group consultation.
In response, household questionnaires were deployed and the data so collected were aggregated through statistical analysis.
2) Very Poor and Poor categories in commonly used HEA wealth ranking frames (which include Very Poor, Poor, Moderately Poor, Less Poor and Wealthy) are difficult to distinguish using only economic metrics, because economic capital is so scarce and because fragile social capital is used in addition to assess status in urban areas.
In response, the analytical frame is extended from food and economic assets to encompass other dimensions of resilience.
b. Sampling of the households
For the Niamey pilot, 300 household heads were interviewed from households located in three zones: 1) 140 peri-urban (highly flood-prone) households; 2) 115 inner-city (moderately flood-prone) households; and 3) 45 inner-city (slightly flood-prone) households. This opens scope for a spatial comparison, although this analysis is beyond the scope of the current paper. Only flooded households were sampled. Flooded households were selected at random from lists derived in consultation with neighbourhood leaders. The number of households selected for each area was proportionate to the number of flooded households in that area. A household was defined as all persons who share food and live under the same roof. Data collection was carried out during July and August 2016.
Interviewing household heads provided a view of household resilience components, flood impact and recovery, but a partial one. It is rare for women to identify as the head of household in Niger, and 93 per cent of respondents were male. Female heads of household were widows without male children old enough to assume headship. Household heads may not readily be aware of, or be comfortable sharing details about, the impacts experienced by other household members, or their capacities and responses. Further work could usefully examine differences in resilience by gender, age, ability, and differences in the behaviour of household members during and after shocks in order to maintain household equilibrium.
c. Calculating household resilience classes
The method grouped households with similar characteristics together in order to compare the performance of specific resilience components (shelter, security, education, food, economic assets, health and social support) when encountering a shock or stress. Each component was comprised of different indicators, with values derived from household head interviews. Analysis is aimed at helping policymakers to target resilience-building interventions. For example, it might be that the least resilient express a particular fragility in food security, or access to health or shelter, indicating a priority for intervention.
Two expressions of resilience can be derived from the method. Type 1 can be measured through the status of households – a static measure of capacity from which resilience actions may be taken (Table 1). Type 2, the absorptive aspect of resilience, is measured through the stability(19) of resilience components. This is calculated based on the change in status of household resilience components before and after the flood event. This is the principal analysis reported on here. In addition, analysis includes some comment on adaptive aspects of resilience – reported by households as behaviour in response to loss. Transformative aspects of resilience – efforts taken by the household to change the social structures that constrain their development and adaptation choices – are not included in this study.
Characteristics of flood-prone neighbourhoods in Niamey
NOTES:
The range of people sleeping in the household extends from 1 to 21.
US$1 = approx. 600 West African CFA francs.
Data were collected on respondent evaluation of component status before and after the annual flood cycle of 2015. For three components (shelter, education and health), this was difficult, and recorded impacts were used as a proxy for (in)stability to help calculate resilience classes. Throughout, indicators were kept simple to facilitate data collection and analysis. This required some compromise in input variables and coverage, discussed below. The following subsection describes each component and its associated input variables used to calculate household resilience classes.
d. Resilience components
Security
The research incorporated self-assessment indicators capturing security perceptions of the household head as a proxy for crime incidence in the area of residence (Table S1 in the online supplement). Moving from the reporting of crime to fear of crime introduced some bias. Perceptions of security may be influenced by personal anxiety levels and broader life experience. Still, in the absence of formal crime data this was a reasonable proxy.
Education
The Niamey rainy season peaks during the summer period when schools are closed. The indicators selected (Table S2 in the online supplement) therefore did not seek a comparison of educational access before and after the flood, but show the situation of schooling at the time of data collection (after the rainy season in the summer months of 2016). In other locations where flooding impacts on access, school attendance could be disaggregated by gender.
Economic assets
Standard indicators used within the HEA for defining household economic assets were used, including measures for income, debt and savings (Table S3).(20) Expenses were used to complement income.(21) Levels of economic indicators were reported by household heads before and after the flooding of 2015. All measures were in West African CFA francs. Interviewers had previous experience of collecting economic data through HEA surveys, and were trained to work with respondents to derive economic data. Sometimes this required asking respondents about expenses and income from different categories of activity to build up final values.
Food security
Standard indexes and indicators, such as the Household Dietary Diversity Score (HDDS) and the Food Diversity Score (FCS), as well as Household Economy Analysis (HEA) indicators, were adopted to capture this dimension (Table S4). This can allow a standard HEA analysis to be extracted from this expanded resilience tool. Coverage of energy requirements was derived by asking the household head to estimate food types and amounts consumed by all household members on a typical day and calculating the calorific value. This does not allow an analysis for individual household members. Changes in food security were reported for before and after the flood event of 2015.
Health
Standard health indicators were used to measure health status (Table S5).(22) These indicators cover common morbidities for urban populations in sub-Saharan Africa: malaria, diarrhoeal diseases and injuries, conditions that are compounded in flood events.(23) The original intention was to compare these indicators before and after the flood of 2015. However, this comparison was challenging because heads of household were not always comfortable identifying ill health, especially for minor health problems. To maintain consistency across the sample, only the health situation after the flood was used.
Shelter
As floods occur every year in Niamey, households attempt to prepare for them, although they may live in very exposed housing and have limited means to adapt. This indicator examined the level of shelter stability indirectly, through the impact of flooding during the flood event of 2015. Ideally a survey of housing conditions could be undertaken before and after an event to track detailed changes and so degrees of stability, but this was not possible in the Niamey context (Table S6).
Social support
The indicators selected to capture social support were based on existing attempts to measure social capital (Table S7),(24) and focused here particularly on the social networks and social support that the household drew upon. Each household member will have his or her own informal social networks. In this case, analysis at the household level was limited to the formal ties acknowledged by the household head. Supplementary work interviewing women, children or elders could be used to draw out more differentiated assessments of social support.
e. Calculation of resilience classes
Household scores of 1 to 5 were calculated for input indicators, for each resilience component and for resilience overall. This final score allowed resilience classes (A to D) to be determined (Table 1).
The details of this process are described below.
First step: harmonizing the values of all of the indicators into a scale of 1–5
Resilience classes were calculated from a measure of component stability derived ideally from a comparison of pre- and post-flood status. Where this was not possible, flood impact data were used to indicate the relative stability or fragility of a component. In both cases harmonizing steps are the same, with indicators assigned a value on a scale of 1 to 5. Where continuous data were collected (for example, the number of days lost or amount of lost income due to a flood), translation into ordinal data was achieved through calculating quintiles based on the distribution of values for each indicator.
Lowest value quintile: score of 1
Second quintile: score of 2
Third quintile: score of 3
Fourth quintile: score of 4
Highest value quintile: score of 5
Indicator value orientation was also corrected at this stage of the calculation, as some indicators measured positive aspects (for example savings) while others measured negative aspects (such as the level of debt).
Second step: calculating the score for each resilience component
The score of each resilience component (RC) = ΣNi /ni
With Ni = Indicator score obtained
ni = Number of indicators in each component
Yields a value from 1–5
Third step: calculating the overall resilience score
The overall resilience score (RS) = ΣRS / ns
With RS = Score for the resilience component
ns = Number of resilience components
Yields a value from 1–5
Fourth step: establishing resilience classes
The scores were then matched to the resilience classes, by order of resilience. The theoretical range is 1–5. In this study the range of observed values was 1.21 to 3.83. Each class was given a text descriptor to help communicate findings, though care must be taken since these communicate relative characteristics. In the work reported here, all households are low or very low resilience in absolute terms.
Resilience class A (very low): corresponds to scores 1.21–1.84
Resilience class B (low): corresponds to scores 1.85–2.44
Resilience class C (moderate): corresponds to scores 2.45–3.2
Resilience class D (high): corresponds to scores 3.3–3.83
An advantage of deriving classes through calculation rather than fixed observation is flexibility in analysis. It is possible to generate more finely differentiated classes or reorganize classes, e.g. to establish classes for different locations, gender of head, renter/owner, or other variables of interest for comparative analysis. The analysis deployed in this pilot study was a simple description of the complete sample to test the methodology. The lack of households with aggregated resilience scores above 4 indicates the low resilience across the sample, which was anticipated in a low-income, flood-exposed location.
The calculated resilience scores are relative values – this enables comparison between classes within the sample. Comparison between samples is possible once aggregated resilience class scores are equalized.
IV. Results
Results show resilience classes and compare these by flood impact and capacity to respond.
a. Analysis of the resilience of households
Household resilience profiles
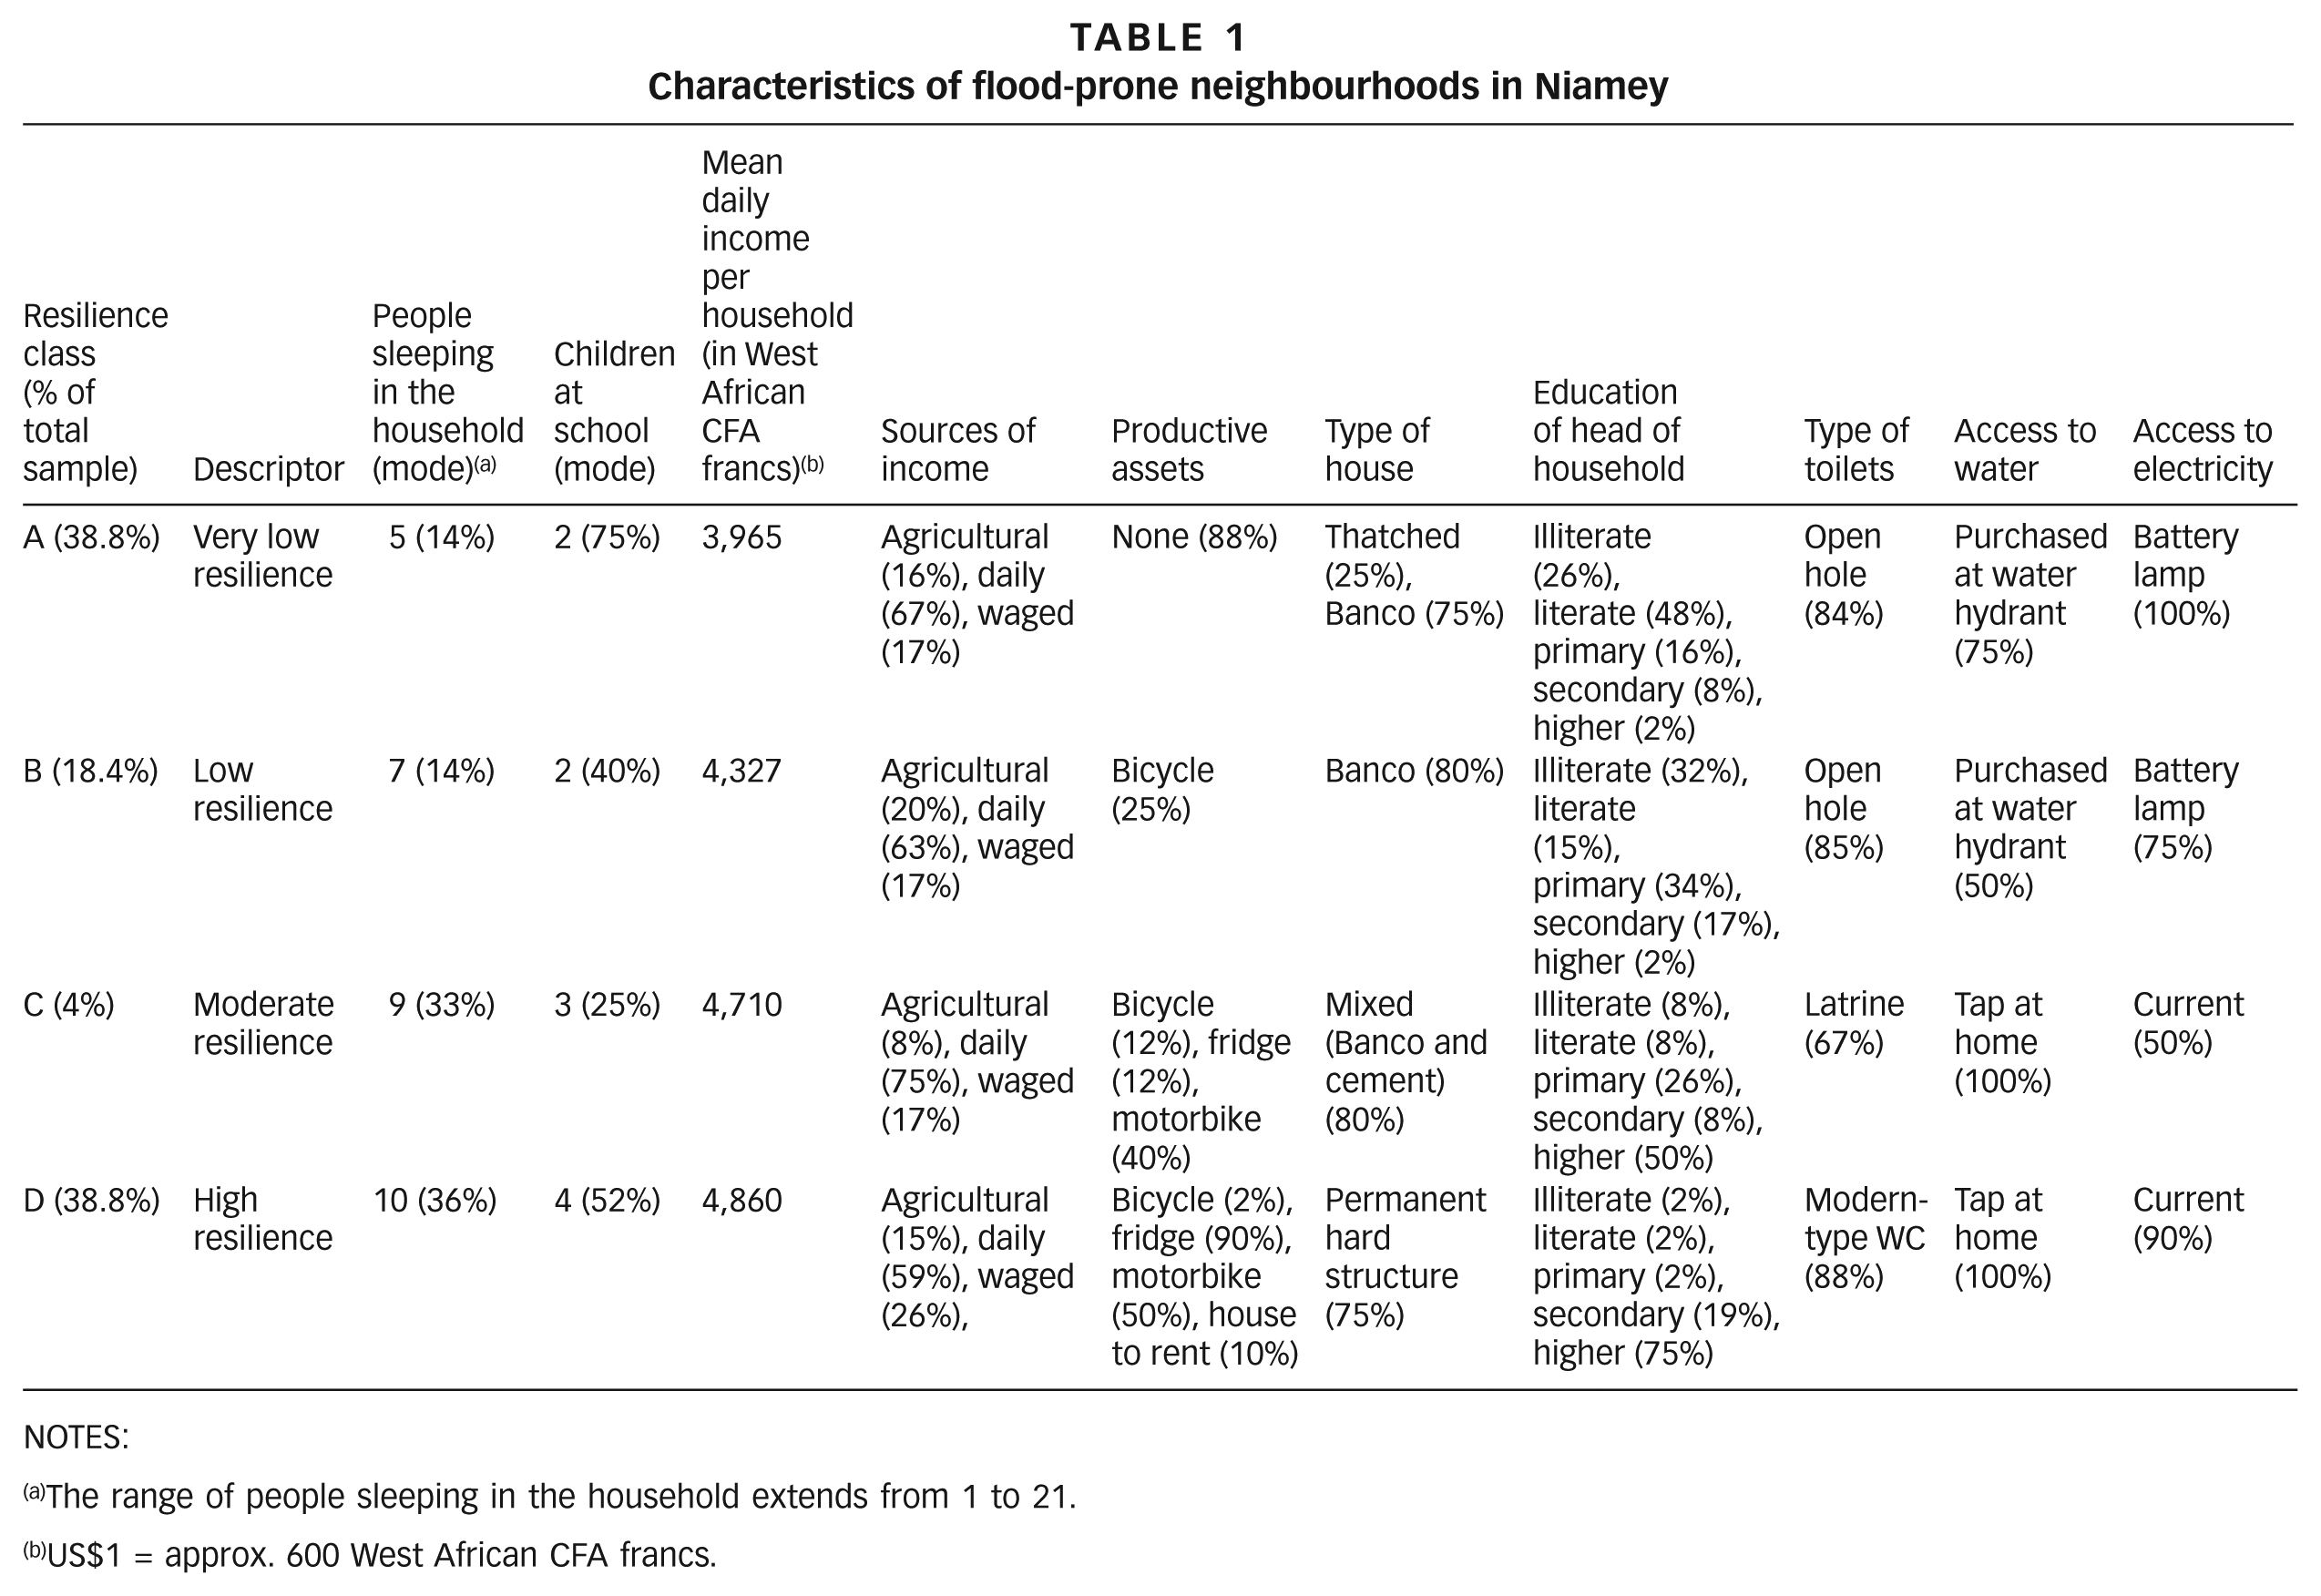
Table 1 provides a description of the characteristics of the households, organized into Resilience Classes A to D. This information was gathered at the time of the data collection. It includes nominal data that were not considered appropriate for inclusion in the calculation of resilience classes (such as productive assets, type of house, type of toilets, and access to water and electricity). Family size and number of children are presented as modes. Modes were preferable to means in recognition of the large ranges involved (for families from 1 to 21 members). Consequently, in some classes, small percentages of households have the modal value, but these nonetheless represent useful guide values for each class. These additional data are offered to provide a more textured description of the households falling into each resilience class.
The table shows diversity in living conditions even among the very poor of Niamey. Households of Resilience Classes A and B (very low and low relative resilience) lived in thatched huts or homes made from Banco (dry clay), whereas the C and D (moderate and high relative resilience) classes lived in cement houses. Access to basic needs was restricted for classes A and B. Classes C and D had private toilets that were traditional or modern, respectively. C and D also had access to electricity.
b. Components of resilience
Table 1 presents a static representation of resilience (Type 1 discussed above). A fuller understanding of resilience (Type 2) comes from reviewing the ability of households to maintain their component levels from before to after the 2015 flood. This is discussed below. It is through its dynamic quality that resilience can be seen to operate differently to poverty.
Food
Before the flood of 2015, reported access to basic foodstuffs (staples, fresh vegetables, meat) and dry goods (sugar, oil) provided 100 per cent, 105 per cent, 110 per cent and 125 per cent of daily food needs respectively in household Classes A, B, C and D (Figure S1 in the online supplement). These figures indicate that all socioeconomic groups covered their minimal food needs, and that for Classes C and D these were exceeded. However, as Figure S1 shows, the lower resilience classes, particularly Class A, used donations (including zakat, religious donations given to the poor) to help cover their food needs. Access to food decreased for all households after the flood, and for very low resilience households (Class A) went below 100 per cent of required intake. Only the high resilience class, Class D, remained clearly above 100 per cent post-flood, although this group also recorded the greatest reduction in food (dry goods). This shows susceptibility to impact, but an impact that may be chosen by the household in preference to other flood losses, showing that food access reveals a degree of absorptive capacity in this class of households.
Diversity scores complement food access totals and facilitate the measurement of changes in diets before and after flooding (Figure S2). A maximum score of 12 indicates a full and healthy diet. All of the households surveyed scored 6 or lower, revealing limited and unhealthy diets. Figure S2 indicates that a score of 6 is acceptable, while 4 is limited, and a score of 3 or lower is poor. Flooding reduced the food diversity score for all resilience classes. Thus, due to the flooding, the number of households with a diversity score lower than poor diversity (3) increased. This was particularly marked in the relatively high resilience class (D), emphasizing the susceptibility of the more resilient households to managing impact through reducing nutritional intake. This is caused by the increased price of food in markets during flood events, as well as reduced mobility to access markets during flood periods. The data suggest that social support programmes aiming to build resilience pre-disaster through enhancing food security amongst low resilience households should consider extension to all households post-event, not just those targeted prior to the event.
Income
Average daily income in absolute terms (Figure S3) was lowest and showed the greatest sensitivity to flooding for the very low and low resilience classes. Most affected was agricultural income from the very low resilience class. Average daily income in relative terms (Figure S4), understood as the mix of different sources of income, showed less variation before and after the flooding than absolute income.
Across all resilience classes, whichever the period (before or after the flooding), spending on food products was always the highest category of expenditure (Figure S5). This underlines the high poverty levels of all classes in this study. Flooding was recorded to have a different impact on expenditure across classes, indicating something of the priorities held by the members of these classes and the strategies used to maintain themselves. Those with very low relative resilience (A) increased spending on health and shelter. Those with low relative resilience (B) increased spending on basic foodstuffs and shelter. Those with moderate relative resilience (C) increased spending on transport and basic foodstuffs. Those with high relative resilience increased spending on health, foodstuffs, shelter and transport. This perhaps indicates the increased flexibility available to Class D households, which were able to adjust spending to access necessary goods even at the higher prices post-flood. For other classes, high spending represents prioritization – always food, then with hard choices to be made among health, shelter and transport.
Perhaps most illustrative of the different options open to resilience classes is the information on household debt and savings before and after the flood event, shown in Figure S6. Debt levels were common and low before the flood, and elevated afterwards, with higher resilience households taking on the most debt. Savings were less equally distributed before the flood, with high resilience households having the largest savings, but also experiencing the greatest reduction in savings post-flood. Overall the picture is of high resilience households being able to cope with flooding by taking on debts and expending savings. How far this is a positive experience, or one that has pushed households into poverty, is beyond the scope of the present study, but worthy of further research and focused policy.
Security
Security was a difficult component to capture, with respondents preferring not to discuss specific events. Perceptions of risk were used instead, using Likert scales of 1 (low perceived risk) to 5 (very high perceived risk). Reported fear of physical aggression (Figure S7) increased after the flood, especially for the higher resilience classes. Reported fear of robbery in the home (Figure S8) was stable, with some increase for the high resilience class. The implication is that security is reduced for all during flooding, but that perceived change is highest amongst the high resilience class. This may reflect fear that the few (but more numerous) assets held by higher resilience class households are at greater risk of theft post-flood. The results certainly indicate the importance of indirect impacts (theft and assault) on household resilience, and reinforce the finding that it is households in the higher resilience class that have experienced the greatest relative decline in wellbeing post-flood.
Social support
Participation in FADA (neighbourhood associations) is a weekly event for many. Membership in religious groups, convened in mosques, was also popular. This indicated the strong relationships built between local organizations and at-risk households, which included giving and receiving support during shock events, like floods (Table 2). However, for all resilience classes the social component of resilience was shown to be rather unstable, with lower rates of participation post-flooding. This was especially marked for the lowest resilience class, where participation in religious groups diminished from 13 to 2 visits a month for the household heads on average. This was explained as a consequence of a lack of money and time post-flood, along with reduced physical accessibility (roads were flooded, households were busy with removing water from their home). Social capital is often identified as a key resource of the urban poor who have limited economic or human capital – in this case, formalized social capital could not be accessed because of greater time constraints. Neighbours filled some of this gap with high levels of reciprocity, noted from the very low resilience class households (A).
Levels of indicators of social support due to flooding
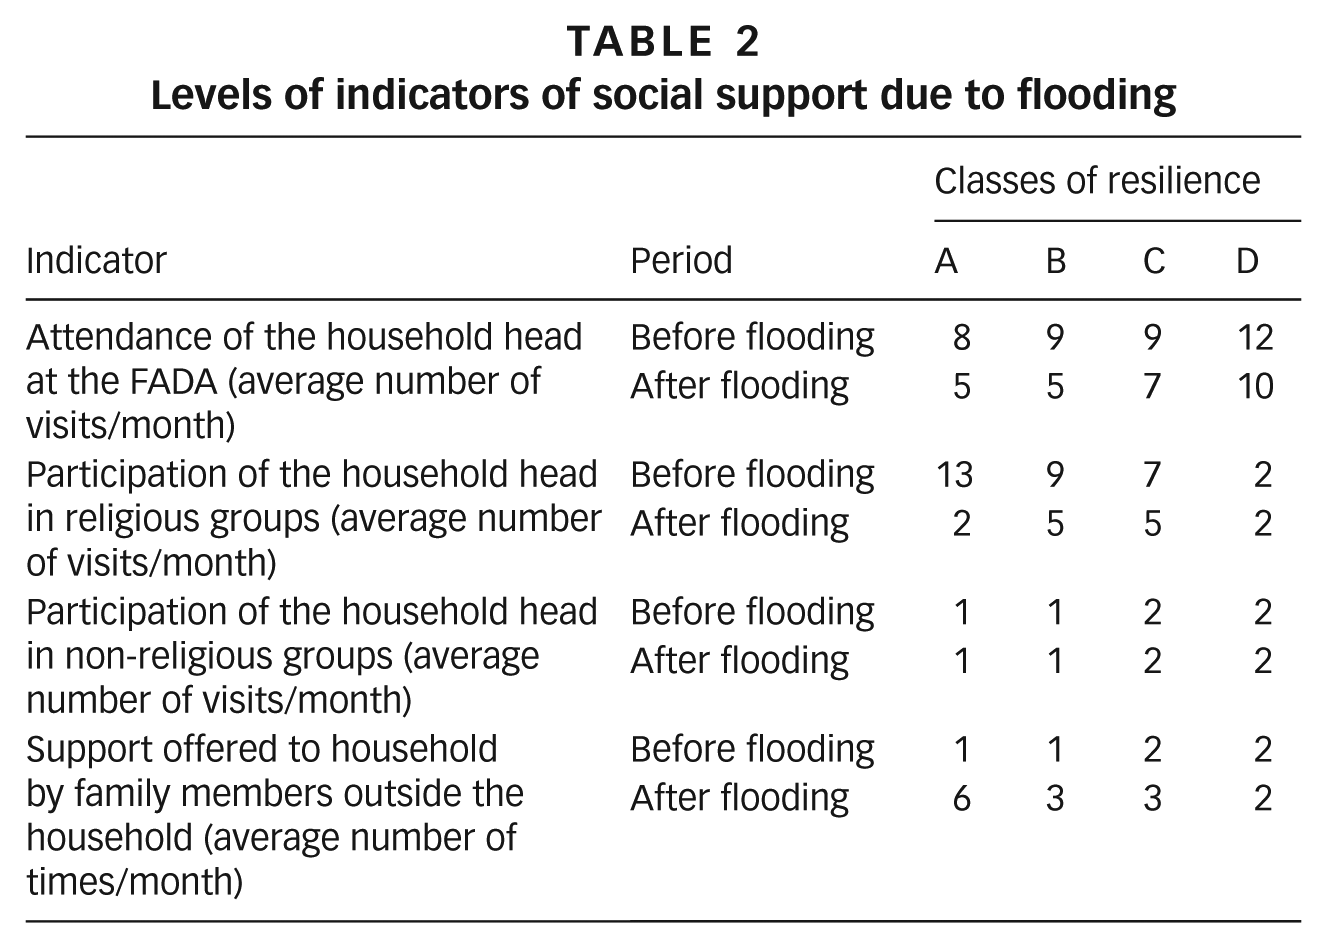
It might be that the frequent occurrence of flooding has influenced social behaviour. Repeat flooding can become normalized, so that households and planners associate flooding with poverty rather than seeing flooding as a failure of urban development. For the poor at risk, normalization, and knowing that planners associate flooding with poverty rather than a problem for the city to solve, might explain the lack of advocacy for risk reduction on the part of those at risk. It would be expected for more episodic and extreme events to lead to increased appeals for attention. Nonetheless, the limits to social capital reported by households in this assessment indicate low resilience on this front.
Health, shelter and education
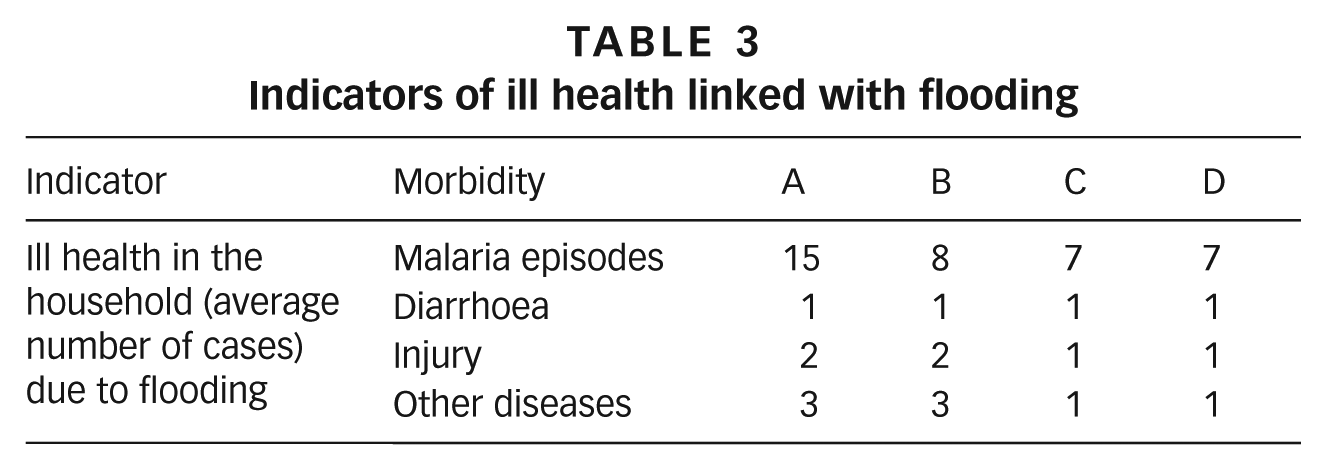
Health, shelter and education indicators proved difficult to capture. For health (Table 3), heads of household were often unable to report in detail on household members’ health problems, particularly for minor illnesses and diseases, and found it hard to judge how this had changed before and after the flood. The results here do not provide a comparison, but show the number of cases of different morbidities that the head of household recalled having happened as a result of the flood. Resilience Classes A and B consistently reported higher health burdens, especially linked to malaria episodes, than the other resilience classes.
Indicators of ill health linked with flooding
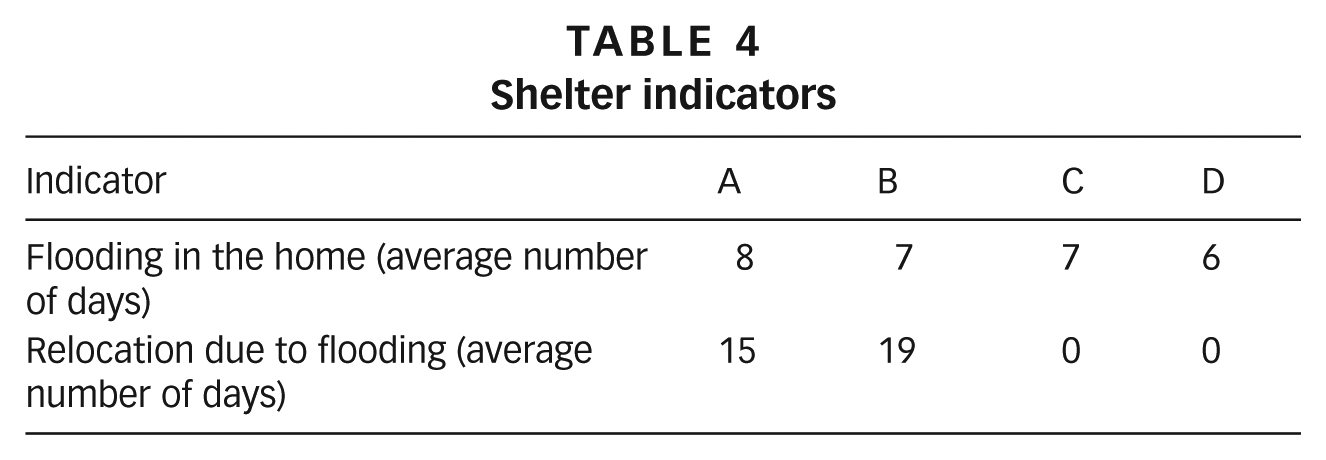
In terms of shelter (Table 4), across the sample, respondents reported similar hazard exposure: six–eight days of household flooding. Impacts varied more, showing the influence of vulnerability on loss and damage outcomes. Perhaps most stark was the variation in the number of days respondents reported having to live outside their dwelling because flooding made it uninhabitable. For the moderate and very resilient classes, no relocation was reported, while for the very low and low resilience classes, mean periods spent away from home were 15 and 19 days respectively.
Shelter indicators
Education was included in the calculation of resilience classes (Table S2 in the online supplement), but indicators were not affected by the flood event being studied, which took place during a long holiday period.
c. Losses due to the flooding
Data on property damage (Table 5) showed the reality for the very low resilience households relying on mud-wall construction – with around one-fifth of all house compound walls (walls surrounding a family compound, but not the dwelling walls) collapsing completely. No compound boundary walls collapsed completely in the high resilience class. Economic impact and loss of assets were however highest in high resilience class households, with almost double the reported loss for agricultural livelihoods compared to very low resilience households. Informal sector and day labourers in markets or in transport suffered most as they lost income on flood days, while those in waged work with monthly salaries reported little if any impact on income.
Estimated flood losses
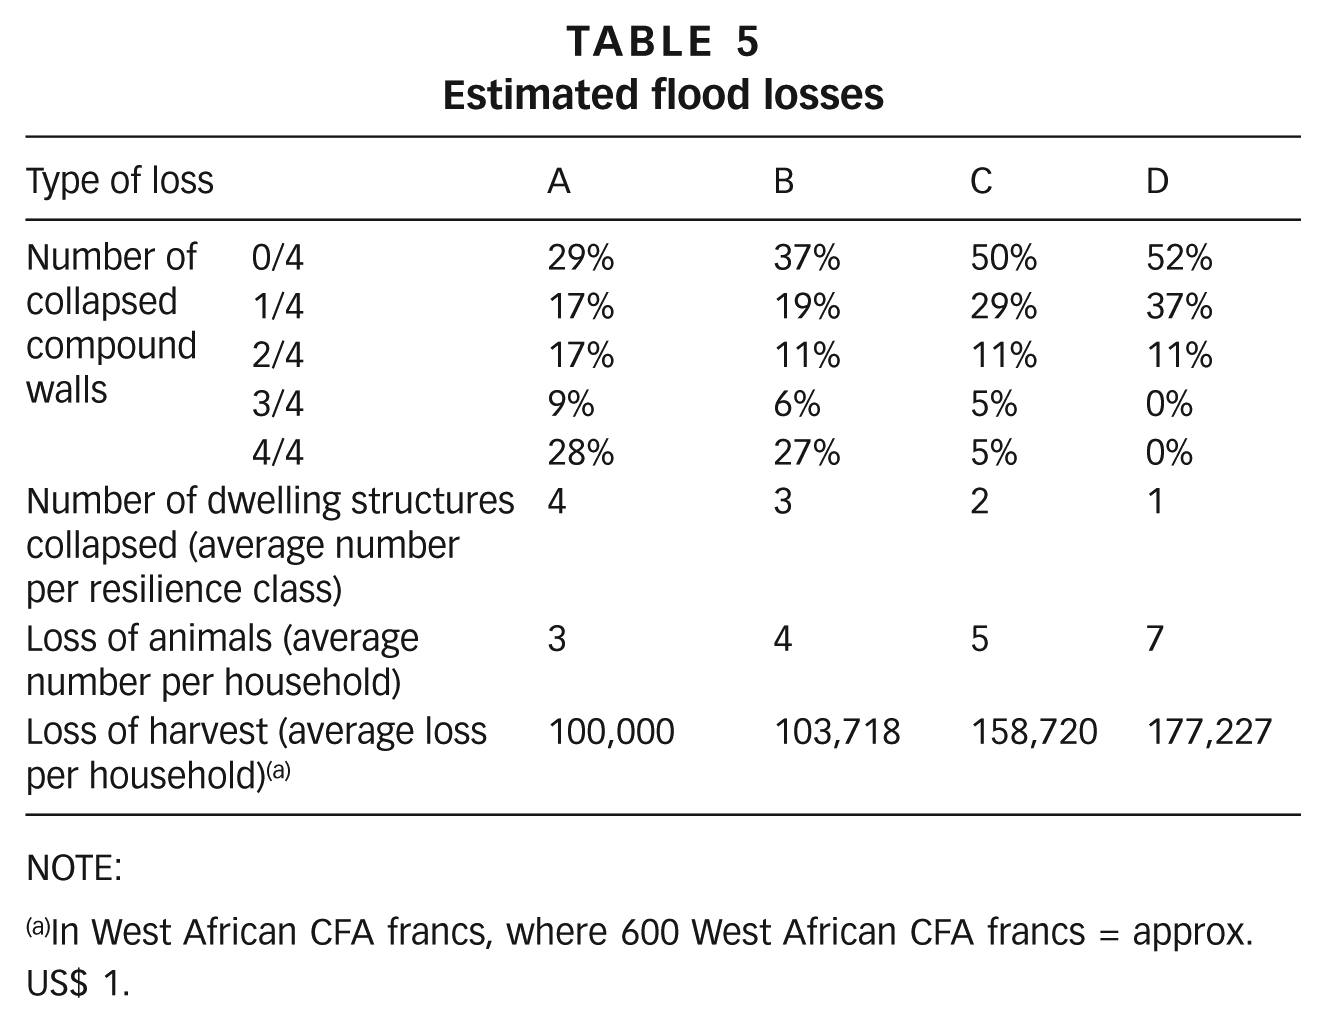
NOTE:
In West African CFA francs, where 600 West African CFA francs = approx. US$ 1.
d. Adaptation strategies of households
Adaptation to flooding beyond economic management shows a similar picture of diversity (Figure 1). More than a third of households from all but the most resilient (D) class had no strategy to deal with flooding. This proportion rose to over half for the very low resilience class (A). Where strategic action was taken, this also varied among resilience classes. The predominant strategy amongst very low and low resilience classes was relocation (absent from C and D). Households in Classes C and D, perhaps due to their higher educational attainment, were more aware of the responsibility of authorities to support flood risk management and were more likely to include advocacy as a strategy. Discussion within the household was rare in low resilience and common in high resilience households. Discussions were reported to focus on adults advising children on where to sleep or how to live with floodwater in the house and neighbourhood. The results indicate a greater degree of intentional deliberation in the higher resilience households. Critical reflection is often an indicator of resilience within organizations and seems to have its equivalent here. Few households participated in monitoring river levels during the rainy season, indicating an opportunity for policy to develop this as a risk reduction approach.
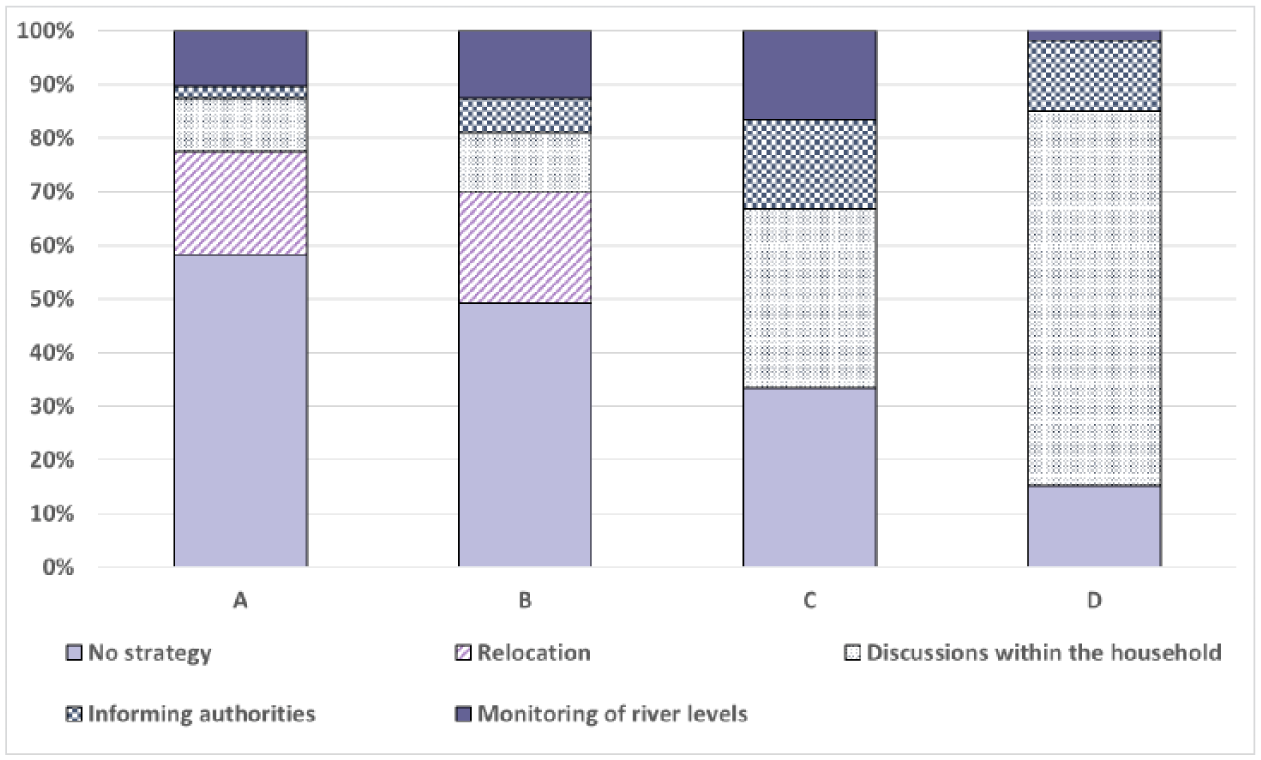
Proportions of different strategies used by households in different resilience classes in cases of flooding
Households in the most resilient class (D) consistently recorded the greatest decline in wellbeing when comparing components pre- and post-flood. This reveals the differential functioning of static and dynamic qualities of the absorptive capacity elements of resilience. Higher resilience pre-flood did lead to lower absolute impacts post-flood, but the highest degradation of wellbeing relative to lower resilience households. It would be important in future research to assess whether households are able to recover capacities. If not, the coping displayed by high resilience households will be shown to have undermined future capacity for resilience.
V. Conclusions
This paper has focused on analysis of the urban resilience components of a piloted methodology, an expanded version of the Household Economy Approach (HEA) adapted to an urban poor context. This focus on urban resilience is the principal innovation in this adaptation. Beyond this, however, the experience has shown the potential for nesting the existing HEA within a robust resilience assessment tool to allow both an urban context and comparability with rural HEA data to be taken into account for a joined-up rural–urban approach. Extracting the HEA data was beyond the scope of this paper. Future, additional analysis enabled by the methodology might include tracking components of resilience over time to measure their sensitivity to specific development or risk management interventions and environmental perturbations. Changes in the resilience status of households, or in the membership and relative size of resilience classes, may be especially valuable when undertaken alongside city-level assessments of resilience; these are becoming increasingly favoured by city and international planners. This would allow a bottom-up view to complement the city-level record and would identify any tensions, for example where high resilience at the city level might hide local concentrations of low resilience. This would allow evidence-based discussion of the trade-offs between local and city-level resilience.
The results for Niamey show differentiated resilience among the uniformly very poor sample population, a population that could not be easily disaggregated using the standard HEA wealth class approach. This adapted approach helps distinguish poverty from resilience as a policy domain. Across the sampled population, food diversity presented a challenge for household resilience. Indeed, due to the flooding, the number of households with a diversity score below 3 (poor nutrition) increased, while those where the score was equal to or above 6 (acceptable) decreased over time. After flooding, the greatest reduction in score was observed amongst the more resilient households, showing the nutritional diversity score to be very sensitive to flood impacts. With regard to social stressors, social support was skewed, with more resilient households having stronger linkages to formal organizations and less resilient households relying more on neighbours for support.
Unfortunately, many households reported being resigned to flooding but lacked strategies to fight against these shocks. Households in very low and low resilience classes were also the most affected and did not have a strategy to adapt. These households were less likely to report impacts of the flood to authorities and were more likely to resort to spontaneous relocation to cope with flood impacts.
The study has focused on household resilience, but additional work is required to draw out the impacts of external intervention. NGOs such as Save the Children delivered food to flood-affected households in 2015 and the state provided land for households that had relocated to re-build their homes in new sites. Households are reported to have acted strategically, so that while relocated households were offered alternative sites for permanent relocation, they were observed to prefer to return to the same flood-prone areas after the flooding, selling or renting their new land title as a livelihood strategy. The extent of this practice and its implications for future policy is a topic for further research.
In highlighting the multiple ways resilience is experienced, the work also points to the need for joined-up policymaking. In particular, results have shown the opportunities that could come from local government and NGOs working on land ownership, infrastructure development and maintenance, inclusiveness in decision-making processes, and support for maintaining income for poor households at risk. Resilience is revealed to be non-linear. Households measured as high resilience pre-flood recorded the greatest relative erosion in the status of food, nutrition and security, and the highest rates of savings reduction and debt uptake. This describes well the cushioning effect that absorptive capacity brings to higher resilience households. Less clear is how well households can recover absorptive capacity after it has been drawn on. Without recovery, households will move towards a lower resilience class. The 2015 rainy season and subsequent observed flooding was not extreme, yet even this exceeded the absorptive capacity of households from every resilience class. Further study to track longer-term status would allow monitoring of the ability of households to bounce back, or to bounce back better – as advocated by the Sendai Framework for Disaster Risk Reduction 2015-2030.
Further applications of the methodology could usefully review challenges that arose from the specification of resilience component indicators. In particular, the reliance on the views of household heads, while appropriate for a rough estimation of household resilience, did not allow for a fine-grained analysis of potentially significant differences within the household. Memory bias will have influenced recorded data on all aspects and points to the need for changes in shelter, education and health components. Methodological flexibility is a strength of the approach, but analytical detail has been sacrificed and additional applications should consider this.
Footnotes
Acknowledgements
This research is a result of collaboration among the University Abdou Moumouni in Niger, Save the Children UK, Save the Children Niger and King’s College London.
Funding
The work presented has been financed by a research programme funded by the UK Department for International Development (DFID) and the Economic and Social Research Council (ESRC), called Urban Africa: Risk Knowledge (Urban ARK).
1.
Save the Children (2008), The practitioners’ guide to the Household Economy Approach, London, available at ![]() .
.
2.
Issoufou, O H (2015), Urban profile: Flood risk areas and other risks in the city of Niamey (Niger), Working Paper 3 (translated from French), Urban ARK, available at http://www.urbanark.org/urban-profile-flood-risk-areas-and-other-risks-city-niamey-niger; also Soumana, B (2015), Background Paper: City Profile and Risk Context for Niamey, Niger, Working Paper 1 (translated from French), Urban ARK, available at ![]() .
.
3.
See reference 2, Soumana (2015); also Balla, A (2013), Proposition d’une stratégie nationale de réduction des risques de catastrophes au Niger (SNRRC), 39 pages; and Issaka, H (2010) « Mise en carte et gestion territoriale des risques en milieu urbain sahélien à travers l’exemple de Niamey (Niger) », PhD thesis in Geography, Université de Strasbourg, 347 pages.
4.
Issaka, H and D Badariotti (2013), « Les inondations à Niamey, enjeux autour d’un phénomène Complexe », Cahiers d’Outre-Mer Vol 26, pages 295–310.
5.
Spindler, A (2010), “Urbanization and Development in Niamey, Niger”, Southern California Policy Review Student Journal, available at ![]() .
.
6.
Niang, I, O C Ruppel, M A Abdrabo, A Essel, C Lennard, J Padgham and P Urquhart (2014), “Africa”, in V R Barros, C B Field, D J Dokken, M D Mastrandrea, K J Mach, T E Bilir, M Chatterjee, K L Ebi, Y O Estrada, R C Genova, B Girma, E S Kissel, A N Levy, S MacCracken, P R Mastrandrea and L L White (editors), Climate Change 2014: Impacts, Adaptation, and Vulnerability, Part B: Regional Aspects, Contribution of Working Group II to the Fifth Assessment Report of the Intergovernmental Panel on Climate Change, Cambridge University Press, Cambridge, UK and New York, USA, pages 1199–1265.
7.
Casse, C, M Gosset, T Vischel, G Quantin and B A Tanimoun (2016), “Model-based study of the role of rainfall and land use–land cover in the changes in the occurrence and intensity of Niger red floods in Niamey between 1953 and 2012”, Hydrology and Earth System Sciences Vol 20, No 7, pages 2841–2859.
8.
Casse, C and M Gosset (2015), “Analysis of hydrological changes and flood increase in Niamey based on the PERSIANN-CDR satellite rainfall estimate and hydrological simulations over the 1983-2013 period”, IAHS-AISH Proceedings and Reports Vol 370, pages 117–123.
9.
Ousmane, S (2014), Présentation des résultats d’étude sur la lestion du risque hydrologique : cas des inondations dans la ville de Niamey, CERMES-Niamey, 17 slides.
10.
Idrissa, S M (2016), Evaluation socio-économique de l’impact des inondations sur les conditions de vie des ménages dans la commune urbaine de Niamey.
11.
OCHA (2015), Snapshot inondations 28.08.2015, available at ![]() .
.
12.
Inter-réseaux (2013), Bulletin de Synthèse de Souvraineté alimentaire : La promotion de la résilience au Sahel : changement d’approche ou nouvelle mode ?, available at ![]() .
.
13.
Chambers, R and G R Conway (1991), “Sustainable rural livelihoods: practical concepts for the 21st century”, IDS Discussion Paper 296, Institute of Development Studies, Brighton, page 29, available at ![]() .
.
14.
Bremner, J, K Patterson and R Yavinsky (2015), « Vers une plus grande résilience grâce à la planification familiale : une approche transformatrice qui s’adresse aux femmes, aux familles et aux collectivités », Population Reference Bureau, available at ![]() .
.
15.
Holling, C S (1973), “Resilience and Stability of Ecological Systems”, Annual Review of Ecological Systems Vol 4, No 1, pages 1–23.
16.
Head, L (2010), “Cultural ecology: adaptation - retrofitting a concept?”, Progress in Human Geography Vol 34, No 2, pages 234–242; also O’Brien, K (2012), “Global environmental change II: From adaptation to deliberate transformation”, Progress in Human Geography Vol 36, No 5, pages 667–676.
17.
Béné, C, R Godfrey Wood, A Newsham and M Davies (2012), “New Utopia or New Tyranny? Reflection about the Potentials and Limits of the Concept of Resilience in Relation to Vulnerability Reduction Programmes”, IDS Working Paper 405, Institute of Development Studies, Brighton.
19.
See reference 15.
20.
UNDP Drylands Development Centre (2013), Community Based Resilience Assessment (CoBRA) Conceptual Framework and Methodology, 24 pages; also DFID (1999), Sustainable Livelihoods Guidance Sheets – Introduction, 10 pages, available at http://www.eldis.org/vfile/upload/1/document/0901/section1.pdf; Maxwell, D, B Vaitla, G Tesfay and N Abadiet (2013), Resilience, Food Security Dynamics and Poverty Traps in Northern Ethiopia, Analysis of a biannual panel data set, 2011–2013, Tufts University/Feinstein International Center, Somerville; and Scoones, I (1998), “Sustainable Rural Livelihoods: A Framework for Analysis”, IDS Working Paper 72, Institute of Development Studies, Brighton, available at ![]() .
.
21.
Frankenberger, T and T Spangler (2012), Enhancing Resilience to Food Security Shocks, TANGO International Inc.
22.
WHO (1996), World Development Indicators, Selected health indicators; also ADB (2004), Development Indicators Reference Manual, International classification, available at http://www.adb.org/documents/development-indicators-reference-manual-concepts-and-definitions; and Mitchell, T, L Jones, E Lovell and E Comba (2013), Disaster Risk Management in Post-2015 Development Goals: Potential Targets and Indicators, available at ![]() .
.
23.
Ahern, M, R S Kovats, P Wilkinson, R Few and F Matthies (2005), “Global health impacts of floods: epidemiologic evidence”, Epidemiologic Reviews Vol 27, No 1, pages 36–46.
24.
Putnam, R (2001), “Social capital: Measurement and consequences”, Canadian Journal of Policy Research Vol 2, No 1, page 41.
References
Supplementary Material
Please find the following supplemental material available below.
For Open Access articles published under a Creative Commons License, all supplemental material carries the same license as the article it is associated with.
For non-Open Access articles published, all supplemental material carries a non-exclusive license, and permission requests for re-use of supplemental material or any part of supplemental material shall be sent directly to the copyright owner as specified in the copyright notice associated with the article.