
Abstract
We project populations to 2100 for the world’s larger cities. Three socioeconomic scenarios with various levels of sustainability and global cooperation are evaluated, and individual “best fit” projections made for each city using global urbanization forecasts. In 2010, 757 million people resided in the 101 largest cities – 11 per cent of the world’s population. By the end of the century, world population is projected to range from 6.9 billion to 13.1 billion, with 15 per cent to 23 per cent of people residing in the 101 largest cities (1.6 billion to 2.3 billion). The disparate effects of socioeconomic pathways on regional distribution of the world’s 101 largest cities in the 21st century are examined by changes in population rank for 2010, 2025, 2050, 2075 and 2100. Socioeconomic pathways are assessed based on their influence on the world’s largest cities. Two aspects of the projections raise concerns about reliability: the unlikely degree of growth of cities suggested for Africa and the growth of cities in coastal settings (and likely global immigration). Trends and the effect of sustainable development on regional distribution of large cities throughout the 21st century are discussed.
I. Introduction
Large cities (metropolitan urban areas) are hubs of economic development and innovation, with larger cities underpinning regional economies and local and global sustainability initiatives. Larger cities tend to be more challenged by the “boundary issue”, except for Singapore. City boundaries are as ephemeral and arbitrary as other political boundaries; however, a systems approach to cities requires assessment of the overall urban agglomeration. Larger urban areas are often comprised of many smaller cities, e.g. metropolitan Sydney, Australia is administered by 38 local governments; Toronto, Canada by 29; Lagos, Nigeria by 16; and Jakarta, Indonesia by 10.
Urban agglomerations, or metropolitan areas, are typically defined through common employment- and commuter-sheds (extent of area in which people typically travel for regular employment). Consistent with: (i) Brinkhoff’s database;(1) (ii) citymayors.com; and (iii) the World Bank data on the 100 largest urban areas,(2) Kennedy et al.(3) define boundaries of the world’s 27 megacities (urban areas of more than 10 million people). In this paper the approach is extended to include all urban areas expected to have more than 5 million people before 2100 (online supplementary information (SI), Table S4). “Future Five” cities are those expected to have populations greater than 5 million by 2050 (122 cities) and 2100 (181 cities).
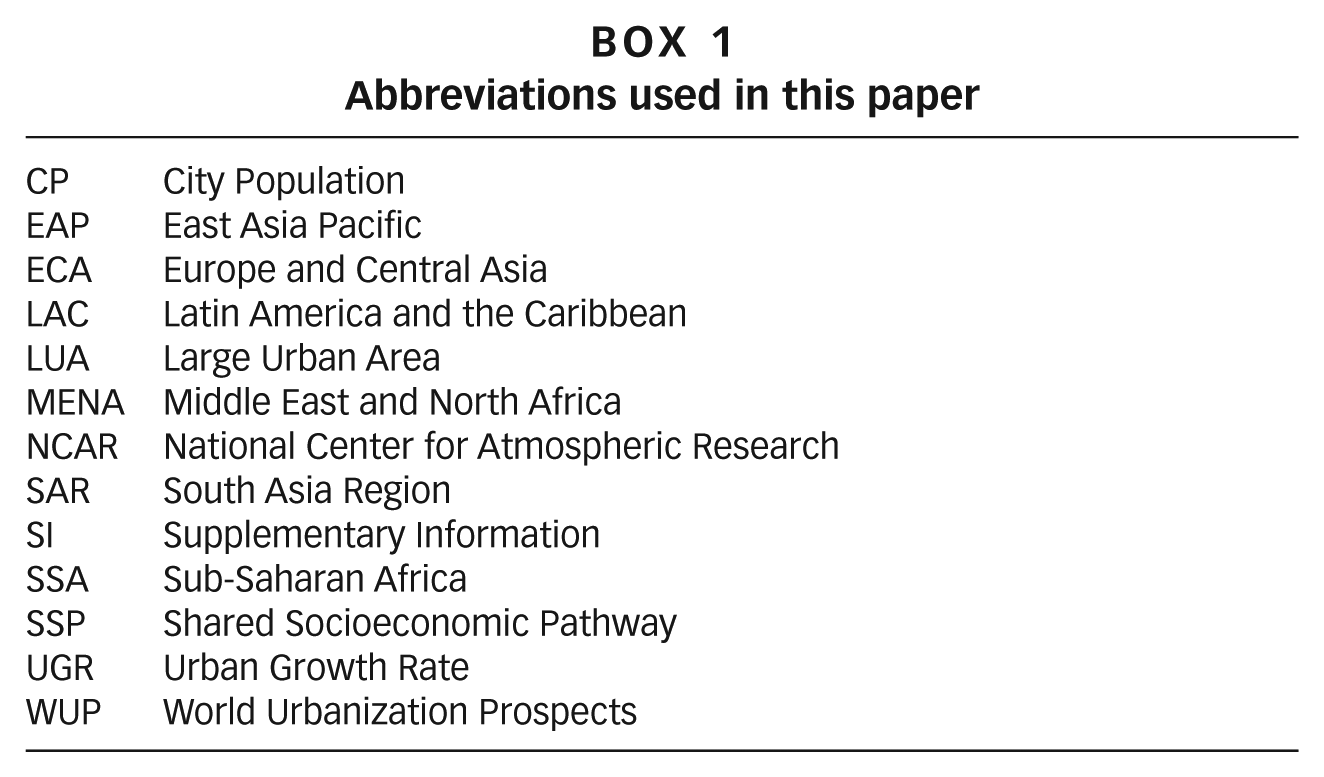
Abbreviations used in this paper
In 2010, the baseline year for this paper, 757 million people resided in the 101 largest cities, with a population of 36 million for the largest city (Tokyo), and 3.5 million for the 101st largest city (Addis Ababa); these cities were home to 11 per cent of the world’s population. By the end of the century, the world population is projected to grow by 6.9 billion to 13.1 billion; the percentage of people residing in the 101 largest cities is estimated to be 15 per cent to 23 per cent. In all scenarios, projected total populations in the world’s largest cities are growing.
When cities are governed and managed well, urbanization can be a powerful antidote to environmental degradation, as population density, and the effective provision of basic services, enables substantial gains in efficiency of resource consumption and waste management. Urbanization is also associated with higher rates of education and health care provision.(4) Urbanization, particularly through large cities, is a key driver of economic development.(5) Larger cities have a disproportionate impact on regional and global geopolitical power dynamics.(6)
Bettencourt(7) and Bettencourt and West(8) further promote the agglomeration of urban areas with minimal borders (e.g. barriers to travel, overlapping utilities), as they show that cities scale super-linearly (~1.15) for economy, while they scale sub-linearly (~0.85) for infrastructure costs. If externalities associated with increased density, e.g. congestion, are addressed, doubling a city’s effective size more than doubles the economy and wealth generation, with less than a doubling of infrastructure costs and material flows.(9)
Working with cities, instead of national governments, may offer urban practitioners a more straightforward approach to sustainable development as requirements and achievements may be easier to define and monitor, and a systems approach may emerge.(10) The Sustainable Development Goals and comprehensive global inventories such as greenhouse gas emissions can be down-scaled to larger cities.(11) Considering their sheer economic heft and material flows (and subsequent pollution), sustainable development globally is not possible without sustainability being firmly anchored in most of the world’s larger cities.
This report considers how socioeconomic scenarios of development may affect the world’s 101 largest cities, with the National Center for Atmospheric Research’s (NCAR’s) three basic “shared socioeconomic pathways” (SSP1, SSP2 and SSP3 – see below and SI for details).(12) The approach is expanded using the United Nations World Urbanization Prospects (WUP)(13) for predictions of urban growth in the larger urban areas (each city’s “best fit” growth, or decline, presented in SI). Synergies between the growth and development of the 101 largest cities and their effect on global sustainability are highlighted.
The Shared Socioeconomic Pathways (SSPs) are:
II. Materials and Methods
The World Urbanization Prospects(14) by the United Nations provide a detailed analysis of the global population growth and urbanization rates to 2050. The predictions are developed from current data on the urban–rural ratio and urbanization rate, as well as national birthrate and mortality rate. These are further projected to 2100 for each city (SI).
In an analysis of future growth scenarios by the National Center for Atmospheric Research (NCAR), various pathways of development are also analysed, including the effects on population growth and urbanization rates.(15) Population projections for each of the shared socioeconomic pathways complement WUP predictions by refining the definition of the urban–rural ratio and extrapolating national predictions to 2100 (Table 1).
Global population with various growth scenarios
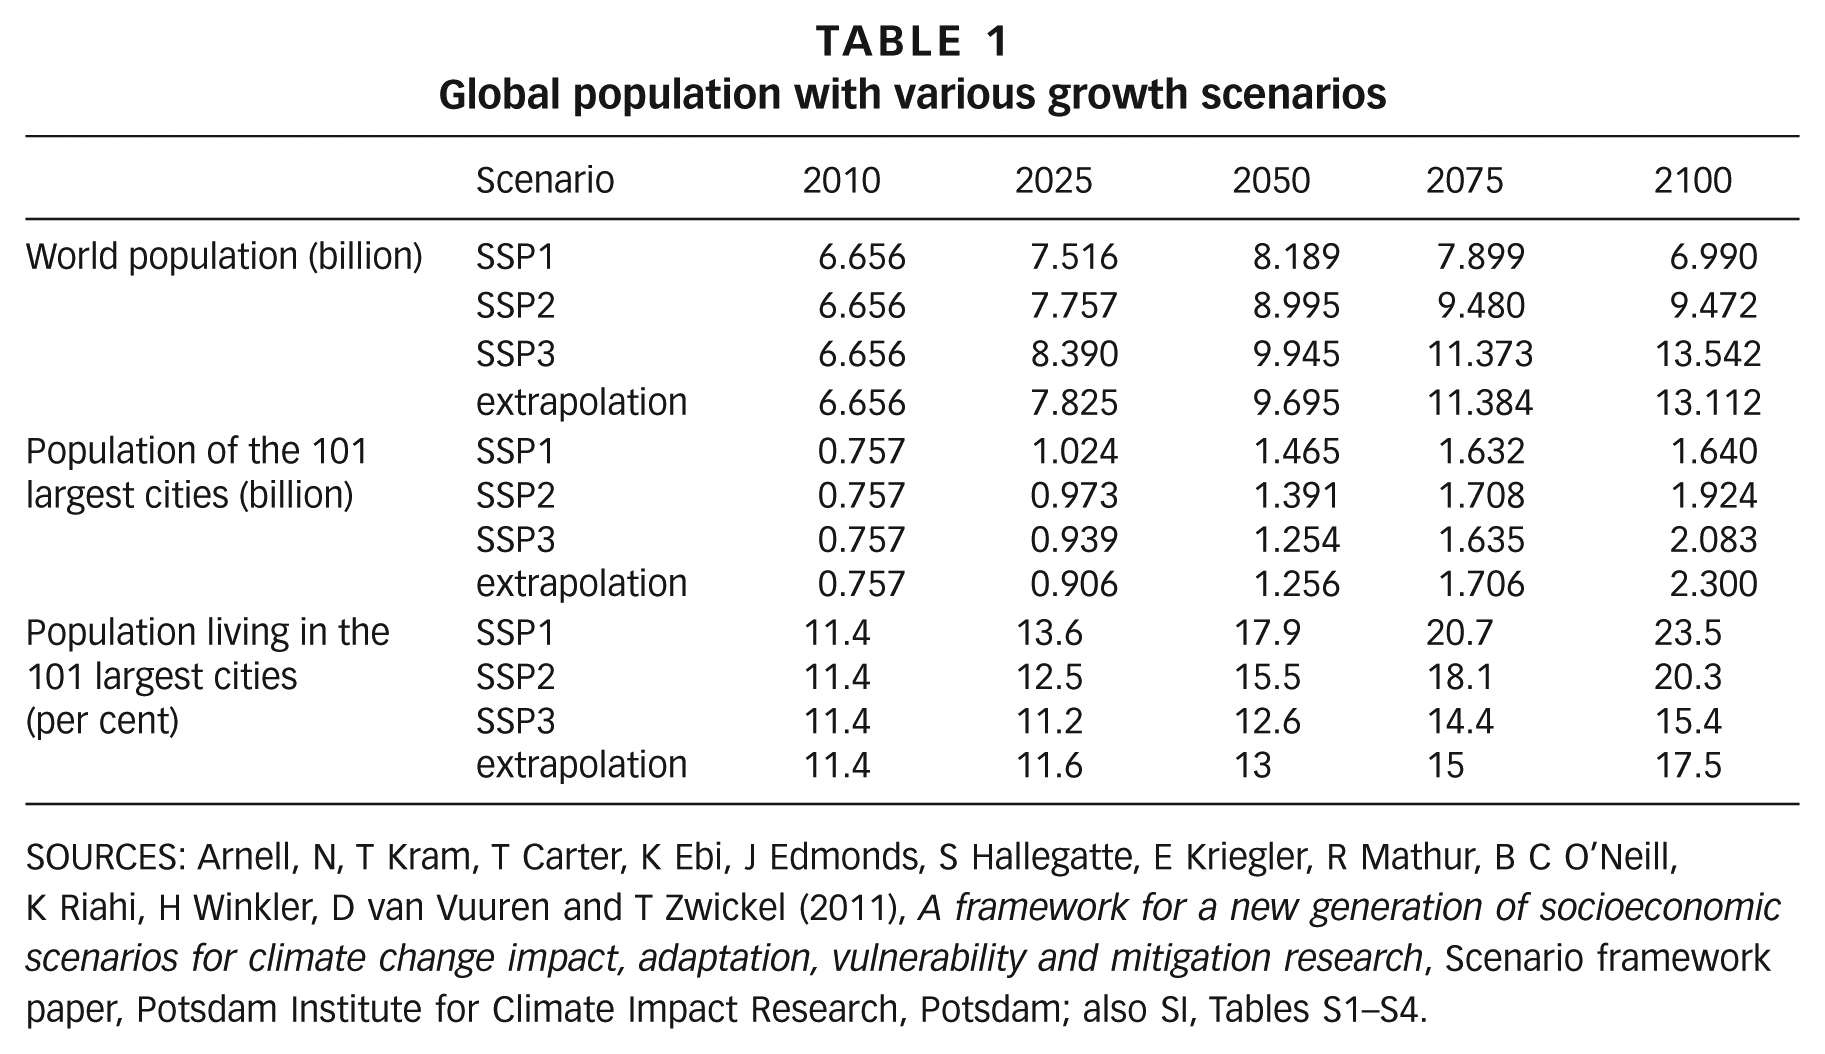
SOURCES: Arnell, N, T Kram, T Carter, K Ebi, J Edmonds, S Hallegatte, E Kriegler, R Mathur, B C O’Neill, K Riahi, H Winkler, D van Vuuren and T Zwickel (2011), A framework for a new generation of socioeconomic scenarios for climate change impact, adaptation, vulnerability and mitigation research, Scenario framework paper, Potsdam Institute for Climate Impact Research, Potsdam; also SI, Tables S1–S4.
As presented in Table 2, the main assumptions for population growth in the three SSP scenarios depend on the fertility, mortality, migration and education rates. In the SSP scenarios, low- and medium-income nations are categorized based on their current fertility rate, either high fertility (more than 2.9 children per woman) or low fertility (less than or equal to 2.9 children per woman). The third category consists of Organisation for Economic Co-operation and Development (OECD) and high-income nations. “High-income” countries follow the World Bank definition.(16)
Main assumptions for the SSP population predictions (by income)
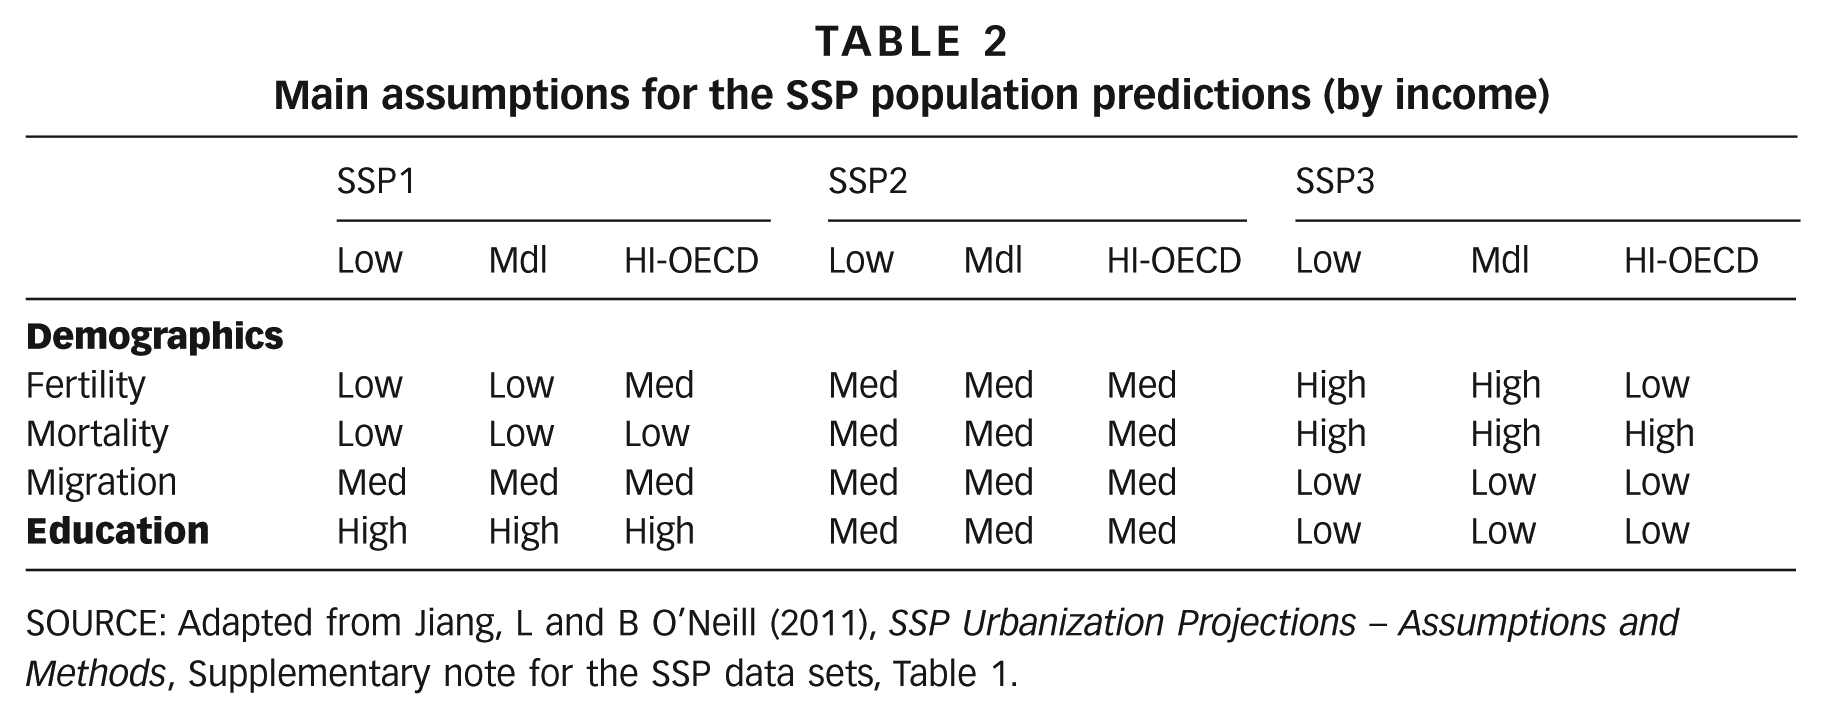
SOURCE: Adapted from Jiang, L and B O’Neill (2011), SSP Urbanization Projections – Assumptions and Methods, Supplementary note for the SSP data sets, Table 1.
Education rates are based on projections of the International Institute for Applied Systems Analysis/Vienna Institute of Demography (IIASA/VID); a “high rate” represents a scenario where school systems are globally expanded at the fastest possible rate, which is based on recent examples such as Singapore and South Korea. A medium rate represents a scenario where countries follow a similar path to other countries at a similar level of educational development, and a low rate maintains proportions of education at current levels. These assumptions describe an urbanization rate of fast, central and slow for SSP1, SSP2 and SSP3, respectively.(17)
In this paper, the research by the UN’s WUP and NCAR’s SSP is extended and refined to investigate the world’s 101 largest cities in the 21st century. Population changes of the world’s large urban areas (LUAs) are predicted by considering data on current city size, country population growth and country-specific urbanization rates. The 2010 city populations are obtained from the World Bank’s Building Sustainability in an Urbanizing World report.(18) Three different urban growth rate (UGR) schemes that correspond to different levels of sustainability of the socioeconomic pathways, as well as a refined extrapolation technique, are used to compare different scenarios and projections of global city growth. As presented in Table 3, the world population is determined from data by the IIASA,(19) and includes the population of 150 countries.
World’s largest cities (urban areas) by population (millions)
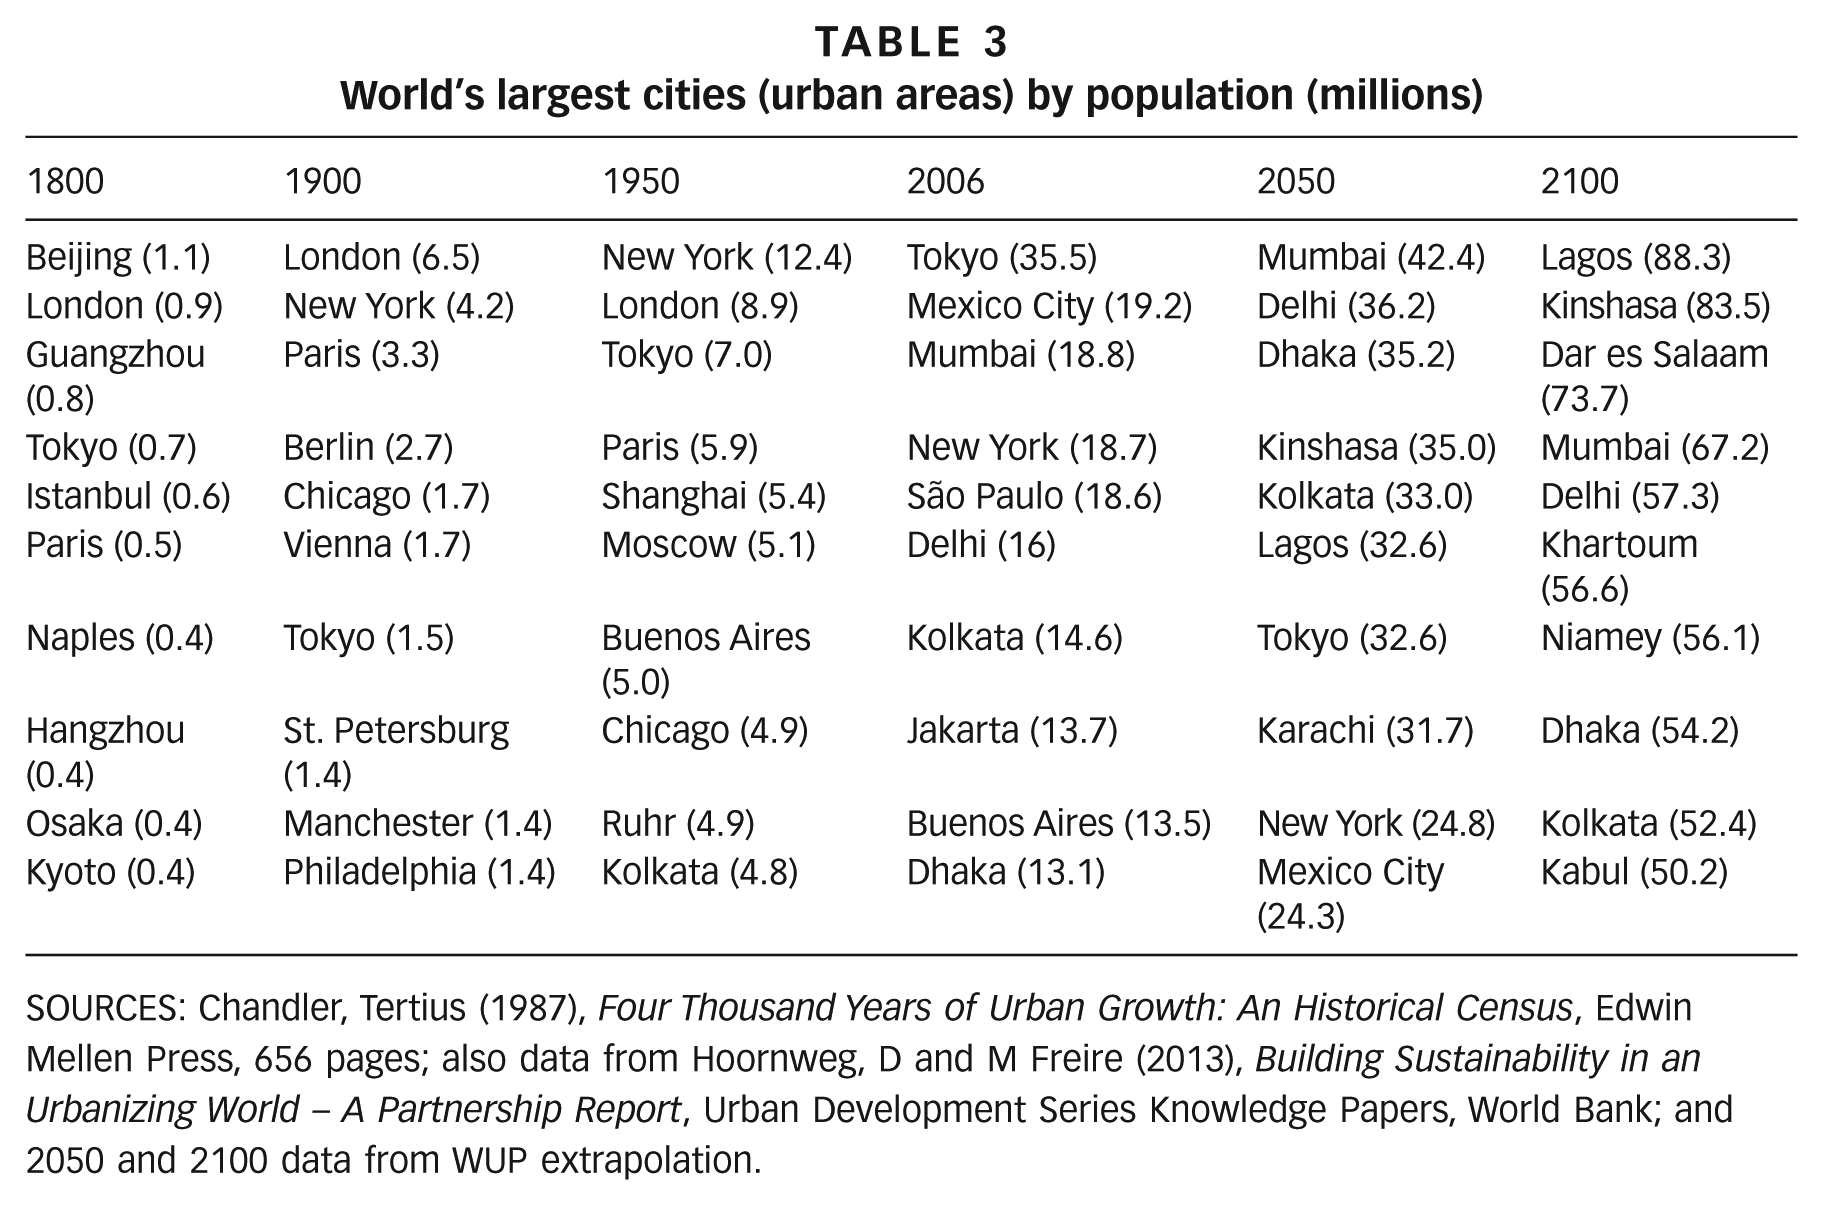
SOURCES: Chandler, Tertius (1987), Four Thousand Years of Urban Growth: An Historical Census, Edwin Mellen Press, 656 pages; also data from Hoornweg, D and M Freire (2013), Building Sustainability in an Urbanizing World – A Partnership Report, Urban Development Series Knowledge Papers, World Bank; and 2050 and 2100 data from WUP extrapolation.
Future city population is determined from the country-specific UGR, and the current city population (CP0):

where ∆YR represents the time (in years) to the prediction. The 101 largest cities are established from the population growth and urbanization rates predicted by the SSP1, SSP2 and SSP3 scenarios. Additionally, extrapolating WUP predictions provides a fourth predictive method, a linear extrapolation of the UGR for the current 1,000 largest cities, which identifies the potential largest cities. The larger cities, as predicted by the linear extrapolation of the WUP UGR predictions, are then further refined by considering four different extrapolation techniques (Figure 1): (i) exponential, (ii) polynomial (2nd order), (iii) constant, and (iv) linear.
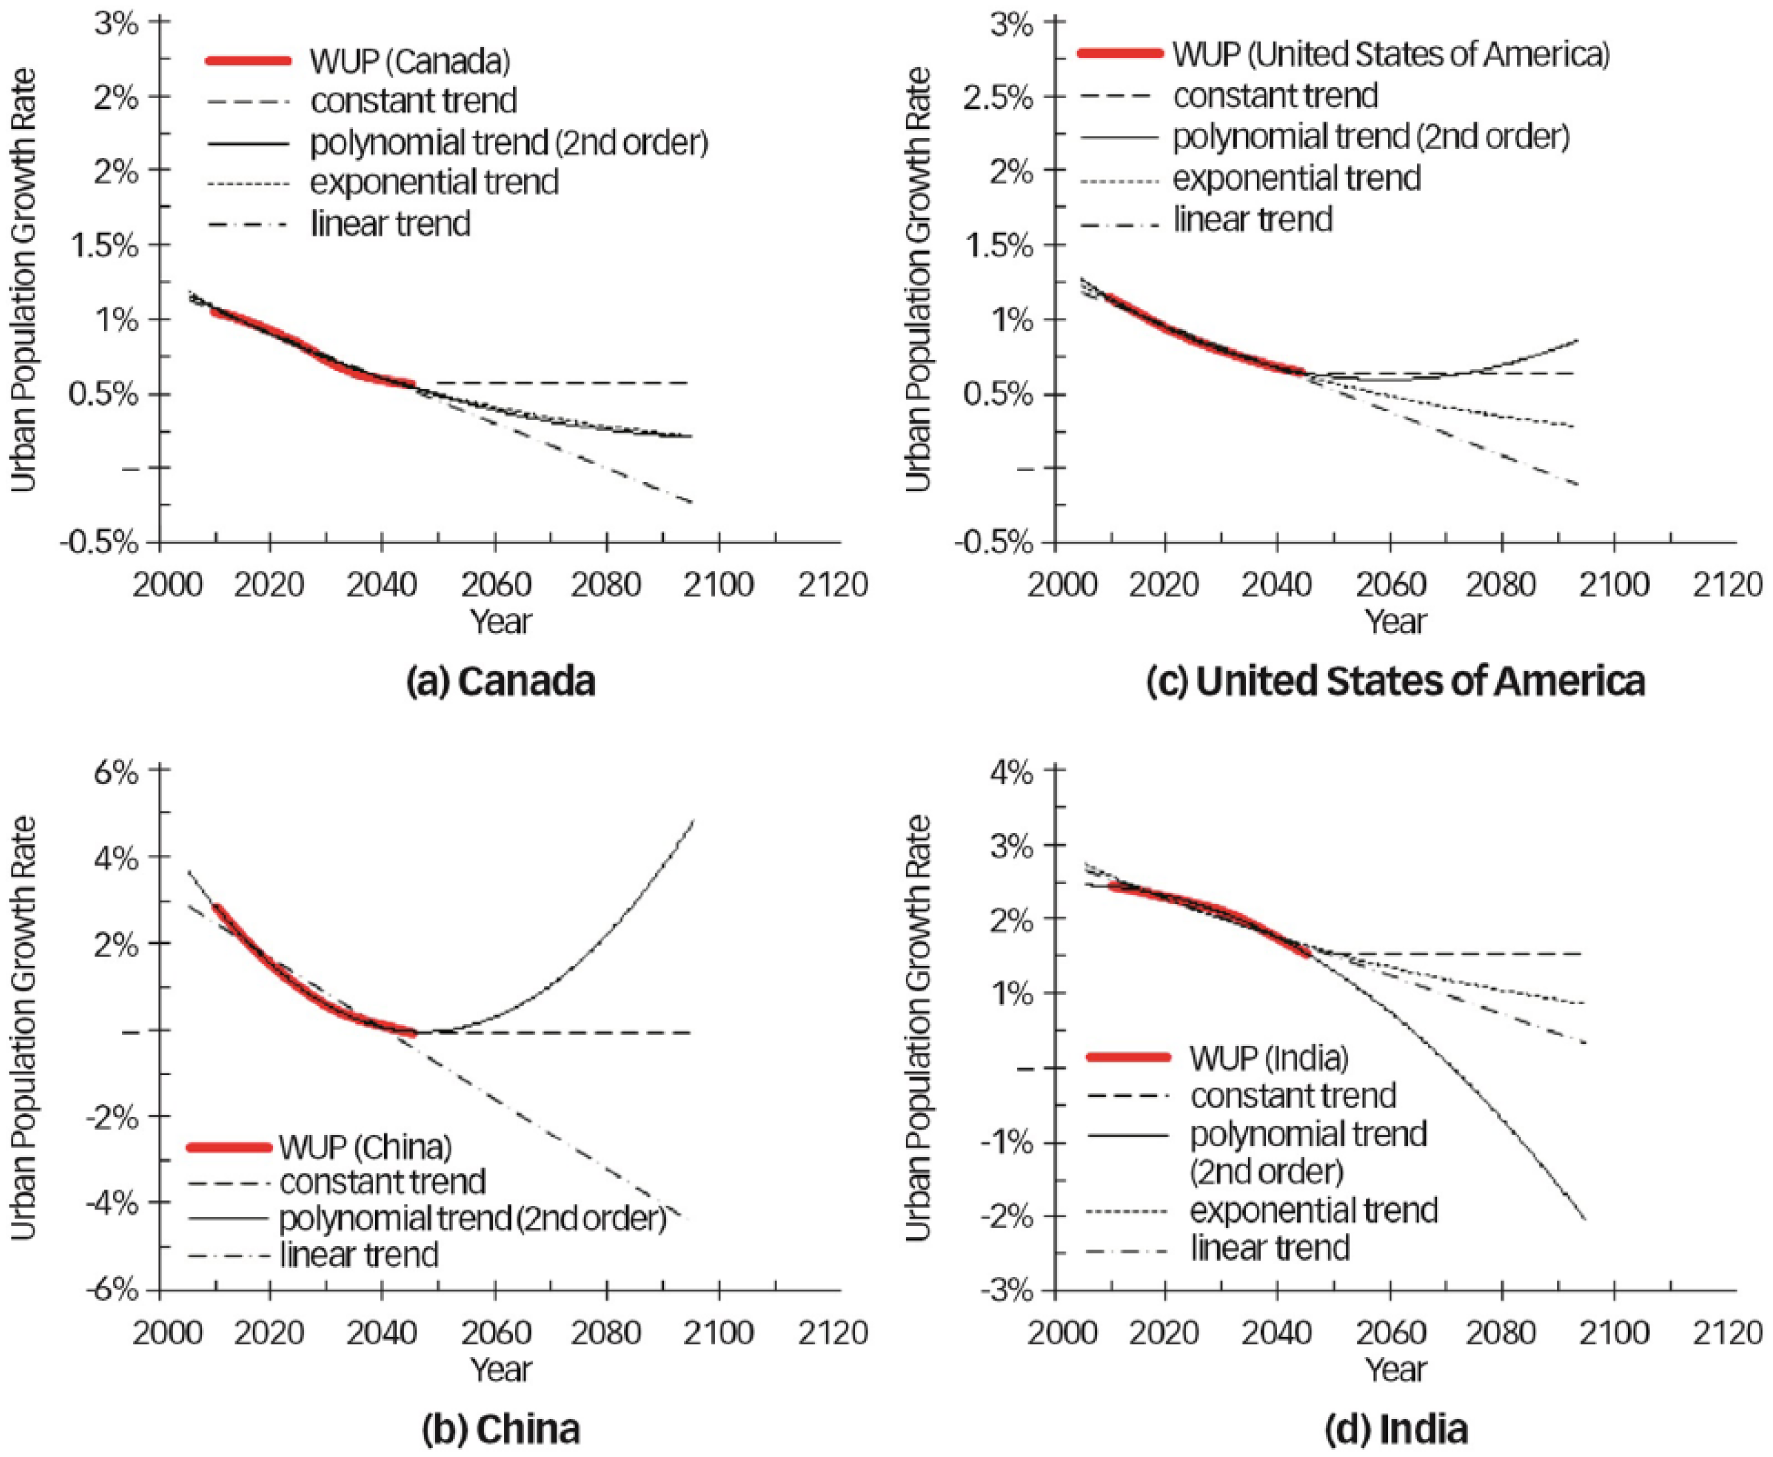
Examples of extrapolating WUP to 2100 for (a) Canada, (b) China, (c) the United States and (d) India
As illustrated by the red lines in Figure 1, the WUP predict urban population growth for each country to 2050. Four extrapolation techniques are overlaid onto the WUP projections and the “best fit” selected for 2050 to 2100. For example, the extrapolation technique selected for Canada is exponential, China is constant, the United States is exponential, and India is linear. The selection of extrapolation technique is based on WUP trends and likely growth scenarios based on level of urbanization and historical trends. Whenever appropriate, exponential extrapolation is selected as it offers a convenient way of representing the consistent and gradual reduction of the urbanization rate as city growth matures and the urban to rural ratio decreases.
The selection of the best fit extrapolating technique is intended to be an initial iteration in a series of refinements to predict country-specific urbanization rates. Also, examining the growth rate trends with different extrapolating techniques enables an appreciation of the sensitivity of the prediction, where a larger discrepancy between extrapolation predictions corresponds to lesser confidence in the predicted value. Countries that have a negative urban growth rate beyond 2050 cannot be represented with an exponential extrapolation. Details on the selection of the extrapolation technique for each city can be found in the supplementary information. Section V of the SI specifies the extrapolation technique used for each of the 101 largest cities as of 2010, as well as the urban growth rate for all of the countries containing these cities.
The narratives of socioeconomic pathways(20) provide important insights into various trajectories of development. These insights are used in this paper to identify the regional distribution of the world’s 101 largest cities throughout the 21st century. Identifying how different socioeconomic pathways affect the regional distribution of large cities is an important input to engineers and policymakers when developing more sustainable urban infrastructures that take into account anticipated resource scarcity and population pressures.(21) Population projections and urbanization rates for each socioeconomic pathway were developed by NCAR by predicting each pathway’s effect on education, mortality, migration and birth rates.(22)
a. Socioeconomic pathways and refined predictions for international city growth
Shared socioeconomic pathways (Figure 2) are summarized in NCAR’s supplementary note for the SSP data set and the International Institute for Applied Systems Analysis, SSP Database.(23)
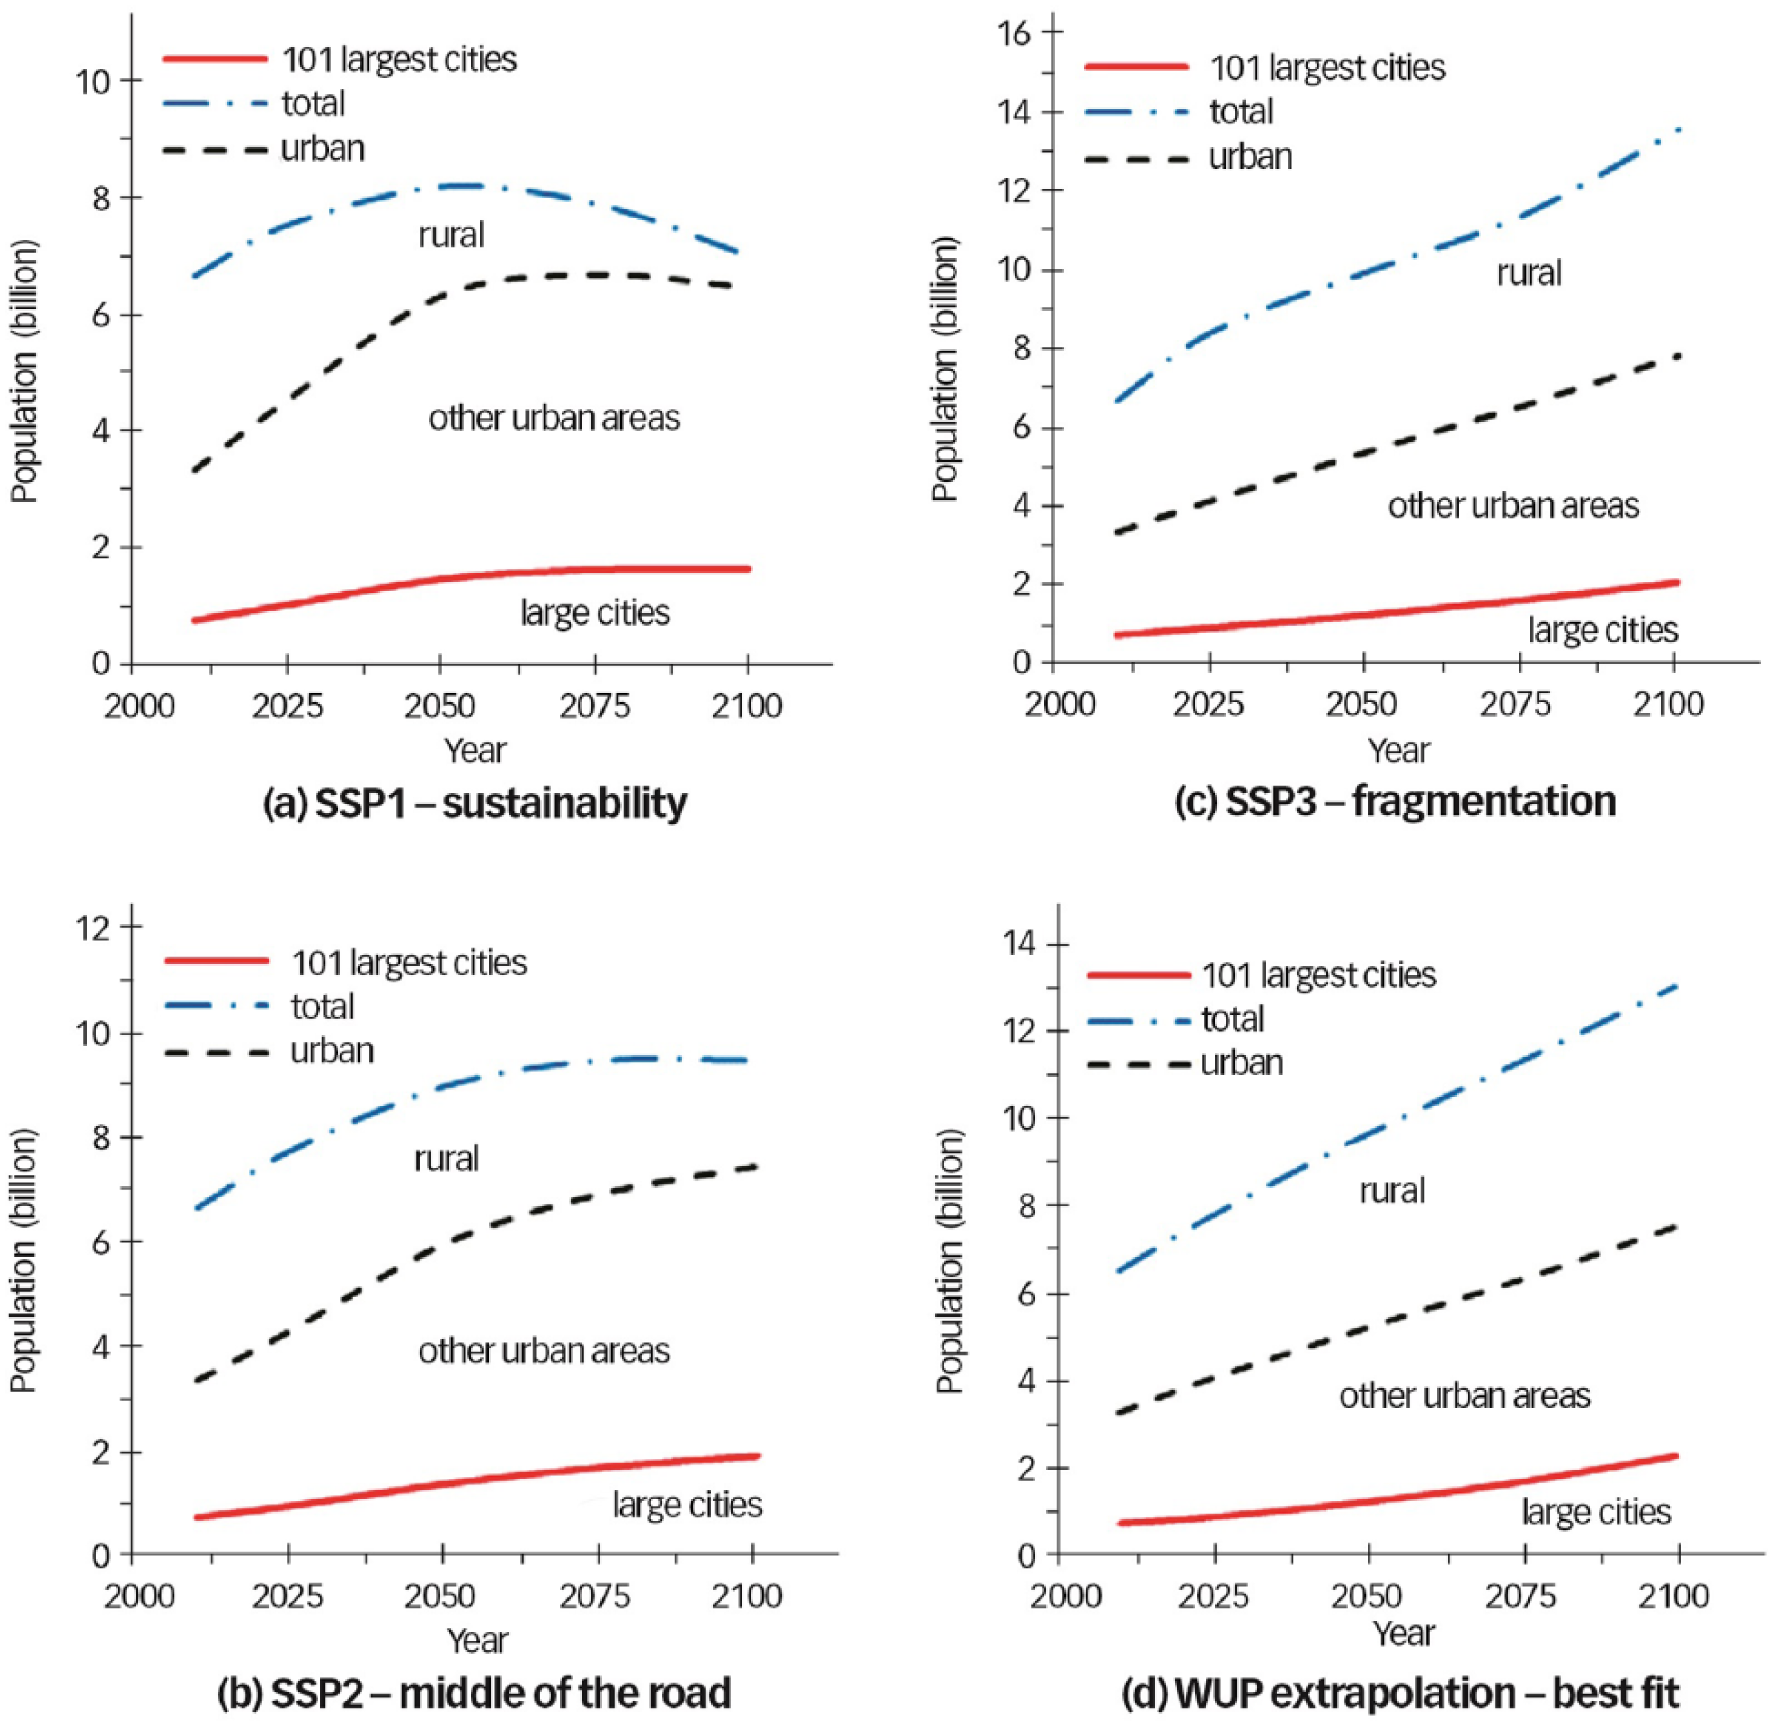
World population distribution in the 21st century for (a) SSP1, (b) SSP2, (c) SSP3 and (d) WUP extrapolations
The disparities in the three scenarios are striking, and suggest a degree of caution, especially in Africa, as populations by 2100 differ by more than 50 per cent among the scenarios. The socioeconomic pathways are further discussed in SI.
b. Defining city boundaries
There are various methods to define city boundaries. Without standard definitions, large urban areas are subject to substantial interpretation. Large urban areas (metropolitan areas) can be made up of as many as 50 local governments. Analysis of public policy and resource consumption at the metropolitan scale can capture broader economic trends and potential scale benefits in areas such as energy, transportation, water supply and waste management.
The approach used to define urban boundaries, as explained in Section I, was extended for all urban areas expected to have more than 5 million people before 2100 (SI, Tables S1–S4). Rather than decide which cities to include, a (slightly) less arbitrary approach was used, and all cities expected to have populations greater than 5 million by 2050 as projected under the WUP are included.
According to the UN World Urbanization Prospects (2012), the primary methods to define a city boundary are administrative and population size/density, followed by urban and economic characteristics. Typically, these methods are used in combination with each other, and a unique, and variable, border emerges for all larger urban areas. A practical, precise and consistent city boundary is important for city planning and management. The city borders presented here are expected to be regularly refined, ideally by respective governments (local, regional and possibly national). A map of each urban area is needed, as well as consensus on the extent of all larger cities.
c. 21st century large city growth
Humanity is on an inexorable urbanization path that largely originated in 19th century Europe, the Americas and parts of Asia, and will likely culminate in Africa at the end of this century. Urbanization is a powerful driver of sustainability: as affluence increases, basic services can be provided more efficiently in an urban setting. This is especially the case as density increases, although vulnerabilities can also increase as city size and density increase. Urbanization also tends to provide greater wealth, particularly to urban residents. Many of the more intractable challenges, such as climate change and biodiversity loss, have their roots in purchasing habits of the affluent.(24) Sustainability in the 21st century will largely be about the purchasing habits and infrastructure development of the world’s next 2.7 billion urban residents.(25)
The relative size of cities may have an impact on sustainability, as city size affects economic development and resource consumption.(26) SS1 (sustainability) is predicated on the fastest and greatest growth of large urban areas relative to the other less sustainable scenarios, assuming resilience increases commensurately with city size (Figure 3A).
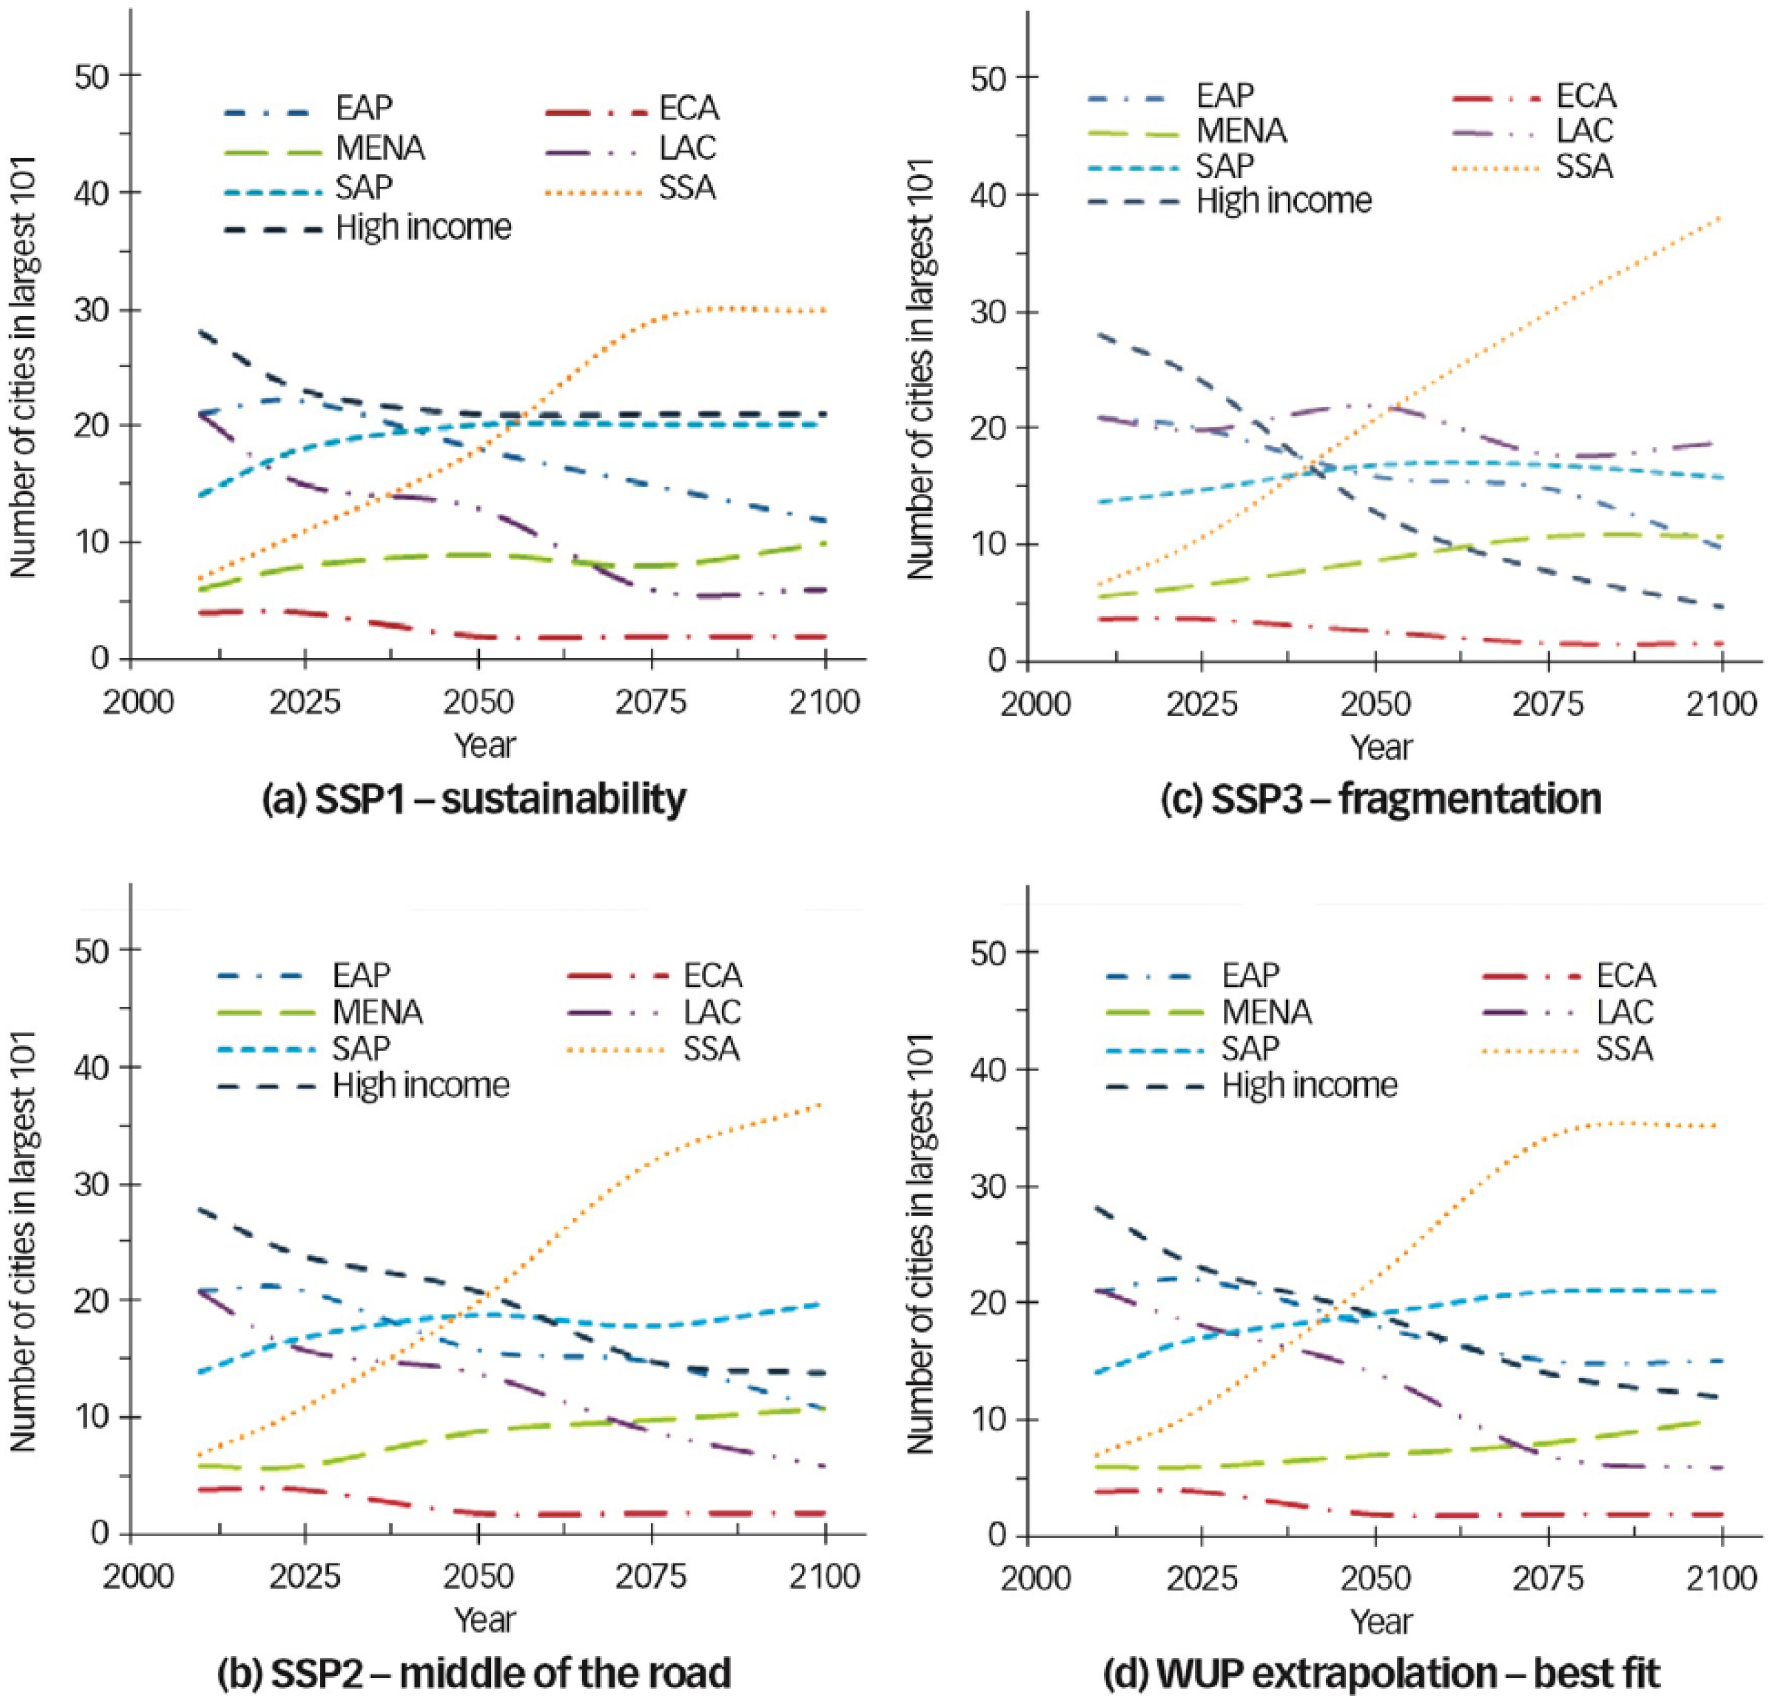
Regional number of cities in the largest 101 for (a) SSP1, (b) SSP2, (c) SSP3 and (d) WUP extrapolations
d. Sustainable development and large city rankings in the 21st century
Applying the socioeconomic pathways to city growth predictions provides several insights into the world’s largest urban areas in the 21st century. As illustrated in Figures 3 and 4, global regions exhibit different levels of sensitivity to each socioeconomic pathway, with high-income countries exhibiting the greatest variability in the range of pathways.
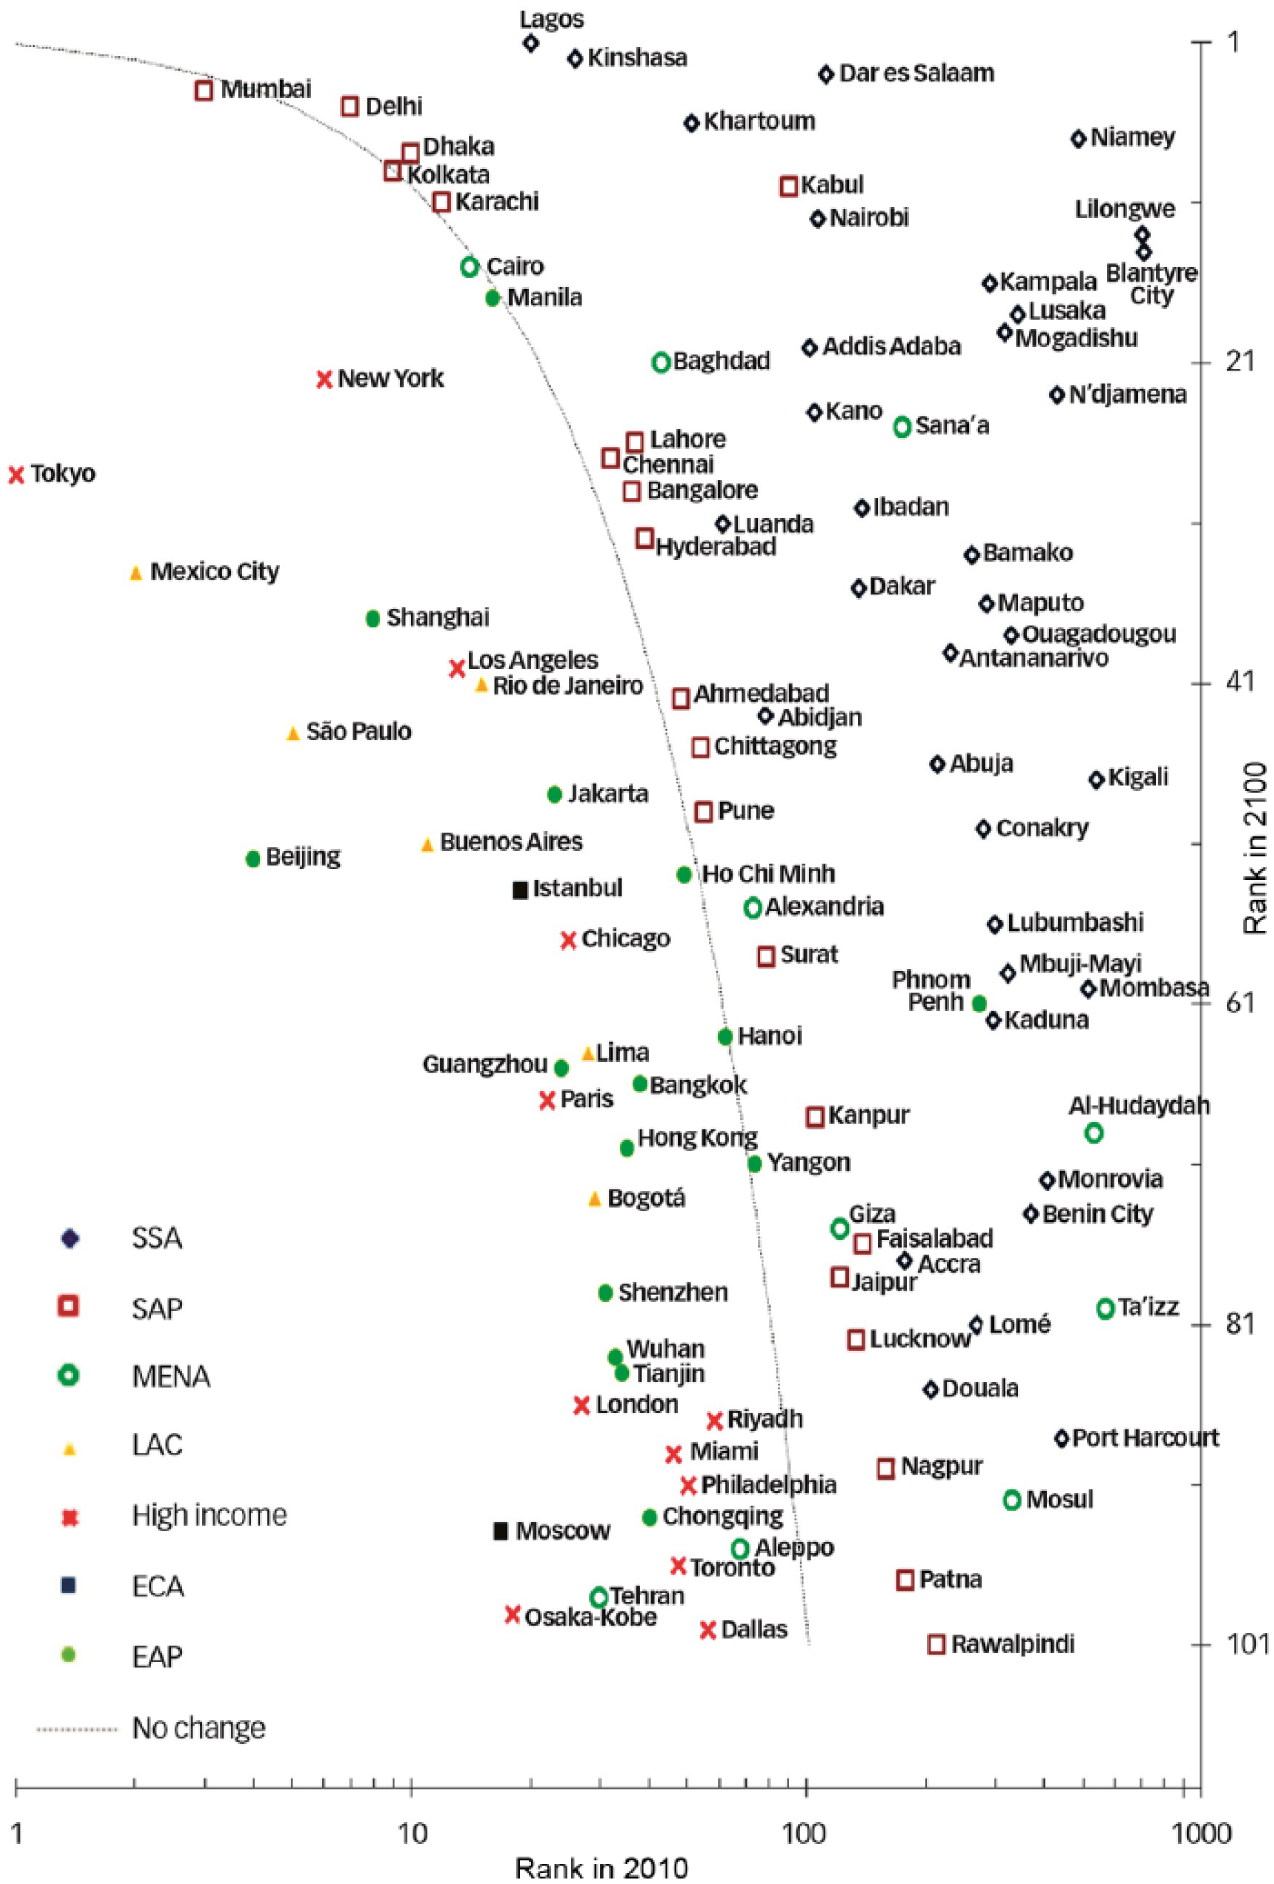
Predicted rise of the 101 largest cities by 2100 (WUP extrapolations)
Cities from South Asia exhibit a tendency to maintain consistent numbers of large urban areas for all pathways, with the majority of South Asia Region (SAR) cities maintaining a relatively consistent rank throughout the century, in all pathways. Sub-Saharan Africa (SSA) exhibits the most significant change in numbers and rank of the largest cities.(27) In 2010 this region has seven cities in the 101 largest, which increases to 30 and 38 in 2100, for SSP1 and SSP3, respectively. In all pathways, SSA is the region with the highest number of cities in the 101 largest in 2100 (SI, Table S5). This trend increases regardless of the degree of sustainability in the development pathway.
Figure 4 ranks each city’s size in 2010 compared to its rank in 2100. Along the horizontal axis, a log scale is used to identify the city’s rank in 2010, with the vertical axis representing the city’s rank in 2100. The curved dotted line represents cities that have not changed in rank. Cities that are below and to the left of the line will drop in rank in 2100 compared to 2010, and cities above and to the right will rise in rank. The log scale on the horizontal axis causes the horizontal distance from the line to show a greater discrepancy between the city’s current rank and its rank in 2100. The data point for each city is arranged according to its region: Latin America and the Caribbean (LAC), Middle East and North Africa (MENA), Sub-Saharan Africa (SSA), East Asia Pacific (EAP), Europe and Central Asia (ECA), Organisation for Economic Co-operation and Development (OECD), or South Asia Region (SAR).
In the 21st century, the majority of high-income cities, and all North American cities, are predicted to fall in rank in all pathway predictions. In the unsustainable development pathway (SSP3), only five high-income cities remain in the 101 largest in 2100: two cities in Saudi Arabia (Riyadh and Jiddah); Tokyo, Japan; and two cities in the United States (New York and Los Angeles). In SSP3, New York and Los Angeles drop from 6 and 13 in 2010, to 48 and 87 in 2100 respectively, and Tokyo falls from 1 to 60. The number of high-income cities that fall from the list of 101 largest cities is reduced with the more sustainable pathways SSP1 and SSP2, with 21 and 14 high-income cities, respectively.
Cities in EAP show a consistent drop in rank that is relatively independent of the socioeconomic pathway, dropping from 21 in 2010 to approximately 11 in 2100. However, LAC and high-income cities show the largest variability between the NCAR city projections and the refined WUP extrapolations. The extrapolated WUP analysis predicts all 10 largest cities in 2100 to be in SSA and SAR, and 35 and 21 of the largest cities in 2100 to be located in SSA and SAR, respectively. Countries in LAC, EAP, ECA and the high-income grouping consistently drop in rank between 2010 and 2100, with SSA countries exhibiting the largest rise in rank followed by SAR and MENA. In the WUP extrapolations, 15 cities from LAC and 16 cities from high-income countries drop out of the list of the 101 largest cities before 2100 (Table 4).
101 largest cities with WUP extrapolations
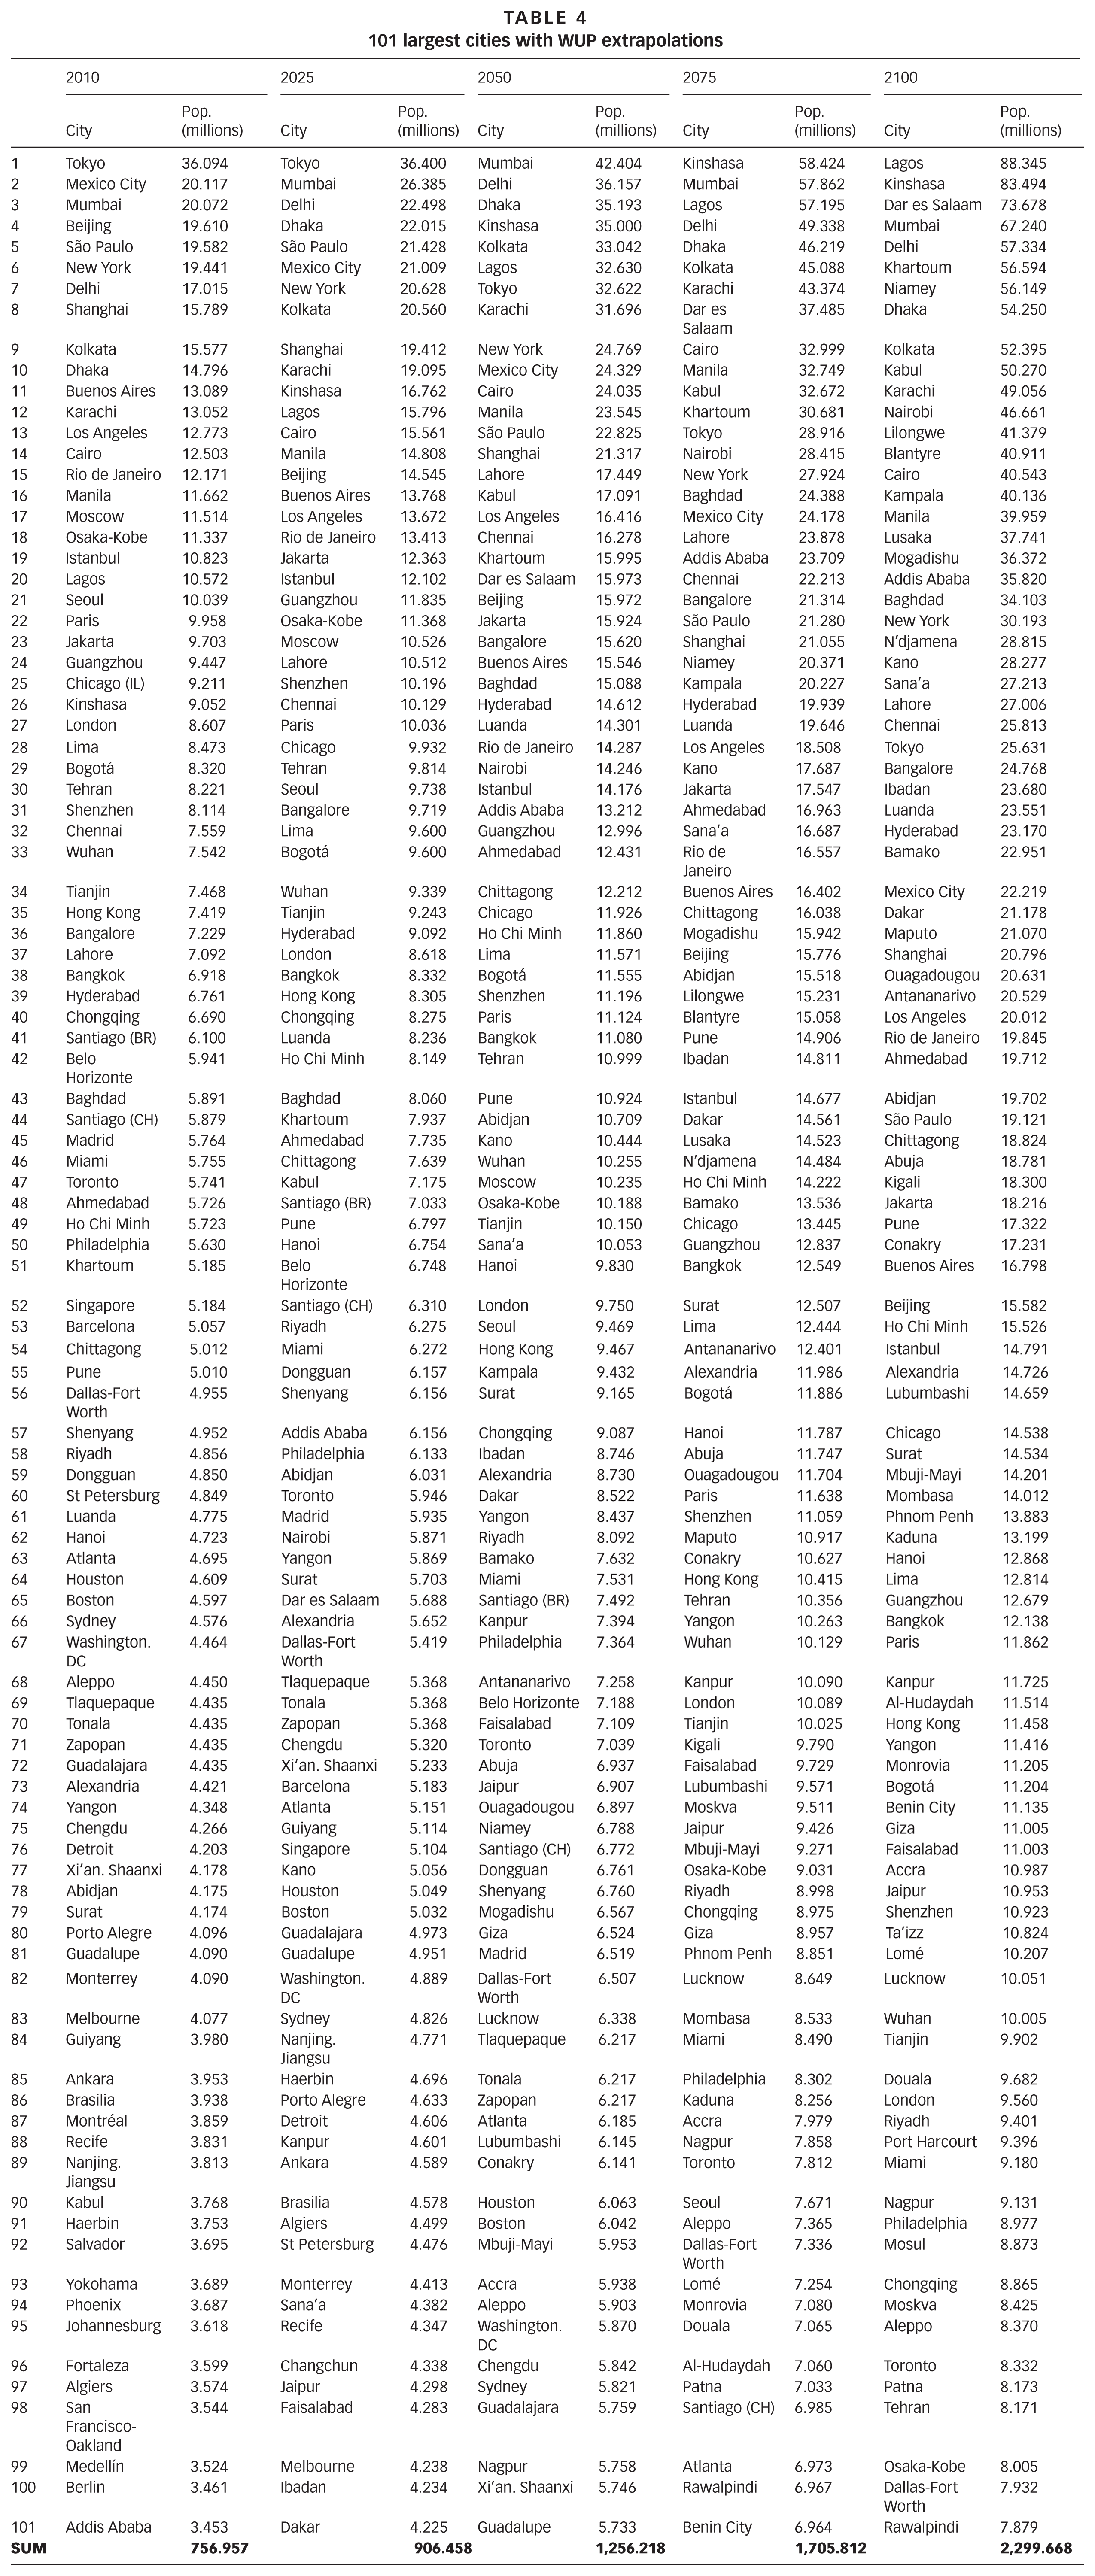
Predicting population growth of cities is fraught with uncertainties, especially beyond 2050. Several researchers consider it unlikely that the world population will stabilize this century.(28) However, because much of today’s infrastructure and resource development investments have planning horizons in excess of 50 years, credible “best fit” projections are necessary. Using WUP extrapolations (Figure 2D) as a possible scenario, a global population exceeding 12 billion by 2100 can be used as a cautionary approach until new information revises estimates. Estimates need to be regularly adjusted as data improves. Regional rankings are important as these often portend geopolitical and resource allocation dynamics.
III. Results: Key Findings
The reliability of data remains a concern. A consistent and explicit definition of each large urban area is needed for more accurate and reliable data collection. Estimates in this paper should be seen as educated guesses; however, they are sufficiently robust to influence critical infrastructure development in key cities.
What the data reveals is that regardless of socioeconomic scenarios, sub-Saharan Africa would have the most dramatic rise of large urban areas, growing from 7 in 2010 to approximately 20 in 2050 and over 30 in 2100. In all scenarios, by 2100 the SSA region will have the most cities in the largest 101 (ranging from 30 to 40). Current low urbanization rates are not consistent with scenario projections: the urbanization of Africa will have a significant impact on future sustainability. There will be far-reaching benefits to ensuring that sub-Saharan Africa and other developing regions optimally progress, with enhanced local economic opportunity and adequate infrastructure, education and social policy, to curb population growth and resource depletion.
Along with African cities, coastal cities are key sites of urban growth. Almost half of the larger cities are coastal, and some 25 are located in seismically active regions. Urban resilience is especially critical to long-term growth scenarios for these cities.
Regarding the effects on high-income areas, globally, an unsustainable socioeconomic pathway (SSP3 – fragmentation) has a dramatic effect on the rank of the largest cities in high-income regions. “Fragmentation”, i.e. unsustainable development, significantly reduces the number of high-income cities in the largest 101 (21 in SSP1 vs. 5 in SSP3 in 2100). In the 21st century, most high-income countries and their number of cities will decline in rank, relative to cities from low- and middle-income countries, especially if a more sustainable development trajectory is not followed.(29)
A more sustainable socioeconomic pathway would correspond to a higher fraction of the global population living in the 101 largest cities, compared to a less sustainable pathway. Larger, faster-urbanizing cities promote sustainable development. Different socioeconomic scenarios apply very different growth pressures to large cities (Table 5). Lagos’ projected population in 2100, for example, varies from 61 million to 100 million (SSP1 vs SSP3). Depending on the path of development, the world population could range from 7.5 to 8.3 billion in 2025, 8.2 to 9.9 billion in 2050, 7.9 to 11.4 billion in 2075, and 6.9 to 13.1 billion in 2100, with more sustainable progress favouring lower population predictions.
Population projections of the 10 largest cities in 2025. 2050. 2075 and 2100
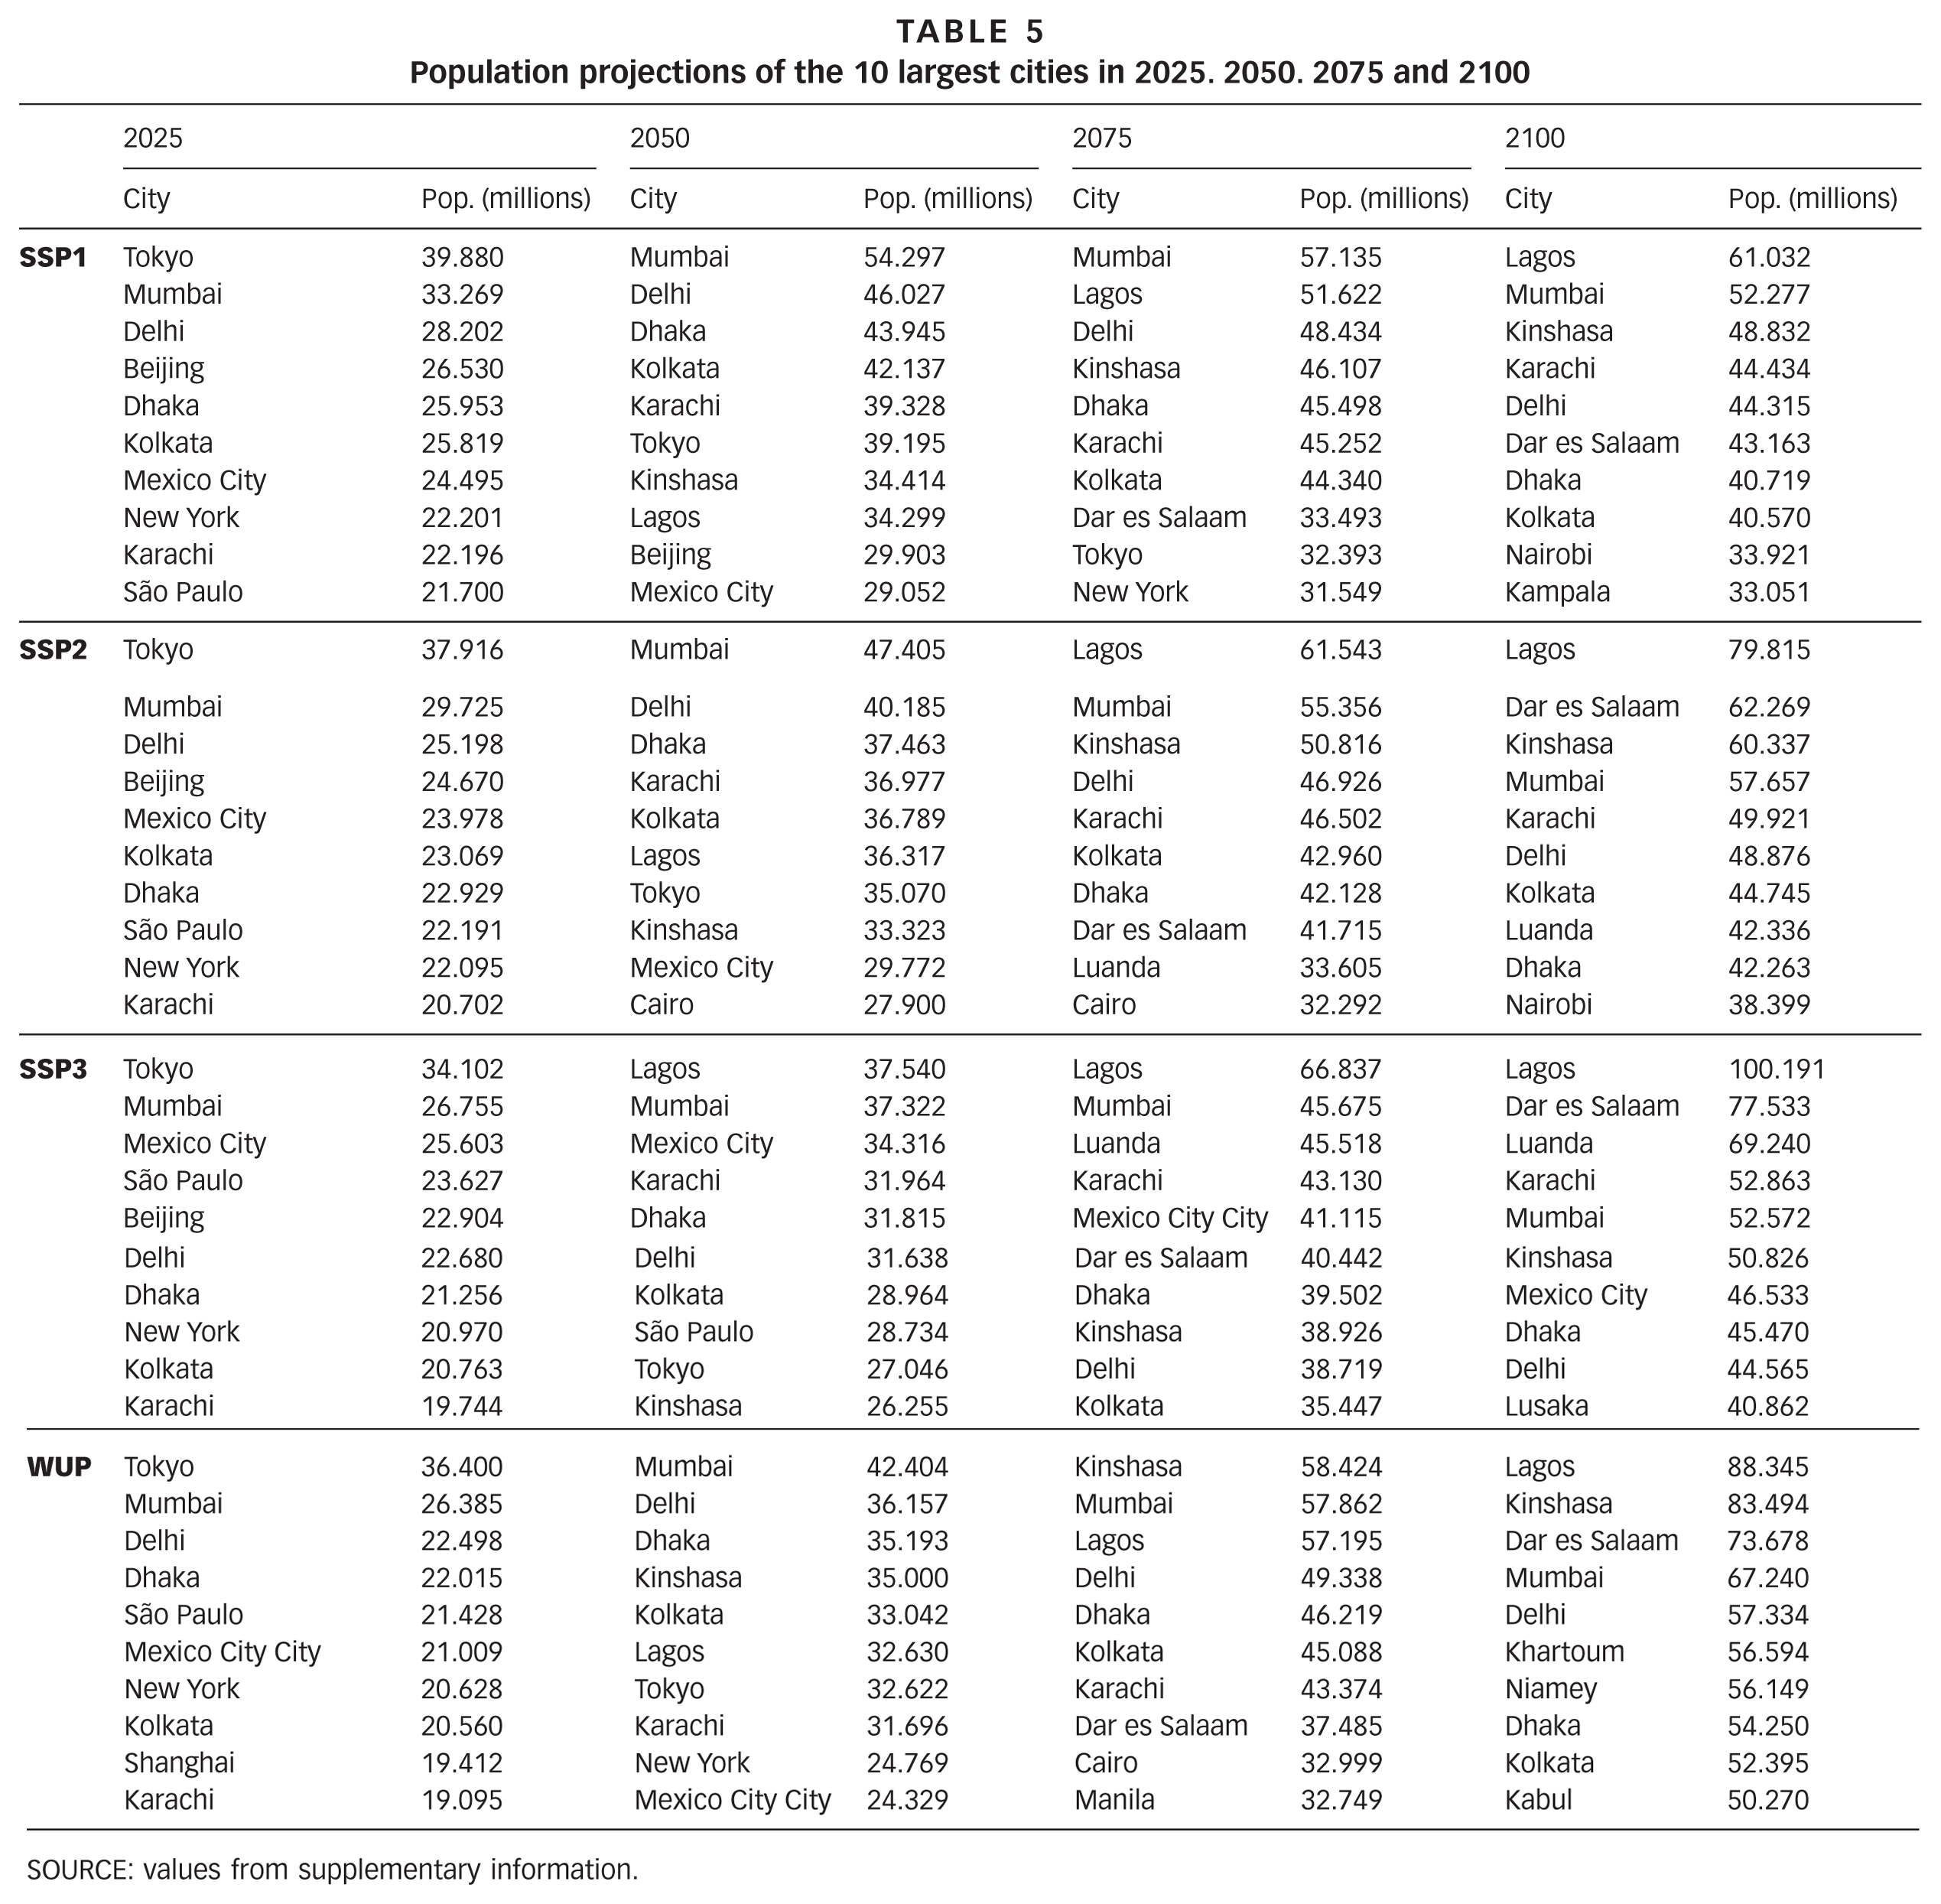
SOURCE: values from supplementary information.
In all scenarios, the urbanization growth rate between 2010 and 2025 has significant implications for the urbanization rates in 2075 and 2100, with larger city growth in the first part of this century leading to more sustainable conditions after 2075. Cities may emerge as polycentric nodes of governance.(30) To date, the world is not on SSP1 – a sustainable scenario. Strategic development of the current and future larger cities that promotes resource efficiency, as well as cooperation within and across global urban areas, is essential for sustainable development.
IV. Discussion
The size and shape of 21st century cities will determine much of the overall attainment of sustainable development. Various growth and sustainability scenarios (SSP1, SSP2 and SSP3) highlight the influence that urbanization and the world’s larger urban areas have on total global population, resource consumption, and quality of life. Greater sustainability (SSP1) is characterized by a faster rate of urbanization, especially of larger cities (Figure 2A). This scenario suggests a total global population around 8 billion, peaking in 2050. Compare this to the fragmentation scenario (SSP3 – Figure 2C) where the total population does not peak before 2100, and likely exceeds 14 billion.
Projecting city growth, typified by Lagos growing from 10.6 million in 2010 to 88.3 million in 2100, calls for a healthy measure of scepticism; many variables could change. Projections used here are linked to the 2050 WUP city estimates that, especially in Africa, are suspect, and here these projections are extended for yet another 50 years, suggesting caution in their use.
Africa’s projected city growth is striking. For example, among Tanzania, Niger, Kenya, Malawi, Uganda, Zambia, Somalia, Chad, Mali, Senegal, Mozambique, Burkina Faso, Madagascar, Rwanda, Guinea, Liberia, Ghana, Togo and Cameroon (as well as Cambodia), none of these countries had a top city in 2010, yet all are projected to have at least one in 2100. Each country has a projected rate of urban population growth (SI, Section V), and despite this estimate being relatively conservative, significant city growth is still projected. Niamey, Niger for example is projected to grow from under 1 million inhabitants today to 56 million in 2100. Growth rates like these appear overstated, especially in one of the world’s poorest countries with an insufficient economic base to support this rate of urbanization. However, in that same timeframe, under the UN medium fertility variant, Niger’s population is projected to grow from 15 million to 210 million.
How these newly enlarged cities will be governed is also critical. Managing a city in excess of 50 million inhabitants is a daunting task, especially as many of these cities are woefully under-serviced today. Sixty-five years is a relatively short timeframe with regard to urban infrastructure. Much of it, e.g. London’s Underground and Rome’s streets, is long-lived and can take decades to develop.
A key driver of dampened urban growth may be climate change and rising sea levels.(31) Forty-seven of the projected 101 largest cities in 2100 are coastal, including the three largest cities: Lagos, Dar es Salaam and Mumbai. However, in the absence of more accurate population projections, estimates are important. Infrastructure and resource development plans are developed with time horizons extending to the end of this century. Long-lived, large-scale urban infrastructure is being planned and built with future population estimates; these estimates should be clearly available and consistently used. Pending regular updates and refinements on urban area borders, the projections in this paper are considered a starting point.
China is expected to experience a relatively large drop in the number of largest cities as overall population growth slows from 2030 onward. The size of cities will remain relatively consistent in the second half of the century; however, as many cities in regions like South Asia and Africa are growing considerably, the relative ranking of Chinese cities will decline. China, with its large economy, may consolidate the urban population in a few targeted cities. Population projections of Chinese cities may also be conservative as migrant workers might not be included in population estimates.
Concerns with suggested findings are most apparent in sub-Saharan Africa, where the extreme growth rates for cities are not supported by current urbanization rates.(32) Potts highlights how in many African countries urbanization rates are well below what is commonly believed. Urbanization rates in the cities of countries like Côte d’Ivoire, Central African Republic, Kenya, Malawi, Nigeria, Tanzania, Zambia and Zimbabwe are often lower than overall national population growth rates and historically below 3 per cent per year for most. Africa’s low urbanization rates are mostly attributable to the lack of commensurate economic development.(33) A major change to this phenomenon is not yet evident; also, some 70 per cent of Africa’s urbanization is taking place in secondary cities.(34)
Despite these concerns, with low rates of African urbanization in primary cities, the average aggregate population of the world’s 101 largest cities is still projected to increase from 757 million in 2010 to 2.3 billion in 2100: a three-fold increase in average city size. The “average” large urban area would increase from 7.5 million in 2010 to about 23 million in 2100. Managing these large megacities, more than 50 of which are in excess of 15 million (while the top 10 are all in excess of 50 million), will place inordinate demands on urban managers and citizens. Planning and skill development should begin now.
Cities are complex systems impacting many disciplines. Economists, planners, political scientists, and businesses (existing and potential) are all interested in projected growth and relative rankings of cities. As the pace of city-building grows, engineers and planners have an acute need for urban “rules of thumb”. All of the 101 largest urban areas are served by local engineering faculties. The engineering and planning professions would be well served by developing a peer-reviewed self-collected and regularly updated (ideally annually) urban database that, as a minimum, includes population projections, resource flows, and quality of life indicators. Where practicable this data collection should incorporate local and national census data, and international standards consistent with agencies such as the Global Cities Indicator Facility (ISO 37120).
Historically, the world’s largest cities drove the world’s largest economies. The emergence of cities like N’Djamena, Mogadishu, Blantyre and Lilongwe, which today are in impoverished economies, gives pause. So does the relative decline of the number of large Chinese cities. The city population projections provided in this paper are driven by national populations from shared socioeconomic pathways and estimated urbanization rates. These estimates will be further impacted by regional economies, resource availability, conflict, and possible geophysical and climate disasters.
V. Conclusions
Projections are made here for the size of the world’s largest cities this century. The effect of socioeconomic pathways on regional distribution and the rank of the world’s largest cities is investigated to illustrate how sustainable development through our largest cities can impact overall global sustainability trends. Promoting global cooperation, accessibility to education, and adequate resources for effective development and optimal infrastructure deployment will significantly limit population growth, natural resource depletion, and local and global emissions. Efforts to improve city governance and urban management are urgently needed, especially in regions where current levels of service provision are already poor, yet cities are expected to grow markedly.
Achieving global sustainability requires a collective effort with common but differentiated responsibilities to ensure that large, rapidly growing urban areas adhere to the requirements of SSP1 (sustainability). This includes, for example, a sharp reduction in consumption for high-income cities; re-shaping of current development trajectories in middle-income and rapidly industrializing cities (e.g. China); and future-oriented urban design and land-use planning for African cities. In the next decade, efforts toward development of “sustainable cities” will lay the framework for future growth that will substantially affect global sustainability throughout the 21st century.
The projections presented here warrant caution as two broad trends do not appear to be fully reflected in city growth scenarios. First, urbanization rates suggested for Africa are well above current levels. Second, of the 101 largest cities 47 are coastal. Growth rates in these cities may be curtailed through climate change impacts of flooding from sea level rise and expected increased storm intensity.
Larger cities have historically driven much of the world’s economic growth. Many of the cities projected to grow most rapidly here do not yet show commensurate economic strength. Also, SSP1 is based on higher rates of urbanization, especially in the early 21st century. These rates are not evident today, greatly reducing the likelihood that SSP1 can be achieved.
Footnotes
Notes
References
Supplementary Material
Please find the following supplemental material available below.
For Open Access articles published under a Creative Commons License, all supplemental material carries the same license as the article it is associated with.
For non-Open Access articles published, all supplemental material carries a non-exclusive license, and permission requests for re-use of supplemental material or any part of supplemental material shall be sent directly to the copyright owner as specified in the copyright notice associated with the article.