
Abstract
The fragmentation of urban landscapes – or the inter-penetration of the built-up areas of cities and the open spaces in and around them – is a key attribute of their spatial structure. Analyzing satellite images for 1990 and 2000 for a global sample of 120 cities, we find that cities typically contain or disturb vast quantities of open spaces equal in area, on average, to their built-up areas. We also find that fragmentation, defined as the relative share of open space in the urban landscape, is now in decline. Using multiple regression models, we find that larger cities are less fragmented, that higher-income cities are more fragmented, that cities with higher levels of car ownership are less fragmented, and that cities that constrain urban development are less fragmented. We recommend that making room for urban expansion in rapidly growing cities should take into account their expected fragmentation levels.
Keywords
I. Introduction
Cities and metropolitan areas the world over are now highly fragmented, their fringes typically made up of disconnected patches of urban fabric broken up by swathes of vacant land. The fully built-out city of old, surrounded by a wall and situated in the open countryside, did not fragment any open space nor was its built-up area fragmented by open space. The modern urban landscape is quite different:
“Breaking out of the old bounds, walls, boulevards or administrative limits which set it apart, the city has massively invaded the open country, though parts of the countryside may have kept their rural appearance.”(1)
Both city and country now inter-penetrate and fragment each other.
A key question that has confronted urban planners, policy makers and concerned environmentalists worldwide for some time is whether the fragmentation of the urban landscape is an inherent feature of contemporary cities that must be taken into account in planning for and managing urban expansion, or whether it is a disorderly, wasteful and undesirable form of sprawl that must be brought under control through containment or growth management strategies of one type or another. Sprawl was indeed defined almost 50 years ago as “…a lack of continuity in expansion”,(2) and since then many writers have bemoaned the ill-effects of scattered or “leapfrogging” development and the costs it imposes both on the built environment(3) and on the rural fringe of cities:
“[P]arcelization of farmlands leads to a checkerboard distribution of farmlands, i.e. many non-contiguous fields. Farming such scattered plots is problematic.”(4)
Landscape ecology studies also maintain that settlements developed near a forest or prairie affect vegetation and wildlife along their edges, often in a belt up to 100 metres wide.(5) The fragmentation of urban landscapes is therefore an important concern both in terms of the efficiency of the built environment and in terms of the ecology of the open spaces in and around cities.
Discontinuous development has been explained by urban economists as the result of the operation of market forces. Ewing, paraphrasing Lessinger and Ottensman, explains:
“Expectations of land appreciation on the urban fringe cause some landowners to withhold land from the market… The result is a discontinuous pattern of development.”(6)
And some economists have observed that while fragmentation may be inefficient in the short term, it leads to more efficient development patterns in the long term:
“[C]ontrary to conventional wisdom, a freely functioning land market with discontinuous patterns of development inherently promotes higher density development.”(7)
Such views suggest that fragmentation is indeed an inherent feature of the urban expansion process and that it is not the result of the failure of land markets on the urban fringe, a failure that would have to be addressed by ameliorative action on the part of the state.
While it would be difficult to dispute that some fragmentation on the urban fringe is necessary for the proper functioning of land markets, and is indeed an inherent feature of the urban landscape, there is a quantitative aspect to this assertion that is left unexplored: how much fragmentation would be necessary and sufficient for the smooth functioning of the urban development process, and when can we determine that fragmentation is excessive and requires ameliorative action to reduce it? In fact, we may ask a number of questions regarding fragmentation that require quantitative answers:
How fragmented are cities and metropolitan areas and what is the minimum observed level of fragmentation at the present time?
Are cities becoming more or less fragmented over time?
What level of fragmentation needs to be taken as a planning norm when projecting the area needed for urban expansion in a given city, say 20–30 years ahead?
We can also ask more specific empirical questions about levels of fragmentation in particular countries and cities:
Are Chinese metropolitan areas, as few observers have suspected,(8) more fragmented than other metropolitan areas and if so, why?
Has urban containment in Portland, Oregon reduced fragmentation within its strictly enforced urban growth boundary over time?
These are all empirical questions that have not been properly addressed in the literature, be it in landscape ecology or in urban studies, and it is precisely those questions that we seek to address here.
Analyzing satellite images for 1990 and 2000 for a global sample of 120 cities, we find that cities typically contain or disturb vast quantities of open space equal in area, on average, to their built-up areas. We also find that fragmentation, defined as the relative share of open space in the urban landscape, is now in decline. Using multiple regression models, we find that larger cities are less fragmented, that higher-income cities are more fragmented, that higher levels of car ownership tend to reduce fragmentation, and that cities that constrain urban development are less fragmented than cities that do not. We recommend that making room for urban expansion in rapidly growing cities should take into account their expected fragmentation levels.
II. Data and Metrics
The unit of investigation in this study is the metropolitan area, typically a central city surrounded by suburbs and secondary cities that form a relatively contiguous whole. The urban landscape in cities and metropolitan areas is occupied by urban uses that include all land in residential, commercial, industrial and office use, land used for transport, parks and public facilities, protected land and vacant land. It does not include cultivated lands, pasture lands, forests, farms and villages, intercity roads and nature areas that are not in the immediate vicinity of, or fully contained by, urban built-up areas. The terms “city” and “metropolitan area” are used interchangeably.
The database for the study is a set of digital maps based on satellite images of 120 cities and metropolitan areas in two time periods, one circa 1990 and one circa 2000.(9) In an earlier 2005 study,(10) we identified a total of 3,945 large cities with populations of 100,000 or more that were home to a total of 2.12 billion people, or three-quarters of the world’s urban population in the year 2000. The global sample of 120 cities (Figure 1 and Table 1 in the Appendix) is a stratified sample from this universe, including cities from nine geographic regions, four population size classes and four per capita income classes. The nine region classification approximates that of UN–Habitat,(11) except that developed countries were regrouped into two regions: land-rich developed countries that had more than 0.6 hectares of arable land per capita in 2000 (US, Canada and Australia – 13 cities in the sample); and Europe and Japan (19 cities in the sample).
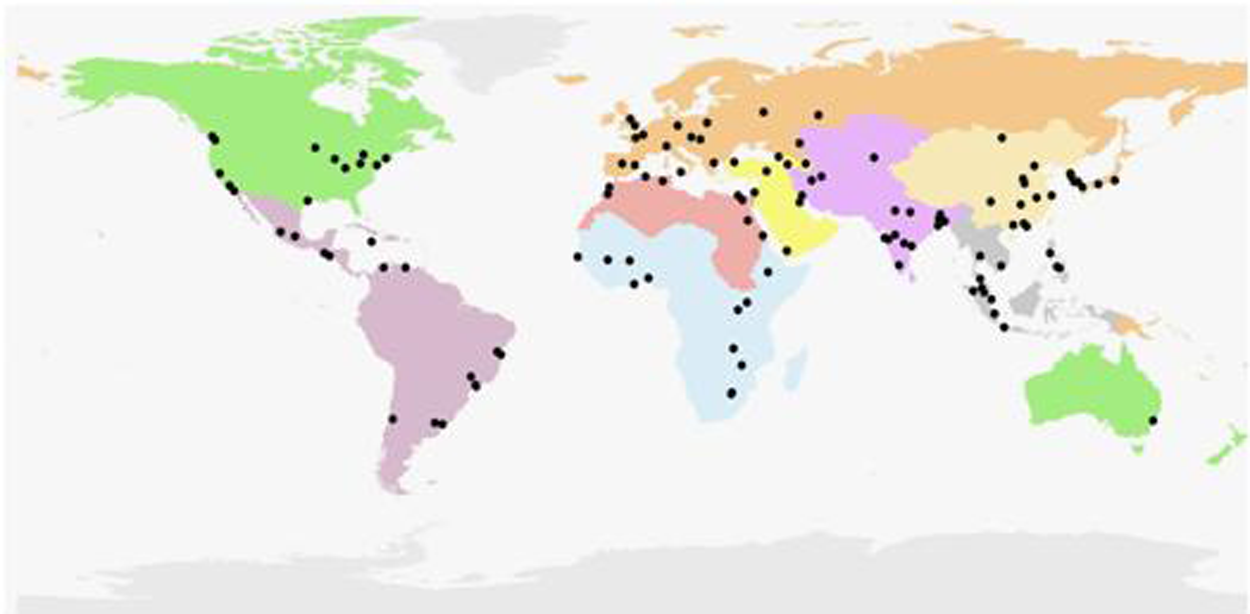
The global sample of 120 cities and nine world regions
For each sample city we obtained two medium-resolution Landsat satellite images, one for each time period. These images were classified into built-up and non-built-up 30×30-metre pixels using a thematic extraction algorithm.(12) Using 10,000 Google Earth validation sites, Potere et al.(13) reported that pixels identified as built-up in our sample were found to be built-up in Google Earth 91 per cent of the time, and those identified as built-up were identified in our sample 89 per cent of the time, confirming a relatively high level of accuracy. This data set allowed us to estimate and explain variations in fragmentation and in the rate of change in fragmentation during the 1990s. It also allowed us to analyze variations in density(14) and in urban land cover.(15)
Landscape ecology studies have long been concerned with measuring fragmentation.(16) Unfortunately, the measures proposed in the literature proved inappropriate for the comparative study of the fragmentation of urban landscapes on a global scale. Thus for this study, we have constructed two new fragmentation metrics (the first one following Burchfield et al.(17)) and three subsidiary ones:
the
the
The intermediary metrics used for calculating these fragmentation metrics (shown in italics above) are defined as follows:
the
the
The reader should note that we have given common words such as “urban”, “suburban” and “rural” very specific quantitative meanings here, which – while corresponding to our intuitive understanding of these terms – do not necessarily correspond to the unique manifestations of these terms within specific cities.
The urban landscapes of Bandung in 1991 and 2001 are shown in Figure 2. In 1991, Bandung had a built-up area of 108.7 square kilometres, of which 64 per cent was “urban”, 34 per cent was “suburban” and two per cent was “rural”. Fringe open space added 103.2 square kilometres and captured open space added 5.1 square kilometres, respectively, to its built-up area. The urban landscape area thus amounted to 217 square kilometres, roughly double its built-up area. The openness index in the city was 0.41 and the urban landscape ratio was 2.0. The area of new development in Bandung between 1991 and 2001 amounted to 45.1 square kilometres, of which 23 per cent was infill, 60 per cent was extension and 17 per cent was leapfrog. By 2001, the built-up area of Bandung was 153.8 square kilometres and its urban landscape area was 284.9 square kilometres; its openness index declined to 0.37 and its urban landscape ratio declined to 1.85 as it became less fragmented.
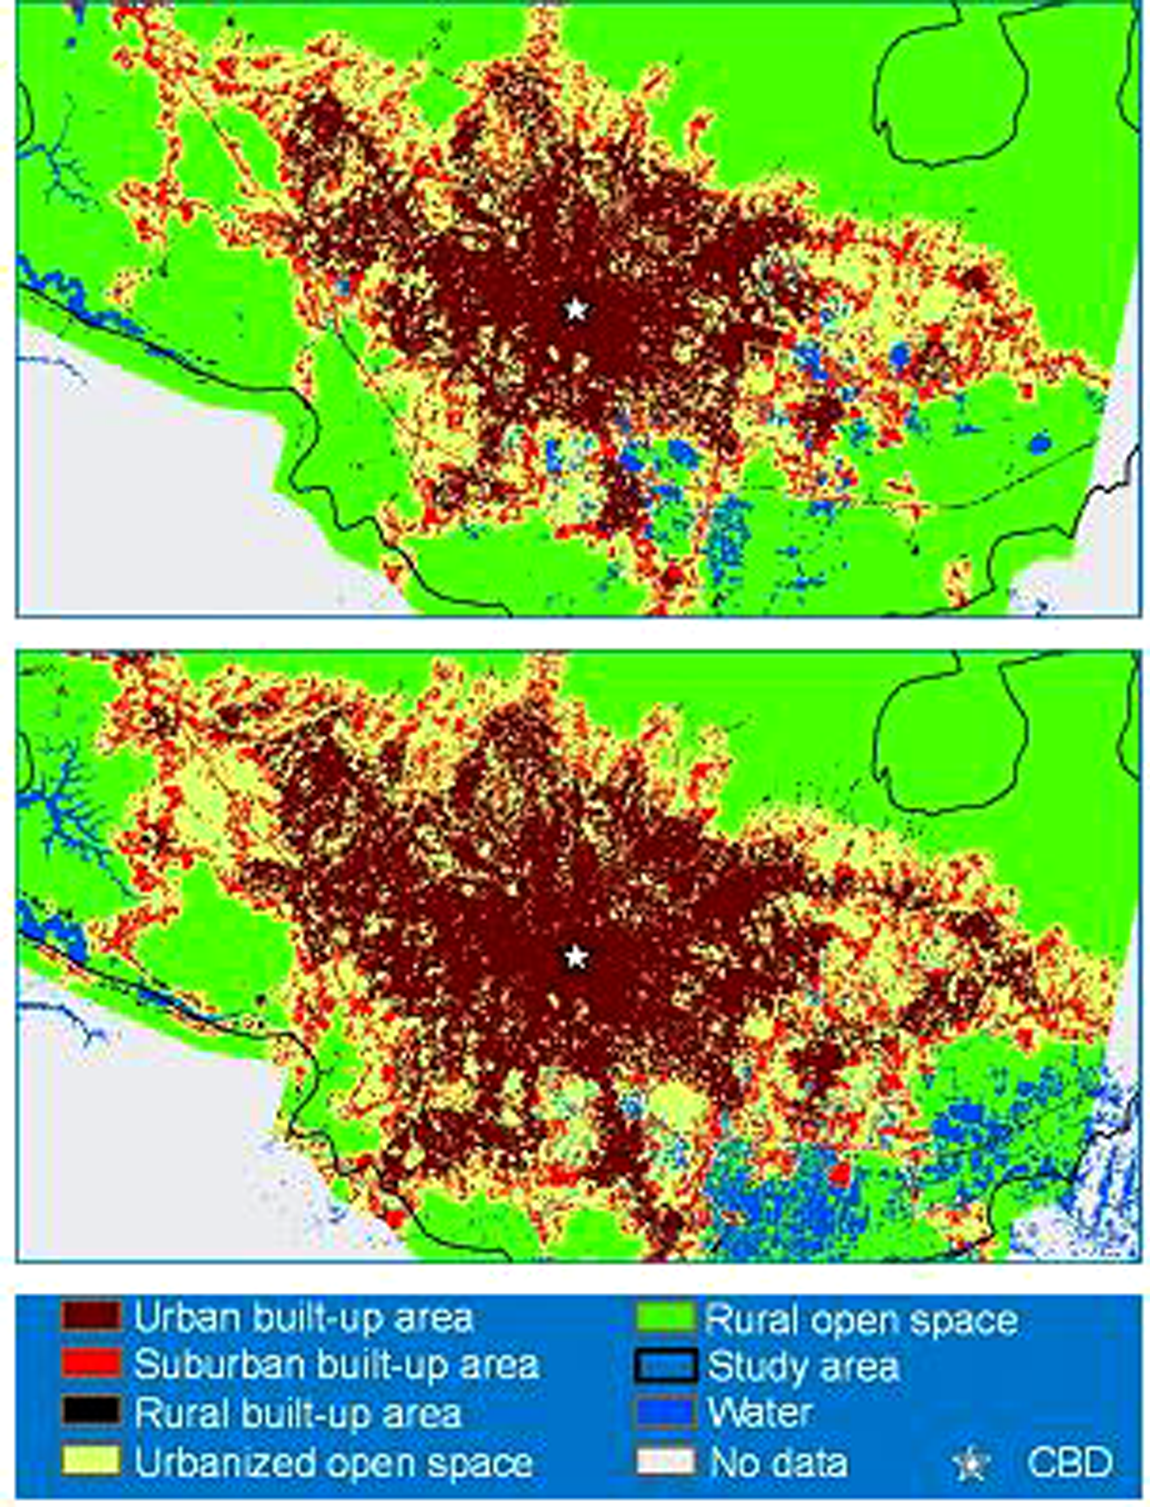
The urban landscape of Bandung, 1991 and 2001
III. Fragmentation in the Global Sample of Cities, 1990–2000
Burchfield et al. follow Clawson(18) in perceiving urban sprawl simply as the fragmentation of the urban landscape. They define fragmentation as the average share of a one-square kilometre urban neighbourhood that is occupied by open space. This definition does not distinguish between open space in permanent public or private use and open space that is vacant land that will be built on eventually. Clearly, the remote sensing of open space pixels cannot distinguish between these different categories of open space. As noted earlier, we measure fragmentation with two complementary metrics: the openness index and the urban landscape ratio. The first, following Burchfield et al.,(19) measures the average share of open pixels within the walking distance circle of every built-up pixel in the city. It is a neighbourhood scale measure of fragmentation. The second is the urban landscape ratio, which is a citywide measure of fragmentation. Both are area metrics, not per-person metrics, and are therefore independent of the density of built-up areas.(20)
What, one may ask, is the share of open space in a typical city neighbourhood? Our key findings regarding fragmentation in the 1990s can be summarized as follows: the average value of the openness index in the global sample of 120 cities was almost one-half; that is, typical neighbourhoods contained as much open space as their built-up areas. Similarly, urban landscapes, on average, were double the size of the built-up areas of cities; on average, open space added an area to the city equivalent to its built-up area – at a minimum, it added 36 per cent to the built-up areas of cities.
More specifically, urban landscapes circa 2000 added 93±7 per cent,(21) on average, to the built-up areas of cities, a surprisingly high figure with rarely a reference to it in the literature. They added only 40 per cent to the built-up area of Los Angeles, California (the fourth lowest value), nearly 90 per cent to the built-up area of Ho Chi Minh City, Vietnam (the median value) and 180 per cent to the built-up area of Zhengzhou, China (the second highest value) (Figure 3).
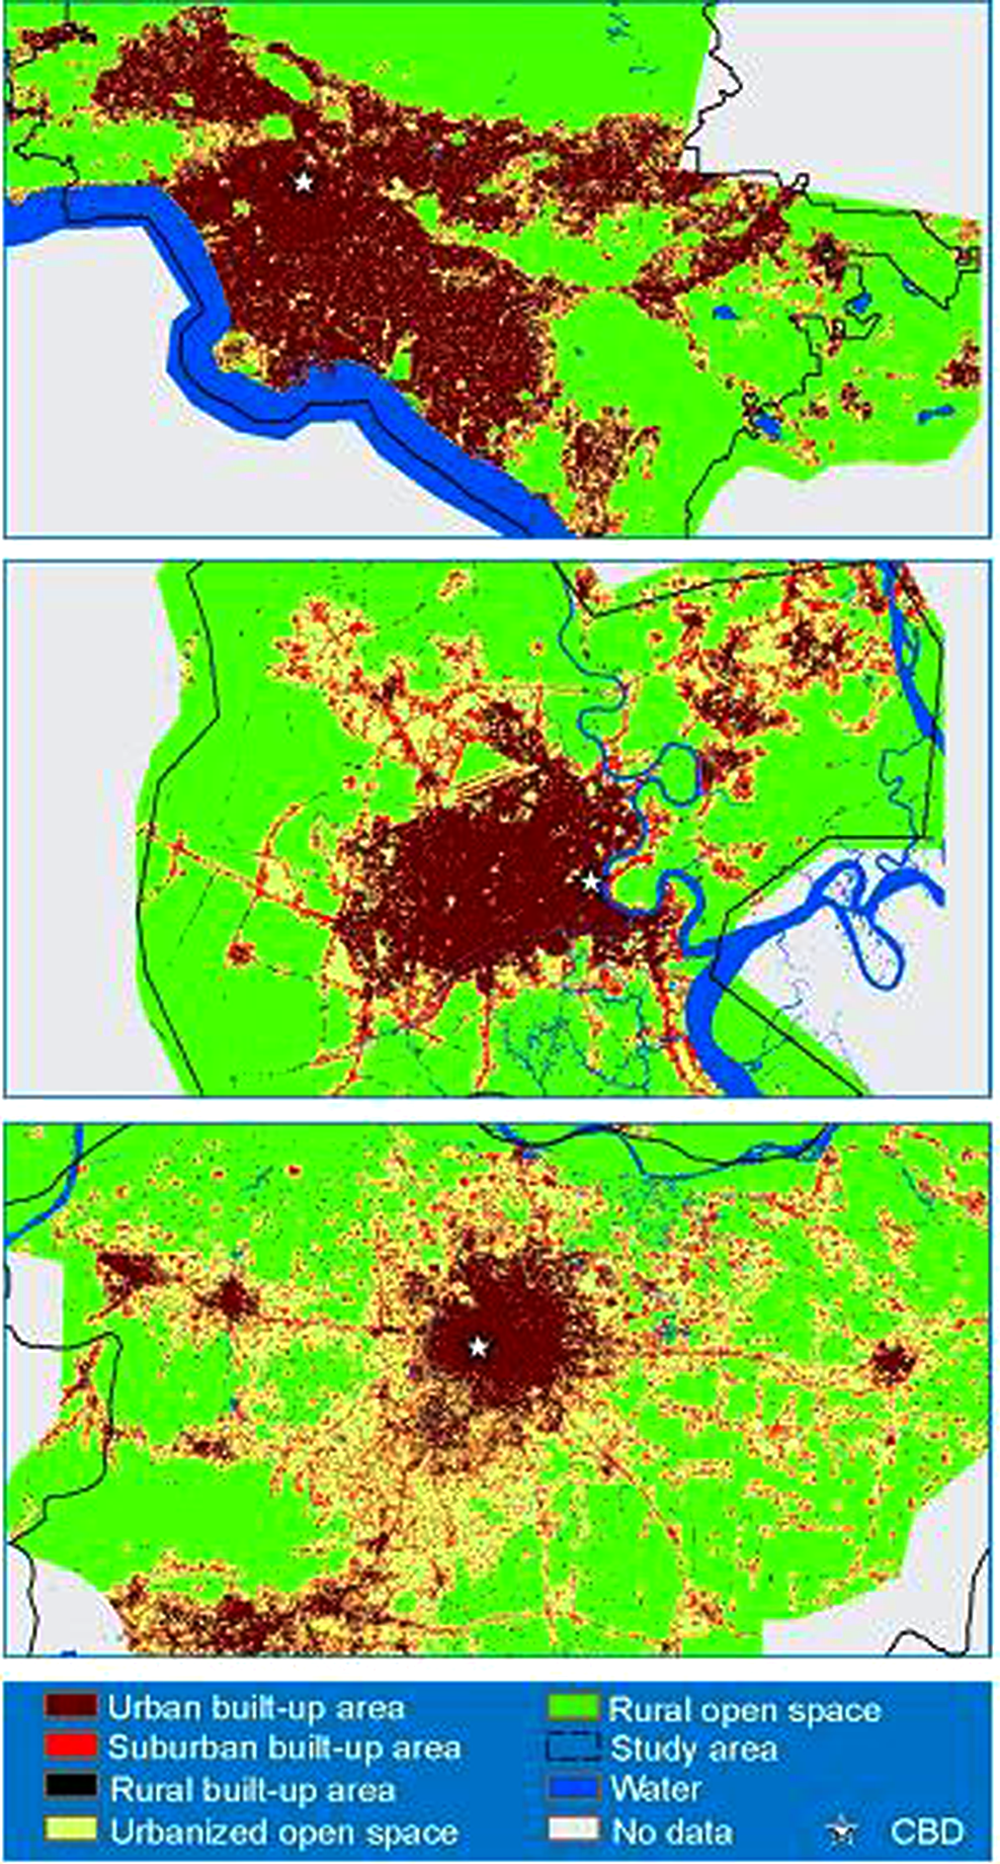
The urban landscapes of Los Angeles, California (2000) (top), Ho Chi Minh City, Vietnam (1999) (centre) and Zhengzhou, China (2001) (bottom)
The mean value of the openness index for a typical city was 0.47±0.02 in 1990 and 0.42±0.02 in 2000, and these values were very similar to the values found by Burchfield et al.(22) for the United States. They reported a value of 0.43 in 1976 and 0.42 in 1992. The openness index values appear to be normally distributed about their mean (Figure 4, top). Two cities had values lower than 0.2 in 2000: São Paulo, Brazil and Accra, Ghana. Four cities had values in excess of 0.7 in 2000: Rajshahi and Saidpur in Bangladesh; Yulin in China; and Ilheus in Brazil. Cities in developing countries had average values of 0.48±0.02 in 1990 and 0.43±0.02 in 2000, which were significantly higher than those found in developed countries, that is 0.44±0.02 in 1990 and 0.39±0.02 in 2000. Cities in Europe and Japan had similar values to cities in land-rich developed countries.
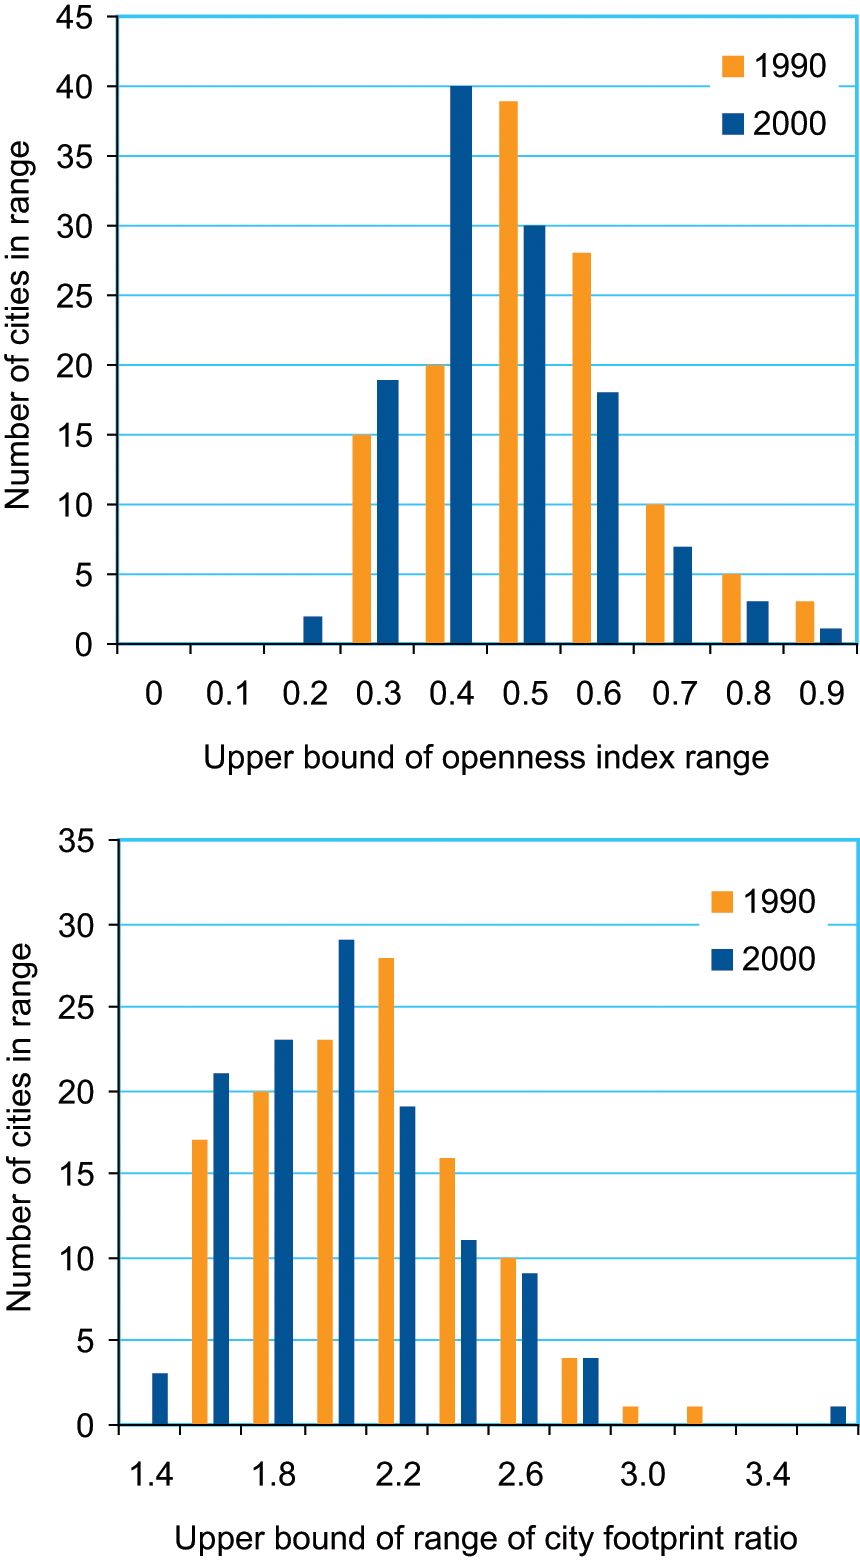
The frequency distribution of the openness index and urban landscape ratio for 120 cities, 1990–2000
The findings for the urban landscape ratios paralleled those for the openness index with minor differences, but their distribution appears to be more skewed (Figure 4, bottom). The mean value of the urban landscape ratio for a typical city was 2.00±0.07 in 1990 and 1.92±0.07 in 2000, and there were no significant differences in this ratio between developed and developing countries or among the three regional groups. There were no values below 1.36 in both periods, no values below 1.40 in 1990 and only three values below 1.40 in 2000.
Why are some cities more fragmented than others? Traditional urban economic theory does not seek to explain differences in fragmentation levels in cities, and we are therefore not able to test hypotheses derived from that theory. We have had to formulate our own hypotheses, largely based on our intuitive understanding of the phenomenon as well as on the analysis done by Burchfield et al.(23) Multiple regression models testing these hypotheses can explain 30 to 50 per cent of the variation in levels of fragmentation among cities in the global sample.(24) The fragmentation of urban landscapes can be explained by variations in such factors as city population size, income, levels of car ownership, topographical restrictions on expansion, the availability of well water, the preponderance of informal settlements, and to a small extent by the presence of restrictions on expansion.
In 2000, larger cities had significantly lower levels of fragmentation than smaller cities. A doubling of the city population was associated with an 11 per cent decline in the openness index. We postulated that the more people there are living in a city, the higher the demand for land and the higher the prices for that land. The higher the value of vacant lots in the city, the higher the incentive for landowners to sell them. Also, the higher the value of vacant lots, the more expensive it is for municipalities to acquire land for parks and playgrounds. We would therefore expect that large cities would be less fragmented than smaller ones.
Cities with more buildable land in and around them were more fragmented. A doubling of the share of buildable land was associated with a 12 per cent increase in the openness index. It stands to reason that cities surrounded by unlimited amounts of cheap, developable land would be more fragmented than cities whose outward development is constrained in one way or another. Cities with severe geographic constraints on their expansion, such as water bodies or steep slopes, are likely to be less fragmented than cities that can readily expand in all directions.
Cities in countries with higher incomes also had higher levels of fragmentation. A doubling of income per capita was associated with a 12 per cent increase in the openness index. Other things being equal, cities with higher average incomes would consume more of everything, including land, and especially land in permanent use as open space in both public and private ownership. It is also possible that in rich cities, more capital is available to hold land vacant. If these contentions are true, then we can expect cities in richer countries to contain more open space and hence to be more fragmented than cities in poorer countries.
Cities in countries with higher levels of car ownership per capita were less fragmented. A doubling of the level of car ownership per capita was associated with an eight per cent decline in the openness index. The availability of private automobiles can have two quite contradictory effects on the fragmentation of cities. On the one hand, to the extent that private automobiles make transport cheaper, they enable people to travel further and to cover greater distances on their way to work, to market, to school and to other destinations. If the cost of covering an extra kilometre of road is relatively low, people would not mind living in more fragmented cities where they would have to cover the extra distances involved in crossing the open spaces between their destinations. That would suggest that cities in countries with high levels of car ownership per capita would be more fragmented than cities in countries with low levels of car ownership.
On the other hand, private automobiles facilitate door-to-door travel and can move with great ease along roads both narrow and wide, both paved and unpaved, in almost all weather conditions. In the absence of private automobiles, people must combine walking and public transport to get from place to place. Public transport, especially rail transport in its variety of forms, involves a much larger investment per kilometre than is required for a kilometre of road, especially a narrow, unpaved one. It is more expensive, therefore, to cover an urban area on the urban fringe with a dense network of public rail transport or with wide arterial roads on which buses can travel comfortably than it is to cover the area with a dense network of cheap, narrow, unpaved roads. And this is especially true when such fringe areas are built at low densities. This suggests that the private automobile better supports infill development than public transport, and that it is easier to infill the urban fringe with homes that rely on private automobiles than with homes that rely on an efficient system of public transport. If this were the case, then the prevalence of private automobiles would be associated with higher levels of infill and consequently with lower levels of fragmentation. It was difficult to determine in advance which factor would be more powerful in determining whether levels of automobile ownership and fragmentation would go hand in hand or in opposite directions. Empirical results suggest that the second effect is more powerful than the first one.
Access to well water also increased fragmentation: A doubling of the share of the population that obtained its water from wells was associated with a 12 per cent increase in the openness index. Burchfield et al. note that: “…in places where water-yielding aquifers are pervasive, developers can sink a well instead of connecting to the municipal or county water supply.”(25) This makes them more footloose and less likely to develop sites that are immediately adjacent to built-up areas. Hence, we can expect cities where people can obtain water from wells to be more fragmented than cities where water can only be obtained by connecting to the municipal water supply.
The density of built-up areas did not affect the spatial fragmentation of cities one way or another. In principle, the density of built-up areas and their levels of fragmentation are not necessarily related. Levels of fragmentation measured, for example, by the urban landscape ratio were quite independent from built-up area densities. That said, can there be a causal relationship between density and fragmentation? We can think of cities or parts of cities, like the Kasbah in Fez, Morocco, for example, with dense built-up areas that are also contiguous to each other, leaving very little open space between them. In such places, high density and a low level of fragmentation go hand in hand. Alternatively, we can think of cities or parts of cities where land is ample and cheap and where people live in large plots that are scattered across the land, leaving plots of vacant open spaces between them. In both these types of cities, density and fragmentation pull in opposite directions: high density and low levels of fragmentation go hand in hand, and low density and high levels of fragmentation go hand in hand. We can hypothesize that in these types of cities,
We can also think of high density and open space as substitutes, where density and fragmentation pull in the same direction. Le Corbusier’s 1925 “Plan Voisin” proposal for Paris, France, for example, combined high density development in built-up areas with a high level of fragmentation of these built-up areas by open spaces. High built-up area density was thus accompanied by a high ratio of open area to built-up area. In this case, we can say that substantial amounts of open space compensated residents for high density living. In parallel, we can think of families who seek larger lots in fully built low density suburbs as
The presence of informal settlements was associated with a decline in fragmentation. A doubling of the share of the population in informal settlements was associated with an eight per cent decline in the openness index. Poor families in developing country cities typically do not have access to the formal housing market, often resorting to the construction of houses in squatter settlements and informal land sub-divisions. It has often been remarked that squatter settlements and informal land sub-divisions are located on undesirable land that is subject to flooding or mudslides, on leftover plots of land, on disputed land with unclear title, or on vacant public land. This suggests that informal settlement is often infill development, taking advantage of any vacant land that is not used by the formal sector. This would imply that cities with significant shares of their population living in informal settlements would be less fragmented than cities with small shares of their population in informal settlements.
The importance of agriculture to the country’s economy was also associated with higher levels of fragmentation. A doubling of the share of the country’s GDP from agriculture was associated with an eight per cent increase in the openness index. We postulated that cities in countries that derive a significant share of their national income from agriculture would have agricultural lands in and around their cities that would still be cultivated. Cities in these countries are therefore likely to be more fragmented than cities in countries with smaller shares of their GDP derived from agriculture.
The availability of large quantities of agricultural land in the country did not lead to the increased fragmentation of urban areas. We postulated that cities in countries with large amounts of arable land per capita are likely to be more fragmented than cities in countries with limited supplies of arable land. In the former, land is more likely to be cheaper and conversion of agricultural lands to urban use easier than in the latter. The empirical evidence does not support this contention.
Finally, planning restrictions were associated with a decline in fragmentation. A doubling of the area of the metropolitan plan where no development was allowed was associated with a six per cent decline in the openness index. Several researchers have noted that: “…urban growth boundaries are a successful tool in preventing urban incursions into agricultural areas.”(26) As we shall see later, the urban growth boundary in Portland, Oregon, for example, has significantly reduced fragmentation as measured by all indices, including the openness index. More generally, limits on the conversion of land from rural to urban use, and zoning regulations that prevent urban development in parts of the metropolitan area restrict the possibilities for leapfrog development and thus encourage infill. To the extent that these planning policies are effective, we would expect them to increase the share of infill in new development and thus reduce fragmentation.
IV. The decline in fragmentation, 1990–2000
Levels of fragmentation measured by both the openness index and the urban landscape ratio declined significantly between 1990 and 2000 in the global sample of 120 cities. More than two-thirds of these cities experienced a decline in the urban landscape ratio, compared to less than one-third which experienced an increase. On average, infill constituted 50.9±1.7 per cent of all new development between the two periods, extension 26.0±1.3 per cent and leapfrog 23.1±1.4 per cent.
The average openness index declined from 0.47 to 0.42 and the average urban landscape ratio declined from 2.01 to 1.93 between 1990 and 2000. The rate of change of the openness index was –1.2±0.1 per cent per annum and that of the urban landscape ratio was –0.04±0.01 per cent per annum. Both rates were significantly different from zero and did not vary among the three regional groups or among developing countries and developed countries. To put the latter rate in perspective, it was one-third the rate of decline in the urban landscape ratio within Portland’s urban growth boundary between 1973 and 2005, which was -1.2 per cent per annum (see Case study 2).
Multiple regression models could explain 14 to 43 per cent of the variation in the annual rate of change of the openness index in the sample of 120 cities. The models showed that the faster the rate of population growth in the city, the faster the rate of decline in the openness index. A 10 per cent increase in the population growth rate is associated with a 2.7 decline in the rate of change in the index.
Rapid economic growth, in contrast to rapid population growth, leads to increased fragmentation. A 10 per cent increase in the rate of growth of GDP per capita is associated with a one per cent increase in the rate of growth of the openness index.
The higher the level of car ownership in the country, the faster the rate of decline in the openness index, but that effect, while significant, was minimal.
The rate of inflation or restrictions on the conversion of land from rural to urban use could not be said to effect significant changes in the rate of change in the openness index.
To conclude, the fragmentation of urban landscapes declined during the 1990s and cities therefore became
While it has been difficult to obtain comparative data that could be used to test the effects of policies on urban fragmentation at a global scale, it was possible to begin to examine these effects in the two case studies presented below.
a. Case study 1: Excessive fragmentation in Chinese cities
Although not well-documented, fragmentation in Chinese cities is indeed excessive and most likely the result of the existence of a dense pattern of villages – villages that are quite urban in terms of their residential and industrial composition – in and around cities, as well as state policies that prevent cultivated land from being converted to urban use. The mean value of the urban landscape ratio for the nine Chinese cities (not including Hong Kong) in our global sample for the year 2000, for example, was 2.40. For the rest of the cities in the sample it was 1.89. The Chinese cities in the sample had urban landscape ratios that ranged from 2.1 in Shanghai and Beijing to 2.8 in Zhengzhou. These values were significantly higher than those of other countries. Why?
It has often been noted in the academic literature that there is a broad “rural-yet-urban” fringe in Chinese cities, a zone termed desakota by urban geographers who studied Indonesia and later China in the early 1990s.(28) In this zone, there is a dense scatter of villages with a high share of non-agricultural activities and a large number of workers who commute to urban jobs in the city proper. As Chinese cities are often located on formerly densely settled agricultural lands, they enclose and incorporate many villages as they grow and expand outwards, while villages further out become more urban in character:
“The urbanization process unfolding is thus caused not only by a stream of rural-to-urban migrants but also by urbanization in place; that is, entire districts becoming more urbanized at all levels of the rural–urban continuum.”(29)
But the existence of a dense pattern of urban villages on the periphery of Chinese cities does not explain the proliferation of cultivated lands
“…[t]he result of sample land use surveys conducted in suburban areas in Chengdu, Tianjin and Zhengzhou shows that on average about 34 per cent of the land within existing ring roads remains under agricultural use while urban development expands much farther away from the city centre.”(30)
Angel et al.,(31) following Bertaud, attributed this persistence of agriculture, much of it of a subsistence nature, to central government policies that limit the conversion of cultivated land to urban use, in line with China’s food security policies:
“The Chinese government has given a high priority to agricultural land preservation in its food security policies, among them the Basic Farmland Protection Regulation of 1994, the 1998 Land Management Law and the New Land Administration Act of 1999.”(32)
They also estimated that fragmented cultivated land in Zhengzhou, for example, is only half as productive as land in larger fields in the surrounding Henan province, as most farming families have other sources of income (e.g. from the rental of rooms or city jobs). They observed that strict central government limitations on land conversion have forced the municipality of Zhengzhou, for example, to appropriate the built-up areas of several of its surrounding villages while leaving their cultivated lands intact, then to demolish dense affordable housing there and redevelop the areas for urban use (Figure 5). Similar actions are taking places in other Chinese cities. These policies, they claim, exacerbate the fragmentation of cities in China, fragmentation that results in inefficient infrastructure networks, longer commutes, inland supply bottlenecks that lead to exorbitant land and housing prices and in unproductive agriculture. What is more, shying away from cultivated land exacerbates forced evictions from – and demolitions of – rural structures.
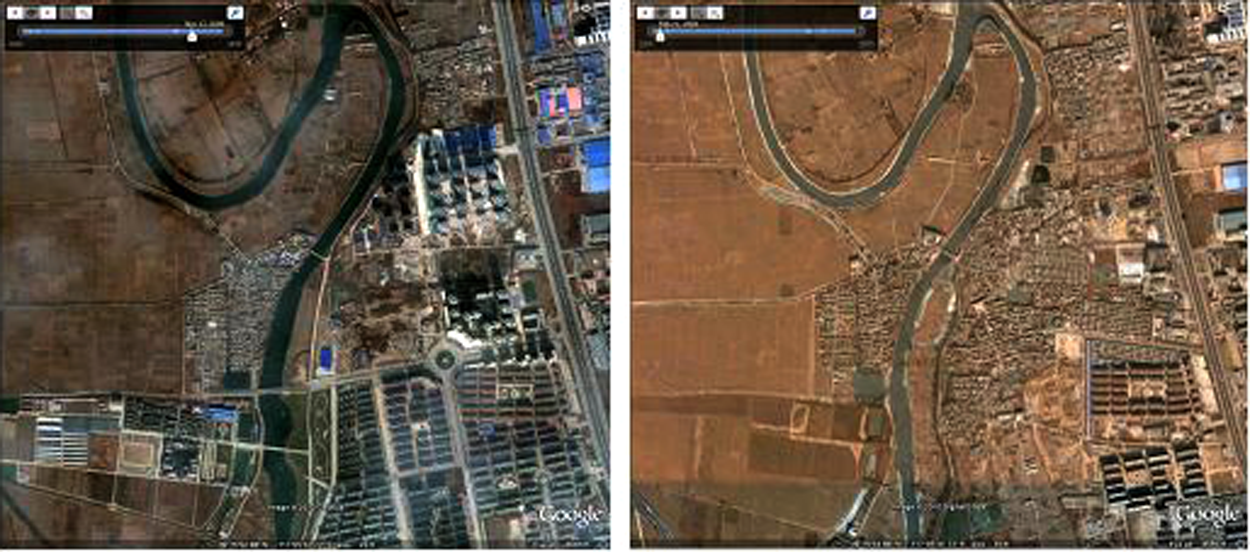
Dense affordable housing in urban villages demolished to make way for urban expansion, while cultivated land remains vacant – Tianjin, China, 2004–2009
A report released in March 2010 by the Chinese Urgent Action Working Group, a China-based rights lobby, claimed that:
“China risks growing social instability and even violence if the government does not take effective action to address rising public anger about forced evictions and demolitions.”(33)
b. Case study 2: Decline in fragmentation in Portland and Houston
In 1973, the state of Oregon enacted Senate Bill 100 that mandated every urban area in the state, including Portland, to create an urban growth boundary. In 1979, a regional government, Metro, was created by Portland voters to manage the urban growth boundary in a three-county metropolitan area. Metro was charged with enforcing the boundary and with extending it every five years to ensure a 20-year supply of residential land. It is not at all clear from the available documentation whether this 20-year supply includes all vacant land within the boundary or whether it assumes that a significant share of urbanized open space, say of the order of at least 40 per cent of the built-up area, is to remain vacant at all times. If it does not, as some observers(34) suspect, there is good reason to expect that land supply in Portland will eventually be constrained, with concomitant effects on housing affordability.
The chief aim of the boundary was to contain urban sprawl and to preserve the natural beauty of the surrounding countryside. Sprawl was not precisely defined, but we can take it to mean sprawl as low density development as well as sprawl as fragmentation. We have examined the change in built-up area density and in the urban landscape ratio within the boundary between 1973, when the boundary was enacted, and 2005. To our surprise, we found that average built-up area density did not increase during this period. In fact, it declined from 23.5 to 21.9 persons per hectare. By comparison, between 1990 and 2000, average built-up area density declined from 35.0 to 34.3 per hectare in Los Angeles and from 23.2 to 20.0 persons per hectare in Houston.
Density aside, the creation of Portland’s urban growth boundary was associated with a rapid decline in fragmentation. Figure 6 shows the increase in the built-up area within Portland’s urban growth boundary between 1973 and 2005. During this period, Portland’s urban landscape ratio declined from 2.20 to 1.51 at an average rate of -1.2 per cent per annum. If this decline continues, it will soon reach the level of fragmentation in Los Angeles, the fourth lowest among the cities in the global sample of 120 cities. The urban landscape ratio of Los Angeles declined from 1.47 to 1.40 in the 1990s, at an annual rate of 0.5 per cent.
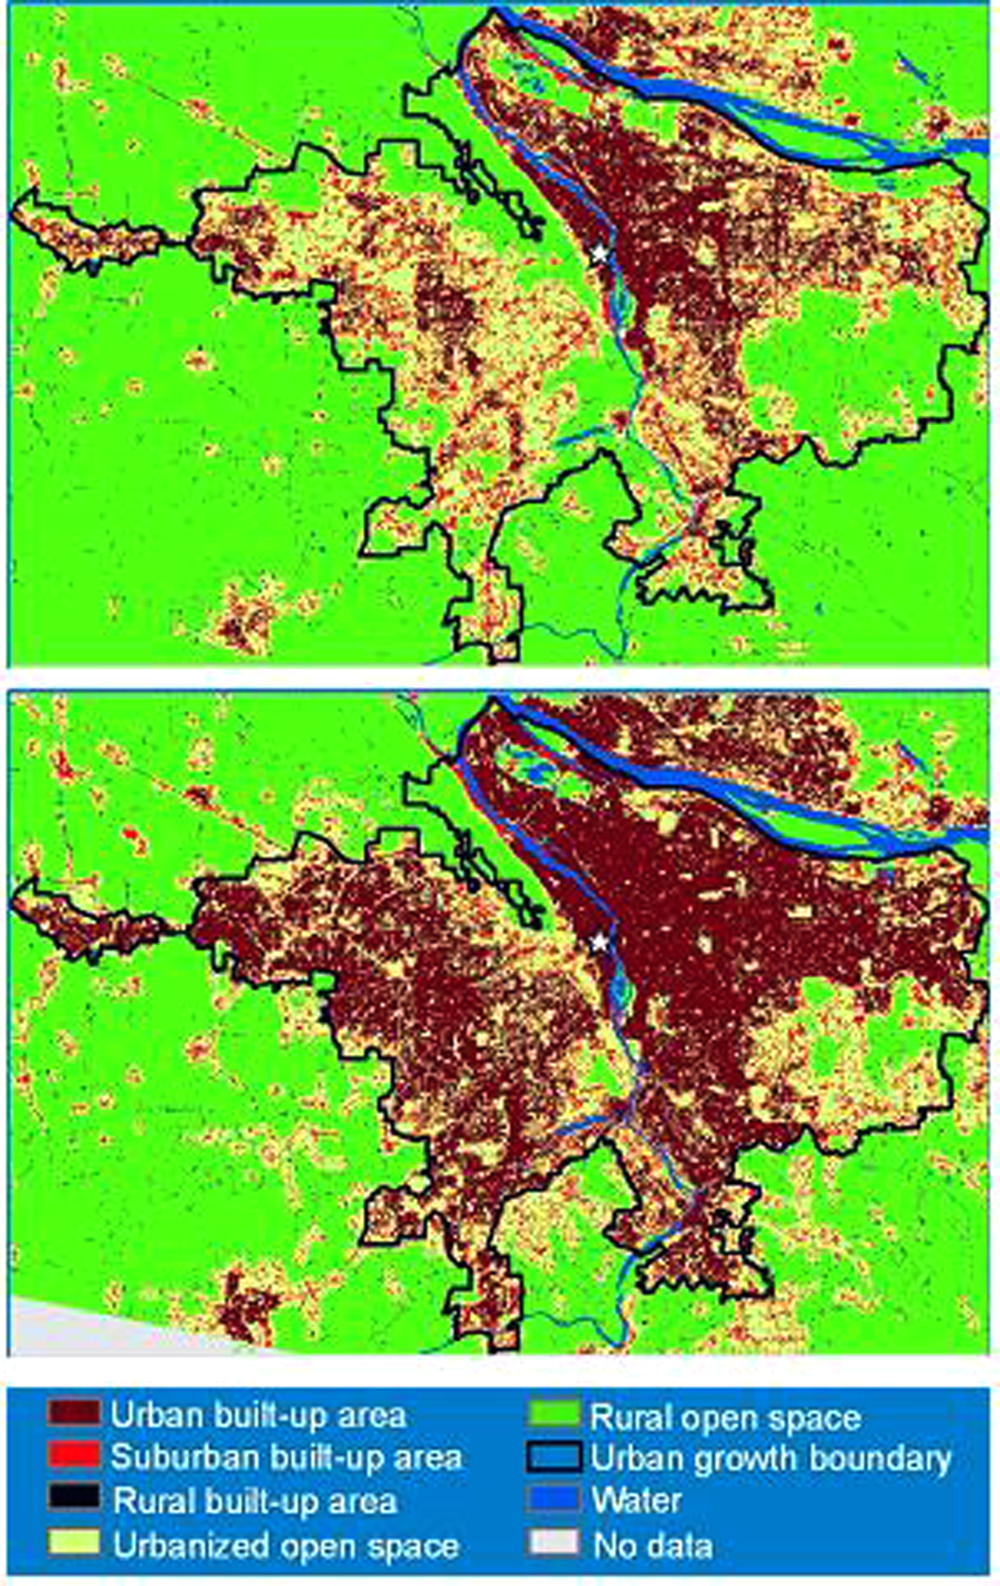
The decline in fragmentation within Portland’s urban growth boundary, 1973–2005
V. Conclusions: Allowing for Fragmentation in Making Room for Urban Expansion
Given the results of our foregoing analysis, we can begin to answer some of the questions posed at the outset. On average, the inclusion of open space in the urban landscape
In truth, we have insufficient data to determine what range of ratios is common to cities with an unconstrained supply of urban land, ratios that ensure that housing remains affordable. It stands to reason that projected urban landscape ratios in a city with unconstrained land supply should be higher than the minimum observed in the global sample of cities (1.4) and in Portland (1.5). If this were the case, then the areas planned for, say, 20–30 years of urban expansion must be at least 50 per cent larger than the areas obtained by simply projecting populations and built-up area densities. While we cannot apply such an estimate to individual cities with different topographies (e.g. steep slopes and floodplains), different historical levels of density and fragmentation, and different amounts of open space in permanent use, and while we know that expected fragmentation levels are in global decline, we can only urge planners to include these in their calculations. This would, of course, result in preparing substantially larger areas for expansion.
Should cities employ rigorous containment measures to bring excessive fragmentation under control? There may be sufficient cause for reining in excessive fragmentation where it appears to be, at least partially, the result of misguided land policies, as is the case in China. And a case can be made for reducing ex-urban fragmentation through policy intervention in areas that, projected 20–30 years into the future, are expected to still be outside urban landscapes, say by postponing the official designation of lands as urban or by delaying the extension of the urban infrastructure network into these ex-urban areas.
The urban population in developing countries, for example, is expected to double between 2000 and 2030,(35) from two to four billion. As we reported elsewhere,(36) given the persistent decline in densities during the last century, their built-up areas and urban landscape areas can be expected to
Footnotes
Appendix
Basic data on the global sample of cities, 1999−2000
| City | Country | Region | T1 Date | T2 Date | Time elapsed (years) | CBD Latitude | CBD Longitude | |
|---|---|---|---|---|---|---|---|---|
| Accra | Ghana | Sub-Saharan Africa | 6-Mar-1985 | 4-Feb-2000 | 14.92 | 5.5548 | –0.2005 | |
| Addis Ababa | Ethiopia | Sub-Saharan Africa | 21-Jan-1986 | 5-Dec-2000 | 14.87 | 9.0339 | 38.7378 | |
| Ahvaz | Iran | South and Central Asia | 24-May-1989 | 22-May-2000 | 11.00 | 31.3236 | 48.6880 | |
| Akashi | Japan | Europe & Japan | 31-May-1989 | 15-Oct-2001 | 12.38 | 34.6472 | 134.9919 | |
| Alexandria | Egypt | Northern Africa | 11-Sep-1984 | 2-Dec-1999 | 15.22 | 31.1947 | 29.8921 | |
| Algiers | Algeria | Northern Africa | 21-Jun-1987 | 25-Feb-2000 | 12.68 | 36.7722 | 3.0568 | |
| Anqing | China | Eastern Asia & the Pacific | 15-Jul-1989 | 10-Dec-1999 | 10.40 | 30.5096 | 117.0302 | |
| Ansan | Korea, Republic of | Eastern Asia & the Pacific | 17-May-1989 | 23-Sep-2001 | 12.35 | 37.3145 | 126.8389 | |
| Astrakhan | Russian Federation | Europe & Japan | 8-Aug-1989 | 20-Aug-1999 | 10.03 | 46.3612 | 48.0565 | |
| Aswan | Egypt | Northern Africa | 15-Nov-1986 | 10-Sep-2000 | 13.82 | 24.0945 | 32.9098 | |
| Bacolod | Philippines | Southeast Asia | 21-Dec-1992 | 22-Sep-2000 | 7.75 | 10.6698 | 122.9504 | |
| Baku | Azerbaijan | Western Asia | 31-Jul-1988 | 15-Aug-1999 | 11.04 | 40.3762 | 49.8325 | |
| Bamako | Mali | Sub-Saharan Africa | 14-Nov-1986 | 25-Oct-1999 | 12.94 | 12.6387 | –7.9992 | |
| Bandung | Indonesia | Southeast Asia | 28-Jul-1991 | 12-May-2001 | 9.79 | -6.9208 | 107.6043 | |
| Bangkok | Thailand | Southeast Asia | 25-Oct-1994 | 8-Jan-2002 | 7.21 | 13.7432 | 100.5435 | |
| Banjul | Gambia | Sub-Saharan Africa | 9-Feb-1986 | 6-Nov-2000 | 14.74 | 13.4371 | –16.6811 | |
| Beijing | China | Eastern Asia & the Pacific | 25-Dec-1988 | 1-Jul-1999 | 10.51 | 39.9044 | 116.3807 | |
| Budapest | Hungary | Europe & Japan | 11-Nov-1990 | 21-Apr-2000 | 9.44 | 47.4955 | 19.0589 | |
| Buenos Aires | Argentina | Latin America & the Caribbean | 13-Apr-1987 | 20-Dec-2000 | 13.69 | –34.5947 | –58.4023 | |
| Cairo | Egypt | Northern Africa | 20-Sep-1984 | 11-Nov-2000 | 16.14 | 30.0446 | 31.2367 | |
| Caracas | Venezuela | Latin America & the Caribbean | 14-May-1991 | 14-Mar-2001 | 9.83 | 10.5072 | –66.9052 | |
| Casablanca | Morocco | Northern Africa | 6-Jan-1987 | 20-Jan-2001 | 14.04 | 33.5964 | –7.6173 | |
| Castellon | Spain | Europe & Japan | 20-Apr-1992 | 8-Aug-2000 | 8.30 | 39.9860 | –0.0374 | |
| Cebu | Philippines | Southeast Asia | 29-Jun-1992 | 26-Dec-2002 | 10.49 | 10.2963 | 123.8985 | |
| Changzhi | China | Eastern Asia & the Pacific | 19-Oct-1993 | 7-May-2000 | 6.55 | 36.1870 | 113.1020 | |
| Chicago | United States | Land-Rich Developed Countries | 30-Jun-1989 | 11-Sep-2001 | 12.20 | 41.8821 | –87.6283 | |
| Chinju | Korea, Republic of | Eastern Asia & the Pacific | 28-Aug-1991 | 8-May-2000 | 8.70 | 35.1921 | 128.0843 | |
| Chonan | Korea, Republic of | Eastern Asia & the Pacific | 2-May-1992 | 8-May-2000 | 8.02 | 36.8160 | 127.1382 | |
| Cincinnati | United States | Land-Rich Developed Countries | 6-Jun-1988 | 16-Aug-1999 | 11.19 | 39.1101 | –84.5126 | |
| Coimbatore | India | South and Central Asia | 21-Nov-1989 | 9-Nov-1999 | 9.97 | 11.0193 | 76.9624 | |
| Dhaka | Bangladesh | South and Central Asia | 4-Nov-1989 | 24-Nov-1999 | 10.05 | 23.7131 | 90.4038 | |
| Fukuoka | Japan | Europe & Japan | 15-May-1993 | 13-May-2001 | 7.99 | 33.5903 | 130.4195 | |
| Gorgan | Iran | South and Central Asia | 16-Jul-1987 | 30-Jul-2001 | 14.04 | 36.8368 | 54.4376 | |
| Guadalajara | Mexico | Latin America & the Caribbean | 7-Mar-1990 | 3-Nov-1999 | 9.66 | 20.6763 | –103.3469 | |
| Guangzhou | China | Eastern Asia & the Pacific | 13-Oct-1990 | 14-Sep-2000 | 9.92 | 23.1355 | 113.3191 | |
| Guaruja | Brazil | Latin America & the Caribbean | 22-Jun-1993 | 20-Apr-2002 | 8.83 | –23.9989 | –46.2623 | |
| Guatemala City | Guatemala | Latin America & the Caribbean | 12-Feb-1993 | 23-Jan-2000 | 6.94 | 14.6126 | –90.5165 | |
| Harare | Zimbabwe | Sub-Saharan Africa | 19-May-1989 | 30-Sep-2000 | 11.37 | –17.8300 | 31.0469 | |
| Ho Chi Minh City | Vietnam | Southeast Asia | 16-Jan-1989 | 22-Dec-1999 | 10.93 | 10.8016 | 106.7113 | |
| Hong Kong | China | Eastern Asia & the Pacific | 20-Nov-1989 | 31-Dec-2001 | 12.11 | 22.1710 | 114.0932 | |
| Houston | United States | Land-Rich Developed Countries | 8-Dec-1990 | 6-Oct-1999 | 8.83 | 29.7576 | –95.3567 | |
| Hyderabad | India | South and Central Asia | 21-Nov-1989 | 29-Oct-2001 | 11.94 | 17.3850 | 78.4843 | |
| Ibadan | Nigeria | Sub-Saharan Africa | 18-Dec-1984 | 6-Feb-2000 | 15.13 | 7.3761 | 3.8967 | |
| Ilheus | Brazil | Latin America & the Caribbean | 11-Sep-1986 | 23-May-2001 | 14.70 | –14.7980 | –39.0366 | |
| Ipoh | Malaysia | Southeast Asia | 23-Apr-1990 | 20-Sep-2001 | 11.41 | 4.5970 | 101.0748 | |
| Istanbul | Turkey | Western Asia | 5-Jun-1987 | 2-Jul-2000 | 13.08 | 41.0090 | 28.9520 | |
| Jaipur | India | South and Central Asia | 9-Oct-1989 | 13-Sep-2000 | 10.93 | 26.9206 | 75.7945 | |
| Jalna | India | South and Central Asia | 18-Oct-1989 | 24-Oct-2000 | 11.02 | 19.8409 | 75.8864 | |
| Jequie | Brazil | Latin America & the Caribbean | 22-Aug-1988 | 12-Apr-2001 | 12.64 | –13.8615 | –40.0810 | |
| Johannesburg | South Africa | Sub-Saharan Africa | 7-Apr-1991 | 23-Apr-2000 | 9.05 | –26.2029 | 28.0462 | |
| Kampala | Uganda | Sub-Saharan Africa | 19-Jan-1995 | 27-Nov-2001 | 6.86 | 0.3111 | 32.5859 | |
| Kanpur | India | South and Central Asia | 21-Nov-1989 | 11-Nov-2000 | 10.97 | 26.4624 | 80.3117 | |
| Kigali | Rwanda | Sub-Saharan Africa | 20-Jun-1984 | 8-Jul-1999 | 15.05 | –1.9439 | 30.0615 | |
| Kingston | Jamaica | Latin America & the Caribbean | 12-Mar-1991 | 13-Jan-2002 | 10.84 | 17.9687 | –76.7885 | |
| Kolkata | India | South and Central Asia | 14-Nov-1990 | 17-Nov-2000 | 10.01 | 22.5701 | 88.3579 | |
| Kuala Lumpur | Malaysia | Southeast Asia | 15-Jun-1989 | 20-Sep-2001 | 12.27 | 3.1561 | 101.7141 | |
| Kuwait City | Kuwait | Western Asia | 12-Jun-1990 | 25-May-2001 | 10.95 | 29.3411 | 47.9435 | |
| Le Mans | France | Europe & Japan | 13-May-1992 | 13-Aug-1999 | 7.25 | 48.0088 | 0.1973 | |
| Leipzig | Germany | Europe & Japan | 7-Jul-1989 | 13-Sep-1999 | 10.18 | 51.3442 | 12.3767 | |
| Leshan | China | Eastern Asia & the Pacific | 10-Jul-1990 | 14-Jun-2001 | 10.93 | 29.5703 | 103.7585 | |
| London | United Kingdom | Europe & Japan | 28-May-1989 | 19-Jun-2000 | 11.06 | 51.5070 | –0.1274 | |
| Los Angeles | United States | Land-Rich Developed Countries | 28-Jun-1989 | 1-May-2000 | 10.84 | 34.0508 | –118.2536 | |
| Madrid | Spain | Europe & Japan | 25-May-1989 | 22-Aug-2000 | 11.24 | 40.4328 | –3.6865 | |
| Malatya | Turkey | Western Asia | 31-Aug-1990 | 17-Jul-2000 | 9.88 | 38.3513 | 38.3147 | |
| Manila | Philippines | Southeast Asia | 2-Apr-1993 | 3-Apr-2002 | 9.00 | 14.5922 | 120.9731 | |
| Marrakech | Morocco | Northern Africa | 6-Jan-1987 | 3-Feb-2000 | 13.08 | 31.6228 | –8.0044 | |
| Medan | Indonesia | Southeast Asia | 13-Jun-1989 | 22-Feb-2001 | 11.70 | 3.5929 | 98.6688 | |
| Mexico City | Mexico | Latin America & the Caribbean | 7-Mar-1989 | 21-Mar-2000 | 11.04 | 19.4326 | –99.1333 | |
| Milano | Italy | Europe & Japan | 31-Aug-1989 | 21-Jun-2001 | 11.81 | 45.4438 | 9.1787 | |
| Minneapolis | United States | Land-Rich Developed Countries | 22-Sep-1992 | 5-Jul-2001 | 8.78 | 44.9751 | –93.2705 | |
| Modesto | United States | Land-Rich Developed Countries | 20-Jul-1992 | 18-Jul-2000 | 7.99 | 37.6382 | –121.0000 | |
| Montevideo | Uruguay | Latin America & the Caribbean | 19-Mar-1989 | 6-Dec-2000 | 11.72 | –34.9062 | –56.2243 | |
| Moscow | Russian Federation | Europe & Japan | 8-Oct-1991 | 14-Oct-2002 | 11.02 | 55.4502 | 37.3742 | |
| Mumbai | India | South and Central Asia | 9-Nov-1992 | 25-Oct-2001 | 8.96 | 18.9577 | 72.8319 | |
| Ndola | Zambia | Sub-Saharan Africa | 2-Jun-1989 | 13-May-2002 | 12.94 | –12.9691 | 28.6512 | |
| Oktyabrsky | Russian Federation | Europe & Japan | 29-May-1986 | 19-Sep-2001 | 15.31 | 54.4891 | 53.4724 | |
| Ouagadougou | Burkina Faso | Sub-Saharan Africa | 18-Nov-1986 | 14-Jul-2001 | 14.65 | 12.3694 | –1.5233 | |
| Palembang | Indonesia | Southeast Asia | 15-Apr-1989 | 13-Jul-2001 | 12.24 | –2.9796 | 104.7475 | |
| Palermo | Italy | Europe & Japan | 4-Jun-1987 | 1-May-2001 | 13.91 | 38.1153 | 13.3622 | |
| Paris | France | Europe & Japan | 9-May-1987 | 24-Aug-2000 | 13.30 | 48.8659 | 2.3114 | |
| Philadelphia | United States | Land-Rich Developed Countries | 28-Jun-1988 | 23-Sep-1999 | 11.24 | 39.9539 | –75.1650 | |
| Pittsburgh | United States | Land-Rich Developed Countries | 5-Oct-1987 | 12-Sep-1999 | 11.94 | 40.4407 | –80.0026 | |
| Port Sudan | Sudan | Northern Africa | 13-Jun-1984 | 4-Jun-2001 | 16.97 | 19.6217 | 37.2231 | |
| Pretoria | South Africa | Sub-Saharan Africa | 7-Apr-1991 | 23-Apr-2000 | 9.05 | –25.7480 | 28.1921 | |
| Puna | India | South and Central Asia | 4-Dec-1992 | 14-Nov-1999 | 6.94 | 18.5185 | 73.8595 | |
| Pusan | Korea, Republic of | Eastern Asia & the Pacific | 31-Aug-1989 | 27-Feb-2000 | 10.49 | 35.1042 | 129.0387 | |
| Rajshahi | Bangladesh | South and Central Asia | 11-Nov-1989 | 17-Nov-2000 | 11.02 | 24.3685 | 88.5811 | |
| Ribeirao Preto | Brazil | Latin America & the Caribbean | 27-Sep-1988 | 23-Mar-2001 | 12.48 | –21.1776 | –47.8053 | |
| Saidpur | Bangladesh | South and Central Asia | 14-Nov-1990 | 20-Nov-2001 | 11.02 | 25.7781 | 88.8977 | |
| San Salvador | El Salvador | Latin America & the Caribbean | 12-Jan-1990 | 28-Oct-1999 | 9.79 | 13.6980 | –89.1914 | |
| Sanaa | Yemen | Western Asia | 20-Sep-1989 | 13-May-2000 | 10.64 | 15.3473 | 44.2063 | |
| Santiago | Chile | Latin America & the Caribbean | 17-Mar-1989 | 31-Mar-2000 | 11.04 | –33.4382 | –70.6507 | |
| Sao Paulo | Brazil | Latin America & the Caribbean | 12-Sep-1988 | 17-Jun-2000 | 11.76 | –23.5330 | –46.6330 | |
| Seoul | Korea, Republic of | Eastern Asia & the Pacific | 17-May-1989 | 23-Sep-2001 | 12.35 | 37.5534 | 126.9745 | |
| Shanghai | China | Eastern Asia & the Pacific | 11-Aug-1989 | 3-Jul-2001 | 11.89 | 31.2378 | 121.4850 | |
| Sheffield | United Kingdom | Europe & Japan | 18-May-1992 | 11-Sep-2002 | 10.32 | 53.3809 | –1.4702 | |
| Shimkent | Kazakhstan | South and Central Asia | 26-Oct-1989 | 14-Sep-2000 | 10.89 | 42.3206 | 69.5884 | |
| Singapore | Singapore | Southeast Asia | 17-Apr-1990 | 11-Nov-2002 | 12.57 | 1.2824 | 103.8461 | |
| Songkhla | Thailand | Southeast Asia | 1-Jun-1990 | 20-Apr-2001 | 10.89 | 7.1989 | 100.5906 | |
| Springfield | United States | Land-Rich Developed Countries | 28-Sep-1989 | 8-Sep-2002 | 12.94 | 42.1046 | –72.5943 | |
| St. Catharines | Canada | Land-Rich Developed Countries | 12-Jun-1992 | 12-Sep-1999 | 7.25 | 43.1795 | –79.2486 | |
| Sydney | Australia | Land-Rich Developed Countries | 25-Jul-1993 | 7-May-2002 | 8.78 | –33.7981 | 151.0706 | |
| Tacoma | United States | Land-Rich Developed Countries | 22-Sep-1990 | 25-Sep-2000 | 10.01 | 47.2553 | –122.4407 | |
| Tebessa | Algeria | Northern Africa | 5-Mar-1987 | 7-Jun-2001 | 14.26 | 35.4007 | 8.1172 | |
| Teheran | Iran | South and Central Asia | 19-Sep-1988 | 18-Jul-2000 | 11.83 | 35.7013 | 51.4194 | |
| Tel Aviv | Israel | Western Asia | 14-Aug-1987 | 21-May-2000 | 12.77 | 32.0798 | 34.7740 | |
| Thessaloniki | Greece | Europe & Japan | 19-Jul-1987 | 30-May-2001 | 13.86 | 40.6456 | 22.9361 | |
| Tijuana | Mexico | Latin America & the Caribbean | 2-Apr-1989 | 24-Apr-2000 | 11.06 | 32.5349 | –117.0417 | |
| Tokyo | Japan | Europe & Japan | 21-May-1987 | 24-Sep-2001 | 14.35 | 35.6752 | 139.7719 | |
| Ulan Bator | Mongolia | Eastern Asia & the Pacific | 30-Aug-1989 | 31-Aug-2001 | 12.00 | 47.9130 | 106.8954 | |
| Valledupar | Colombia | Latin America & the Caribbean | 30-Dec-1989 | 4-Oct-2001 | 11.76 | 10.4732 | –73.2501 | |
| Victoria | Canada | Land-Rich Developed Countries | 15-Aug-1991 | 30-Jul-2000 | 8.96 | 48.4271 | –123.3639 | |
| Vijayawada | India | South and Central Asia | 10-Nov-1990 | 28-Oct-2000 | 9.97 | 16.5282 | 80.5912 | |
| Warsaw | Poland | Europe & Japan | 25-May-1992 | 17-Aug-2002 | 10.23 | 52.2342 | 21.0060 | |
| Wien | Austria | Europe & Japan | 10-Sep-1991 | 24-May-2001 | 9.70 | 48.2129 | 16.3687 | |
| Yerevan | Armenia | Western Asia | 31-Aug-1989 | 13-Aug-2000 | 10.95 | 40.1774 | 44.5121 | |
| Yiyang | China | Eastern Asia & the Pacific | 2-Jul-1994 | 10-Sep-1999 | 5.19 | 28.5862 | 112.3445 | |
| Yulin | China | Eastern Asia & the Pacific | 30-Oct-1991 | 30-Oct-2000 | 9.00 | 22.6366 | 110.1453 | |
| Zhengzhou | China | Eastern Asia & the Pacific | 14-May-1988 | 10-May-2001 | 12.99 | 34.7480 | 113.6192 | |
| Zugdidi | Georgia | Western Asia | 16-Aug-1987 | 10-Jul-2000 | 12.90 | 42.5037 | 41.8691 | |
| City | Built-Up Area T1 | Built-Up Area T2 | Urban Built-Up Area T1 | Urban Built-Up Area T2 | Suburban Built-Up Area T1 | Suburban Built-Up Area T2 | Rural Built-Up Area T1 | Rural Built-Up Area T2 |
| Accra | 12,973 | 32,834 | 10,900 | 29,029 | 1,783 | 3,565 | 290 | 240 |
| Addis Ababa | 8,193 | 11,865 | 5,354 | 8,383 | 2,622 | 3,209 | 216 | 273 |
| Ahvaz | 15,106 | 21,945 | 6,050 | 8,629 | 4,600 | 7,251 | 4,455 | 6,065 |
| Akashi | 2,077 | 3,572 | 803 | 3,298 | 1,270 | 273 | 3 | 1 |
| Alexandria | 11,342 | 18,780 | 7,552 | 13,717 | 2,859 | 3,596 | 930 | 1,467 |
| Algiers | 13,946 | 22,913 | 5,307 | 12,181 | 7,146 | 9,359 | 1,493 | 1,372 |
| Anqing | 2,948 | 3,552 | 1,541 | 1,770 | 1,041 | 1,465 | 366 | 318 |
| Ansan | 4,677 | 8,864 | 3,215 | 6,342 | 1,358 | 2,404 | 104 | 118 |
| Astrakhan | 15,303 | 16,153 | 7,567 | 7,979 | 5,862 | 6,261 | 1,874 | 1,914 |
| Aswan | 1,260 | 1,579 | 461 | 669 | 770 | 888 | 29 | 22 |
| Bacolod | 1,344 | 3,294 | 446 | 2,336 | 749 | 861 | 149 | 97 |
| Baku | 6,664 | 9,015 | 1,666 | 2,911 | 3,876 | 4,912 | 1,122 | 1,193 |
| Bamako | 6,884 | 12,992 | 4,222 | 7,797 | 1,736 | 2,895 | 926 | 2,300 |
| Bandung | 10,872 | 15,382 | 6,968 | 10,819 | 3,714 | 4,305 | 191 | 258 |
| Bangkok | 68,303 | 102,593 | 30,178 | 58,906 | 35,042 | 41,253 | 3,083 | 2,434 |
| Banjul | 3,124 | 4,949 | 1,582 | 3,315 | 1,334 | 1,419 | 208 | 216 |
| Beijing | 124,578 | 157,638 | 62,845 | 89,188 | 54,569 | 62,444 | 7,164 | 6,006 |
| Budapest | 30,683 | 36,977 | 24,306 | 29,740 | 5,976 | 6,749 | 401 | 488 |
| Buenos Aires | 120,595 | 135,722 | 101,810 | 114,595 | 16,975 | 18,944 | 1,810 | 2,184 |
| Cairo | 36,605 | 56,917 | 24,753 | 40,015 | 10,273 | 14,642 | 1,578 | 2,260 |
| Caracas | 11,938 | 15,673 | 6,566 | 9,435 | 4,660 | 5,358 | 711 | 879 |
| Casablanca | 8,054 | 11,431 | 5,360 | 8,650 | 2,401 | 2,491 | 293 | 290 |
| Castellon | 6,960 | 8,203 | 2,751 | 3,605 | 3,794 | 4,195 | 415 | 404 |
| Cebu | 5,277 | 6,365 | 3,475 | 4,317 | 1,676 | 1,975 | 125 | 73 |
| Changzhi | 7,825 | 11,500 | 3,353 | 5,564 | 3,918 | 5,429 | 554 | 506 |
| Chicago | 373,224 | 425,126 | 297,001 | 342,052 | 68,129 | 77,793 | 8,095 | 5,281 |
| Chinju | 3,247 | 5,208 | 1,392 | 1,791 | 1,190 | 2,762 | 665 | 655 |
| Chonan | 2,388 | 5,898 | 754 | 1,812 | 1,196 | 3,598 | 438 | 488 |
| Cincinnati | 59,268 | 77,225 | 28,664 | 39,022 | 26,522 | 34,981 | 4,082 | 3,221 |
| Coimbatore | 7,125 | 10,479 | 2,478 | 4,463 | 3,242 | 4,480 | 1,404 | 1,536 |
| Dhaka | 10,209 | 16,563 | 4,897 | 8,277 | 4,579 | 7,135 | 733 | 1,150 |
| Fukuoka | 27,288 | 37,203 | 20,476 | 29,116 | 6,412 | 7,631 | 399 | 456 |
| Gorgan | 6,935 | 10,711 | 1,551 | 3,079 | 3,988 | 5,996 | 1,396 | 1,636 |
| Guadalajara | 30,935 | 40,518 | 23,264 | 31,760 | 6,781 | 7,642 | 890 | 1,117 |
| Guangzhou | 32,188 | 64,106 | 11,730 | 27,179 | 15,170 | 30,692 | 5,289 | 6,234 |
| Guaruja | 3,102 | 3,664 | 2,017 | 2,725 | 1,017 | 885 | 68 | 55 |
| Guatemala City | 14,436 | 18,903 | 9,991 | 14,485 | 4,195 | 4,145 | 251 | 272 |
| Harare | 16,506 | 24,310 | 5,681 | 10,213 | 7,778 | 10,674 | 3,047 | 3,422 |
| Ho Chi Minh City | 7,283 | 21,033 | 4,298 | 13,144 | 2,295 | 7,170 | 690 | 719 |
| Hong Kong | 7,490 | 9,763 | 5,273 | 7,228 | 2,111 | 2,450 | 105 | 86 |
| Houston | 130,325 | 182,374 | 76,955 | 136,689 | 50,621 | 43,725 | 2,750 | 1,961 |
| Hyderabad | 17,336 | 31,754 | 9,197 | 20,579 | 6,451 | 9,024 | 1,688 | 2,152 |
| Ibadan | 20,921 | 29,996 | 16,199 | 24,542 | 3,653 | 4,116 | 1,069 | 1,338 |
| Ilheus | 2,877 | 4,970 | 426 | 871 | 1,623 | 2,718 | 828 | 1,381 |
| Ipoh | 14,517 | 21,906 | 6,370 | 14,147 | 7,901 | 7,443 | 246 | 315 |
| Istanbul | 30,632 | 53,269 | 18,803 | 37,245 | 10,108 | 13,741 | 1,721 | 2,282 |
| Jaipur | 5,869 | 14,084 | 3,166 | 11,306 | 1,743 | 1,865 | 960 | 913 |
| Jalna | 919 | 1,952 | 239 | 763 | 477 | 926 | 202 | 263 |
| Jequie | 1,824 | 3,655 | 1,062 | 2,829 | 468 | 535 | 293 | 292 |
| Johannesburg | 87,163 | 99,279 | 51,483 | 63,277 | 31,378 | 31,978 | 4,303 | 4,025 |
| Kampala | 13,156 | 20,169 | 5,690 | 11,377 | 6,213 | 7,566 | 1,254 | 1,226 |
| Kanpur | 12,355 | 17,668 | 6,440 | 9,891 | 4,509 | 6,064 | 1,405 | 1,713 |
| Kigali | 1,517 | 4,502 | 253 | 3,097 | 1,048 | 1,210 | 216 | 195 |
| Kingston | 10,888 | 11,945 | 7,092 | 8,042 | 3,352 | 3,442 | 445 | 461 |
| Kolkata | 28,816 | 48,344 | 11,900 | 21,599 | 10,881 | 20,044 | 6,034 | 6,700 |
| Kuala Lumpur | 38,329 | 80,529 | 22,925 | 61,699 | 13,822 | 17,719 | 1,582 | 1,111 |
| Kuwait City | 32,434 | 39,562 | 21,624 | 28,204 | 7,840 | 8,161 | 2,970 | 3,197 |
| Le Mans | 6,805 | 7,444 | 4,310 | 4,726 | 2,101 | 2,331 | 395 | 387 |
| Leipzig | 9,820 | 19,580 | 4,385 | 11,248 | 4,537 | 7,614 | 899 | 719 |
| Leshan | 5,263 | 9,944 | 1,194 | 3,047 | 3,253 | 5,985 | 815 | 912 |
| London | 157,323 | 185,551 | 115,200 | 139,373 | 37,507 | 40,539 | 4,616 | 5,638 |
| Los Angeles | 342,194 | 385,089 | 295,765 | 341,678 | 44,419 | 41,392 | 2,010 | 2,018 |
| Madrid | 27,647 | 36,979 | 17,002 | 23,993 | 9,570 | 11,946 | 1,075 | 1,040 |
| Malatya | 9,125 | 13,747 | 1,361 | 2,973 | 5,407 | 7,871 | 2,356 | 2,903 |
| Manila | 42,784 | 63,317 | 26,653 | 44,944 | 13,796 | 16,247 | 2,335 | 2,125 |
| Marrakech | 9,706 | 16,475 | 4,010 | 6,047 | 4,871 | 7,586 | 826 | 2,843 |
| Medan | 9,858 | 14,559 | 6,002 | 9,792 | 3,408 | 4,577 | 449 | 189 |
| Mexico City | 78,030 | 105,853 | 60,669 | 87,802 | 15,273 | 15,744 | 2,088 | 2,307 |
| Milano | 53,905 | 63,517 | 34,110 | 45,192 | 18,815 | 17,596 | 980 | 729 |
| Minneapolis | 88,564 | 109,971 | 51,226 | 75,046 | 34,261 | 33,044 | 3,077 | 1,882 |
| Modesto | 12,483 | 16,892 | 7,768 | 11,288 | 3,555 | 4,600 | 1,160 | 1,004 |
| Montevideo | 25,310 | 35,725 | 13,185 | 20,415 | 9,580 | 11,665 | 2,545 | 3,646 |
| Moscow | 72,378 | 104,632 | 36,988 | 67,062 | 29,883 | 31,870 | 5,507 | 5,699 |
| Mumbai | 28,898 | 37,090 | 23,810 | 29,977 | 4,542 | 6,157 | 545 | 956 |
| Ndola | 4,133 | 5,390 | 1,120 | 2,161 | 1,589 | 1,724 | 138 | 155 |
| Oktyabrsky | 7,557 | 9,786 | 2,550 | 3,684 | 3,407 | 4,341 | 1,601 | 1,762 |
| Ouagadougou | 6,027 | 13,746 | 4,888 | 11,862 | 1,028 | 1,464 | 111 | 421 |
| Palembang | 6,760 | 17,504 | 2,805 | 10,966 | 3,364 | 5,957 | 591 | 580 |
| Palermo | 7,264 | 8,087 | 4,415 | 5,165 | 2,587 | 2,652 | 261 | 270 |
| Paris | 128,735 | 148,208 | 98,635 | 120,895 | 27,730 | 25,342 | 2,369 | 1,972 |
| Philadelphia | 189,402 | 233,491 | 114,374 | 152,938 | 70,074 | 77,245 | 4,954 | 3,308 |
| Pittsburgh | 41,303 | 47,213 | 16,503 | 22,016 | 23,198 | 23,857 | 1,602 | 1,339 |
| Port Sudan | 2,673 | 4,104 | 1,906 | 3,182 | 637 | 770 | 129 | 151 |
| Pretoria | 15,011 | 17,004 | 9,421 | 11,757 | 5,200 | 4,886 | 390 | 361 |
| Puna | 9,279 | 19,149 | 4,675 | 13,731 | 3,782 | 4,968 | 823 | 449 |
| Pusan | 14,658 | 19,686 | 10,386 | 14,633 | 3,831 | 4,619 | 441 | 433 |
| Rajshahi | 1,086 | 2,026 | 0 | 44 | 437 | 1,188 | 649 | 794 |
| Ribeirao Preto | 8,505 | 10,034 | 7,045 | 7,962 | 1,188 | 1,734 | 273 | 337 |
| Saidpur | 517 | 759 | 145 | 202 | 148 | 209 | 224 | 348 |
| San Salvador | 9,813 | 12,862 | 6,795 | 9,700 | 2,637 | 2,801 | 381 | 361 |
| Sanaa | 10,751 | 15,528 | 7,290 | 12,414 | 3,176 | 2,869 | 285 | 245 |
| Santiago | 33,740 | 43,851 | 26,833 | 35,650 | 5,935 | 7,103 | 971 | 1,098 |
| Sao Paulo | 126,354 | 155,418 | 107,349 | 135,970 | 16,701 | 16,906 | 2,304 | 2,542 |
| Seoul | 51,285 | 70,614 | 38,800 | 54,234 | 11,421 | 15,384 | 1,064 | 996 |
| Shanghai | 65,117 | 116,186 | 38,923 | 77,055 | 19,978 | 37,849 | 6,217 | 1,282 |
| Sheffield | 14,732 | 15,880 | 9,993 | 11,123 | 4,413 | 4,415 | 326 | 343 |
| Shimkent | 12,324 | 14,565 | 7,650 | 9,251 | 3,923 | 4,386 | 750 | 928 |
| Singapore | 17,594 | 24,524 | 9,168 | 16,833 | 8,042 | 7,288 | 384 | 404 |
| Songkhla | 1,381 | 1,899 | 554 | 678 | 543 | 774 | 284 | 446 |
| Springfield | 13,586 | 23,770 | 5,591 | 13,408 | 6,985 | 9,917 | 1,010 | 444 |
| St. Catharines | 8,887 | 11,418 | 5,379 | 6,823 | 2,578 | 3,949 | 929 | 647 |
| Sydney | 64,062 | 75,951 | 45,922 | 58,892 | 16,288 | 15,474 | 1,853 | 1,585 |
| Tacoma | 34,606 | 44,526 | 18,025 | 31,045 | 15,271 | 12,359 | 1,310 | 1,122 |
| Tebessa | 5,091 | 7,537 | 1,015 | 2,235 | 1,627 | 2,390 | 2,449 | 2,912 |
| Teheran | 36,160 | 47,170 | 27,881 | 38,124 | 7,299 | 7,887 | 980 | 1,159 |
| Tel Aviv | 16,648 | 34,022 | 8,390 | 19,181 | 6,872 | 13,847 | 1,386 | 994 |
| Thessaloniki | 5,172 | 7,144 | 3,438 | 5,047 | 1,552 | 1,975 | 182 | 122 |
| Tijuana | 12,161 | 20,808 | 9,576 | 17,654 | 2,421 | 2,935 | 164 | 219 |
| Tokyo | 231,865 | 256,425 | 200,220 | 231,789 | 31,281 | 24,330 | 364 | 306 |
| Ulan Bator | 9,336 | 12,857 | 6,508 | 9,057 | 2,127 | 2,904 | 701 | 896 |
| Valledupar | 2,003 | 2,704 | 1,374 | 1,816 | 255 | 475 | 374 | 413 |
| Victoria | 8,160 | 10,735 | 5,060 | 7,869 | 2,878 | 2,712 | 223 | 154 |
| Vijayawada | 4,030 | 6,234 | 2,140 | 3,401 | 1,350 | 2,054 | 540 | 778 |
| Warsaw | 24,899 | 33,217 | 14,309 | 22,110 | 10,073 | 10,533 | 516 | 574 |
| Wien | 26,516 | 39,450 | 11,350 | 22,926 | 12,739 | 14,665 | 2,427 | 1,859 |
| Yerevan | 32,369 | 41,569 | 11,809 | 15,374 | 14,955 | 20,843 | 5,605 | 5,351 |
| Yiyang | 4,840 | 9,562 | 1,082 | 2,600 | 1,701 | 5,031 | 2,057 | 1,931 |
| Yulin | 14,119 | 25,001 | 1,475 | 4,337 | 6,443 | 13,285 | 6,201 | 7,379 |
| Zhengzhou | 45,092 | 78,954 | 15,415 | 31,443 | 23,634 | 41,975 | 6,043 | 5,535 |
| Zugdidi | 2,463 | 4,134 | 991 | 1,628 | 839 | 1,687 | 632 | 819 |
| Accra | 1,818,178 | 2,693,371 | 6,368 | 12,838 | 94 | 142 | 19,341 | 45,672 |
| Addis Ababa | 1,653,379 | 2,510,904 | 8,734 | 10,258 | 358 | 270 | 16,926 | 22,123 |
| Ahvaz | 870,277 | 1,258,713 | 9,428 | 16,527 | 180 | 658 | 24,533 | 38,472 |
| Akashi | 281,127 | 294,657 | 2,657 | 1,293 | 90 | 23 | 4,734 | 4,865 |
| Alexandria | 3,042,907 | 3,378,392 | 6,284 | 9,150 | 322 | 679 | 17,624 | 27,929 |
| Algiers | 2,671,427 | 3,627,912 | 18,182 | 25,688 | 1,120 | 1,956 | 32,128 | 48,601 |
| Anqing | 486,057 | 578,216 | 2,831 | 4,543 | 117 | 404 | 5,778 | 8,095 |
| Ansan | 435,490 | 993,560 | 3,390 | 7,374 | 240 | 960 | 8,067 | 16,237 |
| Astrakhan | 582,813 | 594,015 | 17,582 | 18,435 | 418 | 388 | 32,885 | 34,588 |
| Aswan | 225,969 | 310,069 | 959 | 1,022 | 0 | 0 | 2,218 | 2,601 |
| Bacolod | 461,590 | 510,321 | 2,153 | 2,231 | 31 | 17 | 3,497 | 5,525 |
| Baku | 1,822,524 | 2,067,017 | 9,930 | 12,305 | 145 | 113 | 16,594 | 21,320 |
| Bamako | 829,438 | 1,239,935 | 5,040 | 9,811 | 123 | 96 | 11,924 | 22,802 |
| Bandung | 2,976,681 | 3,671,064 | 10,832 | 13,113 | 507 | 768 | 21,704 | 28,494 |
| Bangkok | 8,238,697 | 9,761,697 | 92,113 | 111,953 | 7,024 | 9,751 | 160,417 | 214,546 |
| Banjul | 235,692 | 447,985 | 3,669 | 4,696 | 39 | 82 | 6,792 | 9,645 |
| Beijing | 9,121,122 | 11,866,221 | 155,832 | 176,915 | 8,037 | 11,515 | 280,410 | 334,553 |
| Budapest | 2,135,175 | 2,052,781 | 16,292 | 20,553 | 655 | 1,650 | 46,976 | 57,530 |
| Buenos Aires | 11,201,993 | 11,915,543 | 63,025 | 69,732 | 4,236 | 4,243 | 183,620 | 205,454 |
| Cairo | 10,161,703 | 13,083,621 | 23,918 | 34,506 | 916 | 3,084 | 60,523 | 91,424 |
| Caracas | 1,218,412 | 1,308,279 | 13,718 | 15,421 | 510 | 780 | 25,656 | 31,094 |
| Casablanca | 2,291,087 | 3,004,505 | 7,920 | 8,869 | 262 | 427 | 15,974 | 20,300 |
| Castellon | 251,102 | 268,712 | 9,807 | 11,962 | 322 | 740 | 16,767 | 20,165 |
| Cebu | 1,117,947 | 1,524,080 | 5,042 | 5,579 | 247 | 98 | 10,319 | 11,945 |
| Changzhi | 852,719 | 928,518 | 8,363 | 13,705 | 273 | 971 | 16,188 | 25,205 |
| Chicago | 7,559,322 | 8,590,032 | 258,751 | 285,616 | 25,559 | 29,051 | 631,975 | 710,742 |
| Chinju | 330,240 | 342,454 | 3,025 | 7,336 | 67 | 77 | 6,272 | 12,544 |
| Chonan | 296,527 | 424,046 | 4,007 | 10,012 | 45 | 762 | 6,395 | 15,910 |
| Cincinnati | 1,442,457 | 1,517,716 | 85,906 | 109,155 | 7,787 | 7,980 | 145,174 | 186,380 |
| Coimbatore | 1,072,865 | 1,399,225 | 9,728 | 14,823 | 179 | 427 | 16,853 | 25,302 |
| Dhaka | 6,488,641 | 9,196,964 | 11,992 | 21,012 | 227 | 273 | 22,201 | 37,575 |
| Fukuoka | 2,385,823 | 2,598,370 | 14,705 | 20,331 | 703 | 1,442 | 41,993 | 57,535 |
| Gorgan | 362,277 | 455,061 | 8,638 | 12,017 | 219 | 734 | 15,573 | 22,728 |
| Guadalajara | 3,004,120 | 3,669,578 | 21,397 | 25,894 | 1,075 | 935 | 52,332 | 66,412 |
| Guangzhou | 3,812,189 | 7,156,071 | 38,311 | 90,831 | 1,305 | 7,069 | 70,500 | 154,937 |
| Guaruja | 221,618 | 277,993 | 2,295 | 2,112 | 309 | 348 | 5,397 | 5,776 |
| Guatemala City | 1,421,625 | 1,766,093 | 11,861 | 13,153 | 804 | 1,145 | 26,298 | 32,055 |
| Harare | 838,775 | 889,421 | 23,646 | 33,810 | 1,785 | 1,864 | 40,153 | 58,119 |
| Ho Chi Minh City | 3,579,382 | 4,309,449 | 7,431 | 18,691 | 283 | 1,297 | 14,714 | 39,724 |
| Hong Kong | 4,751,952 | 5,179,089 | 4,355 | 5,337 | 222 | 366 | 11,844 | 15,101 |
| Houston | 3,023,503 | 3,656,247 | 144,177 | 141,494 | 16,508 | 17,026 | 274,502 | 323,868 |
| Hyderabad | 4,887,789 | 5,707,677 | 20,373 | 29,796 | 1,104 | 1,431 | 37,709 | 61,550 |
| Ibadan | 1,565,805 | 2,421,369 | 10,953 | 13,970 | 133 | 268 | 31,874 | 43,967 |
| Ilheus | 153,323 | 151,509 | 3,632 | 6,132 | 65 | 59 | 6,509 | 11,102 |
| Ipoh | 521,338 | 655,200 | 18,586 | 19,398 | 1,357 | 1,882 | 33,103 | 41,304 |
| Istanbul | 6,090,097 | 8,826,758 | 28,902 | 40,493 | 1,468 | 1,776 | 59,534 | 93,762 |
| Jaipur | 2,115,566 | 2,779,119 | 5,846 | 7,826 | 288 | 142 | 11,715 | 21,910 |
| Jalna | 338,175 | 424,304 | 988 | 2,015 | 5 | 1 | 1,907 | 3,966 |
| Jequie | 135,020 | 138,216 | 1,536 | 1,663 | 89 | 140 | 3,360 | 5,318 |
| Johannesburg | 3,521,614 | 4,695,165 | 107,139 | 110,676 | 8,754 | 9,450 | 194,303 | 209,955 |
| Kampala | 1,314,603 | 1,761,733 | 19,934 | 24,565 | 677 | 891 | 33,091 | 44,734 |
| Kanpur | 1,972,220 | 2,674,116 | 13,105 | 18,243 | 272 | 810 | 25,459 | 35,910 |
| Kigali | 296,879 | 354,273 | 2,911 | 4,642 | 92 | 48 | 4,428 | 9,144 |
| Kingston | 790,037 | 875,605 | 10,093 | 10,647 | 570 | 527 | 20,982 | 22,592 |
| Kolkata | 10,979,222 | 13,170,280 | 35,571 | 72,414 | 1,032 | 2,559 | 64,386 | 120,758 |
| Kuala Lumpur | 2,961,111 | 5,389,624 | 37,875 | 55,290 | 2,869 | 4,197 | 76,204 | 135,819 |
| Kuwait City | 1,863,888 | 1,999,068 | 22,376 | 23,347 | 3,179 | 2,952 | 54,810 | 62,909 |
| Le Mans | 208,970 | 212,064 | 6,001 | 6,565 | 496 | 543 | 12,807 | 14,009 |
| Leipzig | 791,857 | 664,696 | 12,881 | 20,461 | 562 | 995 | 22,701 | 40,042 |
| Leshan | 919,835 | 966,091 | 7,640 | 13,912 | 260 | 478 | 12,903 | 23,856 |
| London | 9,932,047 | 10,028,978 | 118,954 | 140,287 | 12,020 | 14,739 | 276,276 | 325,838 |
| Los Angeles | 11,982,247 | 13,218,754 | 162,105 | 155,483 | 10,464 | 9,229 | 504,299 | 540,571 |
| Madrid | 4,137,778 | 4,588,170 | 27,581 | 35,099 | 1,097 | 2,240 | 55,228 | 72,077 |
| Malatya | 701,862 | 852,864 | 13,383 | 18,804 | 415 | 564 | 22,507 | 32,551 |
| Manila | 14,044,055 | 17,335,085 | 43,427 | 51,246 | 2,087 | 3,237 | 86,211 | 114,563 |
| Marrakech | 1,328,537 | 1,722,999 | 7,889 | 14,733 | 13 | 380 | 17,595 | 31,208 |
| Medan | 1,918,544 | 2,239,596 | 10,923 | 13,278 | 490 | 620 | 20,781 | 27,837 |
| Mexico City | 14,419,067 | 17,224,096 | 55,626 | 59,941 | 3,012 | 2,430 | 133,655 | 165,794 |
| Milano | 3,776,011 | 3,708,980 | 55,682 | 57,077 | 5,915 | 5,963 | 109,588 | 120,595 |
| Minneapolis | 1,956,479 | 2,167,795 | 100,263 | 106,840 | 7,571 | 8,593 | 188,826 | 216,811 |
| Modesto | 296,090 | 344,540 | 11,938 | 16,078 | 742 | 1,684 | 24,421 | 32,970 |
| Montevideo | 1,712,955 | 1,838,801 | 29,215 | 34,046 | 1,228 | 1,110 | 54,525 | 69,771 |
| Moscow | 9,566,266 | 9,144,624 | 87,933 | 103,149 | 3,924 | 5,111 | 160,311 | 207,782 |
| Mumbai | 13,464,455 | 16,161,758 | 13,167 | 18,405 | 399 | 669 | 42,065 | 55,496 |
| Ndola | 350,512 | 326,119 | 1,816 | 1,786 | 459 | 229 | 3,512 | 4,549 |
| Oktyabrsky | 225,671 | 228,371 | 9,963 | 13,593 | 154 | 232 | 17,520 | 23,379 |
| Ouagadougou | 615,293 | 874,623 | 3,723 | 5,408 | 180 | 144 | 9,750 | 19,154 |
| Palembang | 1,206,169 | 1,616,527 | 9,580 | 15,969 | 326 | 804 | 16,339 | 33,473 |
| Palermo | 828,637 | 833,992 | 7,301 | 7,582 | 498 | 358 | 14,565 | 15,669 |
| Paris | 9,275,994 | 9,519,527 | 97,443 | 92,626 | 7,479 | 8,120 | 226,178 | 240,834 |
| Philadelphia | 5,092,361 | 5,238,892 | 210,880 | 245,378 | 20,463 | 21,411 | 400,282 | 478,869 |
| Pittsburgh | 1,255,475 | 1,185,877 | 66,350 | 69,588 | 6,862 | 7,243 | 107,653 | 116,801 |
| Port Sudan | 155,821 | 209,154 | 1,621 | 1,923 | 79 | 68 | 4,294 | 6,026 |
| Pretoria | 432,031 | 659,834 | 17,523 | 17,780 | 1,215 | 1,281 | 32,534 | 34,784 |
| Puna | 3,508,945 | 4,041,868 | 10,966 | 13,049 | 533 | 818 | 20,245 | 32,198 |
| Pusan | 3,976,052 | 3,485,359 | 8,734 | 12,052 | 544 | 1,066 | 23,391 | 31,738 |
| Rajshahi | 490,564 | 599,525 | 2,033 | 5,160 | 60 | 76 | 3,119 | 7,186 |
| Ribeirao Preto | 411,029 | 512,239 | 3,935 | 5,771 | 221 | 570 | 12,441 | 15,805 |
| Saidpur | 200,427 | 233,478 | 436 | 787 | 1 | 8 | 953 | 1,546 |
| San Salvador | 1,575,826 | 2,022,047 | 8,534 | 9,269 | 256 | 370 | 18,347 | 22,131 |
| Sanaa | 963,065 | 1,474,635 | 6,588 | 5,660 | 264 | 338 | 17,339 | 21,188 |
| Santiago | 4,654,096 | 5,337,512 | 21,088 | 24,682 | 867 | 1,012 | 54,828 | 68,534 |
| Sao Paulo | 12,892,124 | 15,481,476 | 57,017 | 60,873 | 3,565 | 4,743 | 183,371 | 216,292 |
| Seoul | 13,621,399 | 14,546,082 | 33,620 | 49,214 | 2,780 | 5,143 | 84,905 | 119,828 |
| Shanghai | 10,834,643 | 14,133,931 | 72,599 | 122,695 | 6,016 | 11,968 | 137,716 | 238,881 |
| Sheffield | 769,486 | 764,213 | 11,931 | 13,358 | 933 | 844 | 26,662 | 29,238 |
| Shimkent | 599,956 | 577,753 | 9,470 | 12,642 | 200 | 405 | 21,793 | 27,206 |
| Singapore | 3,005,362 | 4,309,797 | 20,785 | 20,322 | 1,536 | 877 | 38,379 | 44,847 |
| Songkhla | 219,751 | 244,403 | 1,510 | 2,089 | 17 | 23 | 2,891 | 3,987 |
| Springfield | 431,026 | 427,126 | 24,892 | 30,079 | 1,999 | 2,835 | 38,478 | 53,849 |
| St. Catharines | 177,727 | 182,863 | 7,598 | 11,576 | 469 | 717 | 16,485 | 22,994 |
| Sydney | 2,634,121 | 2,754,486 | 52,630 | 52,321 | 2,969 | 3,465 | 116,692 | 128,272 |
| Tacoma | 590,266 | 697,104 | 44,867 | 41,306 | 3,077 | 2,963 | 79,472 | 85,832 |
| Tebessa | 366,628 | 457,364 | 3,792 | 5,449 | 55 | 157 | 8,883 | 12,985 |
| Teheran | 5,807,438 | 7,803,538 | 22,396 | 26,210 | 875 | 1,567 | 58,557 | 73,380 |
| Tel Aviv | 2,062,274 | 2,610,373 | 18,530 | 42,585 | 590 | 3,206 | 35,178 | 76,607 |
| Thessaloniki | 770,764 | 857,935 | 4,368 | 6,234 | 166 | 305 | 9,540 | 13,378 |
| Tijuana | 638,376 | 1,174,193 | 7,697 | 9,242 | 327 | 571 | 19,858 | 30,050 |
| Tokyo | 27,401,984 | 29,615,263 | 118,041 | 102,467 | 5,448 | 5,005 | 349,906 | 358,893 |
| Ulan Bator | 632,833 | 776,538 | 6,153 | 8,000 | 129 | 149 | 15,489 | 20,857 |
| Valledupar | 233,819 | 288,448 | 815 | 1,387 | 1 | 32 | 2,818 | 4,091 |
| Victoria | 239,565 | 255,055 | 7,784 | 8,070 | 319 | 448 | 15,944 | 18,804 |
| Vijayawada | 981,395 | 1,117,042 | 3,387 | 5,212 | 84 | 124 | 7,417 | 11,445 |
| Warsaw | 1,984,065 | 2,002,178 | 25,412 | 29,744 | 1,872 | 1,718 | 50,311 | 62,961 |
| Wien | 2,065,478 | 2,118,871 | 36,937 | 40,213 | 1,005 | 1,528 | 63,453 | 79,663 |
| Yerevan | 2,207,409 | 2,063,290 | 40,035 | 50,938 | 1,107 | 1,464 | 72,404 | 92,506 |
| Yiyang | 1,125,056 | 1,207,164 | 5,316 | 14,834 | 137 | 1,038 | 10,156 | 24,396 |
| Yulin | 3,178,605 | 3,387,078 | 21,504 | 42,700 | 482 | 1,280 | 35,623 | 67,702 |
| Zhengzhou | 3,824,517 | 5,133,266 | 79,647 | 142,125 | 4,600 | 7,566 | 124,739 | 221,079 |
| Zugdidi | 115,680 | 157,008 | 2,773 | 5,854 | 240 | 240 | 5,236 | 9,987 |
| Accra | 1.49 | 1.39 | 0.27 | 0.19 | 19,861 | 2,094 | 16,158 | 1,609 |
| Addis Ababa | 2.07 | 1.86 | 0.40 | 0.36 | 3,672 | 964 | 2,160 | 548 |
| Ahvaz | 1.62 | 1.75 | 0.60 | 0.59 | 6,839 | 632 | 4,535 | 1,672 |
| Akashi | 2.28 | 1.36 | 0.54 | 0.25 | 1,495 | 685 | 805 | 5 |
| Alexandria | 1.55 | 1.49 | 0.37 | 0.34 | 7,438 | 899 | 5,419 | 1,120 |
| Algiers | 2.30 | 2.12 | 0.59 | 0.49 | 8,966 | 1,557 | 6,543 | 867 |
| Anqing | 1.96 | 2.28 | 0.48 | 0.49 | 604 | 52 | 414 | 138 |
| Ansan | 1.72 | 1.83 | 0.40 | 0.34 | 4,187 | 582 | 3,181 | 424 |
| Astrakhan | 2.15 | 2.14 | 0.53 | 0.53 | 850 | 130 | 551 | 169 |
| Aswan | 1.76 | 1.65 | 0.52 | 0.48 | 319 | 48 | 244 | 26 |
| Bacolod | 2.60 | 1.68 | 0.61 | 0.38 | 1,950 | 265 | 1,504 | 182 |
| Baku | 2.49 | 2.36 | 0.65 | 0.61 | 2,351 | 351 | 1,547 | 453 |
| Bamako | 1.73 | 1.76 | 0.44 | 0.44 | 6,108 | 654 | 3,257 | 2,197 |
| Bandung | 2.00 | 1.85 | 0.41 | 0.37 | 4,510 | 1,033 | 2,717 | 760 |
| Bangkok | 2.35 | 2.09 | 0.54 | 0.46 | 34,290 | 7,832 | 22,891 | 3,567 |
| Banjul | 2.17 | 1.95 | 0.48 | 0.39 | 1,825 | 325 | 1,277 | 224 |
| Beijing | 2.25 | 2.12 | 0.46 | 0.41 | 33,060 | 8,310 | 22,259 | 2,491 |
| Budapest | 1.53 | 1.56 | 0.29 | 0.28 | 6,294 | 1,939 | 3,338 | 1,017 |
| Buenos Aires | 1.52 | 1.51 | 0.23 | 0.23 | 15,127 | 4,917 | 8,538 | 1,672 |
| Cairo | 1.65 | 1.61 | 0.36 | 0.33 | 20,312 | 3,820 | 13,118 | 3,375 |
| Caracas | 2.15 | 1.98 | 0.48 | 0.43 | 3,735 | 1,197 | 2,047 | 491 |
| Casablanca | 1.98 | 1.78 | 0.44 | 0.33 | 3,376 | 1,398 | 1,641 | 338 |
| Castellon | 2.41 | 2.46 | 0.55 | 0.52 | 1,243 | 225 | 815 | 204 |
| Cebu | 1.96 | 1.88 | 0.40 | 0.37 | 1,089 | 342 | 644 | 103 |
| Changzhi | 2.07 | 2.19 | 0.54 | 0.49 | 3,674 | 541 | 2,483 | 651 |
| Chicago | 1.69 | 1.67 | 0.28 | 0.26 | 51,902 | 16,537 | 33,256 | 2,109 |
| Chinju | 1.93 | 2.41 | 0.56 | 0.59 | 1,961 | 94 | 1,334 | 533 |
| Chonan | 2.68 | 2.70 | 0.64 | 0.59 | 3,510 | 170 | 2,467 | 873 |
| Cincinnati | 2.45 | 2.41 | 0.51 | 0.49 | 17,957 | 2,856 | 12,856 | 2,244 |
| Coimbatore | 2.37 | 2.41 | 0.63 | 0.57 | 3,354 | 589 | 2,007 | 757 |
| Dhaka | 2.17 | 2.27 | 0.53 | 0.51 | 6,354 | 1,233 | 2,639 | 2,482 |
| Fukuoka | 1.54 | 1.55 | 0.32 | 0.30 | 9,916 | 2,206 | 6,283 | 1,427 |
| Gorgan | 2.25 | 2.12 | 0.68 | 0.62 | 3,776 | 502 | 2,579 | 694 |
| Guadalajara | 1.69 | 1.64 | 0.30 | 0.27 | 9,583 | 3,062 | 5,140 | 1,381 |
| Guangzhou | 2.19 | 2.42 | 0.58 | 0.54 | 31,917 | 1,726 | 23,648 | 6,543 |
| Guaruja | 1.74 | 1.58 | 0.40 | 0.35 | 562 | 222 | 323 | 18 |
| Guatemala City | 1.82 | 1.70 | 0.37 | 0.32 | 4,477 | 1,244 | 2,824 | 410 |
| Harare | 2.43 | 2.39 | 0.62 | 0.57 | 96,069 | 11,923 | 64,612 | 19,534 |
| Ho Chi Minh City | 2.02 | 1.89 | 0.44 | 0.38 | 13,750 | 1,100 | 10,451 | 2,199 |
| Hong Kong | 1.58 | 1.55 | 0.38 | 0.34 | 2,274 | 427 | 1,406 | 441 |
| Houston | 2.11 | 1.78 | 0.46 | 0.34 | 52,049 | 20,909 | 28,888 | 2,251 |
| Hyderabad | 2.18 | 1.94 | 0.49 | 0.40 | 14,418 | 2,322 | 9,493 | 2,603 |
| Ibadan | 1.52 | 1.47 | 0.28 | 0.23 | 9,075 | 2,206 | 5,547 | 1,323 |
| Ilheus | 2.26 | 2.23 | 0.74 | 0.72 | 2,093 | 168 | 1,018 | 907 |
| Ipoh | 2.28 | 1.89 | 0.53 | 0.42 | 7,389 | 1,338 | 5,348 | 703 |
| Istanbul | 1.94 | 1.76 | 0.45 | 0.38 | 22,637 | 3,924 | 16,102 | 2,611 |
| Jaipur | 2.00 | 1.56 | 0.50 | 0.32 | 8,215 | 736 | 7,127 | 352 |
| Jalna | 2.08 | 2.03 | 0.66 | 0.59 | 1,033 | 74 | 747 | 212 |
| Jequie | 1.84 | 1.45 | 0.50 | 0.32 | 1,832 | 293 | 1,499 | 40 |
| Johannesburg | 2.23 | 2.11 | 0.48 | 0.44 | 12,116 | 4,225 | 7,154 | 737 |
| Kampala | 2.52 | 2.22 | 0.56 | 0.46 | 7,013 | 1,628 | 4,557 | 827 |
| Kanpur | 2.06 | 2.03 | 0.49 | 0.45 | 5,313 | 1,070 | 3,115 | 1,128 |
| Kigali | 2.92 | 2.03 | 0.68 | 0.41 | 2,985 | 178 | 2,403 | 404 |
| Kingston | 1.93 | 1.89 | 0.40 | 0.38 | 1,057 | 469 | 418 | 170 |
| Kolkata | 2.23 | 2.50 | 0.58 | 0.54 | 19,528 | 2,330 | 12,547 | 4,651 |
| Kuala Lumpur | 1.99 | 1.69 | 0.46 | 0.34 | 42,200 | 5,365 | 34,103 | 2,732 |
| Kuwait City | 1.69 | 1.59 | 0.39 | 0.35 | 7,128 | 2,765 | 3,409 | 953 |
| Le Mans | 1.88 | 1.88 | 0.38 | 0.38 | 639 | 126 | 448 | 64 |
| Leipzig | 2.31 | 2.04 | 0.54 | 0.44 | 9,761 | 1,246 | 7,429 | 1,086 |
| Leshan | 2.45 | 2.40 | 0.67 | 0.61 | 4,681 | 279 | 3,333 | 1,069 |
| London | 1.76 | 1.76 | 0.36 | 0.34 | 28,228 | 11,332 | 13,120 | 3,776 |
| Los Angeles | 1.47 | 1.40 | 0.24 | 0.21 | 528,178 | 268,952 | 220,897 | 38,329 |
| Madrid | 2.00 | 1.95 | 0.41 | 0.39 | 9,331 | 1,903 | 6,561 | 867 |
| Malatya | 2.47 | 2.37 | 0.73 | 0.68 | 56,911 | 4,615 | 37,080 | 15,216 |
| Manila | 2.02 | 1.81 | 0.44 | 0.35 | 20,533 | 6,214 | 12,609 | 1,710 |
| Marrakech | 1.81 | 1.89 | 0.54 | 0.57 | 6,769 | 521 | 2,681 | 3,566 |
| Medan | 2.11 | 1.91 | 0.41 | 0.35 | 4,700 | 927 | 3,406 | 367 |
| Mexico City | 1.71 | 1.57 | 0.31 | 0.25 | 27,823 | 8,657 | 16,818 | 2,348 |
| Milano | 2.03 | 1.90 | 0.41 | 0.36 | 9,612 | 3,676 | 5,613 | 322 |
| Minneapolis | 2.13 | 1.97 | 0.45 | 0.40 | 21,408 | 7,469 | 13,127 | 812 |
| Modesto | 1.96 | 1.95 | 0.47 | 0.39 | 4,408 | 1,664 | 2,256 | 489 |
| Montevideo | 2.15 | 1.95 | 0.46 | 0.44 | 10,416 | 2,003 | 6,500 | 1,913 |
| Moscow | 2.21 | 1.99 | 0.49 | 0.41 | 32,254 | 9,356 | 18,773 | 4,125 |
| Mumbai | 1.46 | 1.50 | 0.27 | 0.26 | 8,193 | 2,076 | 4,791 | 1,326 |
| Ndola | 0.85 | 0.84 | 0.55 | 0.49 | 1,193 | 147 | 846 | 200 |
| Oktyabrsky | 2.32 | 2.39 | 0.63 | 0.60 | 2,229 | 383 | 1,155 | 690 |
| Ouagadougou | 1.62 | 1.39 | 0.30 | 0.22 | 7,719 | 807 | 6,251 | 661 |
| Palembang | 2.42 | 1.91 | 0.56 | 0.42 | 10,744 | 976 | 8,138 | 1,631 |
| Palermo | 2.01 | 1.94 | 0.43 | 0.40 | 823 | 339 | 393 | 91 |
| Paris | 1.76 | 1.62 | 0.33 | 0.27 | 19,474 | 11,364 | 7,649 | 461 |
| Philadelphia | 2.11 | 2.05 | 0.44 | 0.40 | 542,798 | 155,424 | 316,616 | 70,758 |
| Pittsburgh | 2.61 | 2.47 | 0.56 | 0.52 | 5,910 | 1,912 | 3,632 | 366 |
| Port Sudan | 1.61 | 1.47 | 0.39 | 0.32 | 1,431 | 289 | 1,001 | 141 |
| Pretoria | 2.17 | 2.05 | 0.46 | 0.43 | 1,993 | 882 | 1,017 | 94 |
| Puna | 2.18 | 1.68 | 0.50 | 0.36 | 9,869 | 1,637 | 7,692 | 541 |
| Pusan | 1.60 | 1.61 | 0.37 | 0.34 | 5,028 | 1,151 | 3,578 | 299 |
| Rajshahi | 2.87 | 3.55 | 0.89 | 0.84 | 940 | 7 | 602 | 331 |
| Ribeirao Preto | 1.46 | 1.58 | 0.25 | 0.28 | 1,528 | 201 | 1,035 | 293 |
| Saidpur | 1.84 | 2.04 | 0.71 | 0.72 | 242 | 19 | 91 | 132 |
| San Salvador | 1.87 | 1.72 | 0.39 | 0.33 | 3,049 | 897 | 1,988 | 164 |
| Sanaa | 1.61 | 1.36 | 0.37 | 0.25 | 4,777 | 1,638 | 2,889 | 250 |
| Santiago | 1.63 | 1.56 | 0.28 | 0.25 | 124,492 | 33,810 | 75,949 | 14,733 |
| Sao Paulo | 1.45 | 1.39 | 0.22 | 0.18 | 29,065 | 11,142 | 15,942 | 1,981 |
| Seoul | 1.66 | 1.70 | 0.31 | 0.30 | 19,330 | 3,575 | 13,288 | 2,466 |
| Shanghai | 2.11 | 2.06 | 0.41 | 0.35 | 51,069 | 6,007 | 41,297 | 3,764 |
| Sheffield | 1.81 | 1.84 | 0.42 | 0.41 | 1,149 | 387 | 561 | 201 |
| Shimkent | 1.77 | 1.87 | 0.40 | 0.40 | 2,241 | 487 | 1,281 | 473 |
| Singapore | 2.18 | 1.83 | 0.49 | 0.41 | 6,930 | 1,675 | 4,600 | 655 |
| Songkhla | 2.09 | 2.10 | 0.58 | 0.60 | 518 | 50 | 292 | 176 |
| Springfield | 2.83 | 2.27 | 0.55 | 0.46 | 10,184 | 1,112 | 8,542 | 530 |
| St. Catharines | 1.86 | 2.01 | 0.43 | 0.43 | 2,531 | 285 | 2,066 | 181 |
| Sydney | 1.82 | 1.69 | 0.38 | 0.32 | 11,888 | 5,883 | 5,485 | 521 |
| Tacoma | 2.30 | 1.93 | 0.49 | 0.39 | 9,920 | 4,857 | 4,866 | 197 |
| Tebessa | 1.74 | 1.72 | 0.75 | 0.66 | 30,111 | 4,215 | 20,814 | 5,082 |
| Teheran | 1.62 | 1.56 | 0.30 | 0.27 | 11,009 | 3,915 | 5,767 | 1,327 |
| Tel Aviv | 2.11 | 2.25 | 0.49 | 0.45 | 17,374 | 1,825 | 12,512 | 3,037 |
| Thessaloniki | 1.84 | 1.87 | 0.38 | 0.35 | 1,973 | 536 | 1,197 | 240 |
| Tijuana | 1.63 | 1.44 | 0.32 | 0.23 | 8,647 | 2,157 | 5,665 | 825 |
| Tokyo | 1.51 | 1.40 | 0.27 | 0.22 | 24,560 | 17,884 | 5,801 | 875 |
| Ulan Bator | 1.66 | 1.62 | 0.37 | 0.33 | 3,520 | 806 | 2,339 | 376 |
| Valledupar | 1.41 | 1.51 | 0.37 | 0.37 | 701 | 109 | 497 | 95 |
| Victoria | 1.95 | 1.75 | 0.43 | 0.35 | 2,575 | 1,068 | 1,381 | 126 |
| Vijayawada | 1.84 | 1.84 | 0.51 | 0.48 | 2,203 | 428 | 1,362 | 413 |
| Warsaw | 2.02 | 1.90 | 0.46 | 0.39 | 8,319 | 2,929 | 4,150 | 1,240 |
| Wien | 2.39 | 2.02 | 0.54 | 0.44 | 12,934 | 3,830 | 8,518 | 587 |
| Yerevan | 2.24 | 2.23 | 0.59 | 0.57 | 9,200 | 1,204 | 6,791 | 1,204 |
| Yiyang | 2.10 | 2.55 | 0.74 | 0.66 | 4,722 | 334 | 3,719 | 668 |
| Yulin | 2.52 | 2.71 | 0.81 | 0.74 | 10,883 | 473 | 7,522 | 2,888 |
| Zhengzhou | 2.77 | 2.80 | 0.58 | 0.54 | 33,862 | 2,693 | 22,941 | 8,228 |
| Zugdidi | 2.13 | 2.42 | 0.62 | 0.59 | 1,671 | 296 | 889 | 485 |

SOURCE: Angel, S, J Parent, D L Civco and A M Blei (2011),
Acknowledgements
The research for this paper was made possible by grants from the World Bank, NASA, the National Science Foundation and the Lincoln Institute of Land Policy. The authors are grateful to Gregory Ingram, Alejandro Blei, John Volin, Ralph Gakenheimer, Robert Buckley, Alain Bertaud, Mike de Smith, Claudio Acioly, Michael Teitz, George Martine, Lucy Gitlin and Daniella Gitlin for their support, comments and suggestions; and to Chul Il Kim for his help with the multiple regression models.
1.
Gottmann, J and R A Harper (1990), Since Megalopolis: The Urban Writings of Jean Gottmann, Johns Hopkins University Press, Baltimore, page 101.
2.
Clawson, M (1962), “Urban sprawl and speculation in urban land”, Land Economics Vol 38, May, page 99.
3.
Heim, C E (2001), “Leapfrogging, urban sprawl and growth management: Phoenix 1950–2000”, American Journal of Economics and Sociology Vol 60, No 1, pages 245–283; also Carruthers, J I and G F Ulfarsson (2001), “Fragmentation and sprawl: evidence from inter-regional analysis”, Growth and Change 33, Summer, pages 312–340.
4.
Pfeffer, M J and M B Lapping (1995), “Prospects for a sustainable agriculture in the northeast’s rural/urban fringe”, Research in Rural Sociology and Development Vol 6, page 85.
5.
Chen, I, J F Franklin and T A Spies (1992), “Vegetation responses to edge environments in old growth Douglas fir forests”, Ecological Applications Vol 2, No 4, pages 387–396; also Winter, M, D H Johnson and J Faaborg (2000), “Evidence for edge effects on multiple levels in tallgrass prairie”, Condor Vol 102, No 2, pages 256–266, available at http://www.npwrc.usgs.gov/resource/birds/edgeffct/index.htm; and Brand, L A and T L George (2001), “Response of Passerine birds to forest edge in coast Redwood forest fragments”, The Auk Vol 118, No 3, pages 678–686.
6.
Ewing, paraphrasing Lessinger (1962) and Ottensman (1977); see Ewing, R (1994), “Characteristics, causes and effects of sprawl: a literature review”, Environmental and Urban Issues Vol 21, No 2, page 2; also Lessinger, J (1962), “The case for scatteration”, Journal of the American Institute of Planners Vol 28, No 3, pages 159–169; and Ottensman, J R (1977), “Urban sprawl, land values and the density of development”, Land Economics Vol 53, No 4, pages 389–400.
7.
Peiser, R B (1989), “Density and urban sprawl”, Land Economics Vol 65, No 3, page 193.
8.
Bertaud, A (2007), “Urbanization in China: land use efficiency issues”, available at ![]() , page 17.
, page 17.
9.
See Angel, S, J Parent, D L Civco and A M Blei (2011), The Atlas of Urban Expansion, The Lincoln Institute of Land Policy, Cambridge MA, available at ![]() .
.
10.
Angel, S, S C Sheppard and D L Civco, with A Chabaeva, L Gitlin, A Kraley, J Parent, M Perlin and R Buckley (2005), The Dynamics of Global Urban Expansion, The World Bank, Washington DC, Chapter 2, 199 pages, available at ![]() .
.
11.
See reference 10, Chapter 2.
12.
See reference 10, Chapter 3.
13.
Potere, D, A Schneider, S Angel and D L Civco (2009), “Mapping urban areas on a global scale: which of the eight maps now available is more accurate?”, International Journal of Remote Sensing Vol 30, No 24, December, pages 6531–6558.
14.
Angel, S, J Parent, D L Civco and A M Blei (2010a), “The persistent decline in urban densities: global and historical evidence of sprawl”, Lincoln Institute Working Paper, Lincoln Institute of Land Policy, Cambridge MA, 151 pages, available at ![]() .
.
15.
Angel, S, J Parent and D L Civco (2010b), “The fragmentation of urban footprints: global evidence of sprawl 1990–2000”, Lincoln Institute Working Paper, Lincoln Institute of Land Policy, Cambridge MA, 114 pages, available at ![]() .
.
16.
Riiters, K H, R V O’Neill, C T Hunsaker, J D Wickham, D H Yankee, S P Timmins, K B Jones and B L Jackson (1995), “A factor analysis of landscape pattern and structure metrics”, Landscape Ecology Vol 10, pages 23–39; also Haines-Young, R and M Chopping (1996), “Quantifying landscape structure: a review of landscape indices and their application to forested landscapes”, Progress in Physical Geography Vol 20, No 4, pages 418–445; O’Neill, R V, J R Krummel, R H Gardner, G Sugihara, B Jackson, D L DeAngelis, B Milne, S W Christensen, V H Dale and R L Graham (1988), “Indices of landscape pattern”, Landscape Ecology Vol 1, pages 153–162; Hargis, C D, J A Bissonette and J L David (1998), “The behaviour of landscape metrics commonly used in the study of habitat fragmentation”, Landscape Ecology Vol 13, pages 167–186; Hurd, J D, E H Wilson, S G Lammey and D L Civco (2001), Characterization of Forest Fragmentation and Urban Sprawl using Time Sequential Landsat Imagery, Proceedings of the ASPRS Annual Convention, St Louis MO, 23–27 April, 12 pages, available at http://www.resac.uconn.edu/publications/tech_papers/index.html; Brabec, E and C Smith (2002), “Agricultural land fragmentation: the spatial effects of three land protection strategies in the eastern United States”, Landscape and Urban Planning Vol 58, pages 255–268; Civco, D L, J D Hurd, E H Wilson, C L Arnold and M Prisloe (2002), “Quantifying and describing urbanizing landscapes in the northeast United States”, Photogrammetr. Eng. Remote Sens. Vol ![]() .
.
17.
Burchfield, M, H G Overman, D Puga and M A Turner (2006), “Causes of sprawl: a portrait from space”, Quarterly Journal of Economics Vol 121, No 2, pages 587–633.
18.
See reference 17; also see reference 2.
19.
See reference 17.
20.
Cities can be less sprawled in terms of built-up area density and more sprawled in terms of fragmentation at the same time. For example, in 2000, Kolkata in India ranked seventh in built-up area density in the global sample of 120 cities but had the sixth highest urban landscape ratio. In contrast, Los Angeles in California ranked 103rd in built-up area density while its urban landscape ratio ranked 117th.
21.
±7 denotes the 95 per cent confidence interval of the average.
22.
See reference 17, page 602.
23.
See reference 17.
24.
For details, see reference 15.
25.
See reference 17, page 611
26.
Peiser (1989), see reference 7, pages 201–202, paraphrasing Knapp (1985) and Nelson (1986); see Knapp, Gerrit J (1985), “The price effects of urban growth boundaries in metropolitan Portland, Oregon”, Land Economics No 61, February, pages 27–35; and Nelson, Arthur (1986), “Using land markets to evaluate urban containment programmes”, Journal of the American Planning Association Vol 52, Spring.
27.
See reference 15.
28.
Ginsburg, N (1990), “Extended metropolitan regions in Asia: a new spatial paradigm”, in N Ginsburg, The Urban Transition: Reflections on the American and Asian Experiences, Chinese University of Hong Kong Press, pages 21–42; also McGee, T G (1991), “The emergence of desakota regions in Asia: expanding a hypothesis”, in N Ginsburg, B Koppel and T G McGee (editors), The Extended Metropolis: Settlement Transition in Asia, University of Hawaii Press, Honolulu, pages 3–26.
29.
Guldin, G E (1996), “Desakotas and beyond: urbanization in southern China”, Ethnology Vol 35, No 4, page 278.
30.
See reference 8, page 17.
31.
Angel, S, M I Valdivia and R M Lutzy (2009), “Urban expansion, land conversion and affordable housing in China: the case of Zhengzhou”, Paper presented at the Workshop on China Housing Policy, Lincoln Institute of Land Policy, Cambridge MA, 18 May, 19 pages.
32.
Angel et al. (2009), see reference 31, page 7, paraphrasing Lichtenberg and Ding (2008); see Lichtenberg, E and C Ding (2008), “Assessing farmland protection policy in China”, Land Use Policy Vol 25, No 1, January, pages 59–68.
33.
Reuters (2010), “China’s forced evictions cause instability”, 28 March, available at ![]() .
.
34.
Cox, Wendell (2004), “Portland: economic growth noose loosened: Portland backtracks on urban growth boundary”, The Public Purpose Vol 74, February, 3 pages.
36.
See reference 14.