
Abstract
The rise in extreme weather events, coupled with the acknowledgement by policymakers that vulnerable populations are disproportionately at risk, has led to an increase in demand for vulnerability assessments, and particularly composite vulnerability indices. This paper presents a flood hazard vulnerability index that incorporates socioeconomic, built environment and natural environment data, and that was used to measure the vulnerability of 1,276 municipalities in Brazil. Findings show that 83 of these municipalities (with 22 per cent of the Brazilian population) are at risk. Vulnerability stemming from lower levels of socioeconomic status is concentrated in the Northern regions; that related to poor governance is widespread across all regions. This analysis highlights the dangers of assessing vulnerability using aggregate measures of socioeconomic status in middle-income countries with high levels of inequality, where the presence of vulnerable populations in informal settlements within highly developed municipalities may be obscured.
I. Introduction
Since 2000, Brazil has weathered 51 floods and five landslides, which together caused 2,559 deaths; 514,845 people lost their homes in these events, 6,403,073 people were affected and economic losses totalled US$ 4,831,870.(1) Between 1900 and 2014, nine of the ten natural disasters in Brazil with the highest mortality were either floods or landslides.(2) Climate change is likely to increase the severity and/or frequency of these kinds of disasters.(3) Researchers have found that increases in both high precipitation events and droughts are expected in Brazil under future climate scenarios.(4)
This paper discusses the construction and use of an index, using factor analysis, to assess vulnerability to flooding of 1,276 urban, Brazilian municipalities.(5) Drawing on the vulnerability literature, I identify three central components of vulnerability – socioeconomic status, infrastructure and governance – and map the vulnerability scores of urban municipalities. I compare the composite index scores to each component’s score and note the disparities. As vulnerability is just one element of the overall flood risk, I add measures of hazard and exposure in a final flood risk map of urban Brazilian municipalities.
II. Vulnerability and Natural Hazards: A Brief Review of the Literature
In the natural hazards literature, there are many frameworks for measuring vulnerability.(6) Acknowledging the disparate state of the field, Birkmann(7) provides recommendations for researchers, focusing on the importance of incorporating and amending existing frameworks to add value to the growing, diverse and extensive landscape.
Romero-Lankao and colleagues’(8) meta-analysis of the urban vulnerability literature reveals that most research on measuring urban vulnerability to temperature-related hazards uses the vulnerability as impact approach, which draws on the risk hazard framework from the natural hazards literature. This approach defines vulnerability in terms of exposure to a specific hazard, sensitivity of the population and particular impacts, such as mortality.
For this analysis, the urban vulnerability as impact framework is not appropriate due to data constraints. Although impact data on such factors as mortality and economic loss are available at the national or regional level for some countries, they are difficult to obtain at the municipal level, especially in middle- and low-income countries. Some researchers have collected their own data through household surveys of a single community or municipality.(9) Given the scope of this analysis (all urban municipalities in Brazil with over 20,000 inhabitants), primary data collection is not feasible.
Romero-Lankao et al.(10) identify two additional urban vulnerability frameworks: inherent urban vulnerability and urban resilience. Inherent urban vulnerability, drawing on the political economy literature, defines vulnerability in relation to adaptive capacity and structural drivers. Urban resilience focuses on a population’s ability to recover from hazard stresses and incorporates elements of the built environment in assessing hazard risk.
Schneiderbauer and Ehrlich define vulnerability as “the characteristics of individuals or groups in terms of their capacity to anticipate, cope with, resist and recover from the impact of a natural or anthropogenic disaster – noting that vulnerability is made up of many political-institutional, economic and socio-cultural factors.”(11) Their definition aligns most closely with the inherent urban vulnerability tradition although it also incorporates elements that might fall within the scope of the urban resilience literature, such as the inclusion of building quality. Consistent with the natural hazards literature, and borrowing Crichton’s notion of the risk triangle(12) (Figure 1), Schneiderbauer and Ehrlich define disaster risk as a function of the hazard, exposure and vulnerability.
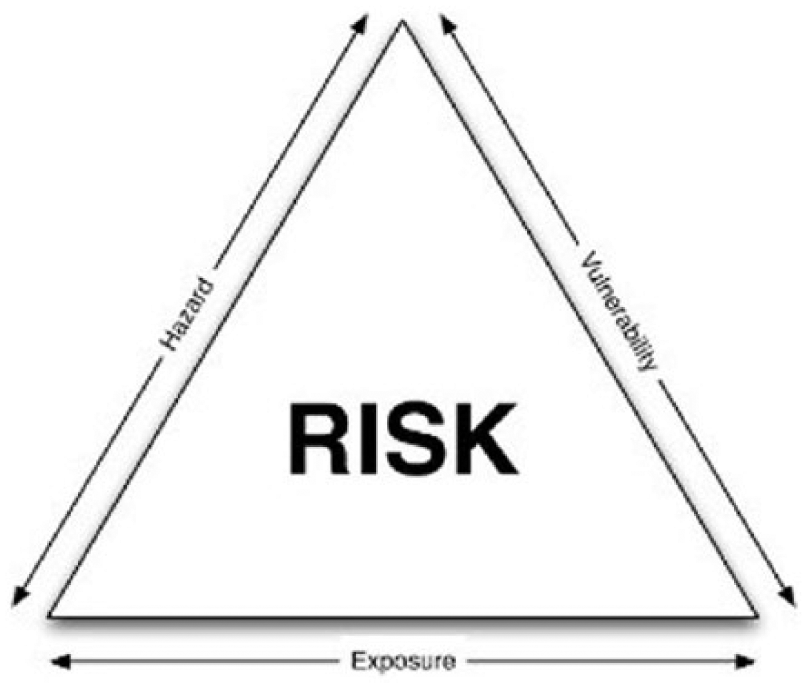
The risk triangle
The hazard is defined as a particular disaster type and characterized by its frequency and severity. Flood hazard is typically projected on a 100-year frequency basis, i.e. how many floods a particular region is expected to experience within 100 years.(13) Inland flood frequency for a 100-year period is based on previous flood events, forecast precipitation levels and climate change projections. These projections are based on observed flooding between 1999 and 2007 and do not take climate change forecasts explicitly into account. Due to climate change, the frequencies of events in the past are no longer strong harbingers of the frequencies of events in the future. These frequency measures should therefore be considered minimum values, with the understanding that actual future values may be considerably higher. Brazil did experience several severe flood events during the period between 1999 and 2007, so the flood data do at least provide a reasonable baseline for projecting flood events in the future.
Exposure relates to the population or property at risk, i.e. whether the property is actually susceptible to harm. An overflowing river deep in the Amazon may not present any flood risk if no humans or property are exposed. Flood risk exists when vulnerability and exposure to the hazard are present.
In recent years disaster management research has become increasingly concerned with vulnerability analysis, not simply hazard analysis. Socioeconomic conditions play a key role in the identification of vulnerable groups, and there is a lacuna in the methodology literature around measurement of vulnerability at the sub-national level.(14) While vulnerability indices at the national or community level have been common,(15) a framework that includes indicators at different “social levels”, such as the individual/household and community, yet is still broad enough to allow for measurement across multiple sub-national units, has been lacking. Schneiderbauer and Ehrlich’s contribution – a vulnerability framework and corresponding indicators that allow for clear measurement of sub-national vulnerability, incorporating physical, environmental and socioeconomic elements – attempted to fill the void.
Their vulnerability framework is especially appealing as it includes indicators at the individual, household and municipality levels. One weakness is its focus on the relative vulnerability of municipalities, rather than on such absolutes as mortality or economic loss. Another shortcoming is the inability to verify results. It would strengthen the validity of the approach to compare vulnerability scores to actual losses. Unfortunately, at the time of this analysis, disaster loss data were not available at the municipality level for Brazil. Applying this methodology in another country, where disaster data are more readily available, would be a way to validate the approach and buttress findings.
III. Data
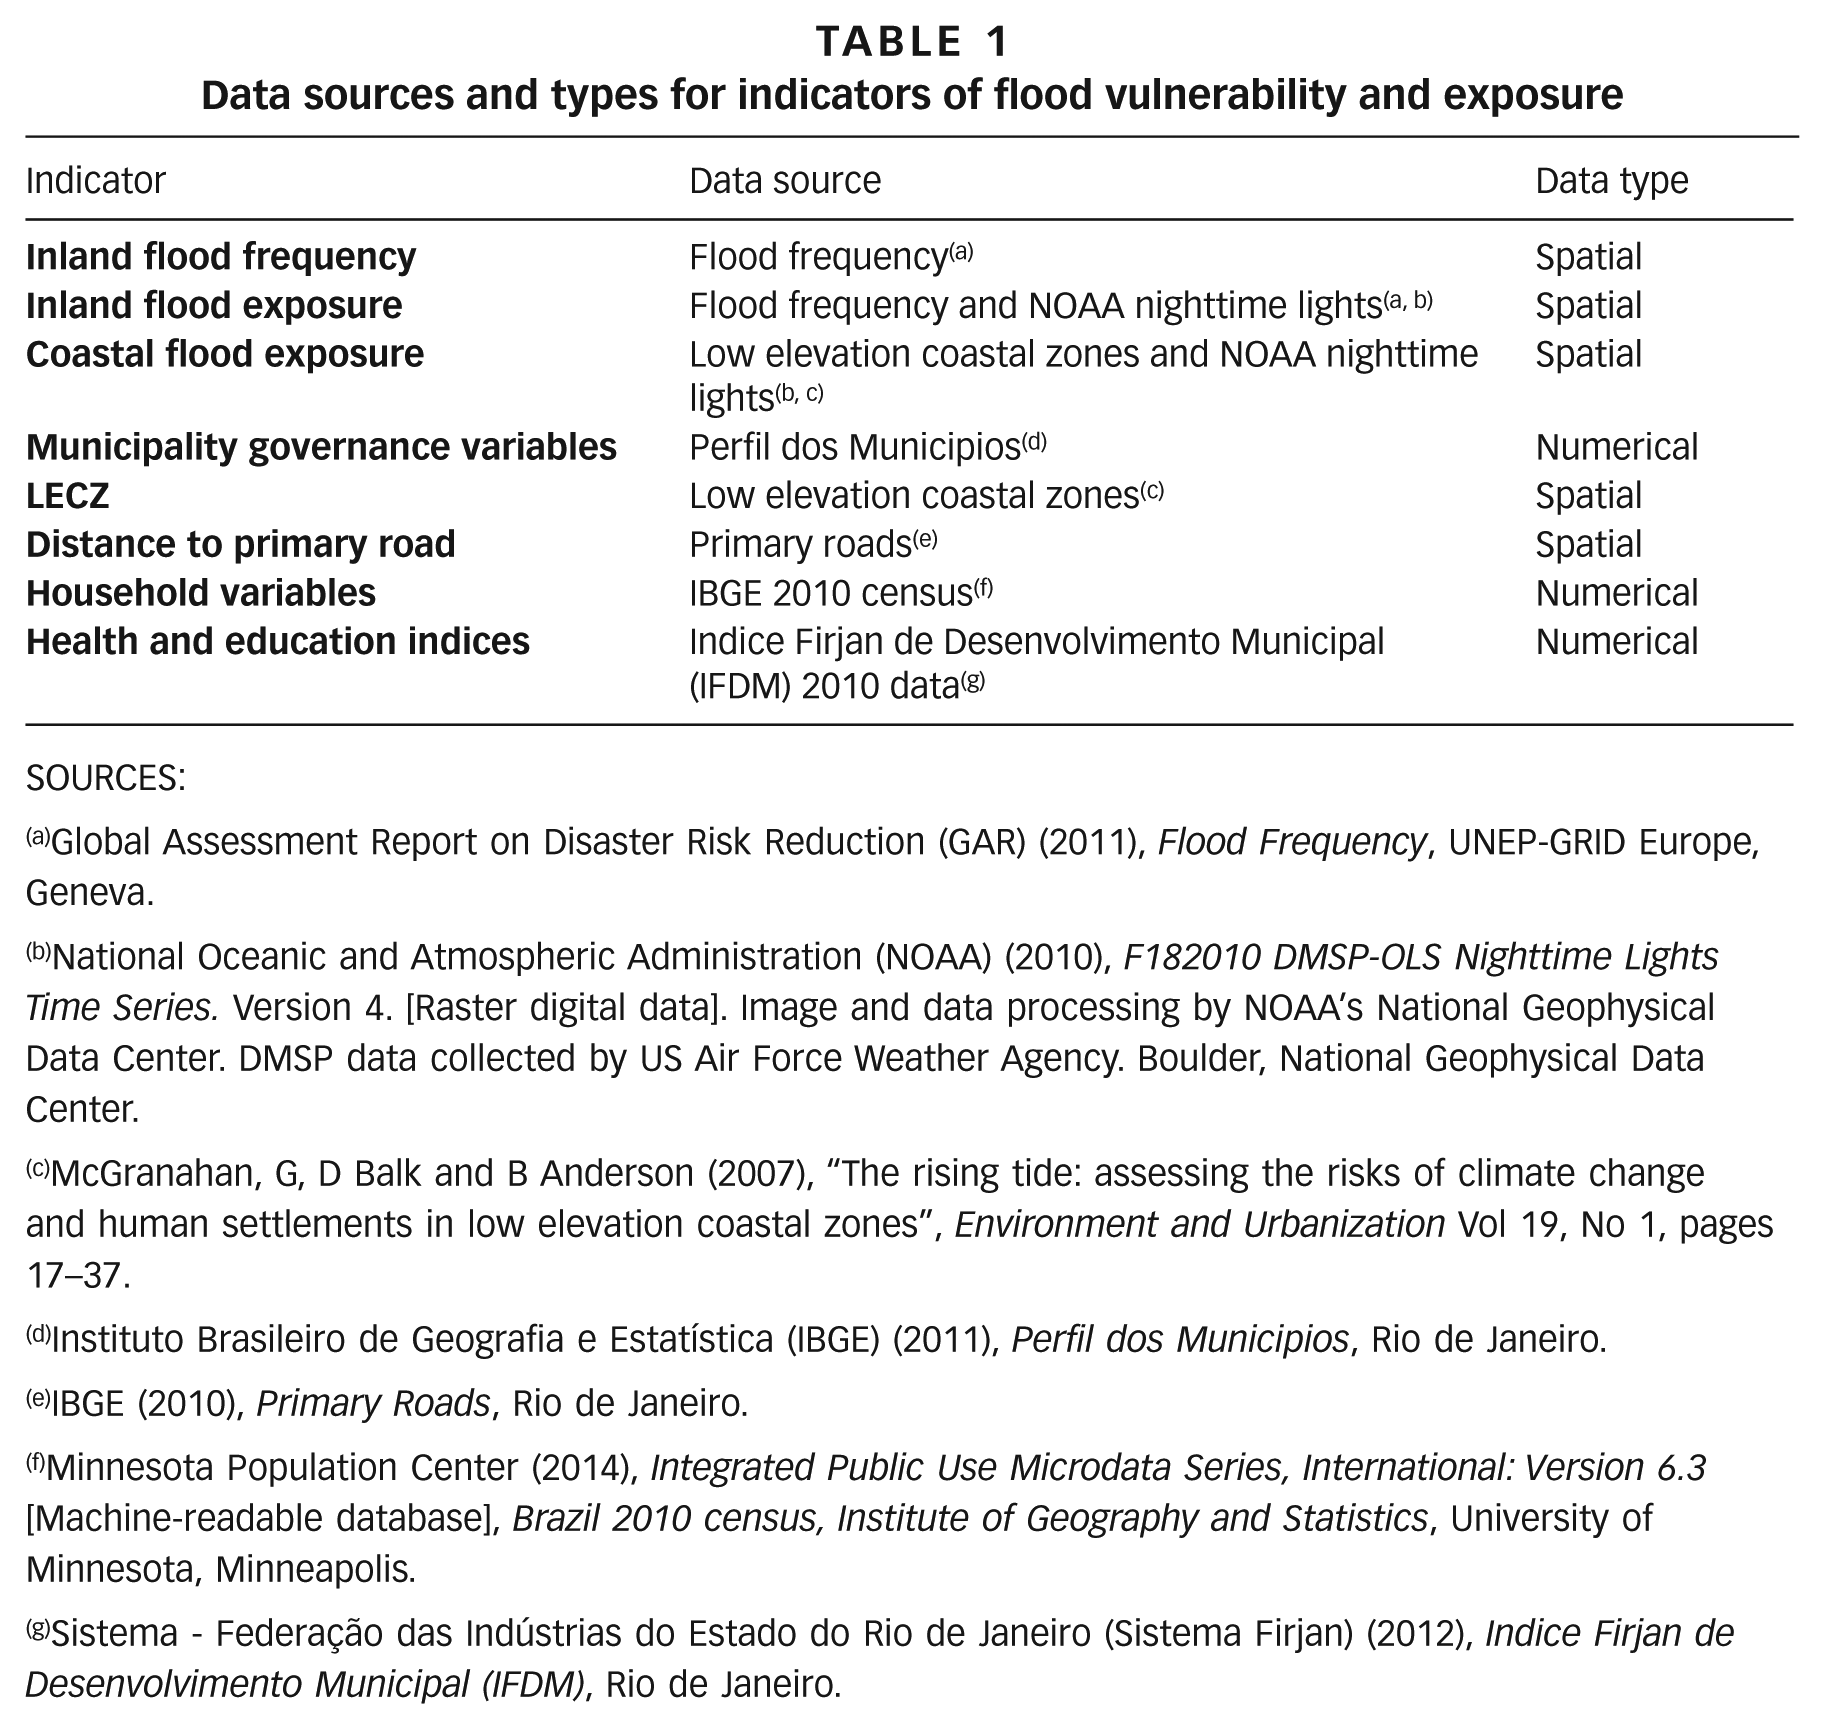
To measure vulnerability, hazard and exposure of 1,276 municipalities, I draw on several data sources as listed in Table 1.
Data sources and types for indicators of flood vulnerability and exposure
SOURCES:
Global Assessment Report on Disaster Risk Reduction (GAR) (2011), Flood Frequency, UNEP-GRID Europe, Geneva.
National Oceanic and Atmospheric Administration (NOAA) (2010), F182010 DMSP-OLS Nighttime Lights Time Series. Version 4. [Raster digital data]. Image and data processing by NOAA’s National Geophysical Data Center. DMSP data collected by US Air Force Weather Agency. Boulder, National Geophysical Data Center.
McGranahan, G, D Balk and B Anderson (2007), “The rising tide: assessing the risks of climate change and human settlements in low elevation coastal zones”, Environment and Urbanization Vol 19, No 1, pages 17–37.
Instituto Brasileiro de Geografia e Estatística (IBGE) (2011), Perfil dos Municipios, Rio de Janeiro.
IBGE (2010), Primary Roads, Rio de Janeiro.
Minnesota Population Center (2014), Integrated Public Use Microdata Series, International: Version 6.3 [Machine-readable database], Brazil 2010 census, Institute of Geography and Statistics, University of Minnesota, Minneapolis.
Sistema - Federação das Indústrias do Estado do Rio de Janeiro (Sistema Firjan) (2012), Indice Firjan de Desenvolvimento Municipal (IFDM), Rio de Janeiro.
The low elevation coastal zone (LECZ) dataset defines low elevation coastal zones as coastal areas 10 metres or less above sea level.(16) The LECZ is measured as a continuous band that extends inland from the coast until the elevation exceeds 10 metres. Flat deltas extending inland, such as parts of the Amazon rainforest, are included as these areas will surely be affected by sea level rise, although they are not located on the coast.
Brazil is also susceptible to a host of other natural hazards not included in the index, such as heatwaves, epidemics, landslides and drought.(17) Landslides are a special case as they can be triggered by increased precipitation, and often occur either as a result of flooding or in tandem with flooding.(18) Although not explicitly measured here, landslides resulting from flooding could be captured in the flood hazard measurement; landslides related to earthquakes or increases in precipitation that do not cause flooding would not be captured.
IV. Methods: Constructing The Vulnerability Index
Measuring vulnerability to natural hazards in general, and flood hazard in particular, is not a cut-and-dried task. While a variety of indices exist at the individual, household, community, sub-national, national and global levels,(19) there is little agreement in the literature on how best to capture this amorphous concept. I choose to measure municipal vulnerability by constructing a municipality vulnerability index based on Schneiderbauer and Ehrlich’s vulnerability framework. My index (Table 2) differs from Schneiderbauer and Ehrlich’s slightly in terms of disaggregation and scope. I do not distinguish between hazard-independent and hazard-dependent parameters and do not include national or regional metrics.
Parameters and indicators used to develop the Urban Municipality Flood Vulnerability Index
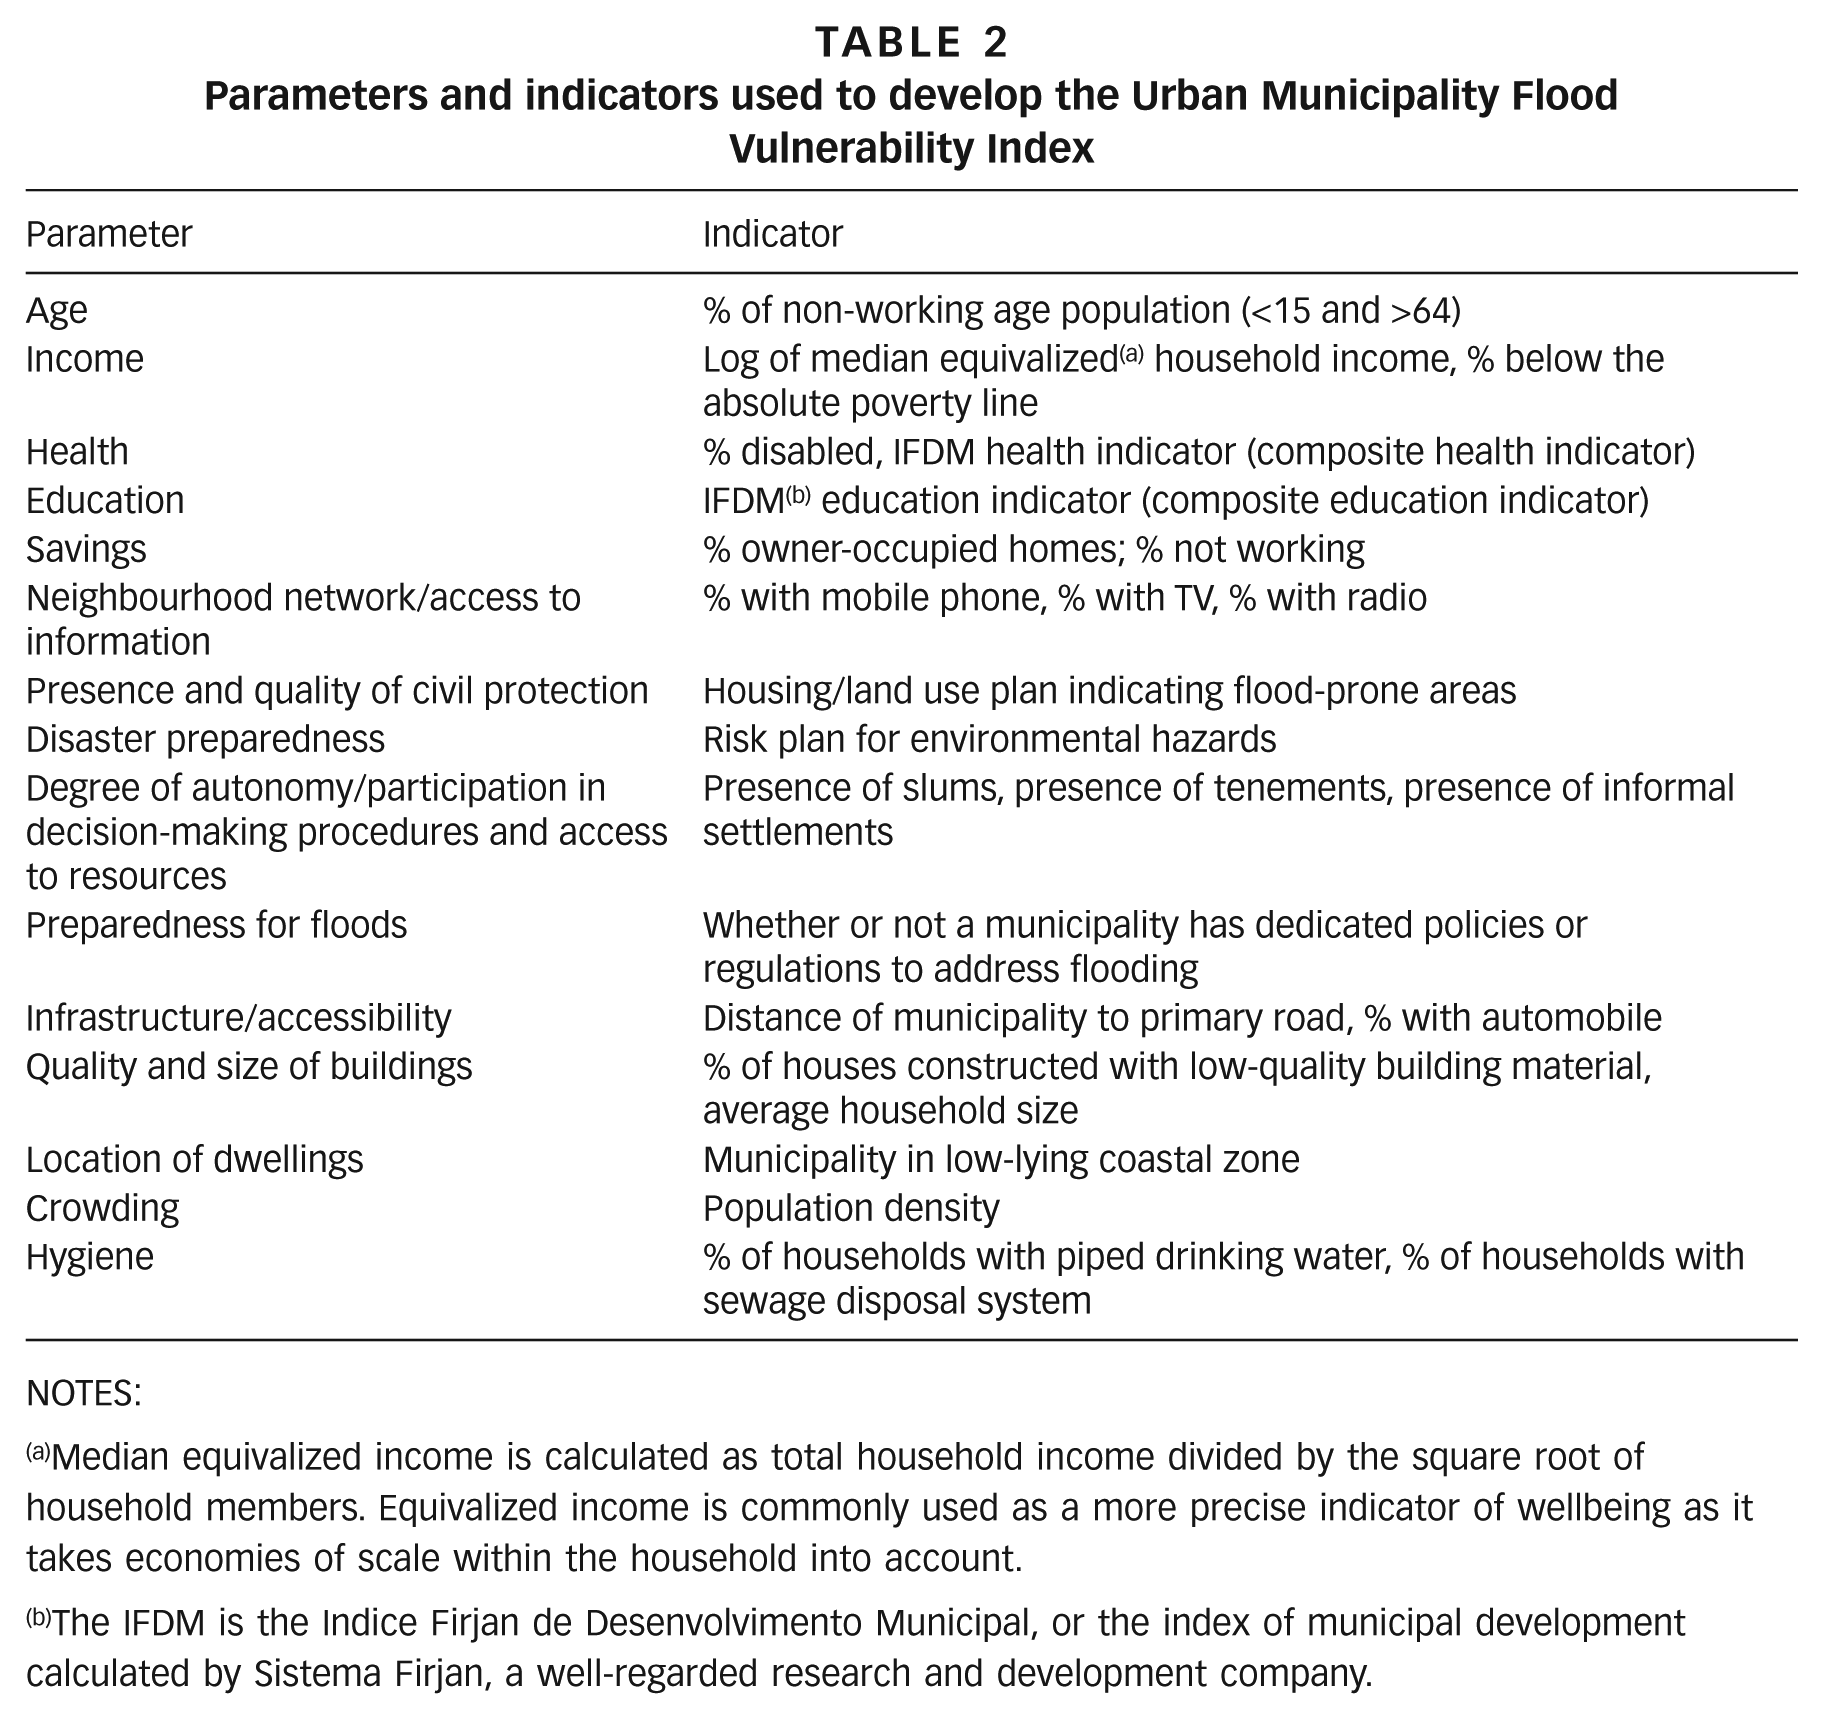
NOTES:
Median equivalized income is calculated as total household income divided by the square root of household members. Equivalized income is commonly used as a more precise indicator of wellbeing as it takes economies of scale within the household into account.
The IFDM is the Indice Firjan de Desenvolvimento Municipal, or the index of municipal development calculated by Sistema Firjan, a well-regarded research and development company.
An ideal vulnerability index would include measurable indicators of all dimensions of vulnerability. Schneiderbauer and Ehrlich cite these as: physical, economic, social, educational, political, institutional, cultural, environmental and ideological. In my scale I include as many of these elements as possible, given data constraints. The only suggested dimensions that are not, at least partially, represented are the cultural and ideological dimensions. Unfortunately there were no data available for these dimensions at the municipality level.
a. The rationale for the indicators
Age: Children and the elderly are more vulnerable to flood hazard for a host of reasons. In some cases it is more difficult for them to quickly find higher ground. Children are also smaller in stature and therefore more susceptible to drowning.(20) Municipalities with lower percentages of children and the elderly will be less vulnerable to flooding. Municipalities with a higher percentage of working-age residents (15–64) are also less economically vulnerable as more people can work to recoup economic losses.
Income: Income contributes to an individual’s ability to prepare for a flood and rebuild. I calculate the equivalized household income, rather than per-capita income, as equivalized income takes economies of scale within a household into account.(21) I use median, not mean, income as the median better captures the typical income level when there are high levels of income inequality. I use the log of equivalized median income to account for the fact that the relationship between vulnerability and income is not strictly linear. As incomes increase, each additional dollar of income has a diminishing influence on household vulnerability. I also include a measure of the proportion of the population classified as “poor”, using the Organisation for Economic Co-operation and Development (OECD) definition for Latin America(22) of less than US$ 4 (2005) per day at purchasing power parity. As equivalized household income is a monthly measure, I define the “poor” as those living on less than R$ 233.51(23) per month. While this is a widely used measure of absolute poverty, it can also be misleading. Even an income of twice that level will not provide a decent standard of living in the expensive urban areas of Rio de Janeiro. According to Patrick, a favela tour guide, a 150 square foot room in the Rocinha favela rents for R$ 400 per month.(24)
Health: The physical health of individuals also contributes to their ability to escape and/or recover from floods. Disabled and unhealthy people are more vulnerable. Where health services are less advanced and public health knowledge is lacking, people are more vulnerable.(25) To measure health, I use two indicators, the proportion of the municipality’s population that is disabled and the health indicator from the Firjan Municipality Development Index (IFDM),(26) the latter of which is widely used by the Brazilian government and other social science research institutes across Brazil. The IFDM health measure is comprised of three indicators: proportion of women with more than six prenatal visits per live birth, number of deaths from ill-defined causes, and death rate of children under five from preventable causes. These indicators speak to the level/quality of health knowledge and services available in the municipality. Each component of the IFDM health indicator is given equal weight and the final composite indicator ranges from 0 to 1.
Education: The level and quality of education of a population is highly indicative of its vulnerability. A more highly educated population has the knowledge to mitigate flood damage and implement feasible solutions to rebuild wisely after the fact.(27) I use the IFDM measure of education, comprised of six components of varying weights: pre-school education (20 per cent), age-grade distortion, i.e. the proportion of children older than the average student in that grade should be (10 per cent), proportion of faculty with advanced credentials (15 per cent), average hours a day in class (15 per cent), dropout rate (15 per cent) and average score on the IDEB (the Basic Education Development Index, which uses scores from the national exams for proficiency in language and mathematics) (25 per cent). The IFDM education indicator, as with the metric for health, ranges from 0 to 1.
Savings: The wealth of the population is directly related to how capable it is of recovering from a flood.(28) Unfortunately, data on wealth and savings at the municipal level are unavailable. I use two indicators to approximate savings: proportion unemployed or inactive(29) and proportion of houses that are owner-occupied. These are the closest indicators available that help to capture wealth. When unemployment rates fall, savings rates tend to rise.(30) Home ownership is a proxy for wealth as owner-occupied housing is often a Latin American’s sole asset.(31) Homeowners are also more likely both to protect their homes and to rebuild them after a flood, given, of course, that they have the available resources.
Neighborhood network/access to information: The ability to access pertinent hazard information keenly influences vulnerability. Flood warnings are often broadcast over mass-media channels. I use three separate indicators: the proportions of households with mobile phones, with TVs and with radios.
Governance measures: The institutional infrastructure of a municipality also greatly influences its level of vulnerability. Well-prepared municipalities with strong governance structures have a greater capacity to prepare for and recover from flooding.(32) Assessing the quality and efficacy of institutions is difficult and only indirect measures are available. The indicators I select record whether particular policies are in place. They cannot, unfortunately, lend insight into the quality of the policy design or the level of implementation.
Presence and quality of civil protection (disaster protection policies): The selected indicator – presence of a housing/land use plan – relates to flooding, as municipalities with a land use plan will mark flood-prone areas as unavailable for development. Land use plans also are designed to minimize soil erosion, another factor that can exacerbate flooding.(33) Disaster preparedness: The presence of a risk plan for environmental hazards is a good indicator of whether a municipality has policies in place to manage hazards. As flooding is the most common natural hazard in Brazil,(34) it is likely that the risk plan is designed to take flooding into account, except possibly in the most arid regions. Degree of autonomy/participation in decision-making procedures and access to resources: Although there is no direct measure of this parameter, I use the presence of slums,(35) tenements and informal housing to indicate the degree of participation and access to resources. This indicator selection is based on the literature,(36) which notes that informal settlements and slums are often treated as silos and have little access to government support and resources. Residents of these areas are also typically excluded from political participation as many are new migrants without official resident status and the ability to vote. While slums are also often an indicator of poverty, their existence speaks to the level of support government institutions are providing. The existence of illegal settlements suggests that the government is not evenly distributing municipal resources to all residents.(37) Slum dwellers are mostly excluded from municipal support.(38) Preparedness for floods: Whether or not a municipality has dedicated policies to address flooding is an important measure of vulnerability. Those municipalities that have taken concrete steps towards reducing flood risk, such as building sea walls, are likely to be less vulnerable to flooding in the future.
Infrastructure/accessibility: The ability of residents to flee a flood zone quickly as well as receive supplies post-flood mitigates the vulnerability of a municipality. Areas far from major highways may become isolated from humanitarian aid. Public transport may be limited. I use distance to a primary road(39) and the proportion of households with their own automobile to capture this parameter. Ideally I would also include a measure of public transport but unfortunately these data are unavailable. Public transport may also be affected by flooding, as with the New York City subway system during Hurricane Sandy.
Quality and size of buildings: The quality of the walls of a home will determine how susceptible the dwelling is to flood damage. To measure building quality, I use a binary variable based on the primary material used to construct the walls. I code homes without walls or with walls made from reused materials, wood, coated clay/mud with sticks, and other plant-based materials as “not substantial”; walls made from brick with plaster, brick without plaster, and unfinished lath and plaster are coded as “substantial”. Those homes with walls of “other material” (0.3 per cent of the sample), I code as missing data. Although this coding system is admittedly basic, it is a proxy for building quality and distinguishes between homes that are more and less vulnerable to flood damage. I also include a measure of average household size, as households with more members will have more people at risk.
Location of dwelling: A municipality’s elevation and proximity to the coast determine how vulnerable it is to coastal flooding. Those municipalities in low elevation coastal zones, defined as zones with an elevation of 10 metres or less above sea level, are more vulnerable to coastal flooding. I identify municipalities in an LECZ using the LECZ spatial dataset.(40) I code a municipality as an LECZ if any part of the municipality falls within the LECZ.(41)
Crowding: I include a measure of population density, as more densely populated urban municipalities will likely incur more damage in the event of flooding. There is some evidence that population density may also reduce vulnerability. In higher-income countries, high-density areas are often highly developed with advanced risk plans. In developing countries, some scholars have argued that it is easier to target help in densely populated areas.(42) However, in Brazil, more densely populated areas are more often than not slums, where overcrowding increases vulnerability.(43) For this reason I include population density as an indicator of increased vulnerability.
Hygiene: The condition of water and sanitation infrastructure is an important measure of vulnerability. Residents of municipalities without piped water and sewage disposal systems are more at risk of dehydration and water-borne illness in the case of floods.(44) I measure a municipality’s hygiene using two indicators: the percentage of households with piped drinking water and the percentage of households with a sewage disposal system.
b. Index building using factor analysis
To create the index, I normalize each indicator following the United Nations Human Development Index (UN HDI) method and scale to a value of 0 to 1.
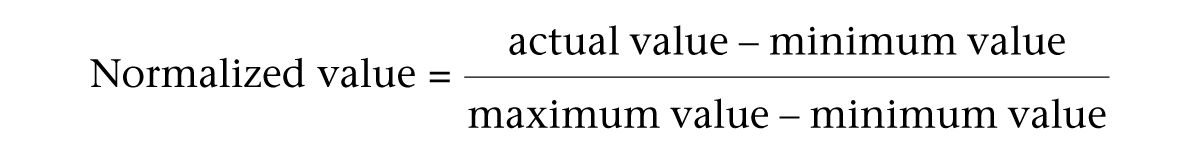
While there are several methods for normalizing values for indices,(45) I follow the UN HDI method as it is commonly used in the vulnerability literature.(46) As some indicators in the analysis are binary, I use a polychoric correlation matrix, rather than the standard factor analysis matrix based on Pearson’s correlations, which assumes all indicators are continuous.
Following Cutter, Boruff and Shirley’s method,(47) I use factor analysis to generate synthetic components and an additive model to create a final score. I use the Kaiser criterion, keeping factors with eigenvalues of 1 or above. Although there are several “stopping rule” options for deciding which factors to keep, the Kaiser criterion is popular as it requires that each factor explain more variance that any single indicator.(48)
I rotate the factors using the “varimax rotation” to maximize ease of interpretation. The aim of the rotation is to minimize the number of indicators that have high loading (i.e. high correlation) with the factor. This aids in interpretation, as each factor can be categorized as representative of an underlying process or concept that encapsulates the indicators with the highest loadings. See Table 3, Table 4 and Table 5 for factor analysis results. Three concepts emerge as the main drivers of vulnerability to flooding: socioeconomic status (Factor 1), infrastructure (Factor 2) and poor governance (Factor 3).
Descriptive statistics of normalized vulnerability index indicators
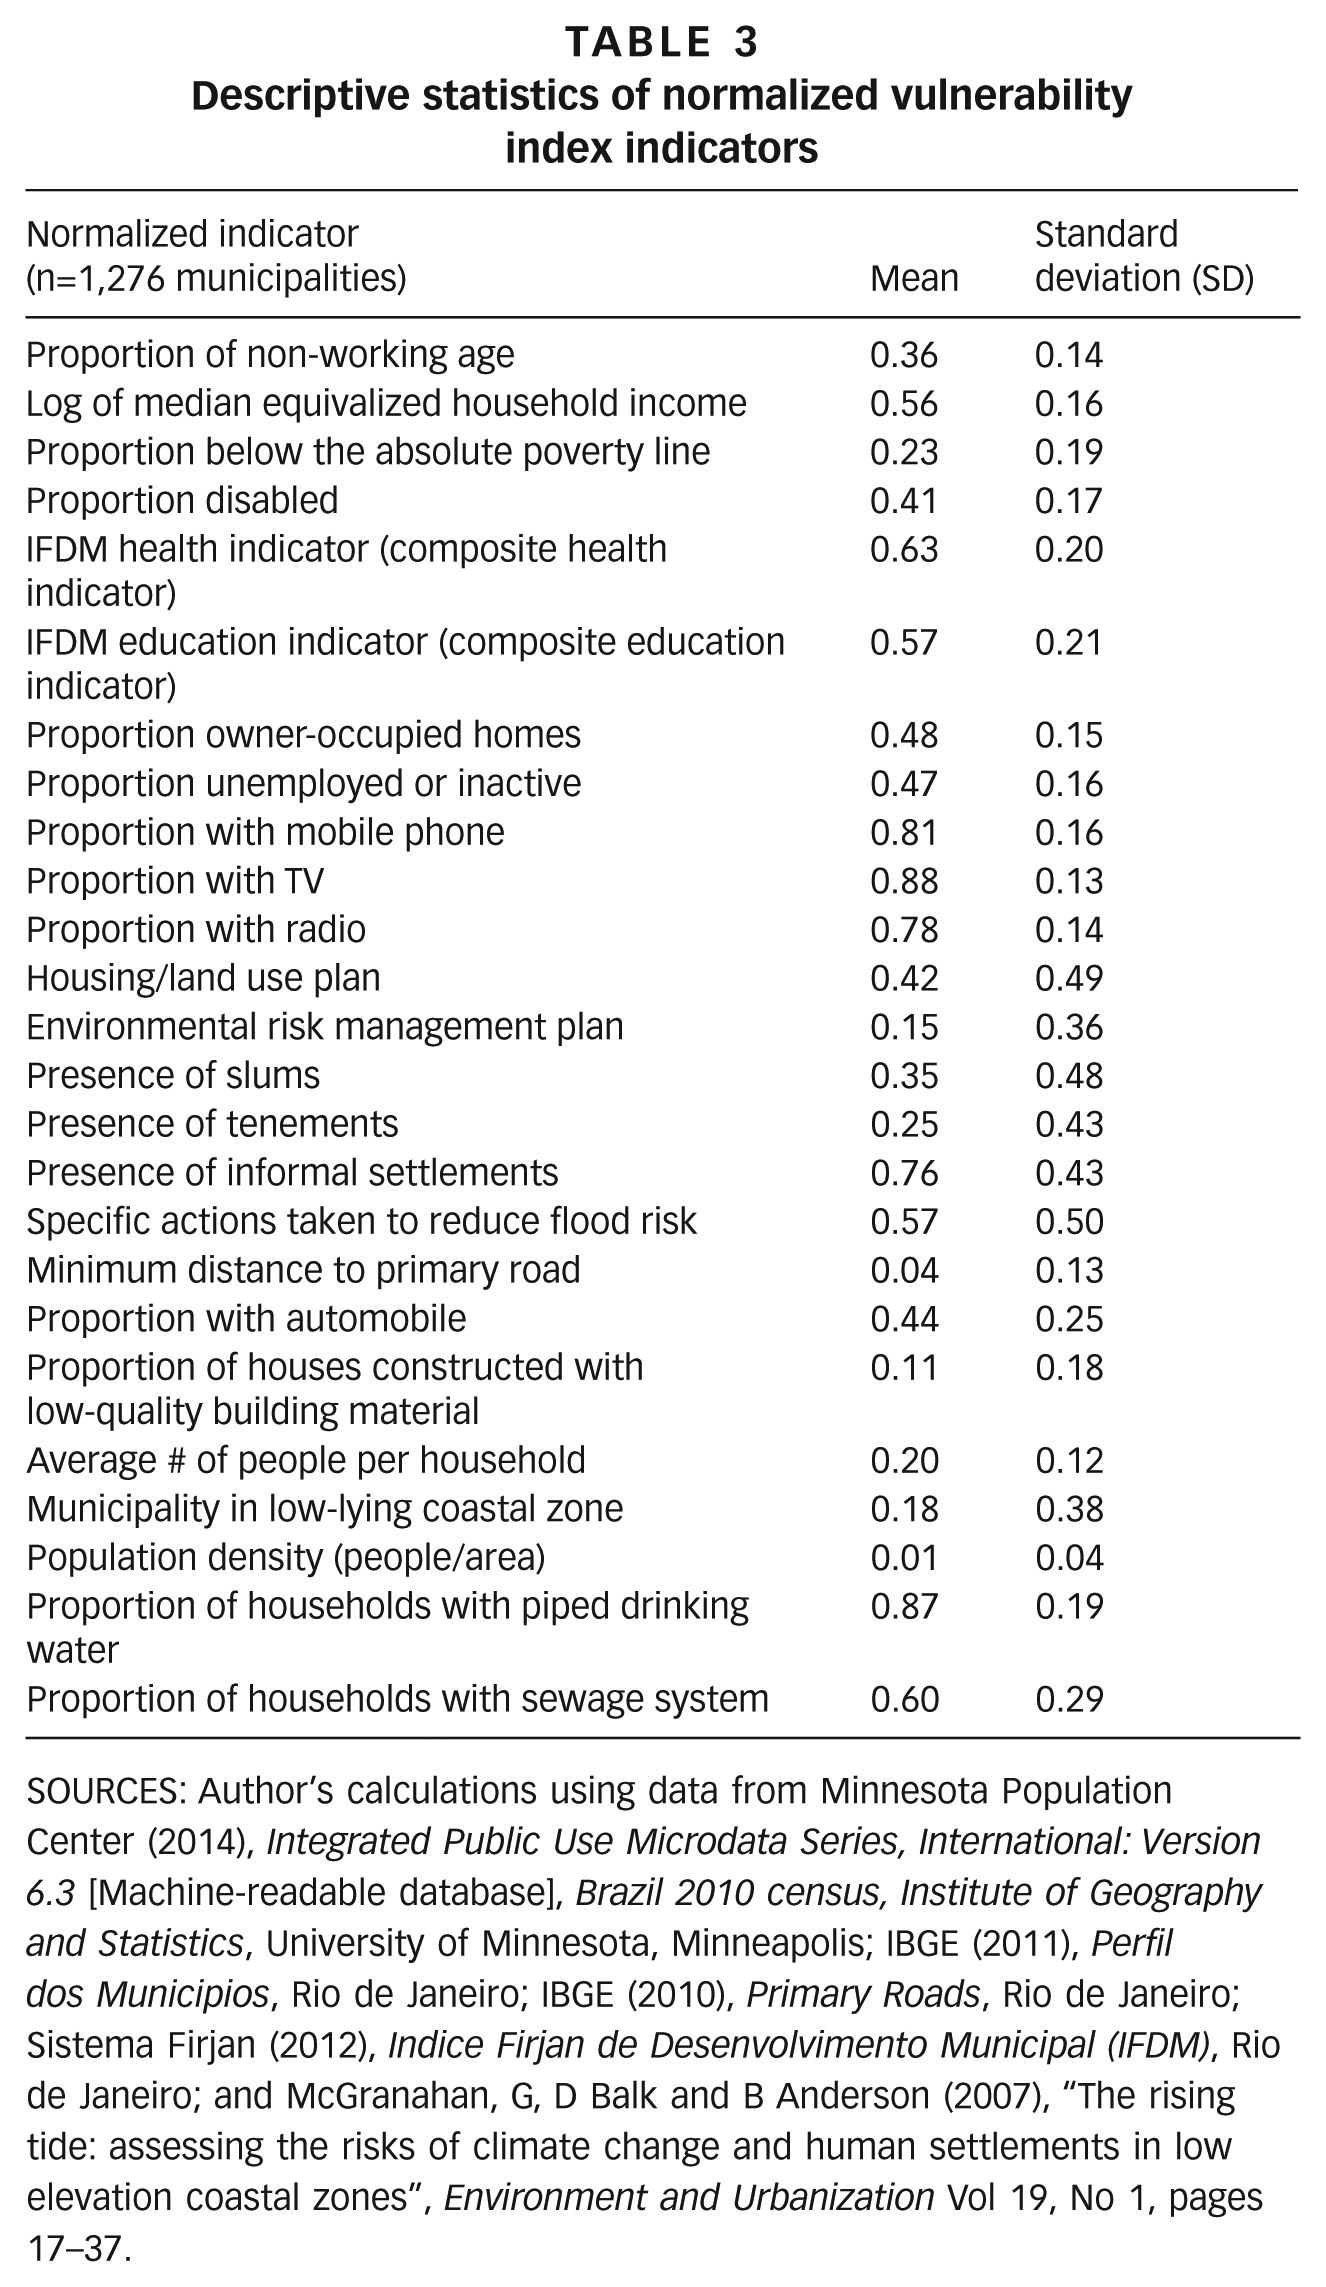
SOURCES: Author’s calculations using data from Minnesota Population Center (2014), Integrated Public Use Microdata Series, International: Version 6.3 [Machine-readable database], Brazil 2010 census, Institute of Geography and Statistics, University of Minnesota, Minneapolis; IBGE (2011), Perfil dos Municipios, Rio de Janeiro; IBGE (2010), Primary Roads, Rio de Janeiro; Sistema Firjan (2012), Indice Firjan de Desenvolvimento Municipal (IFDM), Rio de Janeiro; and McGranahan, G, D Balk and B Anderson (2007), “The rising tide: assessing the risks of climate change and human settlements in low elevation coastal zones”, Environment and Urbanization Vol 19, No 1, pages 17–37.
Factor correlations
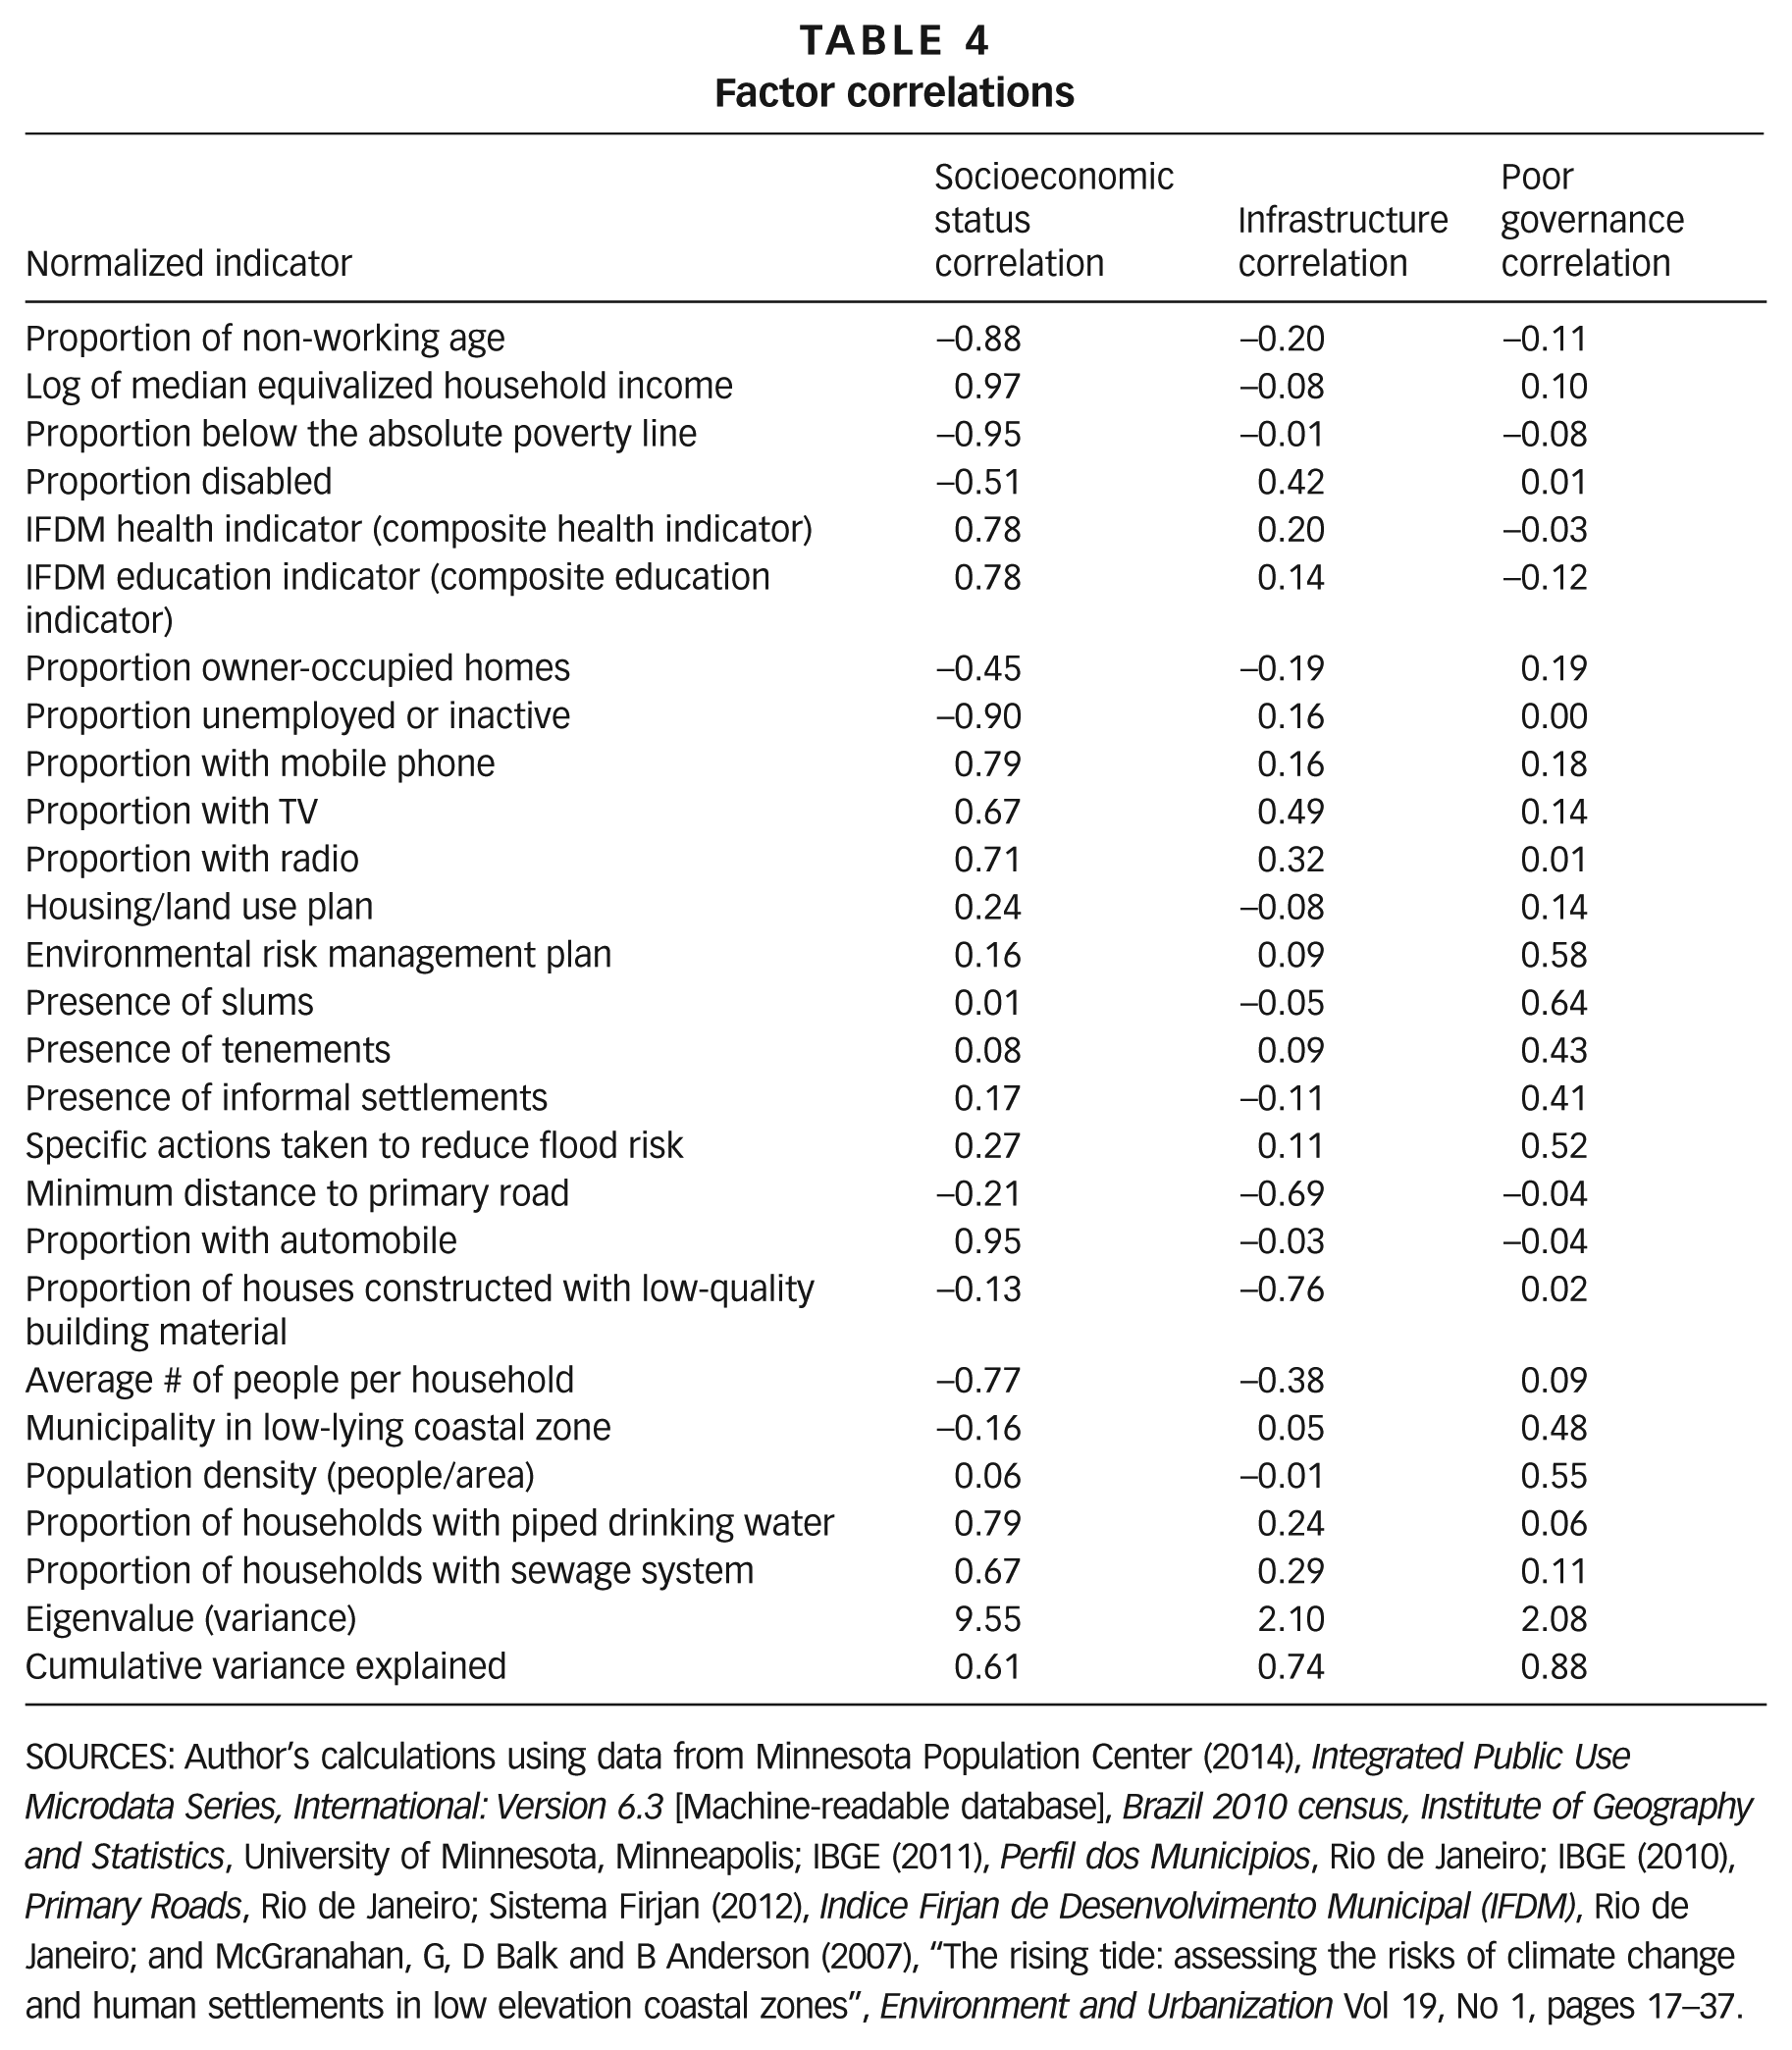
SOURCES: Author’s calculations using data from Minnesota Population Center (2014), Integrated Public Use Microdata Series, International: Version 6.3 [Machine-readable database], Brazil 2010 census, Institute of Geography and Statistics, University of Minnesota, Minneapolis; IBGE (2011), Perfil dos Municipios, Rio de Janeiro; IBGE (2010), Primary Roads, Rio de Janeiro; Sistema Firjan (2012), Indice Firjan de Desenvolvimento Municipal (IFDM), Rio de Janeiro; and McGranahan, G, D Balk and B Anderson (2007), “The rising tide: assessing the risks of climate change and human settlements in low elevation coastal zones”, Environment and Urbanization Vol 19, No 1, pages 17–37.
Indicators by factor, ordered by factor correlation score
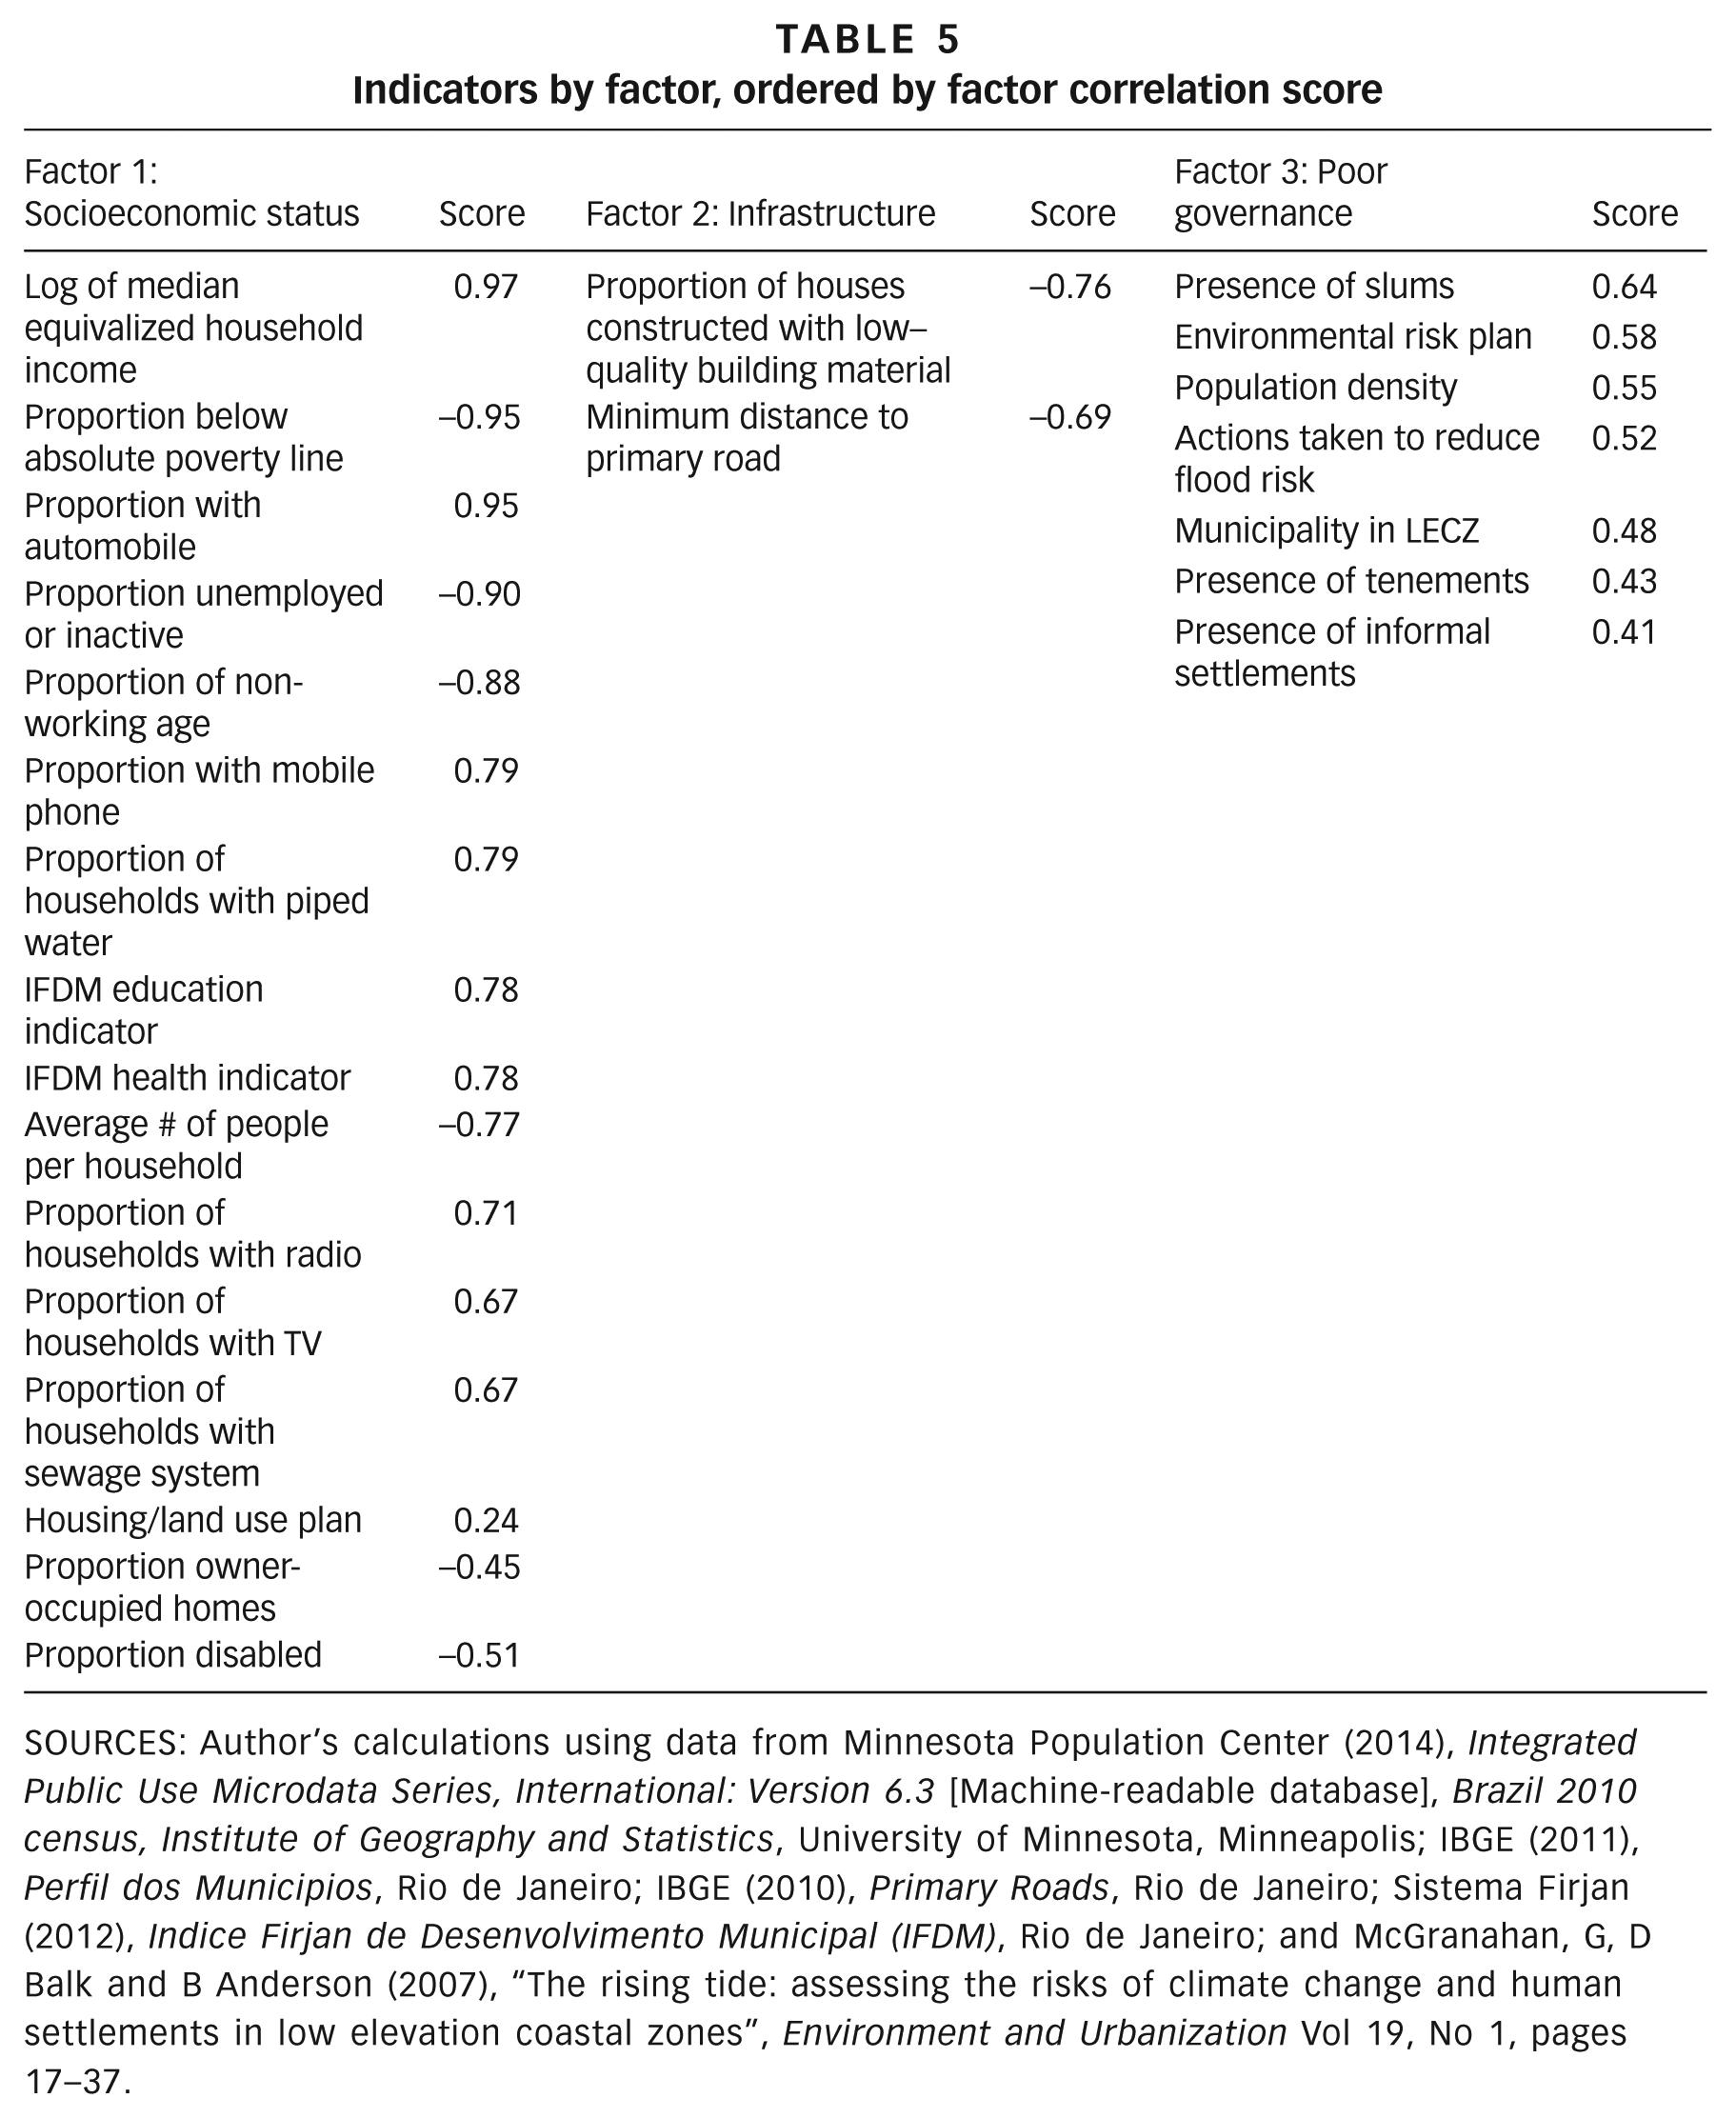
SOURCES: Author’s calculations using data from Minnesota Population Center (2014), Integrated Public Use Microdata Series, International: Version 6.3 [Machine-readable database], Brazil 2010 census, Institute of Geography and Statistics, University of Minnesota, Minneapolis; IBGE (2011), Perfil dos Municipios, Rio de Janeiro; IBGE (2010), Primary Roads, Rio de Janeiro; Sistema Firjan (2012), Indice Firjan de Desenvolvimento Municipal (IFDM), Rio de Janeiro; and McGranahan, G, D Balk and B Anderson (2007), “The rising tide: assessing the risks of climate change and human settlements in low elevation coastal zones”, Environment and Urbanization Vol 19, No 1, pages 17–37.
Factor 1: Socioeconomic status
Socioeconomic status explains 61 per cent of the variance across municipalities. Indicators that highly, positively correlate with Factor 1 include median income, proportion of households with an automobile, education score, health score, and proportions of households with mobile phones and piped drinking water. Proportion in absolute poverty and proportion not working are both highly, negatively correlated with Factor 1. Given the correlation values, a higher Factor 1 score indicates lower vulnerability.
Factor 2: Infrastructure
Infrastructure explains 13 per cent of the variance across municipalities. Indicators highly, negatively correlated with Factor 2 include the proportion of houses constructed from poor-quality building material, and the minimum distance to a primary road (the higher the value, the further the distance from a primary road). Factor 2, like Factor 1, is thus classified as a measure that indicates lower vulnerability.
Factor 3: Poor governance
The third and final retained factor, which explains 13 per cent of the variance across municipalities, I describe as a measure of poor governance. Indicators that positively and highly correlate with Factor 3 include the presence of slums, tenements and informal settlements as well as location within an LECZ. As the majority of the indicators that correlate positively and highly with Factor 3 increase vulnerability, Factor 3 is considered a measure that indicates higher vulnerability.
c. Weighting and combining of factors to create the final index score
Combined, the three factors explain 88 per cent of the variance across municipalities. I use an equal weighting method to aggregate the factors as this is preferred in the absence of strong theoretical support for weighting one factor over another.(49) Another weighting method, used by Nicoletti et al.,(50) weights factors based on the cumulative variance explained by each factor. This method, however, prioritizes variation in indicators across municipalities over the actual contribution of the given indicator to the overall vulnerability of the municipality. For example, the factor highly correlated with income may explain more variance between municipalities than the factor highly correlated with presence of slums, but socioeconomic status may not necessarily be more indicative of vulnerability than presence of slums. For this reason, I follow the Cutter et al.(51) approach and give equal weight to each factor, as follows:

I subtract Factors 1 and 2 from Factor 3 as Factors 1 and 2 indicate lower vulnerability while Factor 3 indicates higher vulnerability. The final vulnerability index score is, therefore, a measure of vulnerability such that a higher score indicates a higher level of vulnerability.
Factor analysis, commonly used as an exploratory research tool to reduce a lengthy list of collinear variables to a more manageable size, has become an increasingly common technique for constructing indices of socioeconomic status and wellbeing.(52) Critics suggest that the method is arbitrary as it relies too heavily on subjective conclusions by the researcher. It is, after all, up to the researcher to assign a specific “concept” to each factor, rather than simply construct the index by aggregating each indicator. However, any index construction technique requires a measure of subjectivity. Researchers constructing indices using factor analysis, much like those using more straightforward aggregation techniques, need to be guided by theory and the literature to ensure their indices truly reflect the social conditions they aim to capture. By constructing the index using Schneiderbauer and Ehrlich’s vulnerability framework and parameters, I am closely following the prescriptions of the vulnerability literature. Factor analysis is also acknowledged as a useful way to identify which indicators are most valuable.(53) To test the sensitivity of the vulnerability index to alternative aggregation and weighting methods, I reconstructed the index using an additive approach. The resulting scores were highly correlated with those obtained using factor analysis.
V. Mapping Vulnerability And Risk
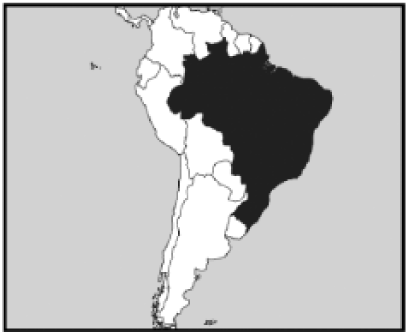
Map 1 shows the 1,276 urban municipalities under analysis and the urban areas within each urban municipality, as identified by nighttime light data.(54) Urban municipalities are defined here as those with over 20,000 residents and at least 50 per cent of households categorized as urban.
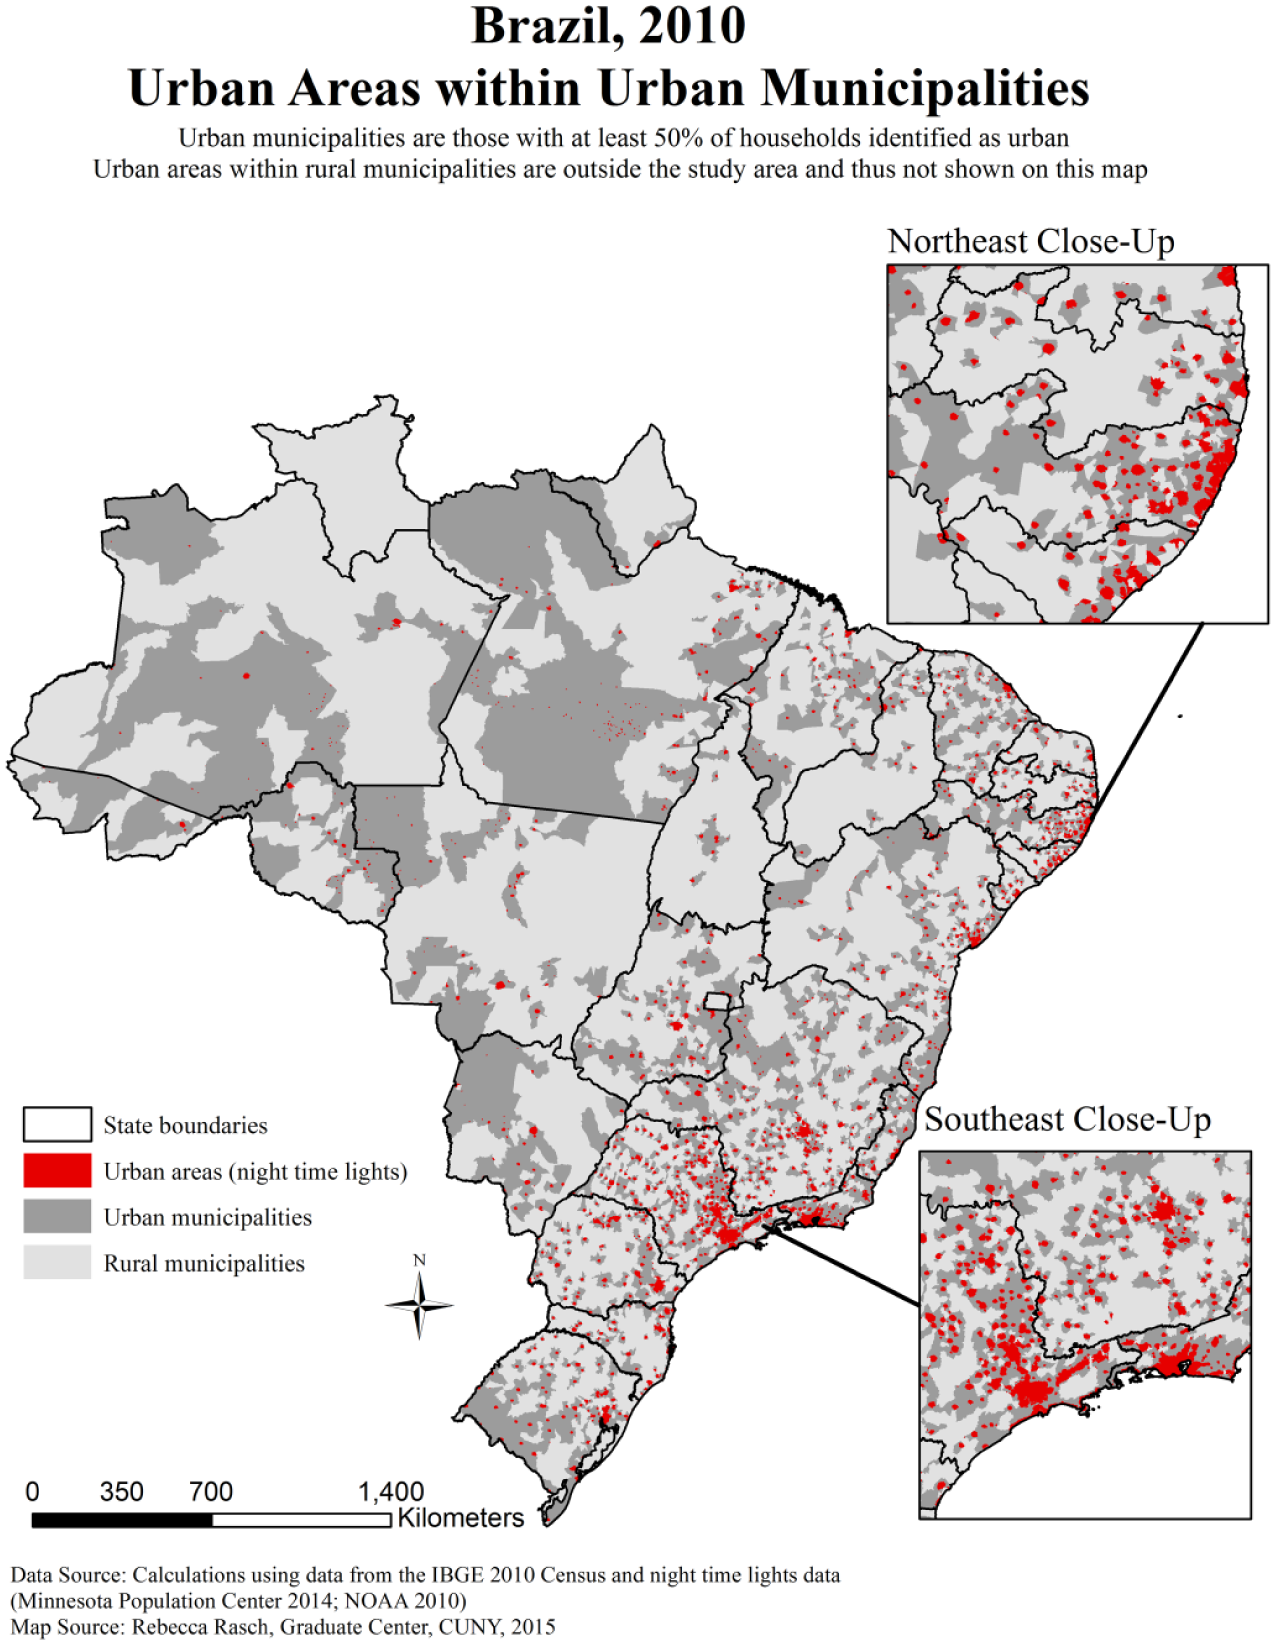
Urban areas of Brazil
Map 2 and Map 3 show the relative scores of each municipality. There is a significant difference between municipality land area and municipality population size in Brazil. Although the large (in terms of land area) municipalities in the North are highly vulnerable, they are also less populated than those in the Southeast. To capture this phenomenon, I map vulnerability scores by both municipality and population size.
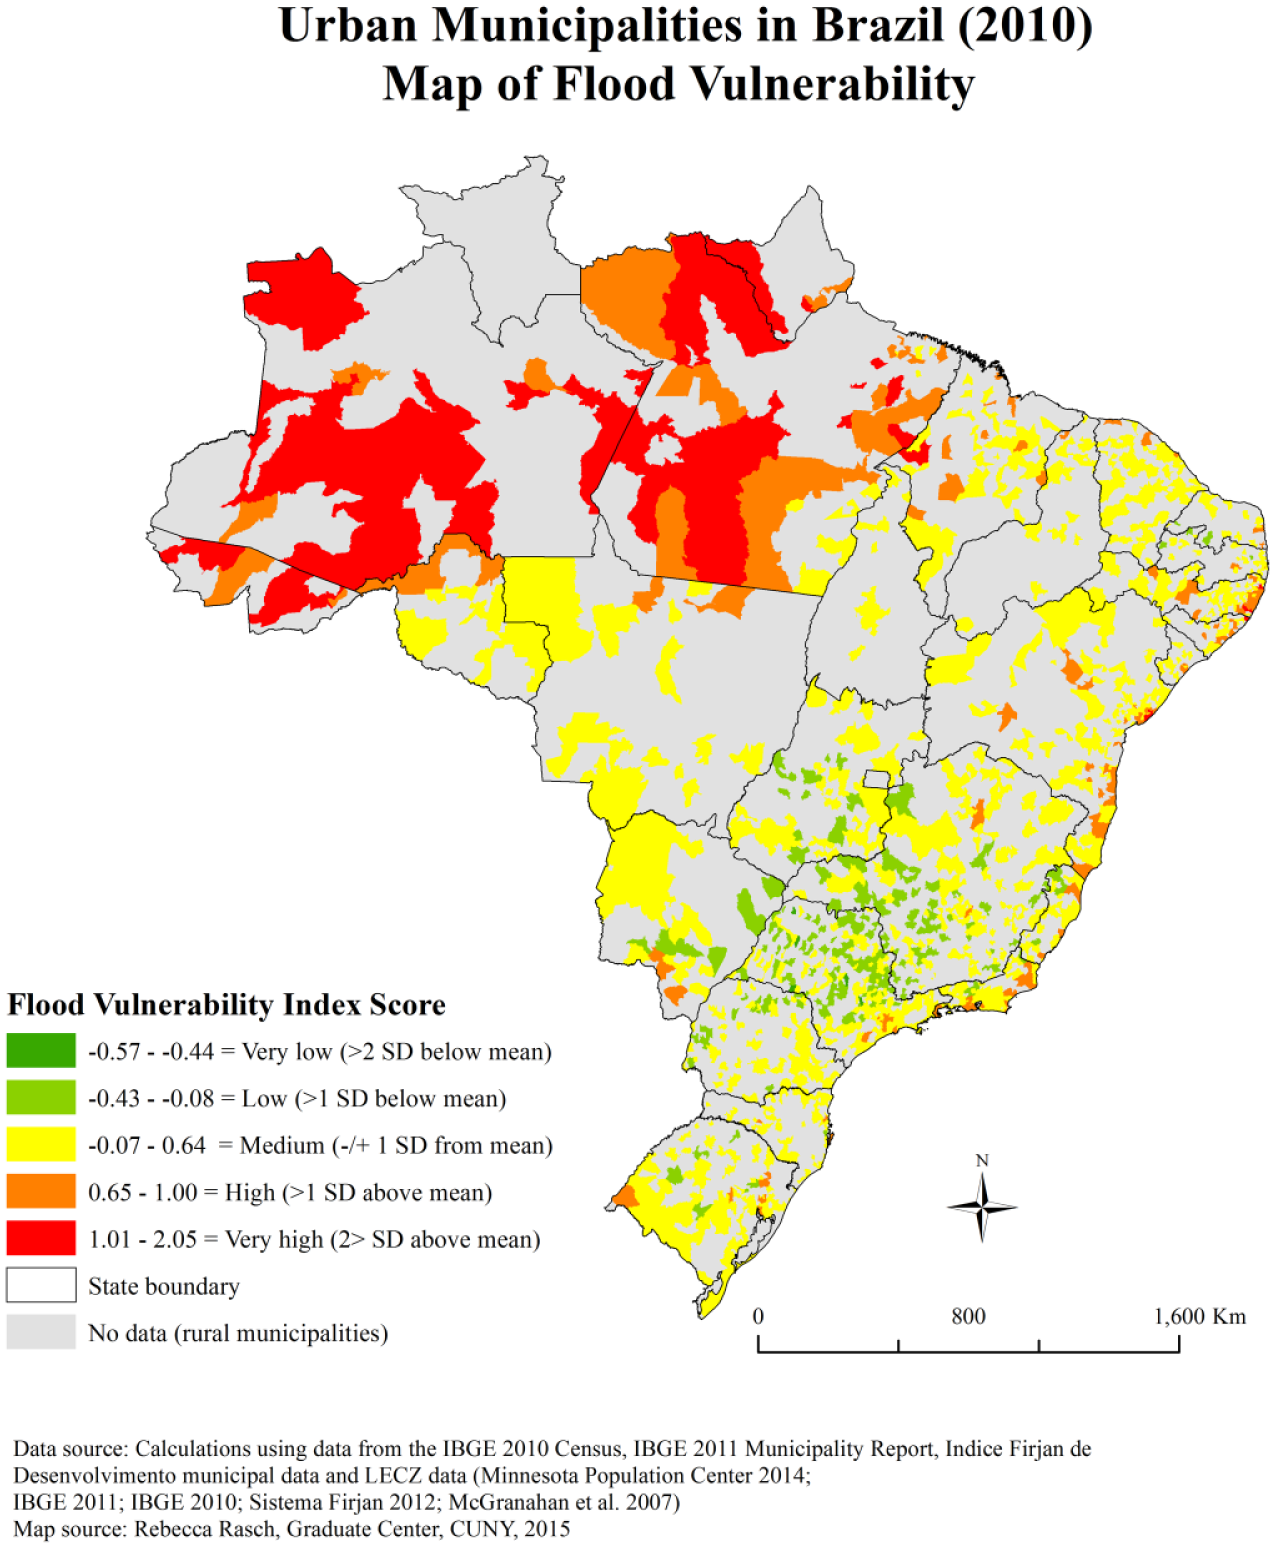
Flood vulnerability in urban municipalities of Brazil
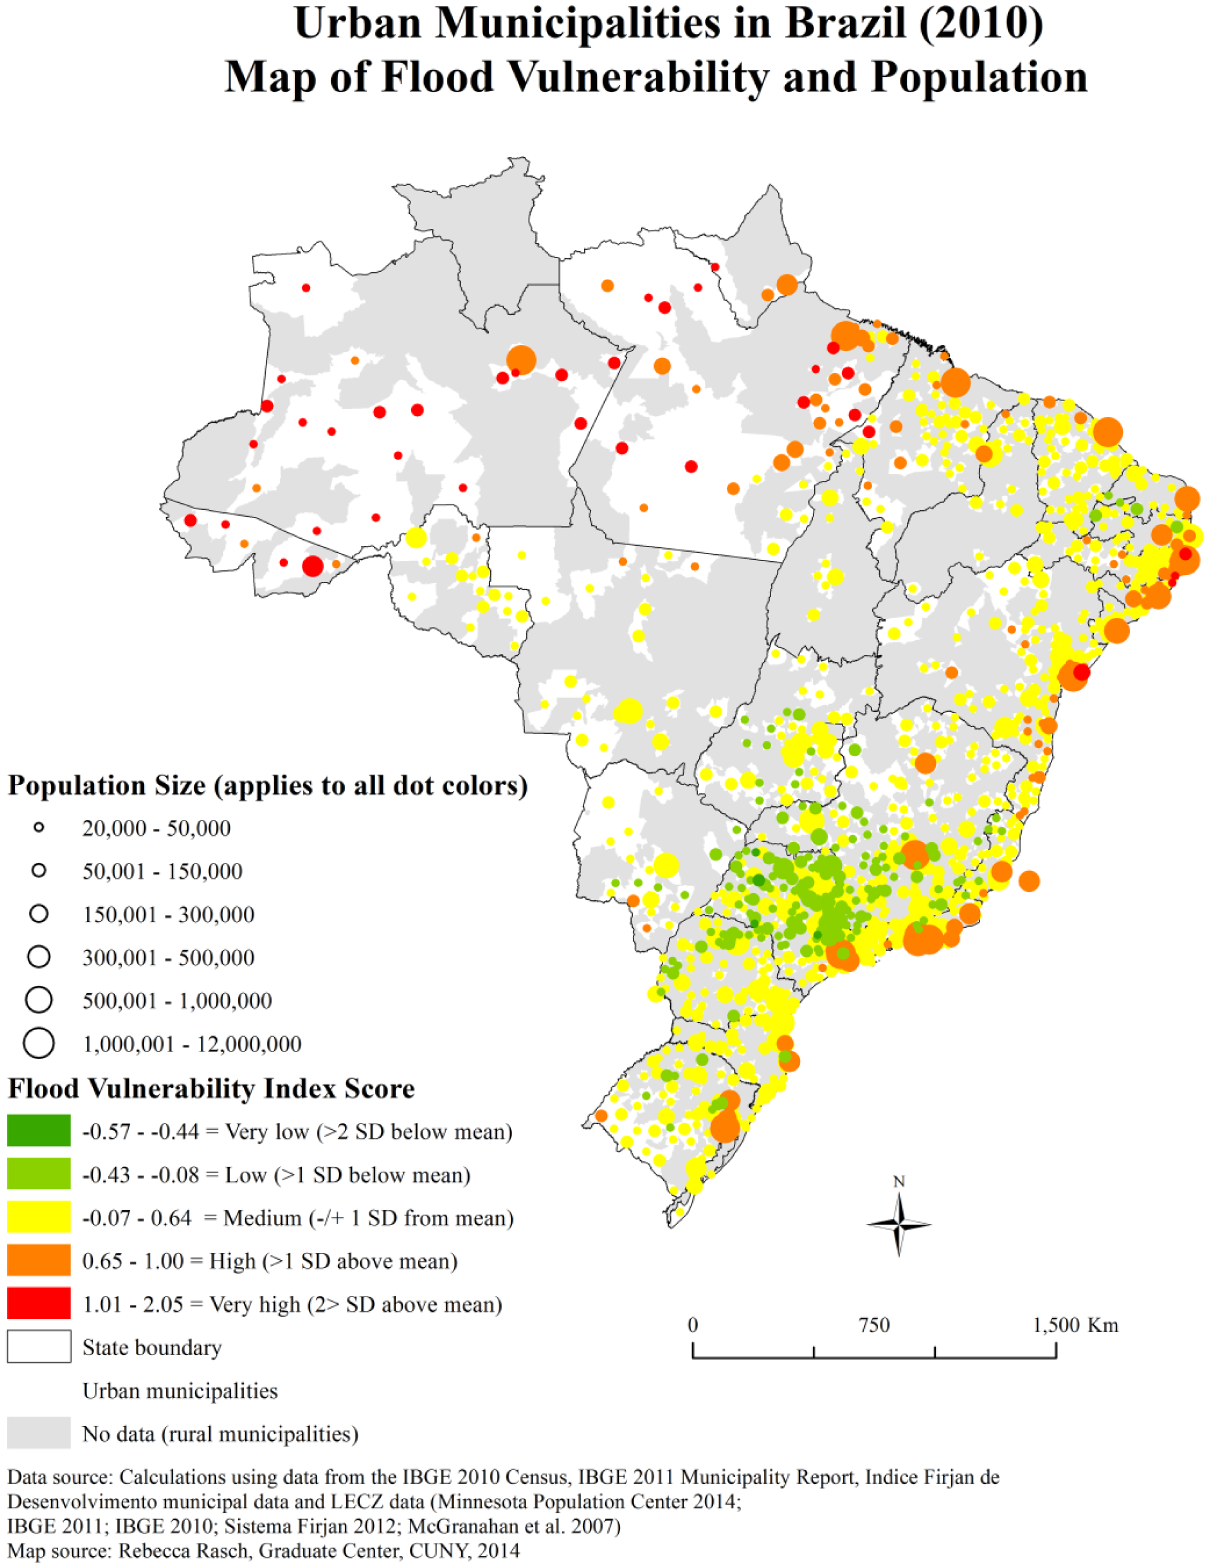
Flood vulnerability by population size in urban municipalities of Brazil
Next I map each component of vulnerability separately in Maps 4A–4C.
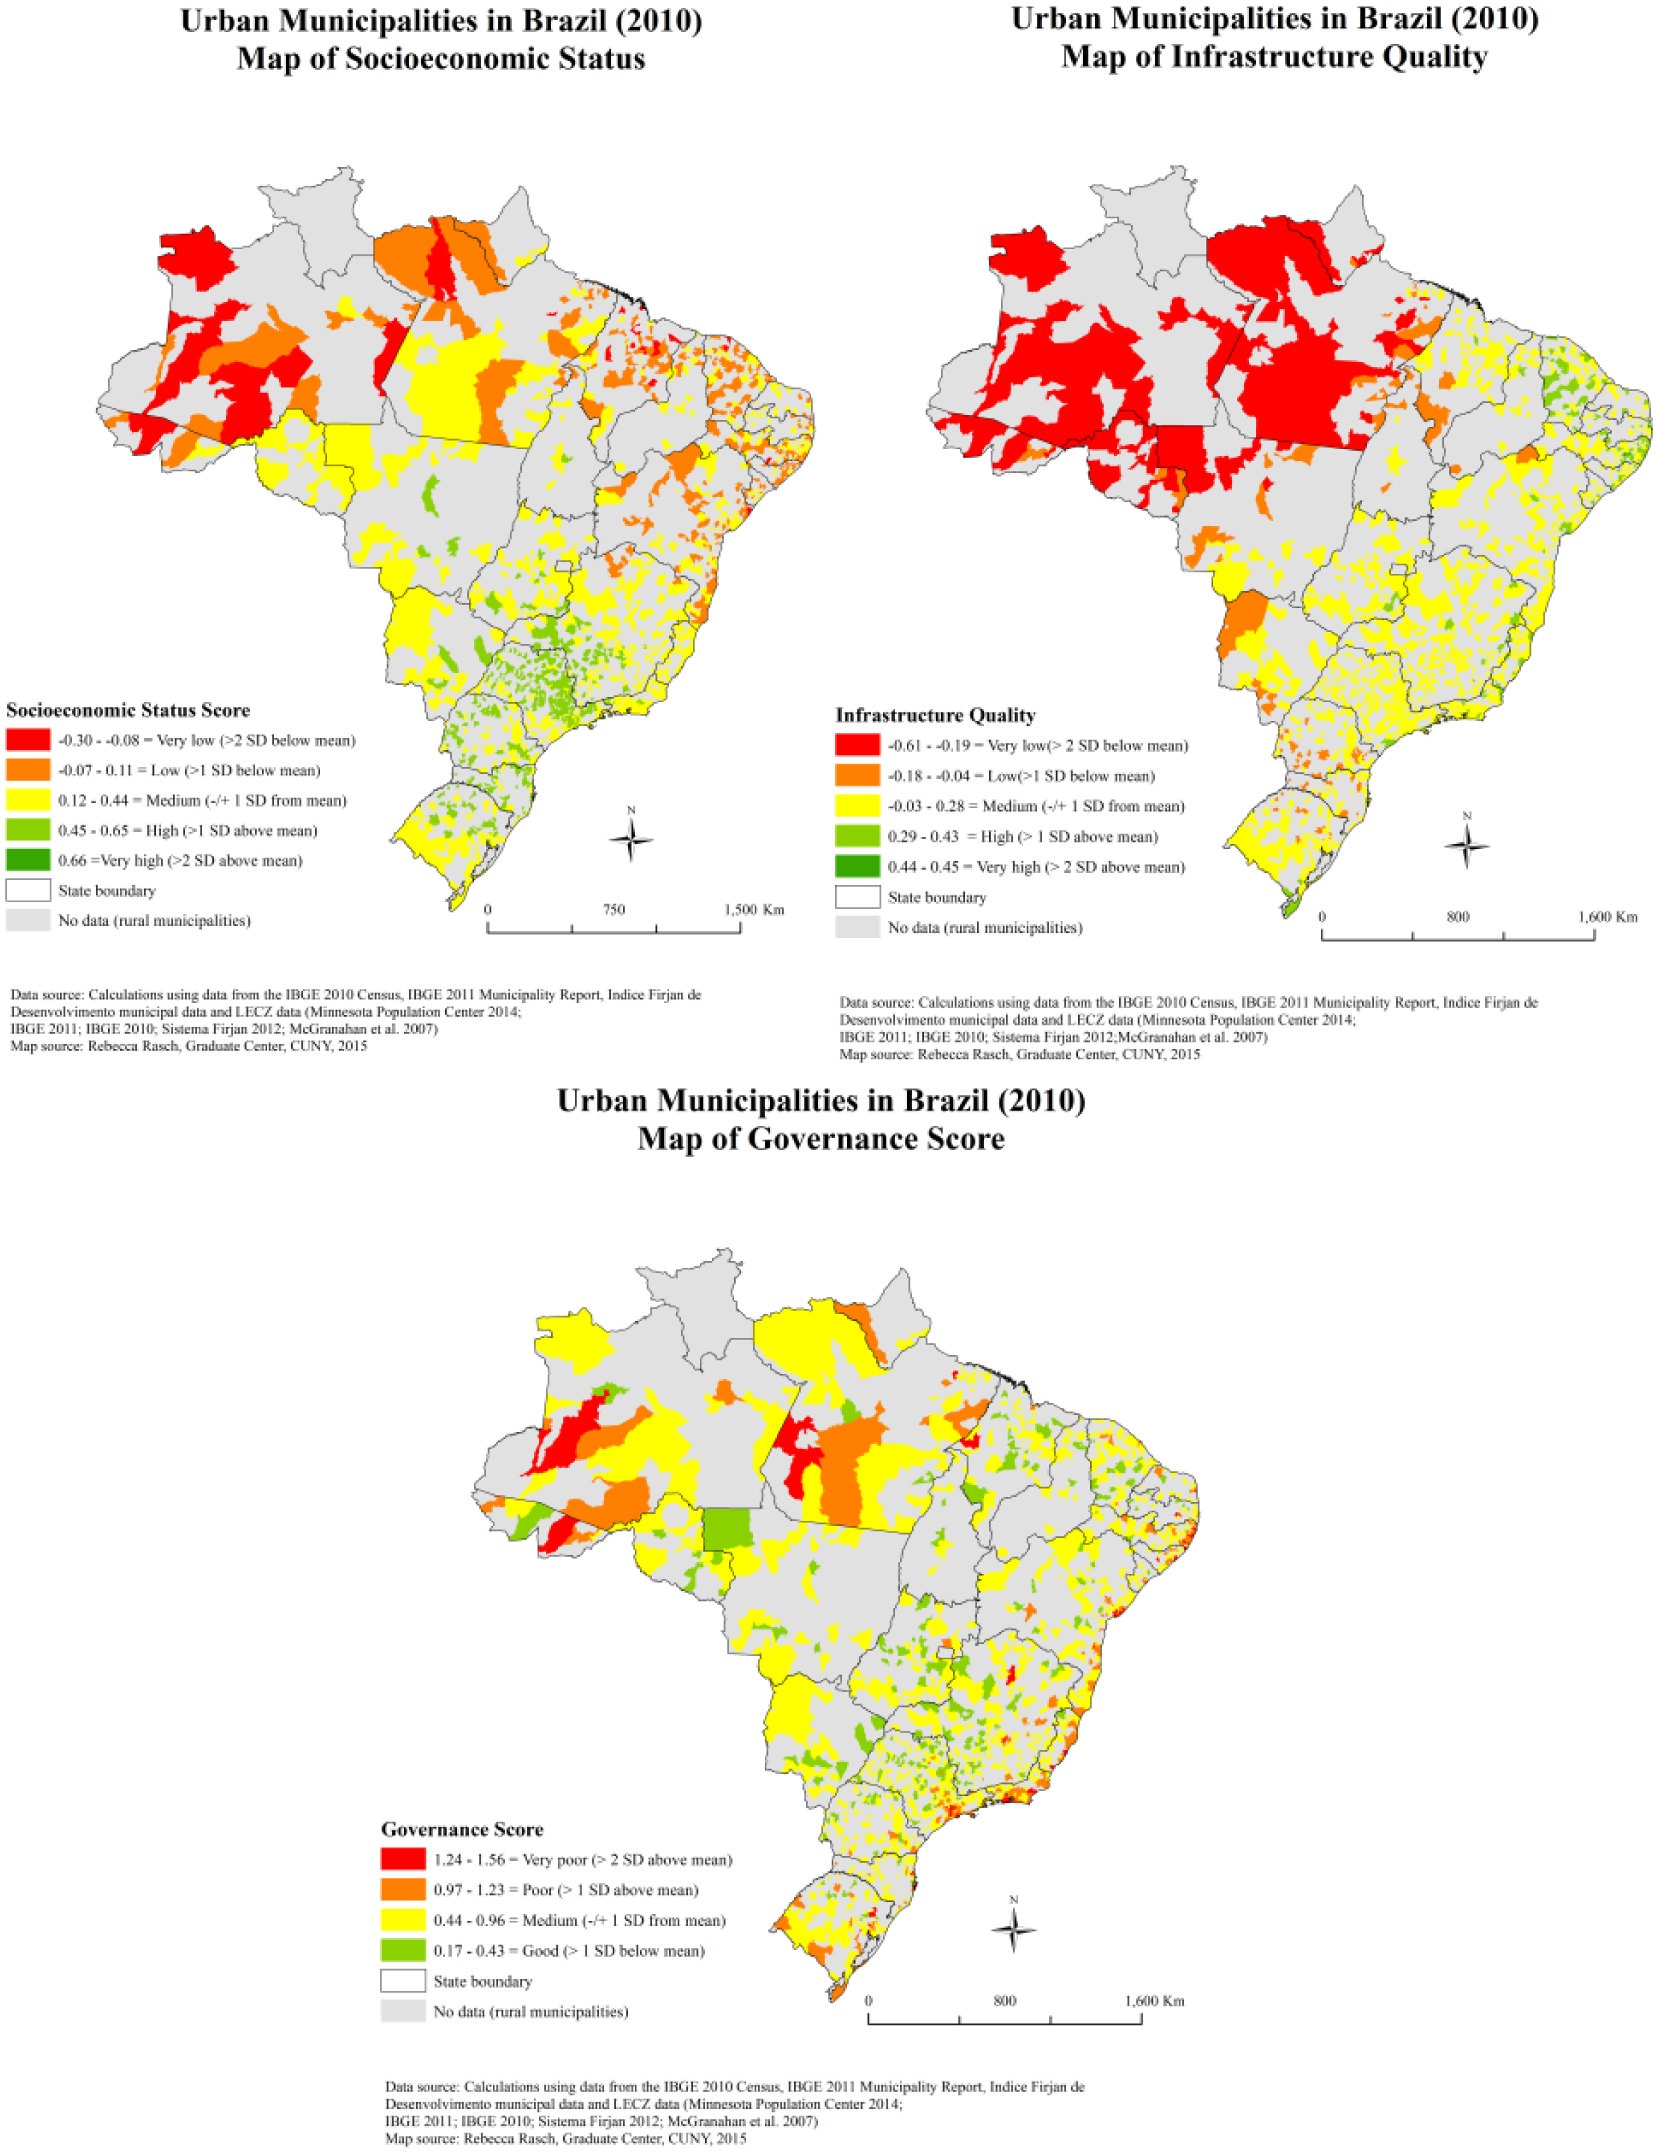
Components of vulnerability
There are clear differences in the distribution of each component across urban municipalities. While the Southeast has relatively low vulnerability in terms of socioeconomic status, it is highly vulnerable due to poor governance. These maps highlight the socioeconomic inequalities so prevalent in many middle-income countries, and particularly in Brazil. Although the aggregate level of socioeconomic status in a given municipality may be high, the municipality may also contain informal settlements and slums that are bereft of basic services and government protections. Vulnerability assessments that fail to take these inequalities into account will underestimate the overall level of vulnerability of municipalities with relatively high aggregate levels of socioeconomic status, such as those in the Southeastern regions of Brazil.
Next I combine flood hazard, flood exposure and flood vulnerability in Map 5, Map 6 and Map 7 to display those municipalities with high overall flood risk, i.e. a high or very high vulnerability index score and high flood exposure.
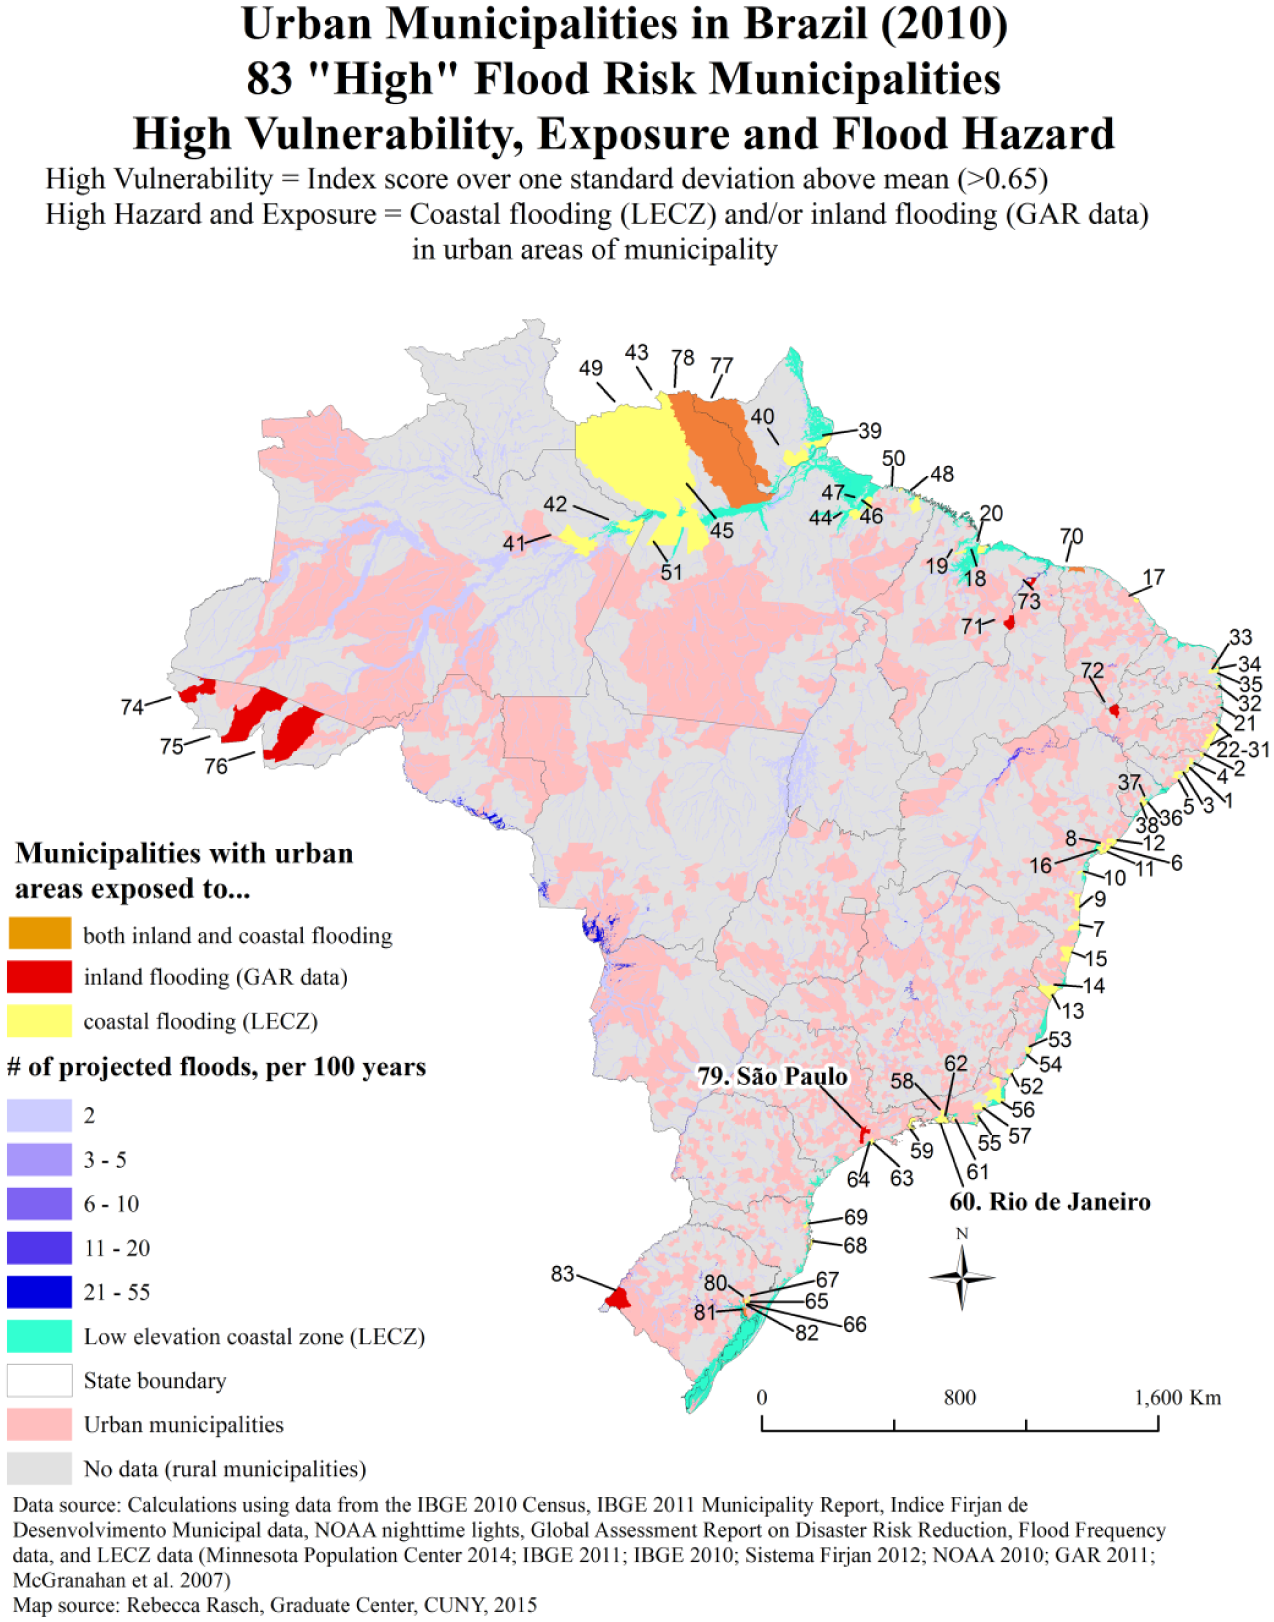
Urban municipalities with high flood risk
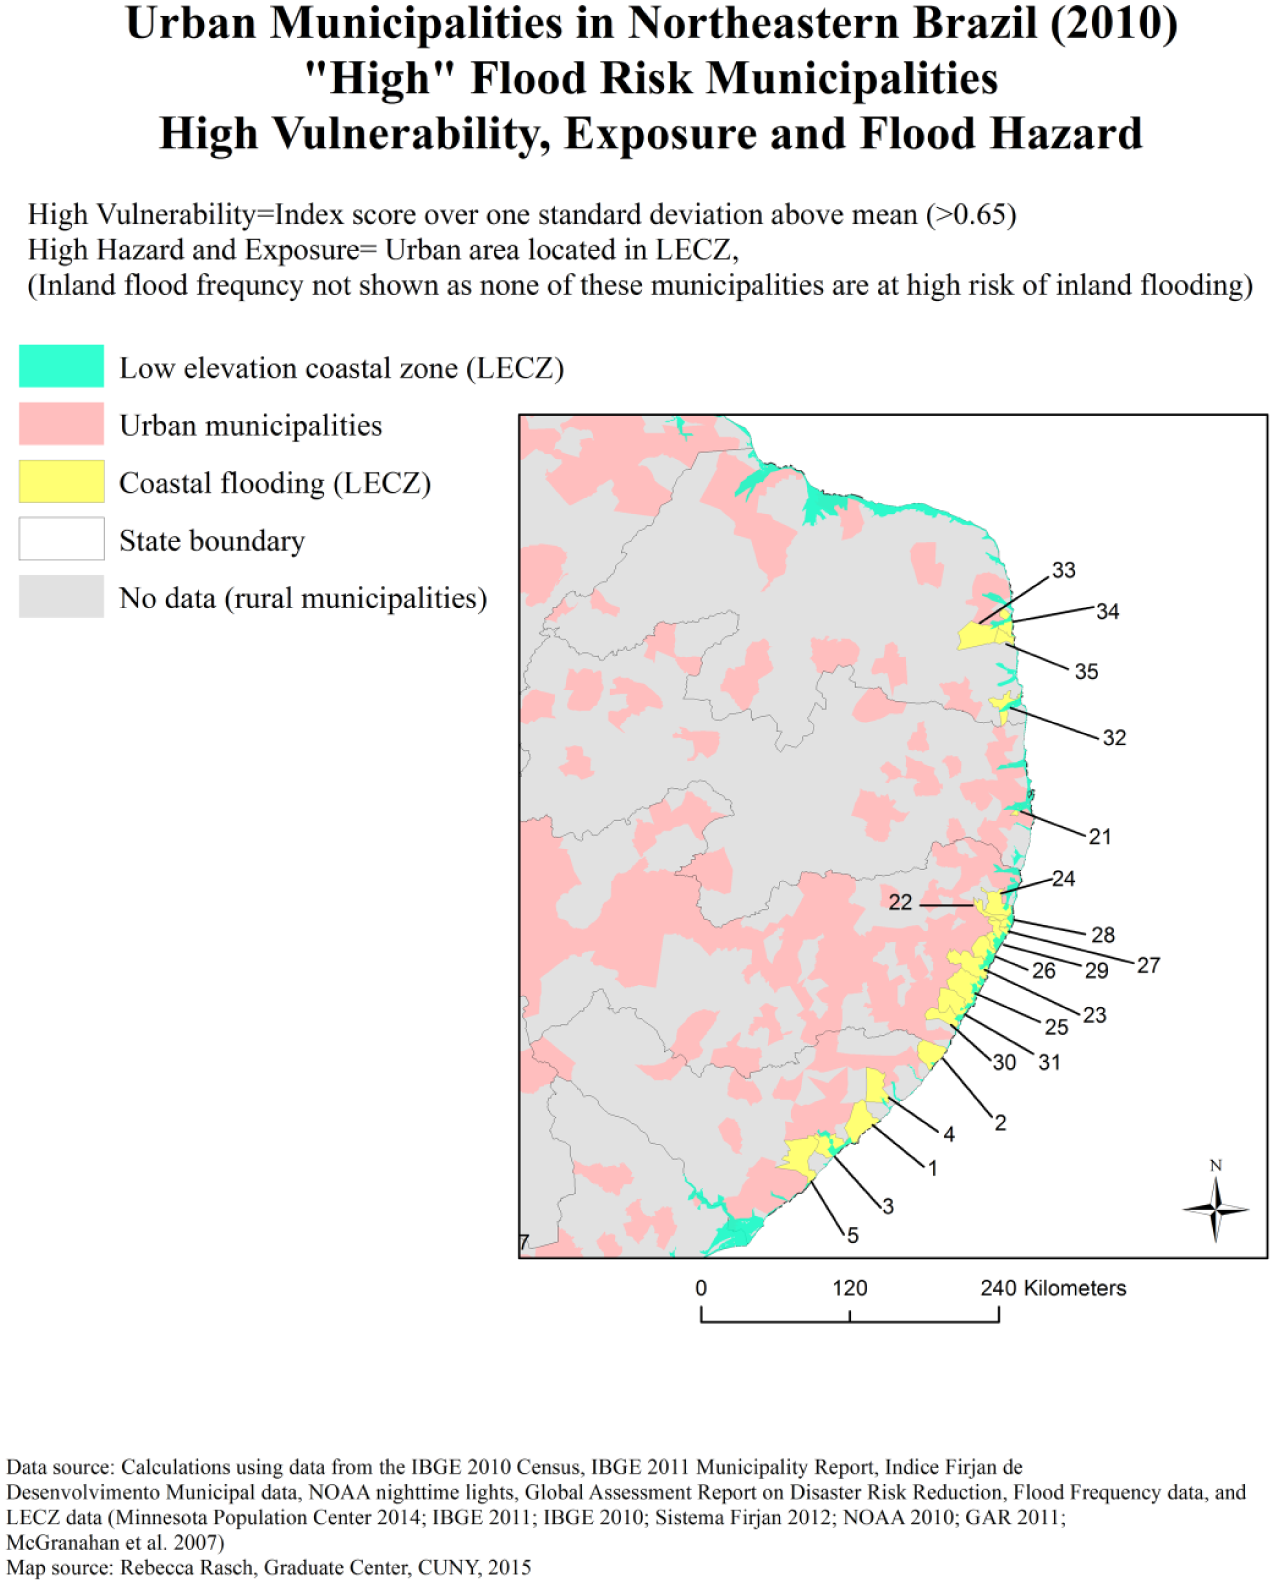
Urban municipalities with high flood risk in Northeastern Brazil
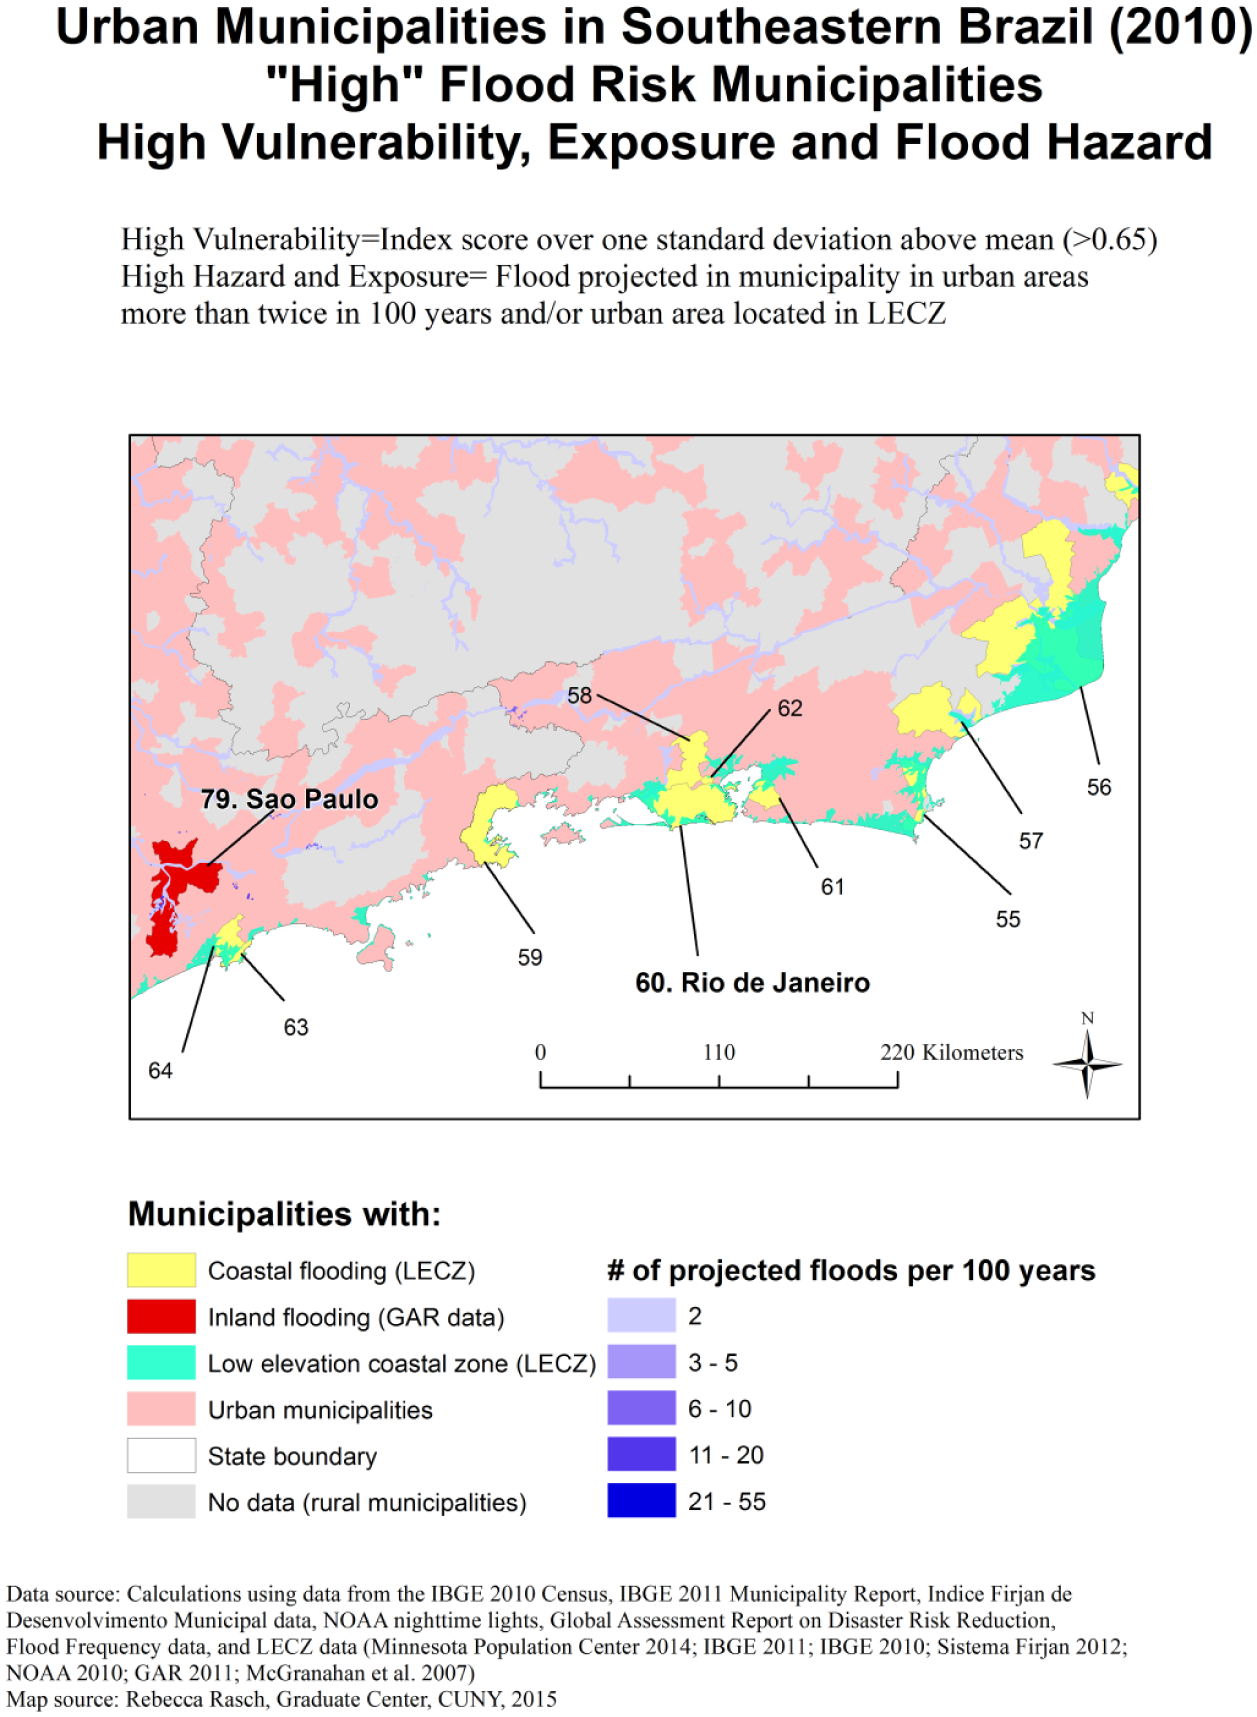
Urban municipalities with high flood risk in Southeastern Brazil
Flood exposure is represented by whether the urban areas within a municipality are exposed to flood hazards. There are 207 urban municipalities exposed to coastal flooding (i.e. they have urban areas located within an LECZ), while 670 are exposed to moderate inland flooding (i.e. have urban areas projected to flood at least twice in 100 years), and 129 are exposed to severe inland flooding (i.e. have urban areas projected to flood more than four times in 100 years).
Urban municipalities with urban areas that are either located within an LECZ or are projected to flood more than twice in 100 years are considered to have high flood exposure. Eighty-three urban municipalities are considered to have “high” flood risk. These municipalities have a vulnerability index score at least one standard deviation above the mean and have urban areas located within an LECZ and/or urban areas that are projected to flood more than twice in 100 years.
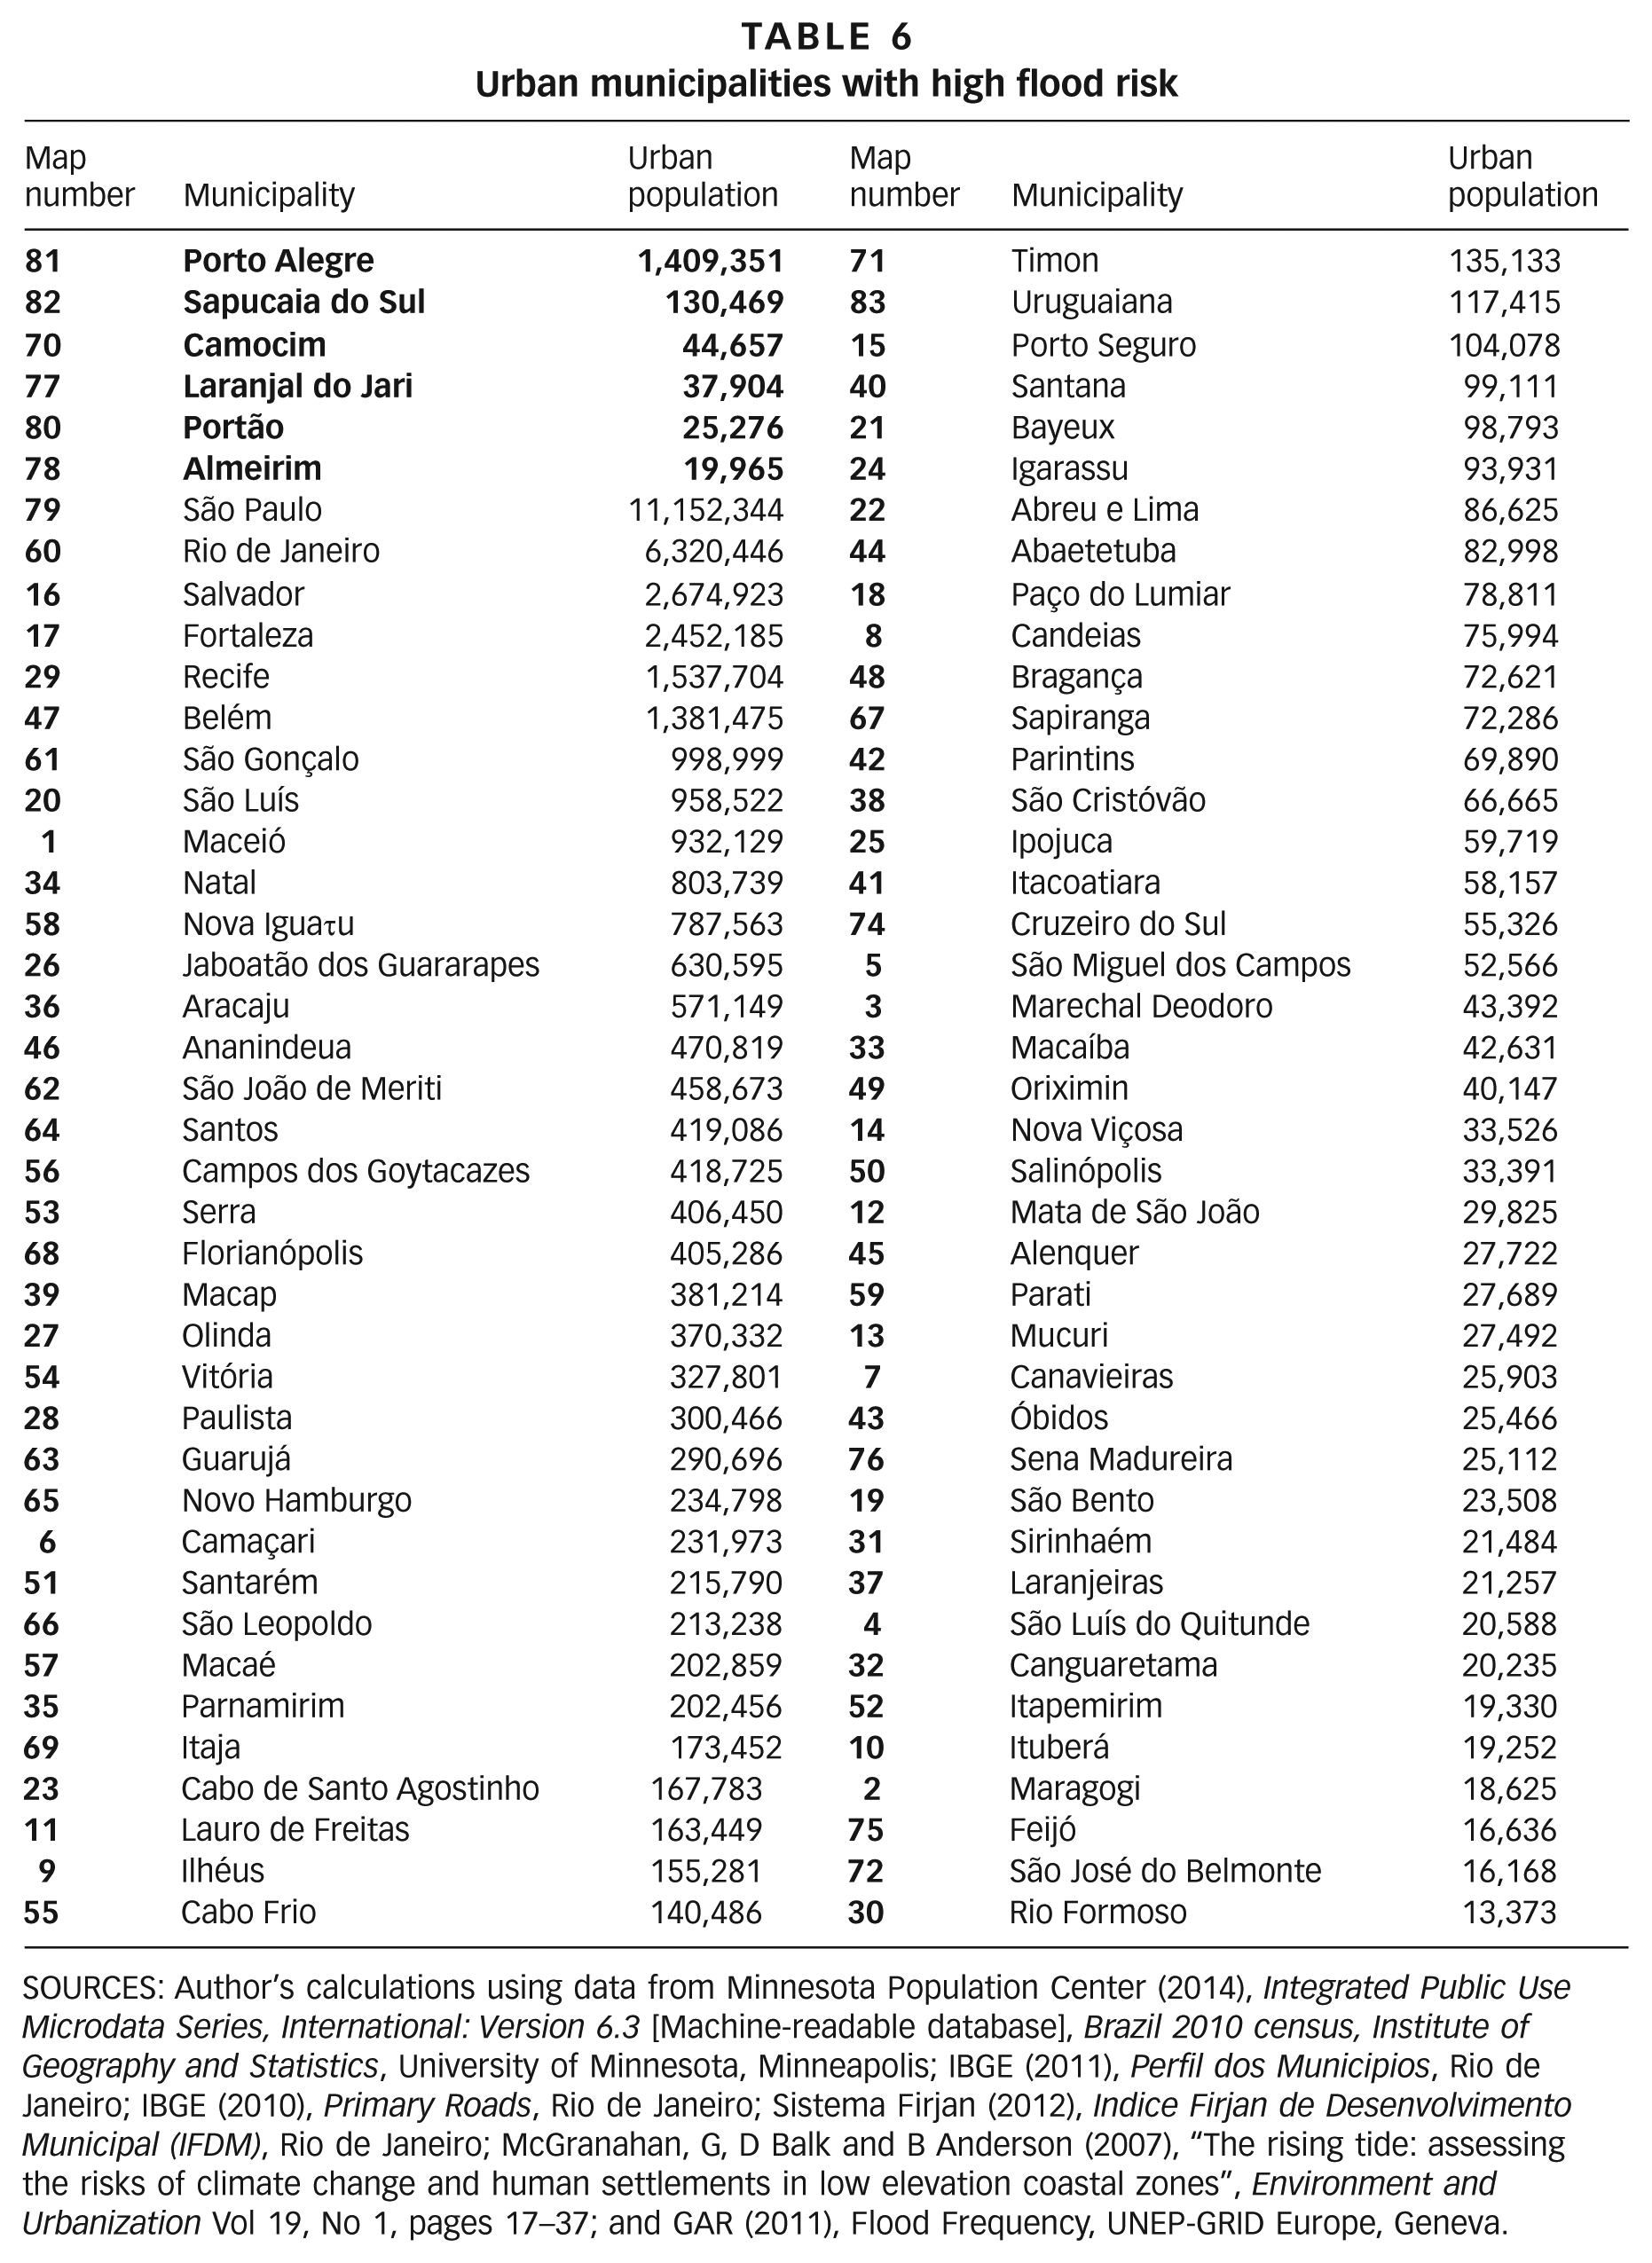
Urban municipalities with larger urban populations also have higher exposure, compared to those with smaller populations. Although population is not captured in Map 5, it is listed in the accompanying Table 6. The exposed population figures listed in the table are the total numbers of people in urban households within each municipality. These population counts are calculated from 2010 census tract data. Over 41.3 million urban residents, approximately 26 per cent of the urban population and 22 per cent of the total population of Brazil, are located in municipalities with high flood risk.
Urban municipalities with high flood risk
SOURCES: Author’s calculations using data from Minnesota Population Center (2014), Integrated Public Use Microdata Series, International: Version 6.3 [Machine-readable database], Brazil 2010 census, Institute of Geography and Statistics, University of Minnesota, Minneapolis; IBGE (2011), Perfil dos Municipios, Rio de Janeiro; IBGE (2010), Primary Roads, Rio de Janeiro; Sistema Firjan (2012), Indice Firjan de Desenvolvimento Municipal (IFDM), Rio de Janeiro; McGranahan, G, D Balk and B Anderson (2007), “The rising tide: assessing the risks of climate change and human settlements in low elevation coastal zones”, Environment and Urbanization Vol 19, No 1, pages 17–37; and GAR (2011), Flood Frequency, UNEP-GRID Europe, Geneva.
Table 6 corresponds to Map 5, and lists those urban municipalities designated as having high flood risk. The first six municipalities listed in the table are those with urban areas exposed to both types of flood hazards, i.e. urban areas located within an LECZ and urban areas projected to flood more than twice in the next 100 years. The subsequent high-risk municipalities are listed in descending order by urban population.
VI. Discussion And Implications For Adaptation Policy
In this work, I draw on an established vulnerability index framework to construct a vulnerability index for urban Brazilian municipalities. I map vulnerability scores and highlight those municipalities with high vulnerability, high flood hazard and high flood exposure, to determine the size of the population at risk.
This analysis demonstrates how a more holistic approach to vulnerability assessment, which includes socioeconomic and spatial data, can illuminate which urban populations are most vulnerable to climate change. This assessment also illustrates the uneven distribution of the three factors that comprise vulnerability. Northern municipalities have lower socioeconomic status, compared to the Southern areas. However, poor governance, characterized by informal settlements and slums, is an issue that plagues all regions, even those municipalities with relatively high levels of socioeconomic status. An adaptation strategy that equates vulnerability with low socioeconomic status and does not take governance into account may underestimate the need to build adaptive capacity in more highly, yet more unevenly, developed municipalities, such as Rio de Janeiro and São Paulo. Urbanization and socioeconomic inequality often go hand in hand in developing countries. Given this fact, it is of paramount importance to assess vulnerability in these rapidly growing urban centres using measures that capture, not simply aggregate, levels of socioeconomic status, but also the distribution of resources and protections across the entire population.
Footnotes
Acknowledgements
I would like to express my very great appreciation to Dr Deborah Balk, Dr Paty Romero-Lankao, Dr Janet Gornick and Dr Tammy Lewis for their valuable and constructive suggestions during the planning and development of this research work.
1.
EM-DAT, The International Disaster Database (2014a), “Natural disasters”, Brazil: Country Profile, accessed 8 June 2014 at ![]() .
.
2.
EM-DAT, The International Disaster Database (2014b), “TOP Disasters”, Brazil: Country Profile, accessed 7 October 2014 at ![]() .
.
3.
Moser, Caroline and David Satterthwaite (2010), “Toward Pro-Poor Adaptation to Climate Change in the Urban Centers of Low- and Middle-Income Countries,” in R Mearns and A Norton (editors), Social dimensions of climate change, World Bank, Washington, DC, pages 231–258.
4.
Cera, Jossana Ceolin and Simone Erotildes Teleginski Ferraz (2015), “Climate Variability in Southern Brazil Precipitation in Present and Future Climate”, Revista Brasileira de Meteorologia Vol 30, No 1, pages 81–88.
5.
Municipalities with fewer than 50 per cent of households categorized as urban by the Brazilian census are considered rural municipalities and not included in this research.
6.
Barnett, Jon, Simon Lambert and Ian Fry (2008), “The hazards of indicators: insights from the environmental vulnerability index”, Annals of the Association of American Geographers Vol 98, No 1, pages 102–119.
7.
Birkmann, Jörn (editor) (2006), Measuring Vulnerability to Natural Hazards: Towards Disaster Resilient Societies, United Nations University Press, New York.
8.
Romero-Lankao, Patricia, Hua Qin and Katie Dickinson (2012), “Urban vulnerability to temperature-related hazards: A meta-analysis and meta-knowledge approach”, Global Environmental Change Vol 22, pages 670–683.
9.
Müller, A, J Reiter and U Weiland (2011), “Assessment of Urban Vulnerability Towards Floods Using an Indicator-based Approach – a Case Study for Santiago de Chile”, Natural Hazards and Earth System Science Vol 11, No 8, pages 2107–2123.
10.
See reference 8.
11.
Schneiderbauer, Stefan and Daniele Ehrlich (2006), “Social levels and hazard (in)dependence in determining vulnerability”, in J Birkmann (editor), Measuring Vulnerability to Natural Hazards: Towards Disaster Resilient Societies, United Nations University Press, New York, pages 78–102, page 79.
12.
Crichton, D (1999), “The Risk Triangle”, in J Ingleton (editor), Natural Disaster Management, Tudor Rose, London, pages 102–103.
14.
See reference 11.
15.
See reference 6.
16.
McGranahan, G, D Balk and B Anderson (2007), “The rising tide: assessing the risks of climate change and human settlements in low elevation coastal zones”, Environment and Urbanization Vol 19, No 1, pages 17–37.
17.
See reference 1.
18.
Geoscience Australia (2014), “What causes landslides?”, accessed 11 September 2014 at ![]() .
.
19.
van Ruijven, Bas J, Marc A Levy, Arun Agrawal, Frank Biermann, Joern Birkmann, Timothy R Carter, Kristie L Ebi, Matthias Garschagen, Bryan Jones, Roger Jones, Eric Kemp-Benedict, Marcel Kok, Kasper Kok, Maria Carmen Lemos, Paul L Lucas, Ben Orlove, Shonali Pachauri, Tom M Parris, Anand Patwardhan, Arthur Petersen, Benjamin L Preston, Jesse Ribot, Dale S Rothman and Vanessa J Schweize (2014), “Enhancing the relevance of Shared Socioeconomic Pathways for climate change impacts, adaptation and vulnerability research”, Climatic Change Vol 122, pages 481–494.
20.
Bartlett, Sheridan (2008), “Climate change and urban children: impacts and implications for adaptation in low- and middle-income countries”, Environment and Urbanization Vol 20, No 2, pages 501–519.
21.
Households have both fixed and variable costs and each additional household member significantly increases only variable costs, such as food, clothing and school fees. Fixed costs, such as rent or mortgage payments, remain unchanged.
22.
OECD (2013), Economic Surveys: Brazil, accessed 23 July 2014 at ![]() .
.
23.
In 2010, the exchange rate for the Brazilian real (R$) to the US dollar at purchasing power parity was R$ 1.74 = US$ 1. US$ 4 in 2005 dollars is equal to approx. US$ 4.47 in 2010 dollars due to inflation.
24.
Patrick, personal interview, 9 December 2014, Rocinha, Rio de Janeiro.
25.
Montgomery, Mark R and Paul C Hewett (2005), “Urban Poverty and Health in Developing Countries: Household and Neighborhood Effects”, Demography Vol 42, No 3, pages 397–425.
26.
27.
Brooks, Nick, W Neil Adger and P Mick Kelly (2005), “The determinants of vulnerability and adaptive capacity at the national level and the implications for adaptation”, Global Environmental Change Vol 15, No 2, pages 151–163.
28.
See reference 16.
29.
I include both those unemployed and those not in the labour force for this measure.
30.
Federal Statistics Office (2014), “National economy - Savings rate of households”, accessed 25 July 2014 at ![]() .
.
31.
De Ferranti, D, F Ferreira, G Perry and M Walton (2004), Inequality in Latin America and the Caribbean. Breaking with History?, World Bank, Washington, DC, accessed 1 February 2014 at ![]() .
.
32.
Puppim de Oliveira, Jose Antonio (2009), “The Implementation of Climate Change Related Policies at the Subnational Level: An Analysis of Three Countries”, Habitat International Vol 33, No 3, pages 253–259.
33.
See reference 16.
34.
See reference 1.
35.
The term “slum” usually has derogatory connotations and can suggest that a settlement needs replacement or can legitimate the eviction of its residents. However, it is a difficult term to avoid for at least three reasons. First, some networks of neighbourhood organizations choose to identify themselves with a positive use of the term, partly to neutralize these negative connotations; one of the most successful is the National Slum Dwellers Federation in India. Second, the only global estimates for housing deficiencies, collected by the United Nations, are for what they term “slums”. And third, in some nations, there are advantages for residents of informal settlements if their settlement is recognized officially as a “slum”; indeed, the residents may lobby to get their settlement classified as a “notified slum”. Where the term is used in this journal, it refers to settlements characterized by at least some of the following features: a lack of formal recognition on the part of local government of the settlement and its residents; the absence of secure tenure for residents; inadequacies in provision for infrastructure and services; overcrowded and sub-standard dwellings; and location on land less than suitable for occupation. For a discussion of more precise ways to classify the range of housing sub-markets through which those with limited incomes buy, rent or build accommodation, see Environment and Urbanization Vol 1, No 2 (1989), available at ![]() .
.
In the Brazilian municipality dataset, there is a distinction made between slums and illegal settlements. Both are considered informal settlements.
36.
37.
Baptista, Sandra and Susana Adamo (2014), “A Spatial Analysis of the 2008 Itajaí River Valley Disaster”, Center for International Earth Science Information Network, accessed 25 September 2014 at ![]() .
.
38.
See reference 16.
39.
The minimum distance to a primary road is calculated as the distance from the closest primary road to the municipality boundary. Municipalities that contain primary roads were assigned a value of 0. Thus, a higher value on this indicator denotes a higher level of isolation and vulnerability.
40.
See reference 16.
41.
Ideally I would be able to distinguish in finer detail the extent to which a municipality falls within the LECZ, i.e. 15 per cent of the population is exposed. Unfortunately the spatial resolution of the data does not allow for a more distilled characterization.
42.
Martine, George and Daniel Schensul (editors) (2013), The Demography of Adaptation to Climate Change, United Nations Population Fund, International Institute for Environment and Development and El Colegio de México, New York, London and Mexico City.
43.
Perlman, Janice (2011), Favelas: Four Decades of Living on the Edge in Rio de Janeiro, Oxford University Press, New York.
44.
See reference 19.
45.
Nicoletti, Giuseppe, Stefano Scarpetta and Olivier Boylaud (1999), “Summary Indicators of Product Market Regulation with an Extension to Employment Protection Legislation”, Economics Department Working Paper 226, OECD, Paris.
46.
Romero-Lankao, Patricia, Hua Qin and Mercy Borbor-Cordova (2013), “Exploration of health risks related to air pollution and temperature in three Latin American cities”, Social Science & Medicine Vol 83, pages 110–118.
47.
Cutter, Susan L, Bryan J Boruff and W Lynn Shirley (2003), “Social Vulnerability to Environmental Hazards”, Social Science Quarterly Vol 84, No 2, pages 242–261.
48.
Nardo, Michela, Michaela Saisana, Andrea Saltelli and Stefano Tarantola (2005), Tools for Composite Indicators Building, European Commission, Ispra.
49.
See reference 47.
50.
See reference 45.
51.
See reference 47.
52.
Vyas, Seema and Lilani Kumaranayake (2006), “Constructing Socioeconomic Status Indices: How to Use Principal Components Analysis”, Health Policy and Planning Vol 21, No 6, pages 459–468.
53.
See reference 47.