
Abstract
Sanitation interventions routinely overlook the implications of secure tenure for investment on the part of households. Drawing upon primary field research in Dakar, this paper presents a citywide sanitation planning framework that combines existing sanitation planning approaches with householders’ investment logic as a function of their tenure security and status. The resulting framework, the Sanitation Cityscape, maps what is happening to faecal material on a citywide scale and why, thus providing a snapshot of the sanitation status of the city and a rationale for targeted interventions along the sanitation service chain. The paper offers an approach for policymakers and practitioners to narrow the decision-making process for citywide sanitation service provision. It aims to target urban sanitation interventions that are appropriate to the urban tenure mix, including non-networked systems, and a greater emphasis on widening the scope of sanitation service provision to include tenure-neutral operational activities, such as faecal sludge management.
I. Introduction
Urbanization is the defining trend of the twenty-first century, with more people living in urban than rural areas for the first time in our history. It is anticipated that over the next few decades Africa and Asia will see the fastest urban growth rate, with 56 and 64 per cent of their respective populations estimated to be urban by 2050,(1) a fact that is reflected in current proposals for post-2015 Sustainable Development Goals (SDGs) for water supply, sanitation and hygiene.(2) Overall, sanitation is currently one of the most off-track of the Millennium Development Goal (MDG) targets.(3) This paper is therefore timely in addressing the planning of sustainable citywide sanitation improvements.
There is an inherent risk with strategies and programmes that target specific groups within the complex urban milieu of failing to take account of the total picture of citywide sanitation.(4) Past efforts to improve urban sanitation have typically been disjointed and have failed to reach a large proportion of the urban population. In efforts to encourage improved sanitation planning in local government, sanitation theorists have turned their focus towards citywide sanitation planning.
The approach presented in this paper builds upon the existing conceptual and sanitation planning frameworks of Sanitation 21, Household Centred Environmental Sanitation (HCES) and the sanitation system approach, which will be described below. Here, we describe the “Sanitation Cityscape” approach, the underpinning rationale of which is to consider the fate of faecal material from the total urban population, such that neglected populations and hidden sanitation pathways are not overlooked. We argue that this is key to planning for citywide sanitation service provision. The two-step Sanitation Cityscape analysis starts by mapping the sanitation pathways along which the total production of faecal material flows from creation to final disposal and/or reuse (treated or untreated). The second part of the analysis maps the institutional setting against the different decision-making domains of the city, taking into account the tenure profile of the target population.
This paper builds on earlier work that identified tenure status as a key determinant of household spending decisions on sanitation, and that considered the extent to which households will incur capital investment costs (such as building or upgrading a household latrine) or operating costs (for example, emptying latrine pits and septic tanks).(5) Incorporating this investment logic into the analytical framework assists policymakers and planners to target sanitation improvements in alignment with the incentives and drivers for householders’ investments.
II. Key Literature Review Findings
The following section presents an overview of the relevant discourse on housing, tenure arrangements, tenure security and their role in sanitation developments.
a. Land, housing and tenure arrangements
Informal settlements are the response to the gap between the cost of the cheapest “legal” accommodation and what large sections of the growing urban population can afford to pay.(6) With no available or affordable housing in the formal market, new urban residents rent, buy or squat on unoccupied informal land or become tenants (or sub-tenants) of existing dwellers. The urban poor take advantage of multiple layers of state, customary and informal land arrangements. While theoretically it can be useful to distinguish between “legal / illegal”, “informal / formal” and “tenant / landlord”, these labels often do not reflect the realities of housing and tenure arrangements in many countries (or indeed the way residents perceive their situation), which tend to fall somewhere between these extremes.(7) Current thinking applies the concept of a continuum of rights,(8) from people without any rights at one end to those with solid contracts held in the land registry at the other. This concept helps tenure to be understood as a social function rather than a phenomenon related to a specific location or dwelling. This mosaic of land and housing arrangements is central to decisions around investment in urban basic services and housing stock.
b. Tenure security, the tenure mix and investment decisions
Investment behaviours are inherently linked to tenure security.(9) Indeed this thesis is the cornerstone of the property rights debate, which deliberates on whether it is legal tenure (de jure) or simply the tenure arrangements in practice (de facto) that provide sufficient security for investment. Proponents of land titling argue that illegality discourages capital investment and that legal tenure is a prerequisite for investment.(10) Opponents suggest that it is fear of eviction that discourages investment.(11) Either way, security of tenure is key to breaking the poverty cycle as it is intrinsically linked, on multiple levels, to accessing basic urban services and investment.(12)
The numbers of owner-occupiers and tenants (or the “tenure mix”) can illuminate the lack of investment in slums.(13) Areas with high numbers of absentee landlords are highly likely to produce a compound lack of investment as little capital is reinvested into the housing stock or accrued through taxation. A further complication is that the tenure mix changes from settlement to settlement and over time. This is why urban upgrading projects that focus on infrastructure interventions alone do not work; consideration must be given to the tenure mix and to enhancing owner occupancy and infrastructure investment.(14)
c. Tenure, tenants and security in urban sanitation
How do the dimensions of tenure, tenants and tenure security relate to urban sanitation? While the literature is relatively limited, a few studies help illuminate this nexus. Tenure and home ownership are identified as key determinants of demand for sanitation, as fear of eviction discourages households from investing in good sanitation facilities(15) and the ability to access sanitation is significantly defined by where one lives.(16) Tenants have very little control over their dwelling infrastructure and are unlikely to make any long-term investments, such as in a household toilet.(17) They also tend to be more transient than owner-occupiers.(18) For most tenants, shared sanitation in one form or another tends to be the norm.(19) The sustainability and user acceptability of shared facilities are functions of its management, operation and maintenance, as well as how clearly the user group can be defined.(20)
An earlier analysis of sanitation in Dakar highlighted that tenant households, or those with lower levels of tenure security, are lower on the sanitation ladder(21) than owner-occupiers, who enjoy a higher level of tenure security. It also found that while tenants are unlikely to invest in capital infrastructure, they are willing to pay for operational sanitation services such as pit emptying.(22) This highlights a tenure-neutral, non-toilet-centric intervention opportunity for sanitation programmes, better suited to tenants and those with lower tenure security.
The Dakar study showed that where sanitation is on-plot and essentially self-built, it was de facto rather than de jure tenure security that was the necessary, and sufficient, precursor to household investment in sanitation infrastructure.(23) This study also highlighted that, in the absence of government service provision, where self-managed on-plot sanitation is the norm, the distinction between residents’ willingness to invest in sanitation infrastructure and their willingness to pay for sanitation services becomes highly relevant.(24)
d. Existing planning frameworks and approaches for urban sanitation
Urban sanitation planning is notoriously complex, as the sheer technical challenge of achieving improved sanitation(25) for large numbers of people is compounded by layers of social, behavioural, institutional, environmental and political factors. By way of context, urban sanitation systems can be broadly categorized as either physically networked systems (such as conventional sewerage) or sanitation service networks, where on-plot latrines, while not connected to a sewerage system, are the first component in a service chain comprising excreta capture and storage in a latrine pit or tank; emptying of the pit; transport of the contents; treatment (though not widely done); and reuse or final disposal. This chain of sanitation services is collectively known as faecal sludge management (FSM). This is the predominant sanitation system in the towns and cities of low- to middle-income countries.
A number of conceptual or planning frameworks have been developed in an attempt to untangle the complexities of urban sanitation. These can broadly be categorized as either “domain-based” or “sanitation system” approaches. Both are predicated on an understanding of the demand for sanitation, but one focuses on the decision makers at different levels, the other on the physical systems that decisions are made about.
Domain-based approaches
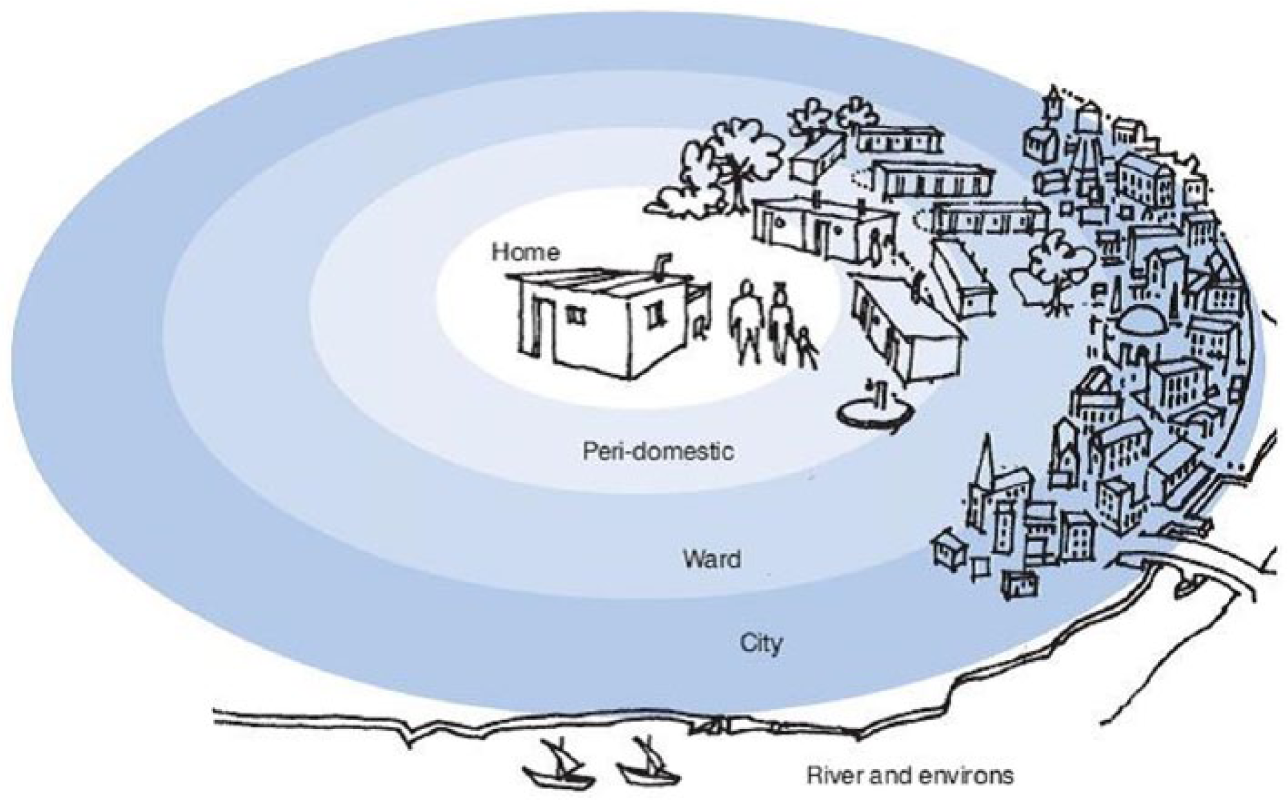
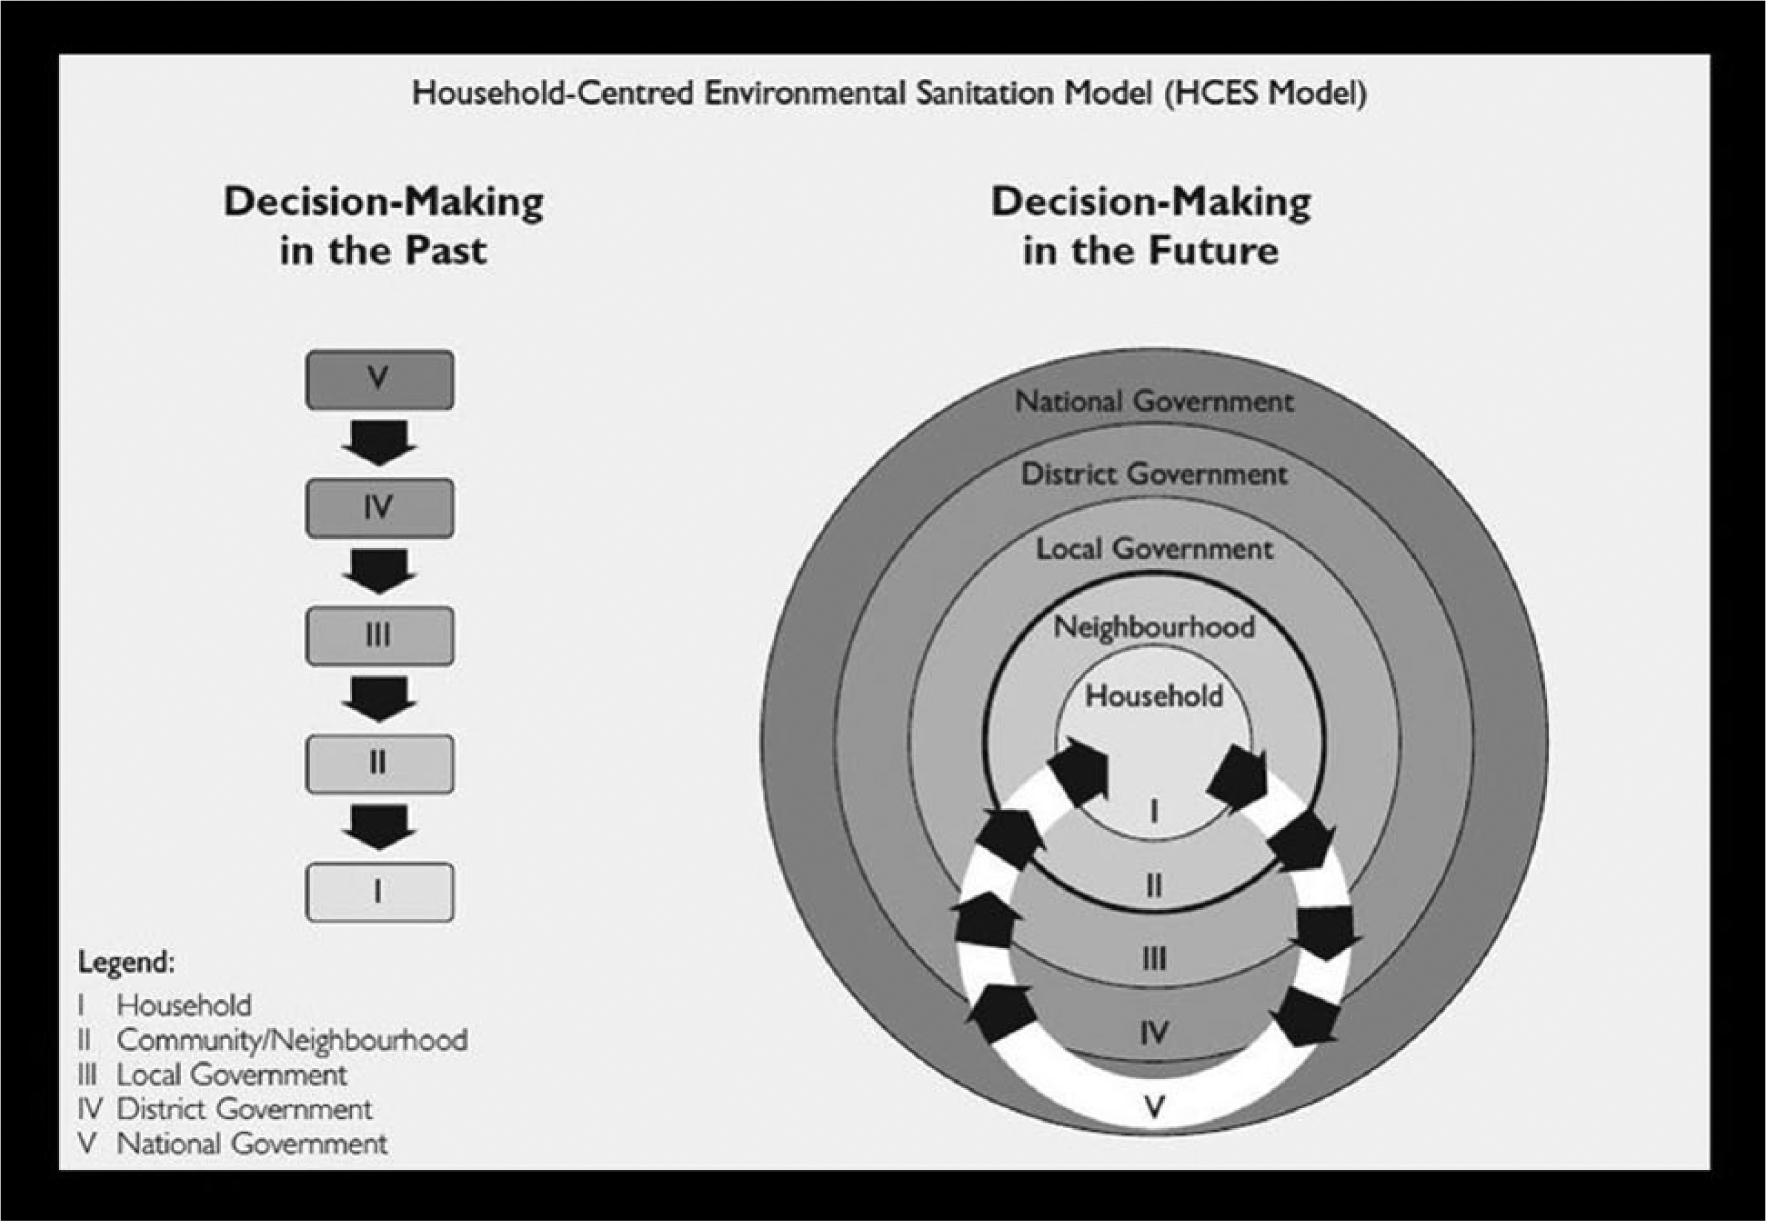
This approach tackles urban sanitation from the perspective of its institutional context and aims to provide decision support for more appropriate sanitation. The concept of “decision-making domains” is integral to the approach, which includes such strategic urban sanitation planning frameworks as Sanitation 21(26) and Household Centred Environmental Sanitation (HCES),(27) developed by the International Water Association (IWA) and Swiss Federal Institute of Aquatic Science and Technology (EAWAG) respectively. These divide the urban context into a series of concentric rings or decision-making domains (Figure 1A and Figure 1B).
Sanitation 21
HCES
Despite efforts of the framework’s advocates to incorporate these analytical principles more widely into sanitation planning,(28) in many low- and middle-income cities, its uptake in municipal sanitation planning has not been widespread. Sanitation remains a low political priority, where limited resources, lack of ownership and limited planning capabilities at both central and local government levels hamper sustained planning efforts.
This limitation is recognized by the Strategic Sanitation Approach (SSA), which considers both the domains of decision making and the chain of sanitation activities, but stresses the important role played by higher levels of government in creating incentives for local stakeholders to take effective action to improve sanitation.(29) These limitations of planning culture and capacity can make sanitation planning frameworks abstract and redundant in practice, illustrating the need for a more accessible approach to analyse and communicate urban sanitation information quickly and effectively.
The sanitation system approach
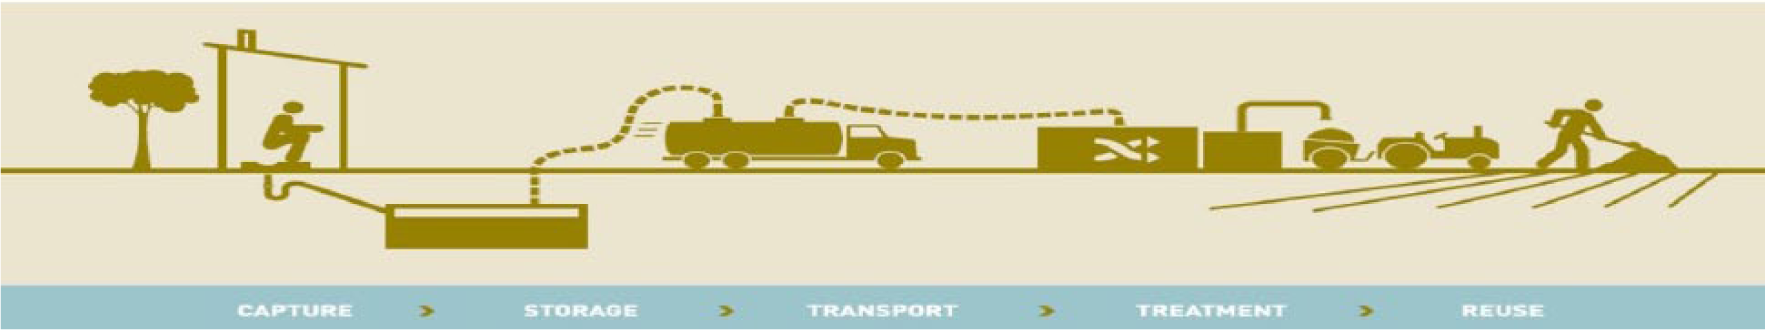
The sanitation system (or value chain) approach systematically breaks down the “system” of sanitation into its component parts: capture; emptying; storage; transport; treatment; and reuse (Figure 2).(30) This conceptual approach has, in recent years, become used widely as it identifies the components and realities of on-site and sludge management processes that are prevalent in low- and middle-income countries. Furthermore, it has been instrumental in highlighting the critical downstream elements of FSM and also fits the ecological sanitation perspective as greater attention is paid to excreta reuse. It has proved a practical mechanism to map how the multiple actors of urban sanitation markets interrelate.(31)
Sanitation value chain
While these frameworks go a long way to explain how urban sanitation works, insofar as they address the spectrum of institutional and financial issues and offer a good way of visualizing and analysing problems, they cannot explain why urban sanitation systems work the way they do. Given that a significant proportion of sanitation investments are “self-supply”, meaning private investments by individual households without state intervention,(32) the existing frameworks have not furthered our understanding of the drivers of household spending on sanitation. Their contribution to decision making is therefore limited in the extent to which it can guide targeted sanitation interventions that are inclusive of the entire urban population.
e. The problem of demand
There has been a slow change in the emphasis of sanitation programming from supply-led provision towards the more demand-led approach.(33) The latter has focused on generating household demand for better sanitation, followed by sanitation marketing that aims to match the supply of suitably priced latrine products to household budgets. Work on unlocking household demand has identified that comfort, privacy, safety, convenience, social status and cleanliness, rather than better health, are the prominent drivers that lead households to improve their sanitation.(34) Demand for downstream sanitation services such as emptying and adequate treatment has been largely neglected, not least because households have shown little concern about what happens to their pit contents once removed from their plots.(35) Given this, marketing approaches have focused on identifying a wide range of latrine types (and their supply chains) to align to a household’s aspirations and financial capacity.
Household financial capacity has been explored through willingness to pay (WTP) studies, which seek to quantify the economic value of a good to a person. The contingent valuation method (a survey-based tool to measure stated preference and WTP for various options) identifies household income, current expenditures and satisfaction level with current sanitation facilities as the principal determinants of WTP for a household toilet.(36) Contingent valuation assumes that people can be offered a range of levels of service and can indicate how much they would pay for each level. For sanitation, this method is rather limiting, as service levels are difficult to assess accurately; for example, is a pit latrine a lower level of service than a sewer in an area with poor water supply? Furthermore, poorly designed and implemented WTP surveys are responsible for inaccurate and unreliable data that provide misleading information for project feasibility decisions.(37) These approaches and tools to stimulate demand are essentially product-focused rather than service-focused and will not necessarily lead to approaches that are inclusive in respect of tenure status.(38)
III. Methodology
This paper is an outcome of an investigatory study in Dakar in 2008 and builds upon earlier work on tenure security and household investment decisions for urban sanitation.(39) It proposes a two-staged analytical approach to describing the sanitation situation from a citywide perspective. The models (Figures 4 and 6) were developed as conceptual and analytical tools for a PhD thesis.(40) The first stage maps the sanitation pathways of the distribution of faecal sludge and sewage flows, taking in effect the sanitation system approach. This tool originates from a graphical representation of urban small-scale sanitation providers(41) and was developed, for the purpose of this research, to quantify their faecal sludge load and distribution. The second stage of the analysis, taking the domain perspective, focuses upon the relationships and interfaces of sanitation stakeholders across the domains of the city. This domain model draws upon the strengths of existing sanitation frameworks and provides a format for a rapid institutional map. It became apparent during the fieldwork that the complementary effect of these two models provided a simple but comprehensive “Sanitation Cityscape”.
In this analysis, three domains describe the urban sanitation environment: D1 – the household domain; D2 – the sanitation service provision domain; and D3 – the city planning and urban management domain (Figure 3). Retaining a concentric structure ensures that the household remains a core development objective.(42) The tenure mix of the household domain is thus central to the overall framework. A noteworthy departure from the Sanitation 21 and HCES frameworks is that the “neighbourhood” domain is replaced with the sanitation service provider domain, essentially incorporating the linearity of the systems approach, as moving outwards in the concentric rings indicates travelling further down the sanitation system and becoming increasingly a public, rather than private, good.
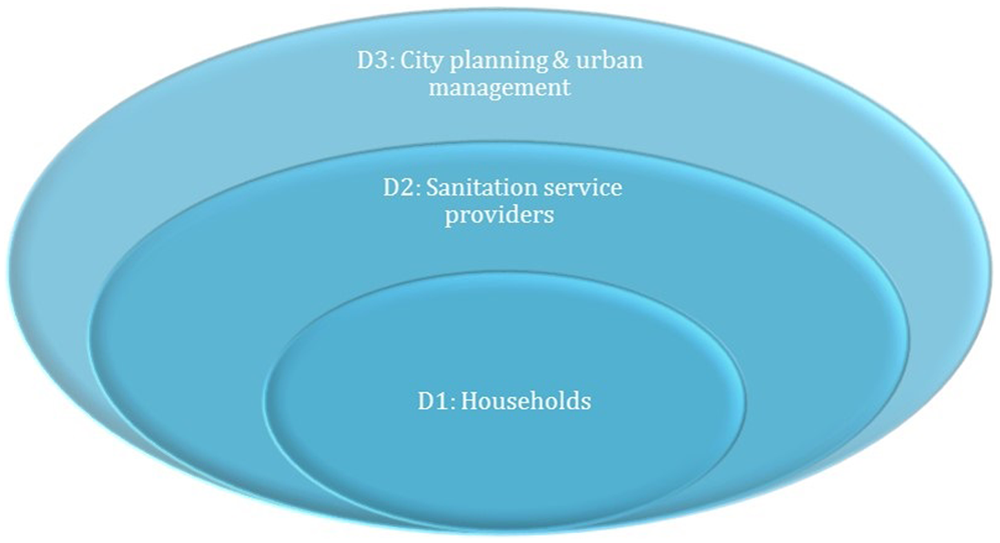
Decision-making domains of the Sanitation Cityscape
Dakar, Senegal, is used as a case study example to demonstrate how the Sanitation Cityscape analysis can help us understand the urban sanitation problem and provide a framework for future interventions.
In Dakar, 73 per cent of the 2.5 million residents rely on on-site sanitation systems, which, due to a high water table, need to be emptied on a regular basis. The faecal sludge market in Dakar is active and well documented. The tenure mix and living arrangements vary significantly from area to area. In Greater Dakar, informal and neo-customary land markets are widespread, meeting the needs of the growing urban population. Householders who own a dwelling (whether on formal or informal land) make up 41.8 per cent of Dakar’s population; tenants who pay rent for their dwelling (with or without contracts) are 52.9 per cent. An additional 4.3 per cent are free dwelling and 1 per cent are unregistered.(43)
Primary data were collected in Dakar using an administered household questionnaire survey and key informant interviews throughout May–September 2008. The survey of 363 households on 340 plots was conducted in Pikine, the largest of the four urban districts of Greater Dakar, across four types of settlements (informal, formal, regularized and traditional village). Data were collected on both a household and a plot basis to manage intra-plot inequities (for example between landlords and tenants).( 44 ) Key informants for interviews included representatives of the sanitation utility (ONAS), the small-scale sanitation service providers, the community and the municipal level of urban planning and development.( 45 ) These data sources span the three conceptual domains of the analytical framework (Figure 3).
IV. Applying the Theory: How the Sanitation Cityscape Helps Us Understand the Urban Sanitation Problem
The Sanitation Cityscape analysis builds upon existing urban sanitation principles to create a simple citywide management tool for planning, advocacy and tracking of change in sanitation developments. It applies the concepts of both the decision-making domains and sanitation systems to describe the urban context and provides a planning approach that is more sensitive to the investment logic of tenure status and security.
a. Part 1: mapping citywide sanitation pathways
The first stage of the Sanitation Cityscape analysis is a linear representation of how faecal sludge is managed, from household containment, via emptying and transport, to treatment and final disposal (Figure 4). Critically, the analysis starts with the total urban population. This is fundamental for citywide sanitation as it ensures that all the sanitation pathways are mapped (including “unimproved” and unhygienic), and all urban residents and their faecal waste are accounted for. The total citywide faecal matter can be an absolute figure calculated in terms of volume (total m3 per capita) or, in the absence of good data, attributed an overall value of one.(46) The data used to populate this model are primary data from the 2008 fieldwork(47) and secondary data sources.(48) For Dakar, an estimated 0.75 litres of faecal sludge are produced per capita per day,(49) equivalent to a daily total of 1,575 m3.(50)
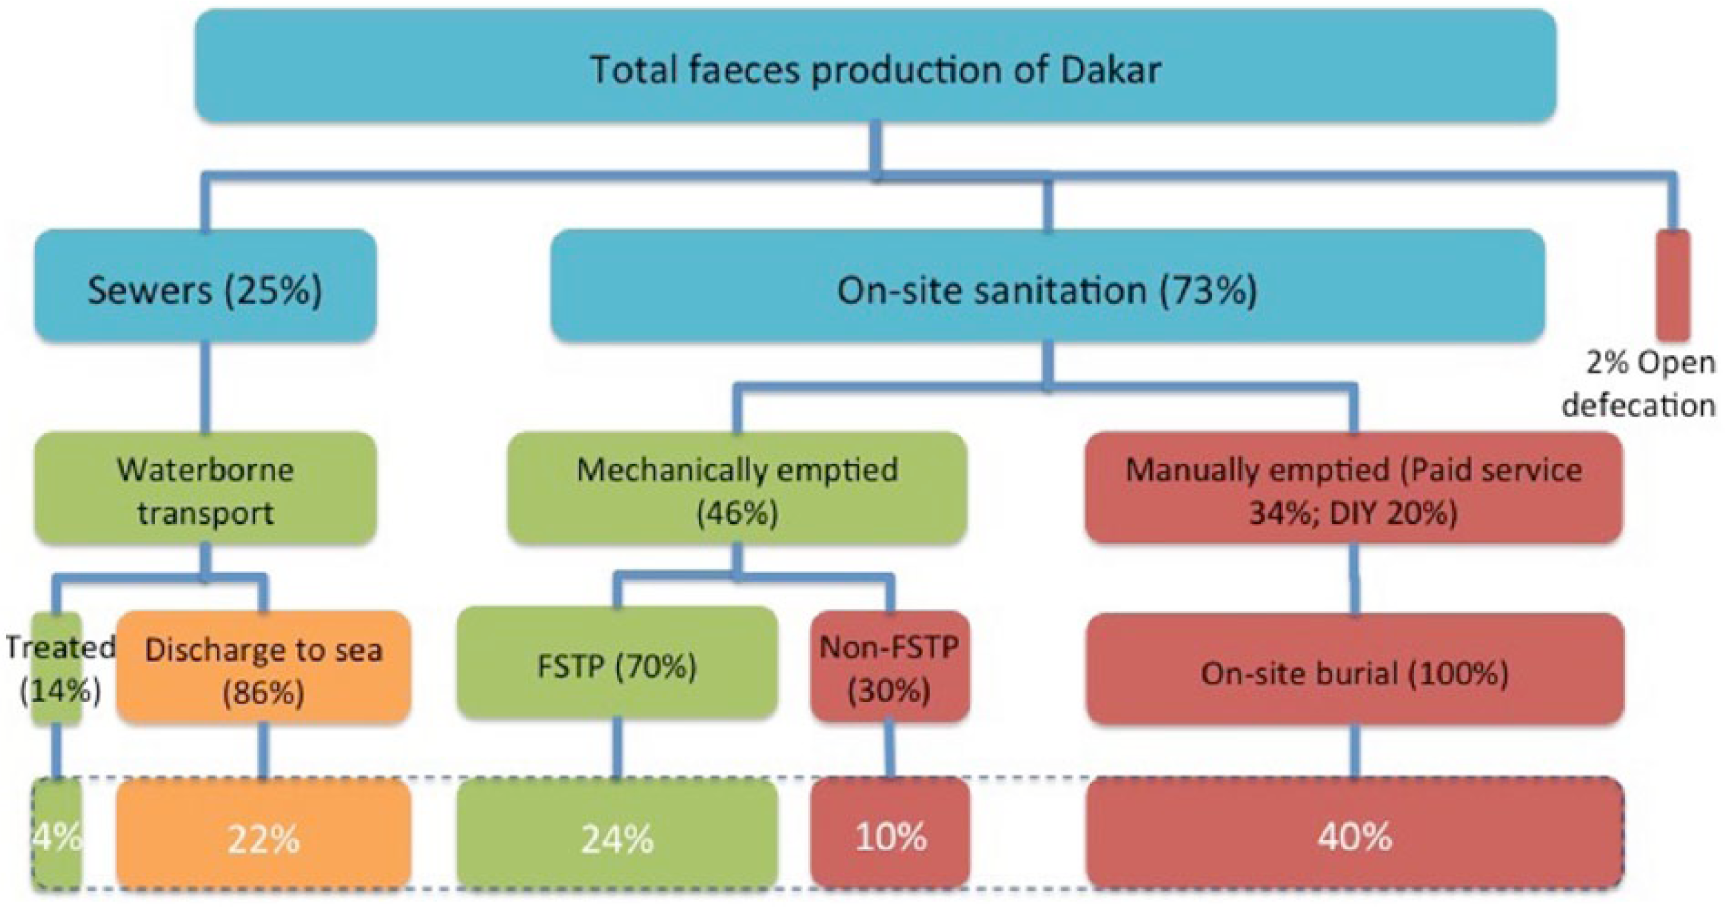
Sanitation pathways of Dakar
The second line of the sanitation pathway model (Figure 4) represents the “capture” component of the sanitation system. This can be broken down a number of ways depending on the quality of the data available. The model has three capture categories: sewered, on-site sanitation and open defecation.( 51 ) In Dakar, sewers serve approximately 25 per cent of the urban population, 73 per cent use on-site systems and 2 per cent practise open defecation.( 52 ) If the data are available, this stage can be further disaggregated to capture more detail regarding storage type.( 53 ) The pathways in the model are sized in proportion to their prevalence.
The third line of the sanitation pathway model represents the transport component of the sanitation system. In the Dakar case, this would be sewers (for the minority who are connected) or mechanical or manual pit emptying vehicles and tools.(54) Again, these pathways are sized in proportion to their prevalence and are also colour coded for hygiene level. The penultimate line relates to the treatment/disposal of the waste. The model can be expanded to include another layer, the reuse of faecal matter, for example in agricultural activities. This level is not included here, as it was beyond the scope of the current study.
The final line of the model essentially provides a dashboard of the sanitation “status” of any city. The size of the bar indicates the prominence of that sanitation pathway and unhygienic pathways are indicated in red. From the example, it is evident that even Dakar, which is considered progressive in terms of urban sanitation and FSM, safely contains only half of its excreta. Using the figures outlined in Figure 4, approximately 1,000 m3 of faecal matter (approximately half an Olympic swimming pool) are not safely contained per day.
Mapping the sanitation pathways in this way illustrates the distribution of faecal sludge and sewage flows in Dakar. In the first instance, it highlights the prevalence of on-site sanitation compared to sewered systems; this is an important advocacy point as interventions in FSM and on-site sanitation are often considered, institutionally, to sit outside the long-term national sanitation strategy. A second noteworthy point in the context of Dakar, where there have been efforts to strengthen the FSM market,(55) is that manual emptying remains a significant problem. The common practice in Dakar is to bury faecal sludge on-site, so these values also indicate the volumes being buried in the immediate environment. For Dakar today, very few interventions specifically consider alternatives to entice households away from manual emptying. To improve the overall sanitation status of Dakar, viable technical alternatives and behavioural incentives are needed to reduce the level of manual emptying.
Using sequential sanitation pathway models over time can provide an insight into how sanitation interventions have changed the overall citywide sanitation landscape. For example, comparison of Figures 4 and 5 tracks the sanitation developments in Dakar since 2008, when three faecal sludge treatment plants (FSTPs – in Cambérène, Rufisque and Yarakh) were commissioned. This was part of the Programme d’amélioration de l’assainissement des quartiers périurbains de Dakar (PAQPUD – Programme to improve sanitation in peri-urban areas of Dakar) project to provide sanitation services to the poor peri-urban areas of Dakar, receiving 300–500 m3 of sludge daily and operating 09:00–16:00 five days a week.(56) The difference in the bottom line figures of Figures 4 and 5 demonstrates the significant impact these plants had upon Dakar’s Sanitation Cityscape, highlighting the achievement of the PAQPUD project in working with the pit emptiers association to reduce illegal dumping.(57)
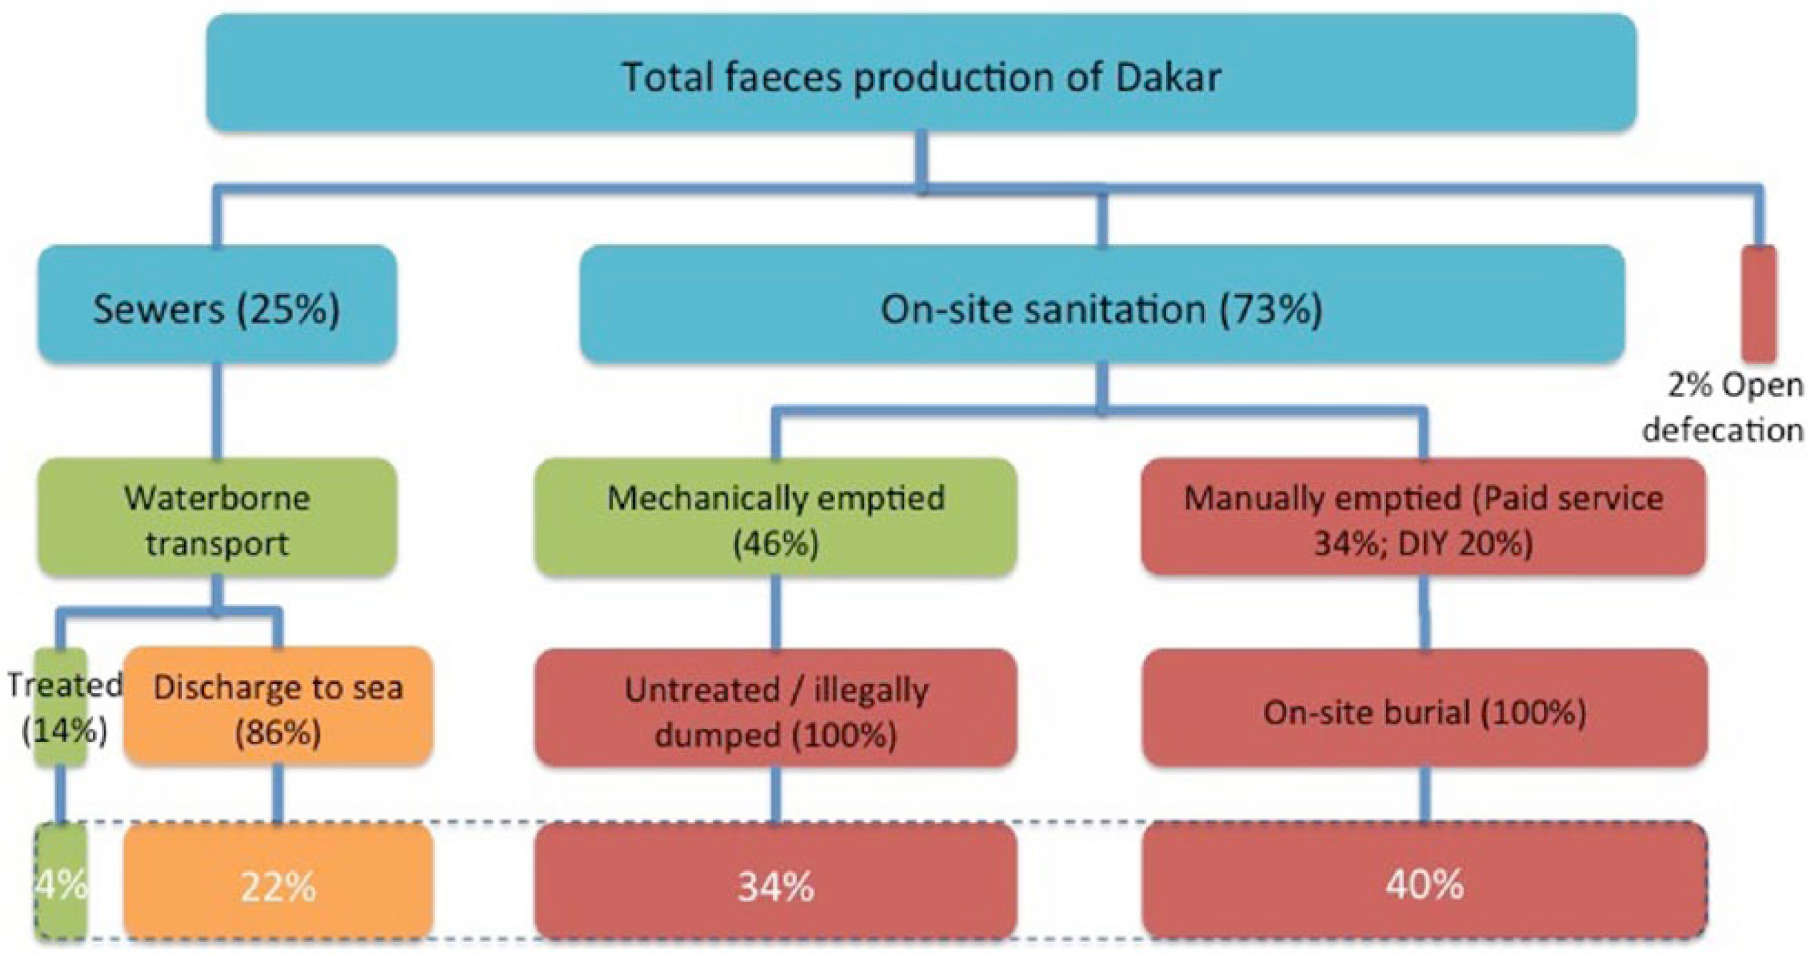
Pre-2008 sanitation pathways of Dakar’s Sanitation Cityscape before FSTPs were commissioned as part of the PAQPUD
In an attempt to elevate open defecation and unimproved facilities to improved sanitation, many sanitation improvement strategies, including sanitation marketing, target the building of new latrines. In areas where levels of open defecation or unimproved sanitation facilities are high, this is a very relevant strategy. In Dakar, which already enjoys a relatively high level of improved sanitation coverage, the sanitation pathway model clearly illustrates the greater importance of attention further downstream, as with the FSTPs.
b. Part 2: taking a domain view
The second element of the Sanitation Cityscape analysis draws upon the concept of decision-making domains, mapping the institutional relationships against the different domains of urban sanitation. This can help highlight how, and where, urban sanitation actors interface. Figure 6 shows these relationships among households (D1), sanitation service providers (D2), and city planning and urban management (D3).
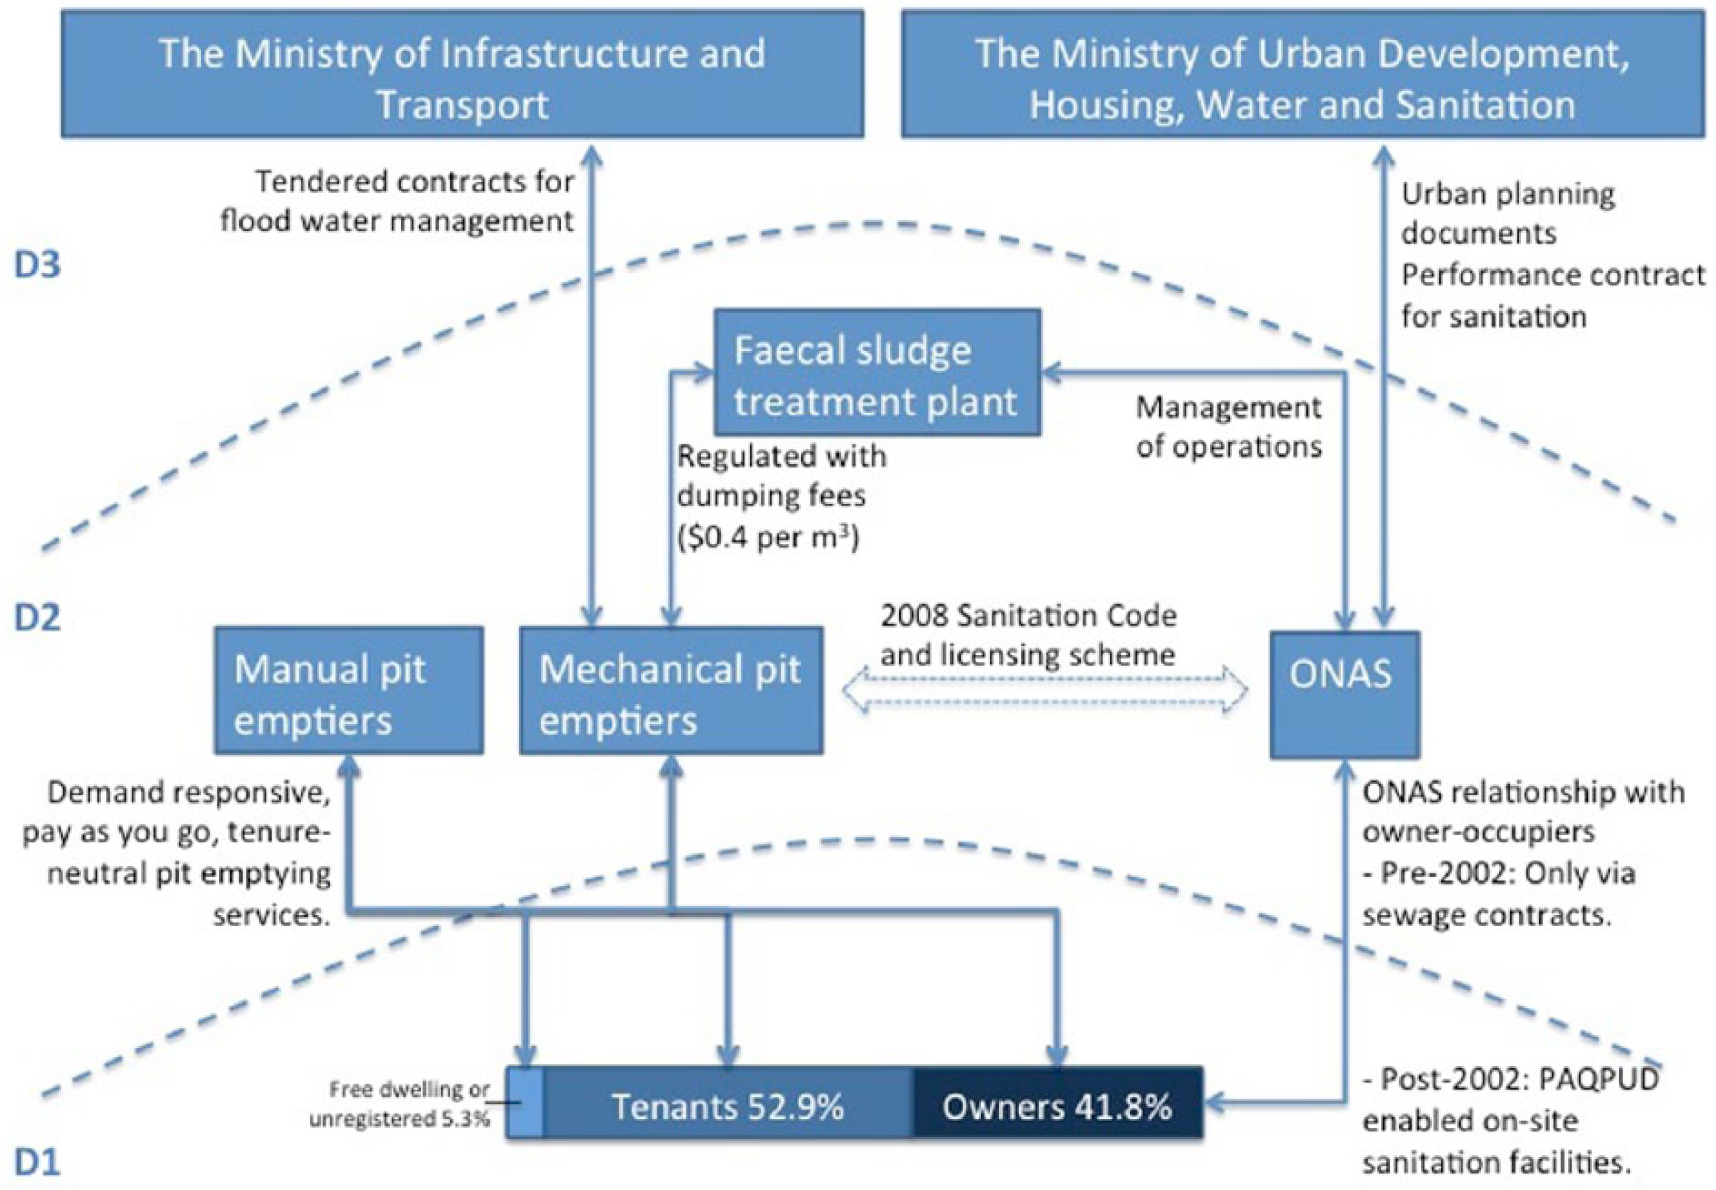
Interfaces and relationships among the households (D1), sanitation service providers (D2) and city planners (D3) in Dakar’s Sanitation Cityscape
First we focus on the household domain (D1) and its tenure profile. The ratio of tenants to owner-occupiers is a good indicator of whether households are likely to be willing to invest in sanitation infrastructure or simply to pay for operational sanitation services. A higher proportion of tenants would suggest a lower willingness to invest in infrastructure but this might not preclude a willingness to pay for sanitation services.( 58 )
Next, the relationships between the households (D1) and service providers (D2) are mapped. A number of sanitation service providers (formal and informal) will have been identified by the sanitation pathways analysis. In Dakar, as is common in many low-income cities, the most common “sanitation service provider” is an independent small-scale operator contracted on a flexible, demand-responsive, pay-per-use basis. The nature of this relationship is in stark contrast to that with the utility through a formal service contract and a physical connection to the sewerage network. Both of these relationships are mapped onto the domain model. For many utilities (as in Dakar prior to the PAQPUD programme), utility-managed sanitation systems equal networked sewerage systems. Where this is the case, it precludes the vast majority of residents from receiving a utility-managed sanitation service. In contrast, households can access the private pit emptying services easily, whether they own or rent their dwelling. In the Dakar example, the FSTP is a critical interface between the mechanical pit emptiers and the utility (Figure 6), acting as not only a physical meeting point but a key mechanism connecting an often informal, but critical, sanitation service provider to the utility and municipal planning. The final stage of the domain analysis maps the relationships and boundaries between service providers (D2) and government (D3), where in Dakar, the utility ONAS is governed by its approved urban master plan and service performance contracts.
V. Discussion
We suggest that the key to planning citywide sanitation service provision is to consider the fate of faecal material from the total population, thus ensuring currently neglected populations and sanitation pathways are not overlooked. Mapping the sanitation pathways is an extremely valuable analysis in that it gives a rapid overview of the sanitation status that is not overly sensitive to the granularity of the data; relatively high-level data can be sufficient to provide an informative citywide overview. Missing data can be gathered on a more targeted basis. The “invisible” pathways of sanitation (often overlooked by urban planners) are revealed and the true state of the city’s sanitation becomes apparent. This is a strong advocacy tool in a context where on-site sanitation and FSM often receive little municipal interest. Mapping the sanitation pathways also indicates where potential interventions could have maximum impact. Furthermore, a sequence of analyses can track interventions and their impact over time. While the pathway model is an accessible and easy to use tool, it has its limitations; it fails to show why certain pathways are more prevalent and what the institutional environment is that frames these activities.
The second analytical model, the domain view, addresses these gaps by mapping the relationships and interfaces of urban sanitation stakeholders (both formal and informal) against the key urban sanitation domains. This offers some insight into why the urban sanitation landscape is the way it is. Placing the tenure mix of the households at the core (D1) helps us locate the incentives behind households’ sanitation spending as a function of their tenure status. Moving towards the middle and outer domains helps to identify the interfaces between formal and informal service providers that act as critical gateways to providing services to a wider urban population. More important, it identifies poor or nonexistent links between urban sanitation stakeholders. Most commonly, where FSM services are managed entirely by the private sector (both formal and informal), there are few interfaces between the utility and the pit emptiers; their operations fall outside the scope of utility service provision. When these links are missing, a large part of the de facto sanitation service providers (D2) and the urban population (D1) remains “invisible” to urban planners (D3). By mapping these relationships, and the key interfaces needed to reinforce them, these missing links become apparent.
Senegal is an interesting case, as it has taken a number of policy measures that remove barriers to service provision to the low-income population, including the following:
In 1991 regulations were relaxed, allowing services to be delivered to areas without legal title.(59)
In 2002, the PAQPUD programme, an innovative strategy with a catalogue of grey water and excreta disposal options, was implemented to improve sanitation for low-income households in the peri-urban areas of Greater Dakar. Participant households were required to invest but capital costs were subsidized up to 75 per cent.
A rapprochement between the utility and the informal pit emptiers was part of the PAQPUD’s objective to develop the faecal sludge treatment sites in Greater Dakar, with a dramatic increase in regulated dumping and treatment of faecal sludge in Greater Dakar.(60) This has been formalized in the revised legal framework and through ongoing partnerships for improvement of the FSM market in Dakar.
With these additional interfaces between sanitation service providers and households, the national utility has been able to deliver sanitation services to a wider urban population. Figure 7 describes how these changes respond to household tenure issues.
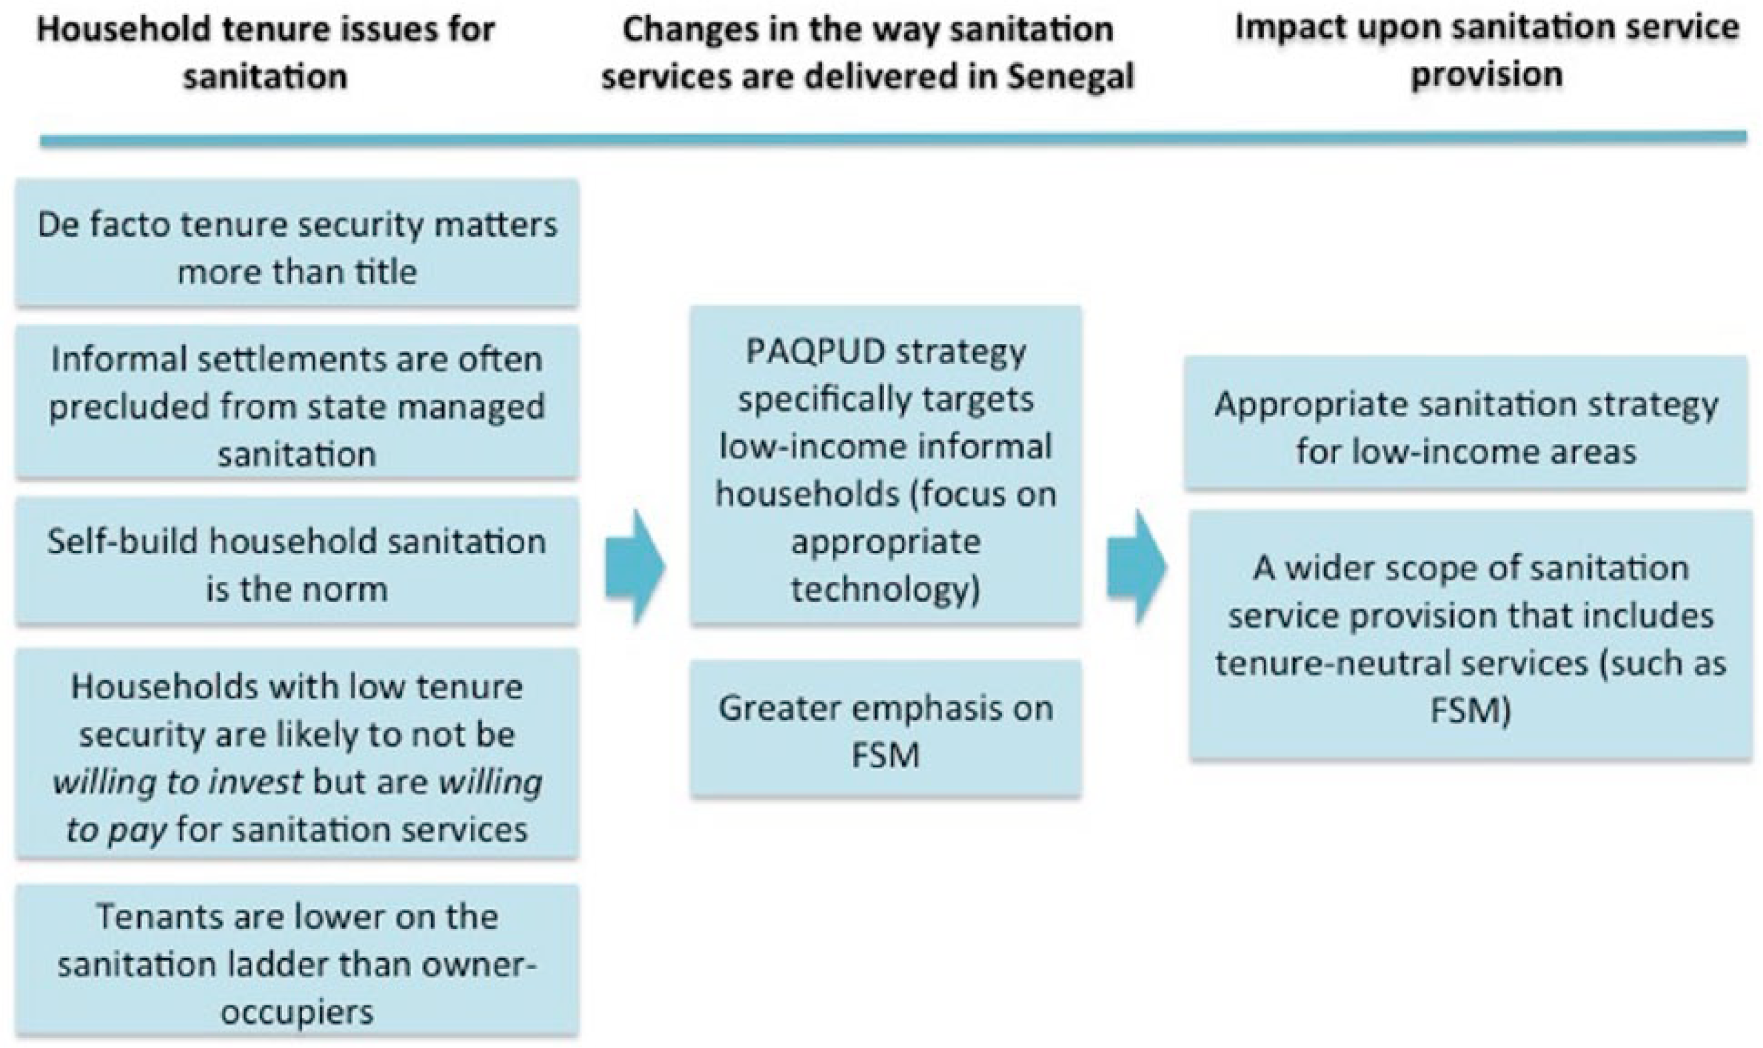
Household tenure issues for sanitation and their impact on sanitation service provision in Senegal
Marrying the two dimensions of the Sanitation Cityscape highlights where sanitation interventions can be best targeted for maximum impact. The ever-changing nature of the urban demographic landscape makes planning for sanitation development difficult. By breaking down the various sanitation pathways and relationships, the Sanitation Cityscape models help urban planners to identify which interventions, and at what stage of the sanitation value chain, are likely to have the most overall impact on improved citywide management.
Access to sanitation facilities in Dakar is high, implying that the focus should remain on FSM services, particularly on reducing manual emptying and improving the volume of faecal sludge that is collected and treated. The strengths of the model lie in the easy identification of critical problems and the range of potential target interventions. Incorporating the tenure dimension allows the analysis to be sensitive to the investment logic of householders. With this understanding, the Sanitation Cityscape may potentially provide a cheap, pragmatic alternative to the costly and sensitive WTP studies; it is a robust tool, not overly sensitive to the quality of data, where areas of missing or incomplete data can be easily identified to guide deeper analysis. It concurs with earlier analysis that sanitation marketing approaches are likely to be ineffective in tenant-only households.(61)
There are naturally limitations to this case study and the model itself. The survey data were collected in Pikine, the largest of the four districts of Greater Dakar. While not statistically representative of the Greater Dakar region, it provides a picture of the typical sanitation and housing arrangements of Greater Dakar, including sewered and non-sewered plots. To some extent, we are generalizing these findings; however, it is important to note that mapping the faecal sludge pathways does not require mapping absolute quantities of faecal sludge through the various levels of the pathways model. Indeed, given the wide variation of quality and behaviours relating to self-build on-site sanitation facilities, sludge accumulation and decomposition rates are likely to be very difficult to estimate accurately. But using data from a relatively small household survey,(62) interviews with local experts and estimates from other grey literature, it is relatively easy to estimate the proportions of faecal sludge that are safely managed, or not, at each stage of the sanitation system, thus providing a good citywide overview. At key stages of the sanitation system, faecal sludge volumes are easily identified – what is collected by FSM vehicles and deposited at known treatment sites, for instance. These can provide a secondary level of detail for deeper analysis.
The Sanitation Cityscape itself cannot solve urban sanitation problems; however, it provides an accessible and easy analysis of the sanitation status of any given city. This facilitates syndication and validation with local experts and provides a comparable model for peer-to-peer learning between different cities on a citywide scale.
VI. Conclusions and Practical Implications
The Sanitation Cityscape analytical framework has some important strengths as an approach to improving urban sanitation:
The paper suggests that the key to citywide sanitation is to target interventions appropriate to the city’s tenure mix, including non-networked systems and sanitation services (such as pit emptying) that are tenure neutral. The Sanitation Cityscape offers a framework to policymakers, planners and programme implementers for narrowing and focusing the decision-making process of citywide sanitation service provision. It acts as a simple but effective tool to navigate the urban sanitation landscape, moving beyond rural sanitation approaches that focus principally on additional numbers of latrines. It does not offer an algorithm-type approach leading to a highly specific solution; this is neither practical nor desirable. By considering sanitation as a range of services rather than a range of products, the Sanitation Cityscape approach is able to highlight where the main problems area lie, along with how, and where, to target a range of interventions to achieve maximum overall impact.
Footnotes
Acknowledgements
The authors would like to thank Andrew Peal for his constructive and helpful feedback.
1.
UN Department of Economic and Social Affairs, Population Division (2014), World Urbanization Prospects: The 2014 Revision, Highlights, United Nations, New York.
2.
3.
4.
Wright, A (1997), Towards a Strategic Sanitation Approach: Improving the Sustainability of Urban Sanitation in Developing Countries, UNDP–World Bank Water and Sanitation Program, Washington, DC; also Cotton, A and W Tayler (2000), Services for the Urban Poor, Volume 3 Action Planning, Water, Engineering and Development Centre, Loughborough University, Loughborough; and Tayler, K, J Parkinson and J Colin (2003), Urban Sanitation: A Guide to Strategic Planning, ITDG Publishing, London.
5.
Scott, P, A Cotton and M Sohail (2013), “Tenure security and household investment decisions for urban sanitation: the case of Dakar, Senegal”, Habitat International Vol 40, pages 58–64.
6.
Satterthwaite, D (2009), “Getting land for housing; what strategies work for low-income groups?”, Environment and Urbanization Vol 21, No 2, pages 299–307.
7.
Kumar, S (2001), Social Relations, Rental Housing Markets & the Poor in Urban India, Department of Social Policy, London School of Economics & Political Science, London; also Durand-Lasserve, A and L Royston (editors) (2002), Holding Their Ground: Secure Land Tenure for the Urban Poor in Developing Countries, Earthscan, London.
8.
Bazoglu, N, R Sietchiping, G Mboup and C Augustinus (2011), Monitoring Security of Tenure in Cities: People, Land and Policies, United Nations Human Settlements Programme (UN-Habitat), Nairobi.
9.
North, D (1990), Institutions, Institutional Change and Economic Performance, Cambridge University Press, Cambridge; also Ostrom, E (1990), Governing the Commons: the evolution of institutions for collective action, Cambridge University Press, Cambridge; and Payne, G, A Durand-Lasserve and C Rakodi (2007), “Social and economic impacts of land titling programmes in urban and peri-urban areas: a review of the literature”, Proceedings from World Bank Urban Research Symposium 2007, Washington, DC.
10.
De Soto, H (1989), The Other Path: the invisible revolution in the third world, HarperCollins, New York; also De Soto, H (2000), The Mystery of Capital: Why Capitalism Triumphs in the West and Fails Everywhere Else, Basic Books, New York.
11.
See reference 9, Payne et al. (2007); also Mooya, M and C Cloete (2010), “Property rights, real estate markets and poverty alleviation in Namibia’s urban low income settlements”, Habitat International Vol 34, No 4, pages 436–445.
13.
Gulyani, S and D Talukdar (2008), “Slum Real Estate: The Low-Quality High-Price Puzzle in Nairobi’s Slum Rental Market and Its Implications for Theory and Practice”, World Development Vol 36, No 10, pages 1916–1937.
14.
See reference 13.
15.
Mulenga, M and B Fawcett (2003), “Impediments to the Implementation of the Demand-Responsive Approach (DRA) Methodology in Urban Sanitation Programmes in Zambia and South Africa”, Proceedings of the Alternative Water Forum 2003, Bradford, available at http://pubs.iied.org/G02221.html; also Mulenga, M, G Manase and B Fawcett (2004), Building Links for Improved Sanitation in Poor Urban Settlements - Recommendations From Research In Southern Africa, Institute of Irrigation and Development Studies, Southampton.
16.
Joshi, D, B Fawcett and F Mannan (2011), “Health, hygiene and appropriate sanitation: experiences and perceptions of the urban poor”, Environment and Urbanization Vol 23, No 1, pages 91–111.
17.
Jenkins, M and B Scott (2007), “Behavioural indicators of household decision-making and demand for sanitation and potential gains from social marketing in Ghana”, Social Science & Medicine Vol 64, No 12, pages 2427–2442.
18.
See reference 5; also Günther, I, A Horst, C Lüthi, H Mosler, C Niwagaba and I Tumwebaze (2011), Where do Kampala’s poor “go”?: Urban sanitation conditions in Kampala’s low-income areas, Research for Policy 1, ETH Zurich, available at ![]() .
.
19.
See reference 5; also see reference 18, Günther et al. (2011); and Wegelin-Schuringa, M and T Kodo (1997), “Tenancy and sanitation provision in informal settlements in Nairobi: revisiting the public latrine option”, Environment and Urbanization Vol 9, No 2, pages 181–190.
20.
See reference 19, Wegelin-Schuringa and Kodo (1997); also Burra, S, S Patel and T Kerr (2003), “Community-designed, built and managed toilet blocks in Indian cities”, Environment and Urbanization Vol 15, No 2, pages 11–32; and Mazeau, A, I Tumwebaze, C Lüthi and K Sansom (2013), “Inclusion of shared sanitation in urban sanitation coverage? Evidence from Ghana and Uganda”, Waterlines Vol 32, No 4, pages 334–348.
21.
The “sanitation ladder” is used in the WHO / UNICEF Joint Monitoring Programme for Water Supply and Sanitation (JMP) reporting to categorize sanitation coverage.
22.
See reference 5.
23.
See reference 5.
24.
See reference 5.
25.
Improved sanitation is defined by the JMP as a sanitation facility that hygienically separates human excreta from human contact and is the top rung of the “sanitation ladder”.
26.
27.
Kalbermatten, J M, R Middleton and R Schertenleib (1999), Household Centred Environmental Sanitation, Swiss Federal Institute for Environmental Science and Technology (EAWAG), Deubendorf.
28.
Several locations have been used to test and improve the HCES concept in an iterative process of testing, analysis and revision. The documentation of this process offers a useful insight into the unique challenges of urban sanitation planning. See Lüthi, C, A Morel, P Kohler and E Tilley (2009), A People’s Choice First. A 4-Country Comparative Validation of the HCES Planning Approach for Environmental Sanitation, National Centre of Competence in Research North-South, Bern.
30.
It can also be used to describe sewered sanitation where the storage stage is simply bypassed.
31.
Collignon, B and M Vézina (2000), Independent water and sanitation providers in Africa Cities: full report of a ten-country study, UNDP–World Bank Water and Sanitation Program, Washington, DC.
32.
Evans, B, G Hutton and L Haller (2004), Closing the Sanitation Gap – the Case for Better Public Funding of Sanitation and Hygiene, Background paper for the Round Table on Sustainable Development, 9–10 March, OECD, Paris; Robinson (2009) estimates that in Lao PDR between 2000 and 2008 80–90 per cent of the rural sanitation gains were a result of self-supply: Robinson, A (2009), Review of the National Strategy for the Rural Water Supply and Environmental Health Sector, Lao PDR Strategy Update: Review, Process Design, and Vision, Technical Guidance to UNICEF and the National Centre for Environmental Health and Water Supply (Nam Saat), Ministry of Public Health, Lao People’s Democratic Republic.
33.
Cairncross, S (1992), Sanitation and Water Supply: Practical Lessons from the Decade, World Bank, Washington, DC.
34.
Jenkins, M and V Curtis (2005), “Achieving the ‘good life’: Why some people want latrines in rural Benin”, Social Science & Medicine Vol 61, No 11, pages 2446–2459; also Jenkins, M and S Sugden (2006), Rethinking Sanitation – Lessons and Innovation for Sustainability and Success in the New Millennium, Human Development Report, United Nations Development Programme, New York.
35.
Cotton, A and D Saywell (1998), On-plot sanitation in low-income urban communities: Guidelines for selection, Water, Engineering and Development Centre, Loughborough.
36.
Whittington, D, D T Lauria, A M Wright, K Choe, J A Hughes and V Swarna (1993), “Household demand for improved sanitation in Kumasi, Ghana: A contingent valuation”, Water Resources Research Vol 29, No 6, pages 1539–1560.
37.
Whittington, D, S K Pattanayak, J Yang and B Kumar (2002), Do Households Want Privatized Municipal Water Services? Evidence from Kathmandu, Nepal, Economy and Environment Program for Southeast Asia special paper / International Development Research Centre, Center for Regulatory Economics and Policy Research, North Carolina.
38.
See reference 5.
39.
See reference 5.
40.
Scott, P (2011), Unbundling tenure issues for urban sanitation development, PhD thesis, Water, Engineering and Development Centre, Loughborough.
41.
See reference 31.
42.
Chambers, R (1997), Whose Reality Counts? Putting the First Last, Intermediate Technology Publications, London.
43.
Precht, R (2003), La Nouvelle Coutume Urbaine Evolution Comparée des Filières Coutumière de la Gestion Foncière Urbaine Dans les Pays D’Afrique Sub-saharienne: Le Cas de Dakar, Sénégal, unpublished report for the research project “La nouvelle coutume urbaine: évolution comparée des filières coutumières de la gestion foncière urbaine dans les pays d’Afrique subSaharienne”, which is part of the Programme de Recherche Urbaine pour le Développement (PRUD), funded by the French Ministry of Foreign Affairs and ISTED, with further funding for this particular project from DFID; also ![]() , Recensement Général de la Population et de l’Habitat, de l’Agriculture et de l’Elevage, Ministère de l’Economie, des Finances et du Plan, Dakar.
, Recensement Général de la Population et de l’Habitat, de l’Agriculture et de l’Elevage, Ministère de l’Economie, des Finances et du Plan, Dakar.
44.
Beall, J and N Kanji (1999), Households, Livelihoods and Urban Poverty, Urban Governance, Poverty and Partnership, Theme Paper 3, University of Birmingham, Birmingham.
46.
Care should be taken with the units (volumes and percentages) at different levels of the sanitation pathways as the margin of error in volume estimations could be significant at certain levels. For example, decomposition rates of stored faecal sludge are subject to many variables that are extremely difficult to assess and hence this may not be a useful indicator. On the other hand, emptying and transport volumes can be assessed and analysed more easily.
47.
See reference 40.
48.
Hoang-Gia, L, A D Thiaw, C S Toure, B Ndir, A Toure and C Thiombane (2004), Alimentation en eau potable et assainissement. Elaboration d’un document de stratégie pour la réalisation à l’horizon 2015 des objectifs du millénaire pour le développement, Volume 3: Sous-Programme “Urbain”, Projet Eau à Long Terme, Dakar; also Tounkara, A (2007), Nitrification of faecal sludge liquor using pilot scale intermittent sand filters in Dakar, Senegal, MSc dissertation, UNESCO-IHE Institute for Water Education, available at www2.gtz.de/Dokumente/oe44/ecosan/en-nitrification-of-faecal-sludge-2007.pdf. ![]() figures for faecal sludge volume are relatively high compared to other cities as the sludge in Dakar has a high proportion of water.
figures for faecal sludge volume are relatively high compared to other cities as the sludge in Dakar has a high proportion of water.
50.
Mbéguéré, M, J B Gning, P H Dodane and D Koné (2010), “Socio-economic profile and profitability of faecal sludge emptying companies”, Resources, Conservation and Recycling Vol 54, No 12, pages 1288–1295.
51.
This case study does not take into account several pockets of small-diameter sewerage systems that target pockets of the Greater Dakar urban population. At the time of the research few of these small-diameter systems were operational and as the population they served at the time was negligible, they were omitted from the analysis. See Norman, G (2011), An Evaluation of the Appropriateness of Piped Sewerage for African Cities, PhD thesis, University Of Surrey, Surrey for data on small-diameter systems at the time of the research.
53.
Note that where the majority of sanitation facilities are self-built and may not conform to building requirements, excessive detail regarding technology type can be meaningless; a poorly built and badly functioning septic tank may be no more hygienic than a simple pit. Therefore, at this stage it is recommended to identify where storage solutions are either “improved” or “unimproved” according to the JMP definitions; see reference 3.
54.
If the information is available, manual emptying can be further disaggregated into paid emptying services or emptying done by the householders themselves.
55.
Koné, D, M Strauss and D Saywell (2006), “Towards an Improved Faecal Sludge Management (FSM)”, Proceedings of the 1st International Symposium and Workshop on Faecal Sludge Management (FSM) Policy, Swiss Federal Institute for Environmental Science and Technology (EAWAG), Deubendorf; also ONAS (2013), “Program for the Structuring of the Fecal Sludge Management Market for the Benefit of Poor Households in Dakar”, Progress report, available at ![]() .
.
56.
See reference 50.
58.
See reference 5.
59.
In practice however this had little impact upon sanitation and was more relevant to the extension of the water and electricity networks, but was an enabling precursor to later developments.
61.
See reference 17.
63.
See reference 5.