
Abstract
The Millennium Development Goals call for a 50 per cent reduction in the proportion of people without sustainable access to safe drinking water and sanitation. Provision of these services by city authorities is often absent in slum(1) settlements in developing countries as these settlements are classified as illegal by city authorities. A field survey was conducted in two urban slums in the Asawase constituency of Kumasi, Ghana to ascertain the extent of “improved” water and sanitation coverage as defined by the WHO/UNICEF Joint Monitoring Programme. The study revealed adequate levels of improved water coverage, but both communities had extremely low coverage for improved sanitation (toilet) facilities within the households and most people depended on a very inadequate number of poorly maintained public toilets. Waste management practices in the two communities were also very poor. Findings from this study can be used by city authorities in planning effective sanitation intervention strategies for the communities.
I. Introduction
Providing safe drinking water and adequate sanitation services to all people is one of the great development challenges of the twenty-first century.(2) A number of factors have constrained progress towards the realization of the Millennium Development Goal (MDG) 7, which calls on countries to “Halve, by 2015, the proportion of people without sustainable access to safe drinking water and basic sanitation.”(3) High population growth and rapid urbanization, along with the low priority given to water and sanitation by many donors and recipient governments, contribute to the situation.(4) According to WHO and UNICEF, 2.6 billion people still have no improved sanitation facilities and around 884 million people still rely on unimproved drinking water supplies.(5) Improved water supply sources are defined to include house connections, public standpipes, boreholes with hand pumps, protected dug wells, protected springs and rainwater collection. Improved sanitation means facilities that protect users from contact with faeces and that are not shared with other households.(6)
It has been observed for some years that increases in the urban population of middle- and low-income countries are not matched with corresponding capacity and resources to expand public provision of basic services.(7) The urban poor in slums and squatter settlements, neglected by city authorities as a result of their illegal status, are generally those who suffer most from the lack of these services.(8) This neglect concentrates the people and their waste in unfriendly environments(9) and seriously compromises their health.(10)
Urban growth in Ghana, as in many countries, is characterized by unplanned settlements – where municipal authorities have been unable to provide adequate sanitation and water supply alongside this development.(11) In 2010, the number of people living in slums in Ghanaian cities was estimated to be 5.5 million, with a growth rate of 1.8 per cent per annum.(12) The presence of slum areas is especially pronounced in Accra, Sekondi-Takoradi, Tema and Kumasi.(13)
This paper presents the findings of a field study conducted to ascertain the extent of improved water and sanitation coverage in two densely populated urban slums, Aboabo and Asawase, in the Asawase constituency of Kumasi, Ghana. Due to their illegal status, these settlements have been neglected by city authorities with regard to the extension of water supply and sanitation services.(14) However, there is no up-to-date documentation on the levels of coverage of these essential services in these communities.
In the face of more general urban growth, the populations in these two settlements are bound to increase. Without a corresponding increase in the provision of water supply and sanitation facilities, there will be intense pressure on existing facilities, which are already under great pressure,(15) leading to their further deterioration and also in environmental conditions, thus putting the residents at risk of various diseases and increased poverty. An important step towards resolving the crisis is to understand the magnitude of the problem.(16) The provision of up-to-date information on sanitation coverage and water supply in Asawase and Aboabo communities will enable city authorities to plan effectively towards interventions that require priority attention for the achievement of MDG 7 target 10 − reducing by half the proportion of people without sustainable access to safe drinking water and sanitation. It will also provide baseline information that can be used to document change over time.
II. Materials and Methods
a. Study area
The study areas of Asawase and Aboabo, the two largest communities in the Asawase constituency, are located in the centre of Kumasi (Figure 1). Their populations number 46,315 and 34,206, respectively, with a growth rate of 5.47 per cent per annum,(17) and the population density for both communities is 6,224 per square kilometre.(18) The constituency’s location in the Kumasi metropolis has made it a preferred destination for migrants, especially from the northern part of Ghana.(19) The settlements are characterized by high poverty levels, high rates of illiteracy, high unemployment levels, poor housing, lack of access to quality health care and to transportation, relatively low incomes, poor environmental sanitation, overcrowded housing, an unhealthy environment and the generation of large volumes of municipal solid waste (MSW) that must be managed daily.(20) There is indiscriminate garbage disposal, low waste collection coverage and a lack of suitable treatment and disposal facilities for the generated waste.(21) Other characteristics of these areas include poor drainage systems, improper control of livestock, poor toilet facilities and unauthorized building extensions. The few poorly maintained drainage systems have either collapsed or are choked with refuse due to irresponsible human activities.(22) This leads to water, land and air pollution, putting the residents at risk of major public health threats(23) and environmental degradation.
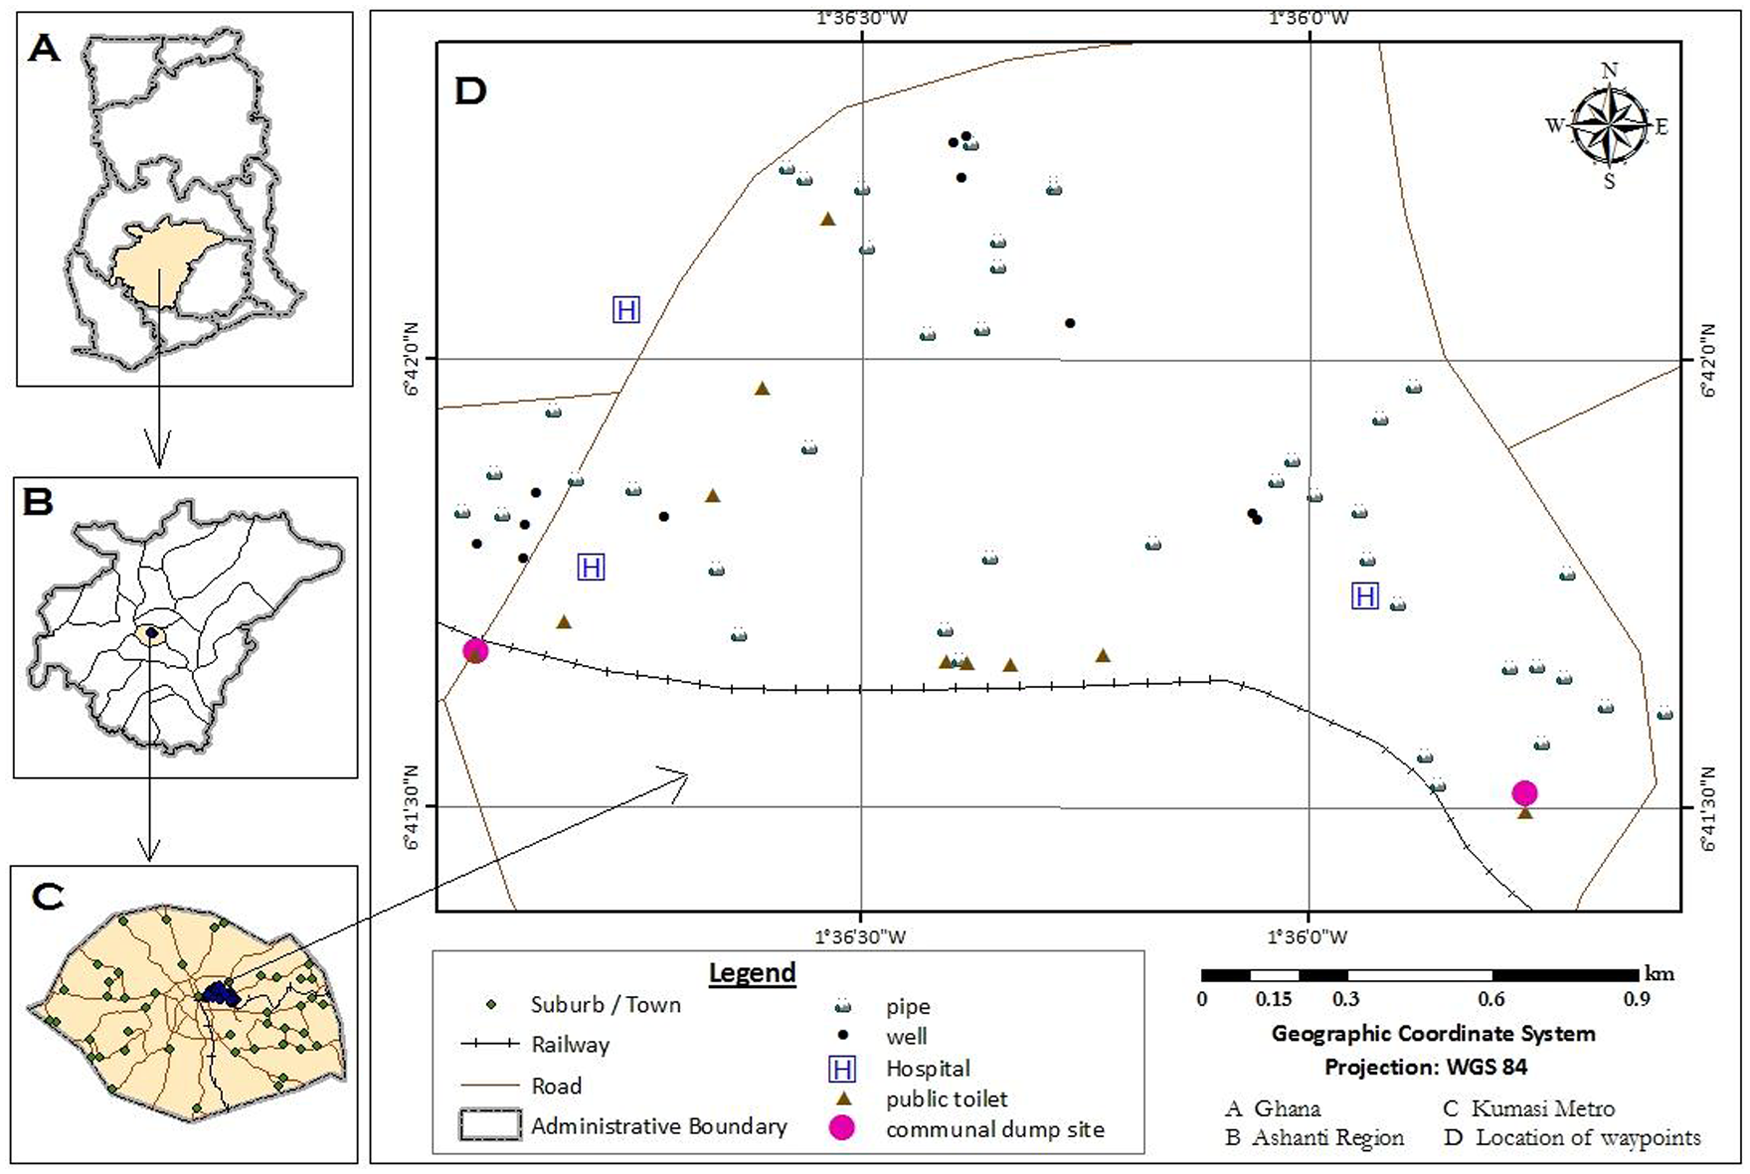
Map of the study area showing location of water and sanitation facilities
b. Research methods
The research relied on four methods to assess the water supply and sanitation situation in the study communities − large household surveys, key informant interviews, transect walk methods and mapping of water and sanitation facilities.The use of multiple complementary methods made it possible to triangulate, eliminating the bias that can occur if using only one method. This way, over-reporting or under-reporting of the number, condition and usage of water and sanitation facilities by respondents was less likely. The household survey included both closed and open-ended questions and sought both qualitative and quantitative data on water and sanitation facilities from the respondents. Key informant interviews allowed for more in-depth information on water and sanitation from selected respondents who were particularly knowledgeable about water and sanitation issues in their community. The study started on 27 January 2009 and ended on 17 April 2009.
Four fieldworkers (three men and one woman) who had completed their tertiary education were selected to do the research on the basis of their performance in a role-playing exercise simulating the conditions of the home visits, following Lagardere’s guidelines.(24) Their training lasted six days and they were instructed in the precise translation of the questionnaires into the Ghanaian Twi language for easy communication with respondents.
A sampling ratio of 5 per cent of total households was thought to offer a good representation of the population and a tolerable level of accuracy.(25) On this basis, 331 households in Aboabo and 457 in Asawase were selected at random for the study out of a total of 6,626 and 9,144 households, respectively.(26)
Permission was sought from household heads or, in their absence, the respondents, before the interviews were conducted. Interview dates and times were arranged in advance with respondents. Thirty-three key informant interviews, 16 in Aboabo and 17 in Asawase, were also conducted. The questions centred on household demographics, water supply, access and use of toilet facilities and waste management practices. Most of the quantitative questions were closed-ended to facilitate codification and analysis of the data obtained.
The study team and selected community members carried out transect walks to observe the condition of water points and toilet facilities as well as dump sites in the study communities. These observations were carried out in the early mornings and late evenings when use of facilities was at its peak. Open defecation was also observed around the major drainage systems, prominent among which was the Subin River, which runs through the studied communities. Plastic bags used for defecation, and popularly referred to as “wrap-and-throw” or “flying bags”,(27) were also seen in the streets, backyards and drainage systems. The state of the drainage systems as well as the flow of wastewater through them was noted and a spot-check list was used to record the parameters of interest.
Mapping of water sources, toilet facilities and waste dump sites was carried out using a hand-held GPS map 76S global positioning system machine. This was done to quantify the number of water sources and sanitation facilities used by the residents.
The study used only volume to quantify the daily solid waste generated in the two communities.(28) The quantities of waste generated in the communal waste containers were calculated using the equation below, and the quantities generated from other disposal options – house-to-house, communal waste ground, gutters and elsewhere − were calculated by proportion.
y = v * n * h/r
where y = daily volumes of solid waste generated; v = communal waste container (11.648 cubic metres); n = number of containers per community (Aboabo = 4 / Asawase = 5); h = number of households that utilize the containers; and r = rate of collection to disposal sites (every two days)
Data were analyzed using the SPSS version 16 statistical package. To eliminate data entry errors and to ensure quality control, all data entered were cross-checked manually with the corresponding question. The coded questions facilitated the quantitative analysis of the data. Descriptive statistics using mainly percentages and use of the Spearman correlation (significance level of 0.05) coefficient to establish associations between variables were used to draw conclusions.
III. Results and Discussion
a. Household demographics
Household demographics are presented in Table 1. Most of the communities’ residents were Muslims, which is not surprising considering that most of them had migrated from northern Ghana, which is predominantly Islamic. The study showed that 80 per cent of household heads in Aboabo were male, with 92 per cent of them aged between 25 and 55. The corresponding figures for Asawase were 92 per cent and 90 per cent, respectively. The relatively small number of female-headed households is due in part to the practice of Islam, which does not allow women to head households when adult males are available. Second, the lower status and lack of empowerment of women implicitly undermine their competence.In these communities, men are always expected to provide protection and shelter for the family. The age group of the majority of household heads indicates that the population in the communities is young and falls within the economically active group.(29) In Muslim communities, early marriages and early births cause children to come of age early and start their own families. Literacy levels were surprisingly high in both communities, with 44 per cent of household heads in Aboabo and 34 per cent in Asawase having a basic education. The corresponding figures for secondary education were 32 and 34 per cent, and for non-formal Islamic education 13 and 25 per cent. Eleven per cent of household heads in Aboabo and eight per cent in Asawase had tertiary education, which was also considered relatively high for these densely populated Muslim communities.
Household gender, age, income, size, religion and educational level within the two communities of Aboabo and Asawase
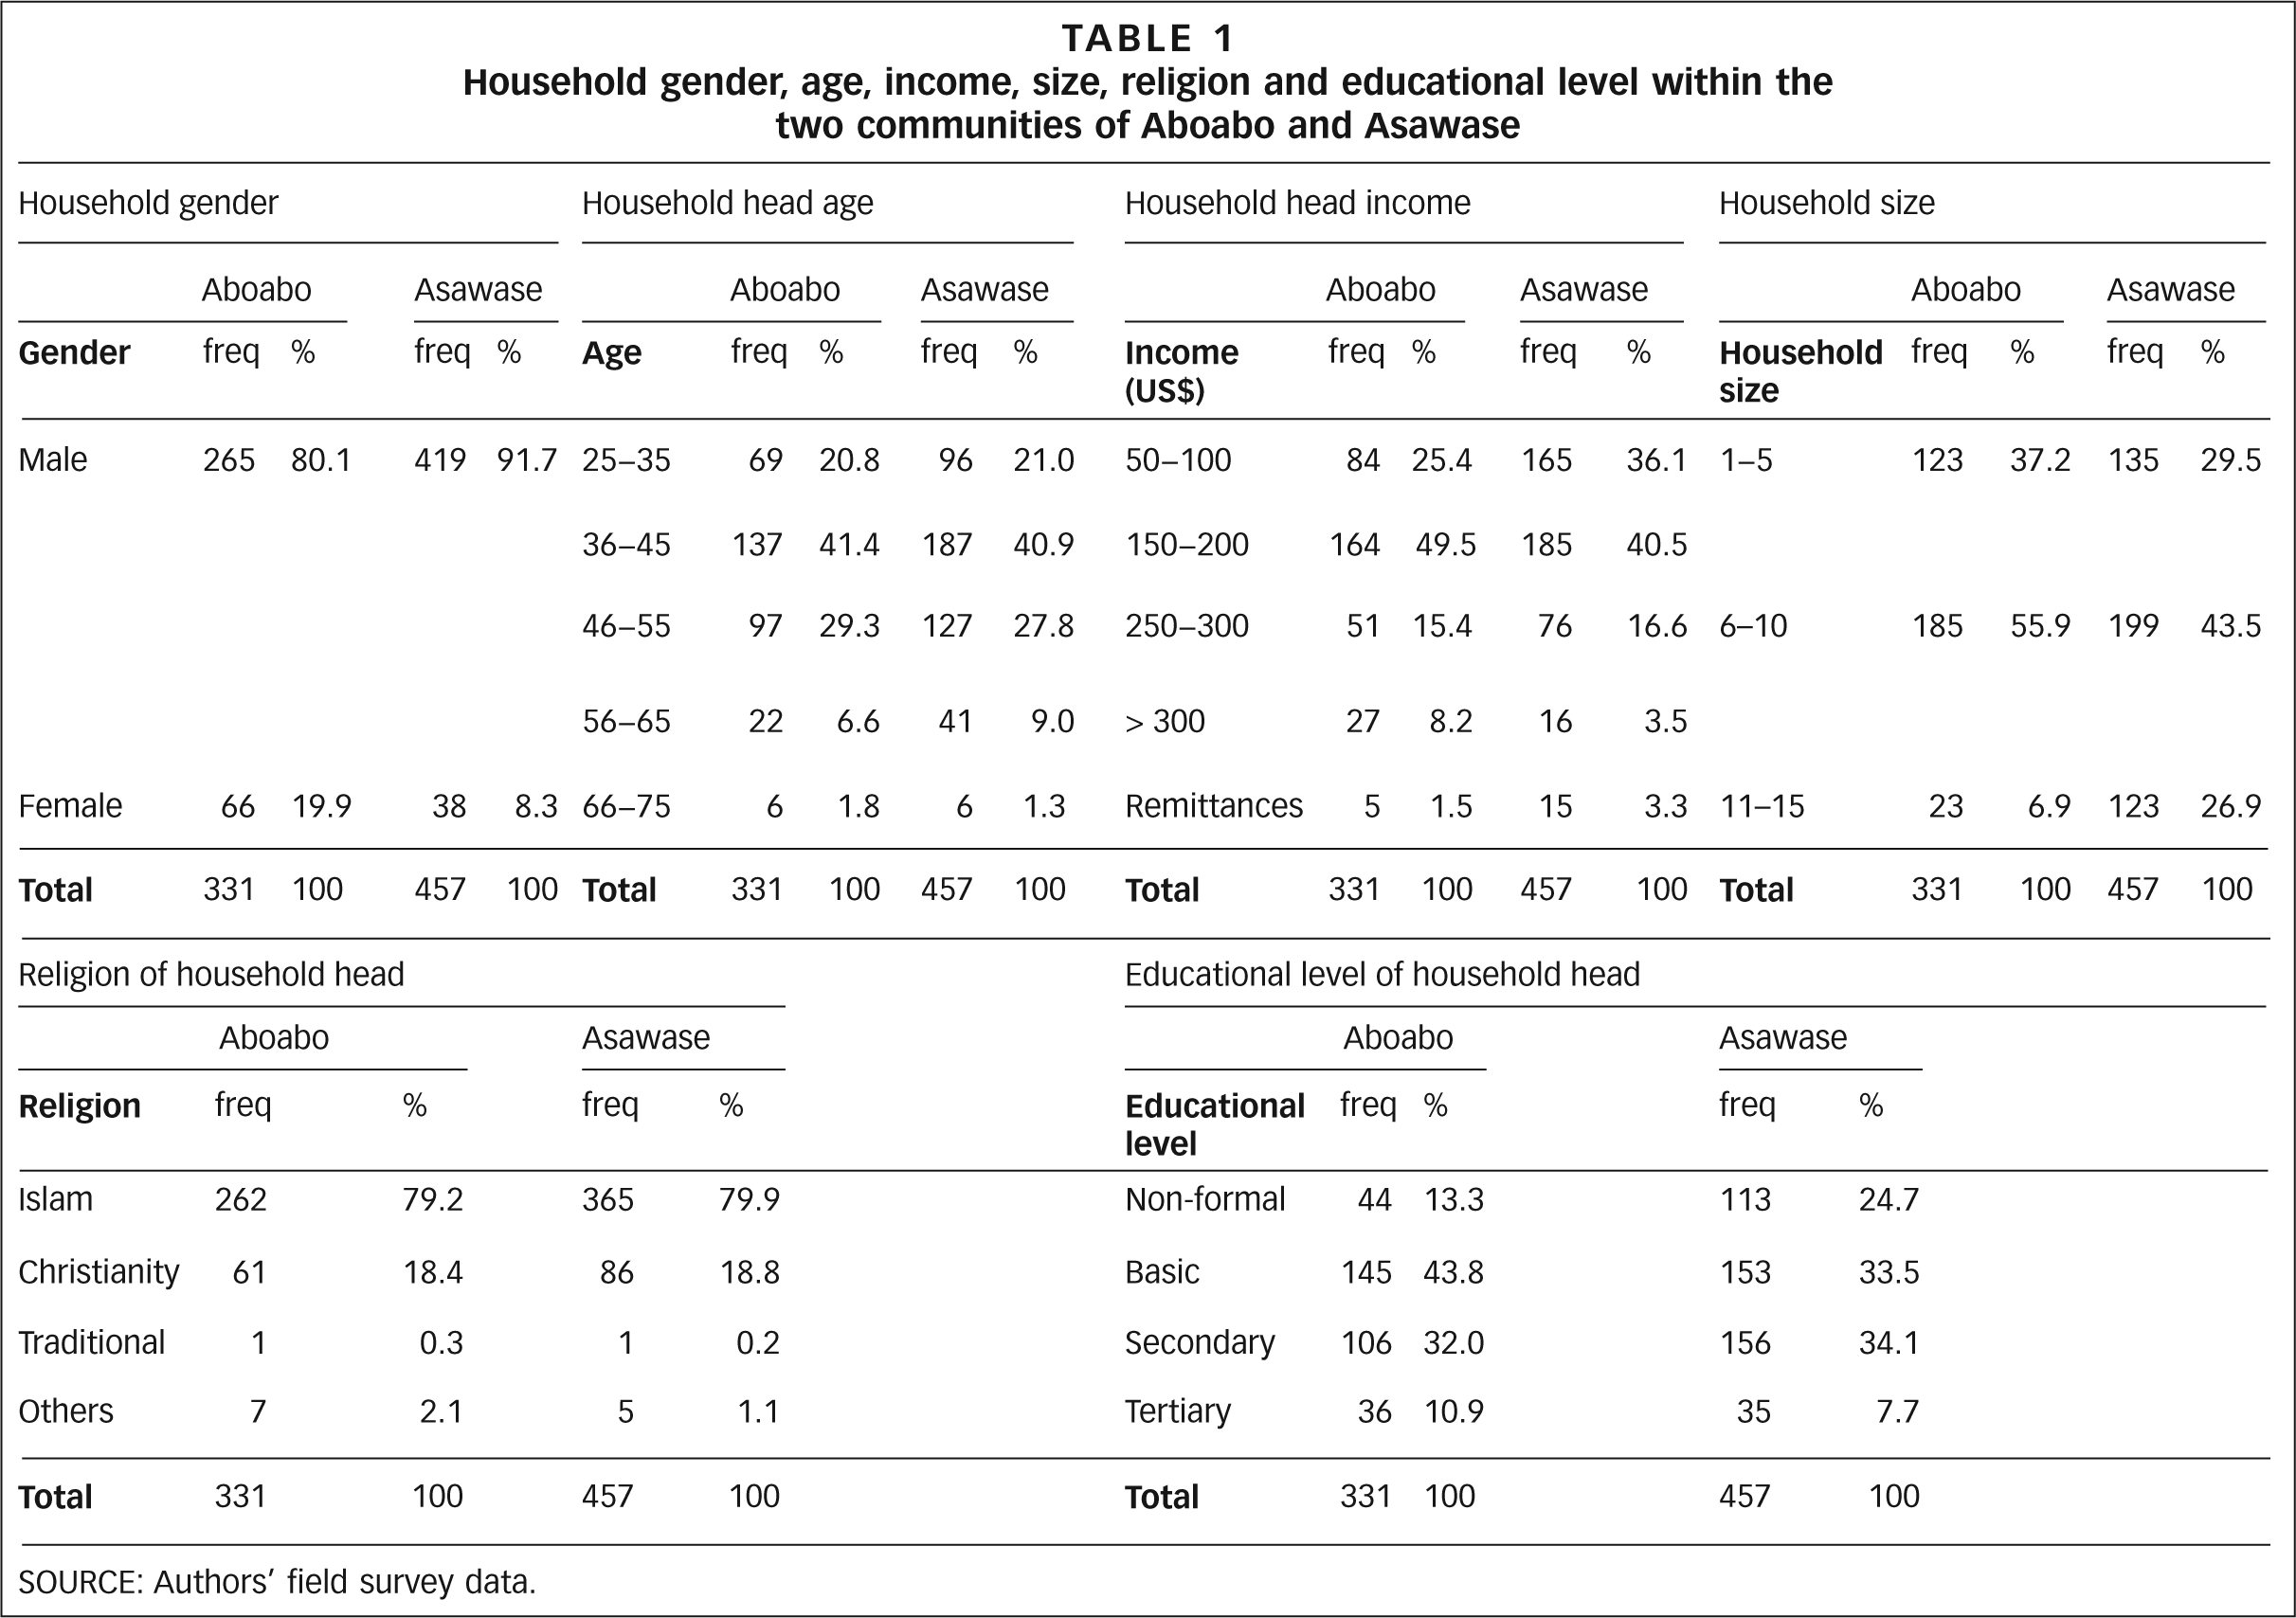
SOURCE: Authors’ field survey data.
Most of the residents of the two communities worked in the informal sector (96 per cent and 98 per cent for Aboabo and Asawase, respectively) with only a small number having white collar jobs (Figure 2). Consequently, average monthly incomes were low for most households. Earnings ranged from US$ 50−200 (75 per cent and 77 per cent, respectively) to more than US$ 200 (24 per cent and 20 per cent) (Table 1). The International Labour Organization(30) has shown that informal sector employees seldom attract substantial incomes to cater for the needs of their families.
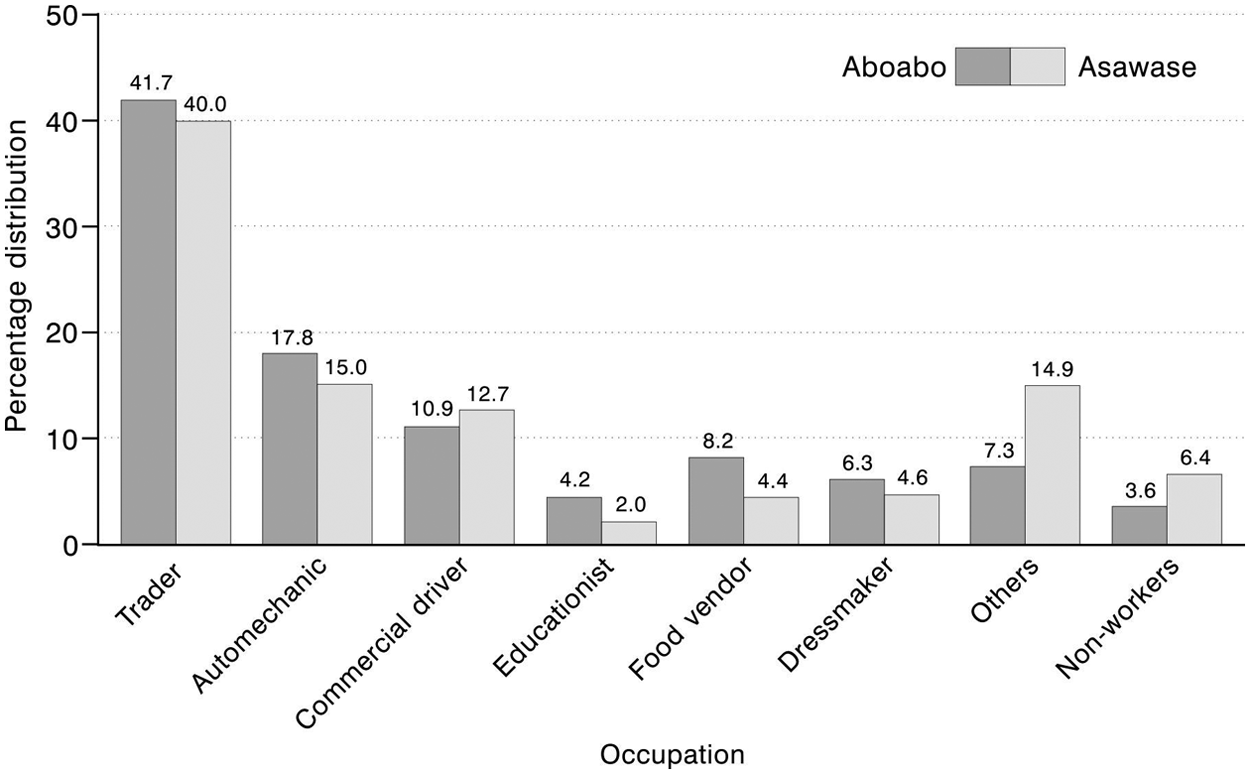
Occupation of household heads within the two communities of Aboabo and Asawase
Household size in the two communities ranged from one to 15, but most households comprised between six and 10 persons (56 per cent and 43 per cent for Aboabo and Asawase, respectively) (Table 1). This could be due to the practice of polygamous marriages in Islamic societies, which leads to many children. Household dwelling places were primarily rented (72 per cent and 66 per cent), although a sizeable number owned their homes (eight per cent and 11 per cent) or lived in a family house (20 per cent and 23 per cent). These family houses belonged to extended family members whose absence (e.g. they might be deceased) often led to neglect around maintenance and provision of such important facilities as water and toilets.
b. Household water supply and sanitation
Pipe-borne water (piped connections to households or water purchased from neighbouring homes) formed the main source (80 per cent and 86 per cent in Aboabo and Asawase, respectively) of water supply for the two communities, with only 20 per cent and 14 per cent of households drawing water from well sources (Figure 3). The high number of households using pipe-borne water is due to the extensive water supply network in the city, especially in the city centre where the study communities are located. Pipe-borne water coverage in the Kumasi metropolis is 83 per cent compared to the 80 per cent national average.
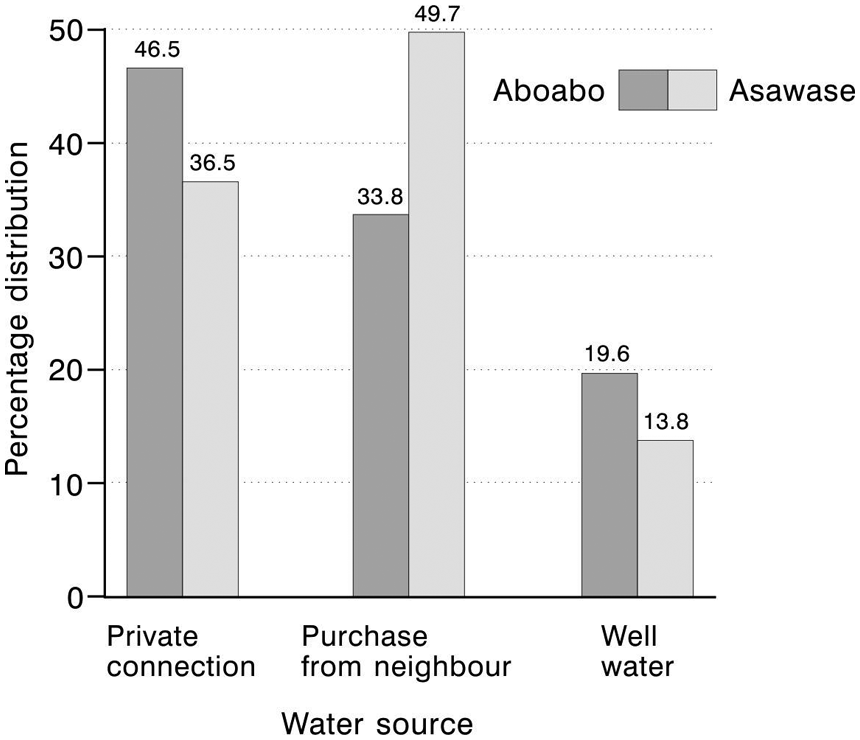
Sources of water supply to households within the community
Although most of the households used pipe-borne water, many were not legally connected to a private tap at the household level because of low income levels. Illegal tap connections by some residents pose a major challenge to the tracking of actual volumes of treated water distributed to these settlements by the municipal authorities. This causes a reduction in expected revenue and a subsequent increase in the cost of water provision to these settlements. Of the households that used well water, a high percentage (69 per cent and 44 per cent in Aboabo and Asawase, respectively) draw it from unprotected sources where it is either free or relatively cheap. Total improved water coverage from pipe-borne water and protected well sources was 94 per cent and 92 per cent for Aboabo and Asawase, respectively (Figure 4).
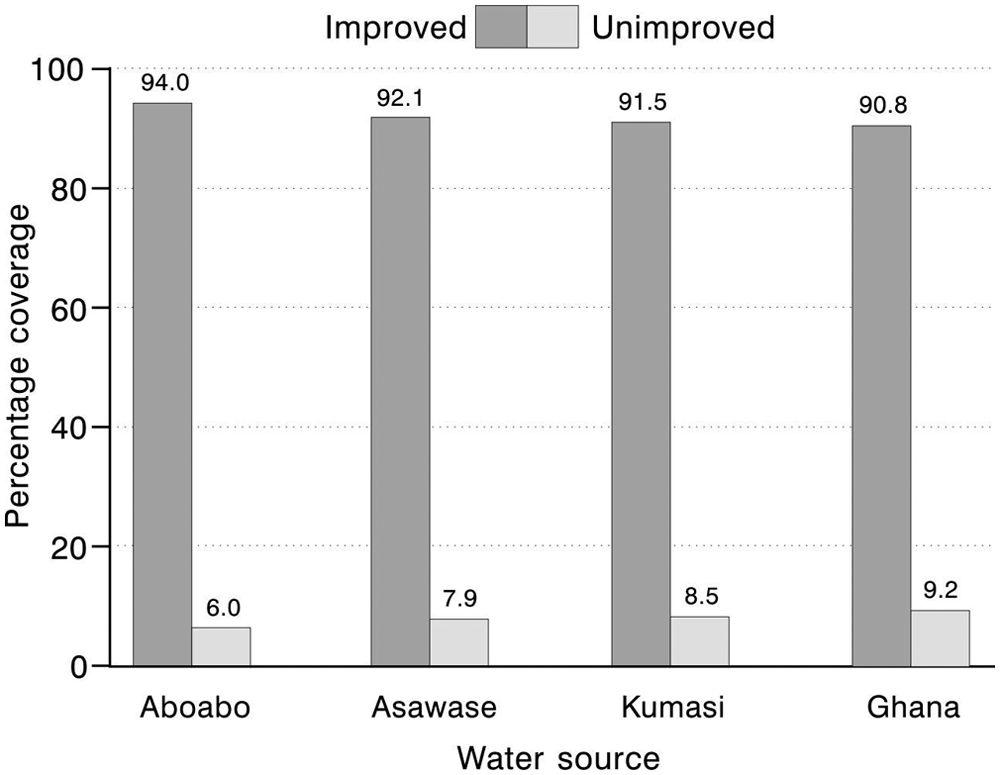
Relative percentage of improved and unimproved water sources
c. Alternative water sources and households’ expenditure on water
A high percentage of households purchased water from neighbouring homes at high prices as a result of the discontinued provision of public standpipes in the city by Ghana Water Company Limited. Other sources of water supply such as boreholes with hand pumps, protected springs and rivers were non-existent in these communities. During periods of water scarcity, well water (69 per cent in Aboabo and 100 per cent in Asawase) and water supplied by water tankers (31 per cent in Aboabo) became alternative water supply sources for households.
Water-metered households formed 47 per cent and 37 per cent of the total for Asawase and Aboabo, respectively, and most households paid their water bills promptly to the Ghana Water Company Limited. Currently, the block tariff (set nationally) adopted by the Ghana Water Company Limited prices water to residential property at 35.86 cents per cubic metre. However, households that purchase water from neighbouring homes because they cannot afford the initial cost of connection to their houses pay 6.8 cents for an 18-litre bucket or 20-litre gallon. This is equivalent to US$ 3.45−3.83 for the same volume (one cubic metre) of pipe-borne water from the Ghana Water Company Limited – between 10 and 11 times more than is charged on the block tariff basis. Those who access well water are either not charged or pay US$ 3.45 for the same volume of water.
d. Distance and time covered to access water sources
More than 95 per cent of the households in the study communities had access to water sources within 15 minutes – i.e. the time taken to go to the water source, fetch the water and return to the home. More than 69 per cent spent less than 10 minutes (waiting time) at the stand pipe to have access to the water (Table 2). This implies that water provision to households is adequate and this is attested to by all households.
Household water management
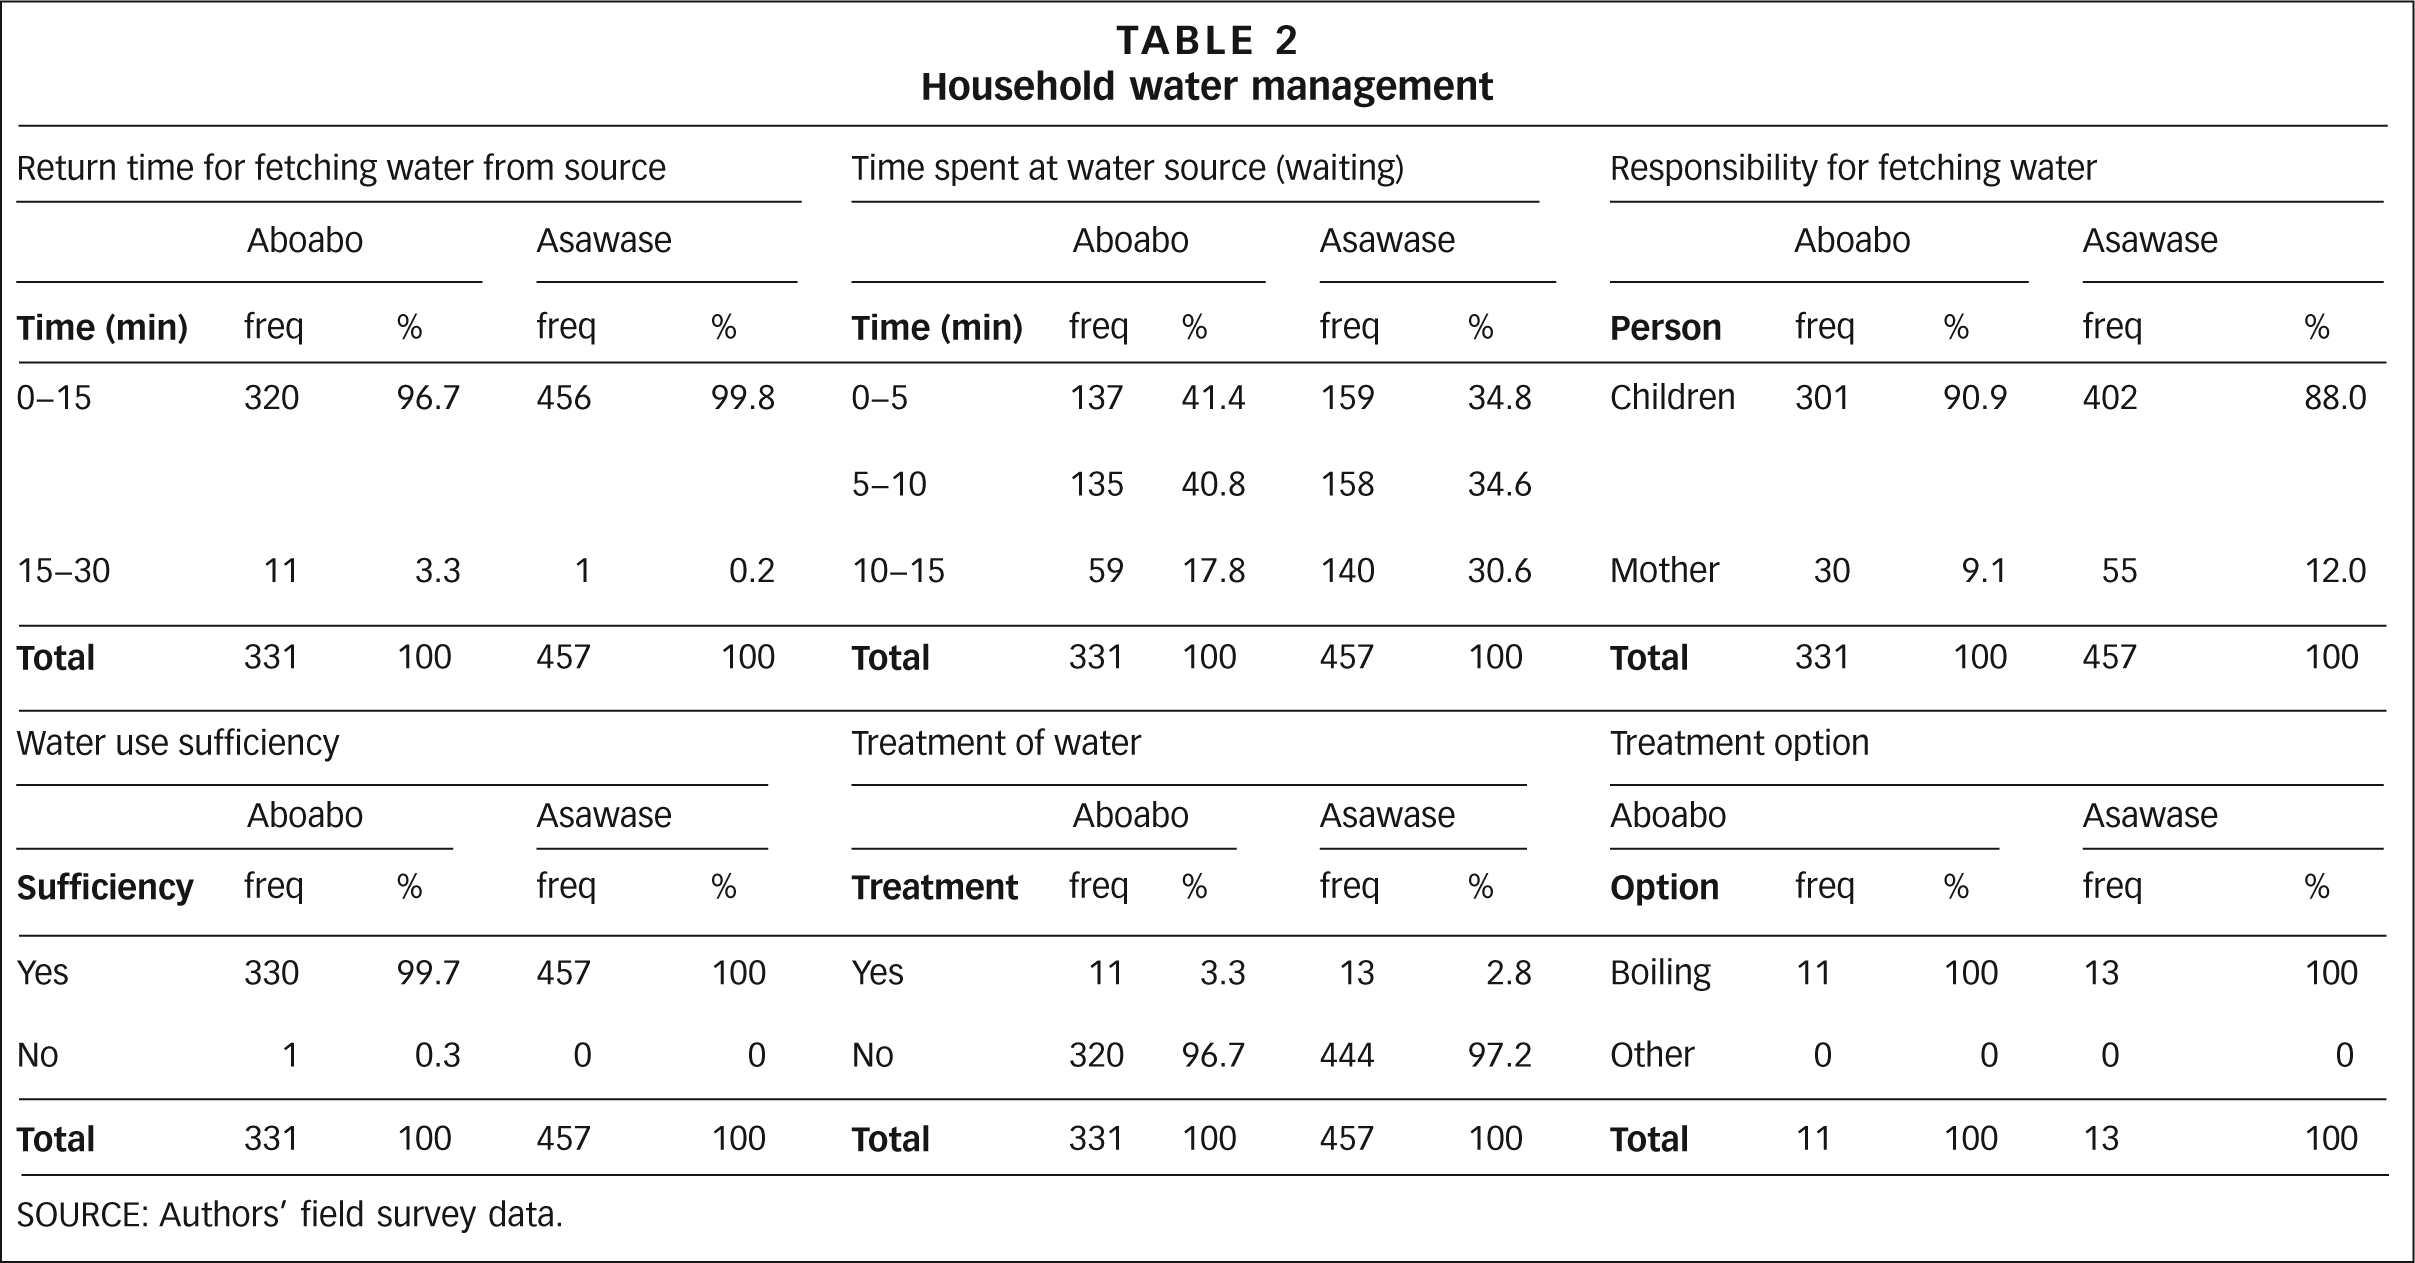
SOURCE: Authors’ field survey data.
The responsibility for fetching water for the households falls to the children, particularly girls (91 per cent and 88 per cent) and mothers (nine per cent and 12 per cent) (Table 2). In the absence of children to undertake the chore, mothers take on the responsibility and this is also reported in other studies.(31) Within Islam, household chores are the responsibility of women. In the absence of women, men may neglect the religious requirements to wash the body before entering the mosque and performing anal cleansing with water after visiting the toilet. Periodic two to four-day piped water shortages were reported by between one-third and one-half of households, and as a result women store water in barrels for use during such periods. Households with a source of well water suffered the least disruption to their water supply.
Most households received dirty pipe-borne water immediately after periods of water scarcity. This could be due to settled contaminants in the pipes of the water supply network, as has been observed elsewhere.(32) While some studies have found other methods for disinfecting drinking water, including solar disinfection,(33) none of the households visited used any scientific method of disinfection except for a very small number (about 3 per cent of households in both Aboabo andAsawase) who reported treating their drinking water, mostly well water, by boiling.
e. Household and community sanitation
Fewer than half (about 42 per cent) of the households in both communities – including in family houses, rented apartments and privately owned homes – had access to on-plot toilet facilities in their homes. The absence of on-plot latrines in most rented apartments was because landlords had prevented their construction − spaces that could have been used for latrines were more commonly converted to rooms and rented out. Most households that resided in family houses also saw no need to use their income to construct latrines as they believed this should be the responsibility of the property owner. The low incomes of most households also prevent them from having private latrines. Most on-plot latrines were shared between two or more households in family houses and rented apartments. Only 17 per cent and seven per cent of the on-plot latrines were being used by only one household (Table 3). All shared sanitation facilities are considered unimproved, while those that are not shared are improved.(34) The main types of on-site toilets used in the study communities included simple pit latrines (27 per cent and 28 per cent) and flush to septic tank latrines (12 per cent and 6 per cent), and ventilated improved pit latrines and bucket/pan latrines made up a small percentage (three per cent and eight per cent) for Aboabo and Asawase, respectively (Figure 5). Most residents in these communities use public toilets or resort to open defecation.
Shared and unshared on-plot toilet facilities
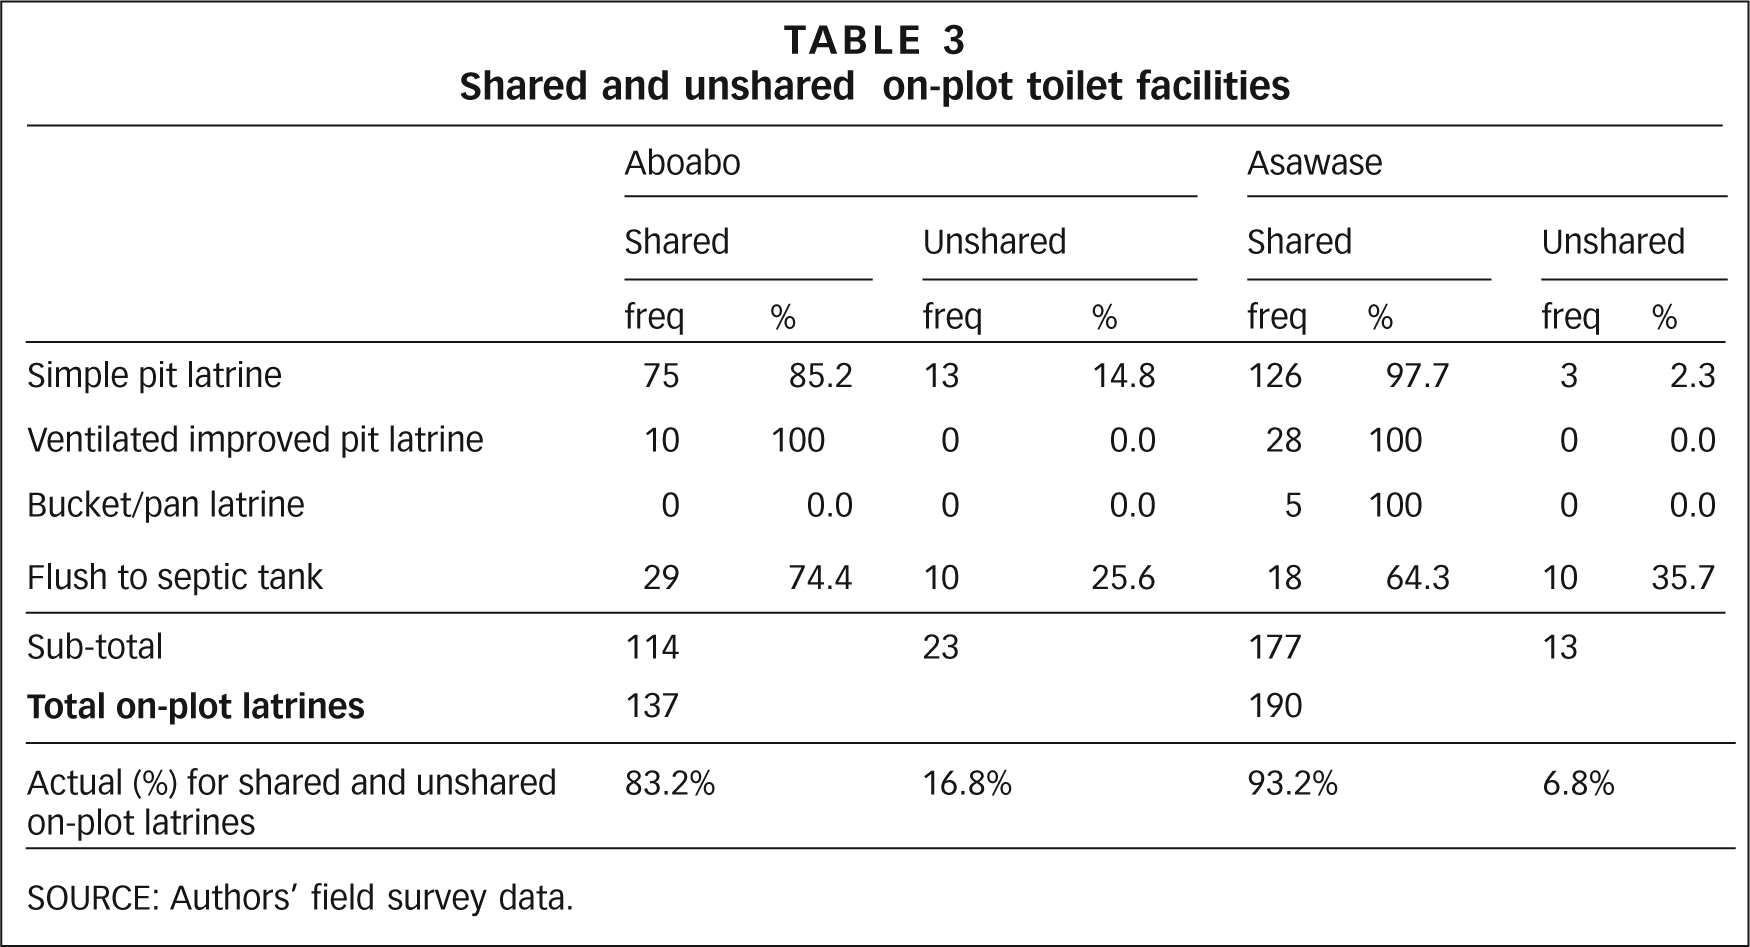
SOURCE: Authors’ field survey data.
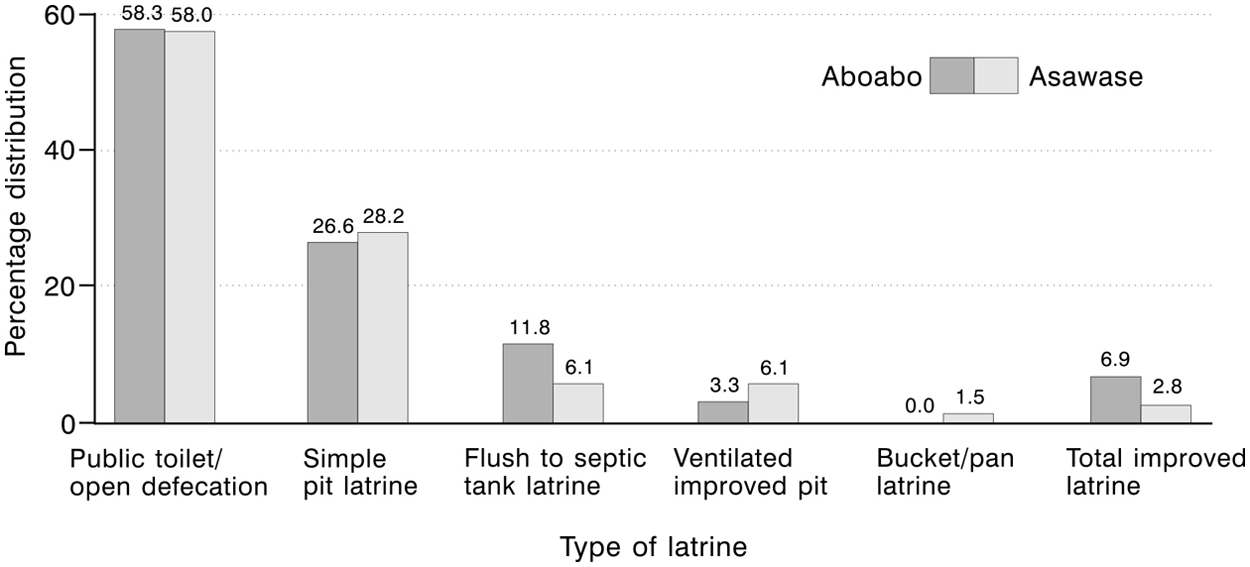
Types of toilet facilities among those households that have them (42 per cent)
The absence of bucket/pan latrines in Aboabo and the limited number in Asawase is due to their being phased out by city authorities because they have to be emptied by private, unlicensed nightsoil carriers, usually into drains, streams and nearby bushes.(35) Unfortunately, in Kumasi, the sewer system serves just a small part of the city’s population, including the Kwame Nkrumah University of Science and Technology, Komfo Anokye teaching hospital and government bungalows in the Kyirapatre Estates.(36) Total improved toilet coverage is seven per cent for Aboabo and three per cent for Asawase (Figure 5).
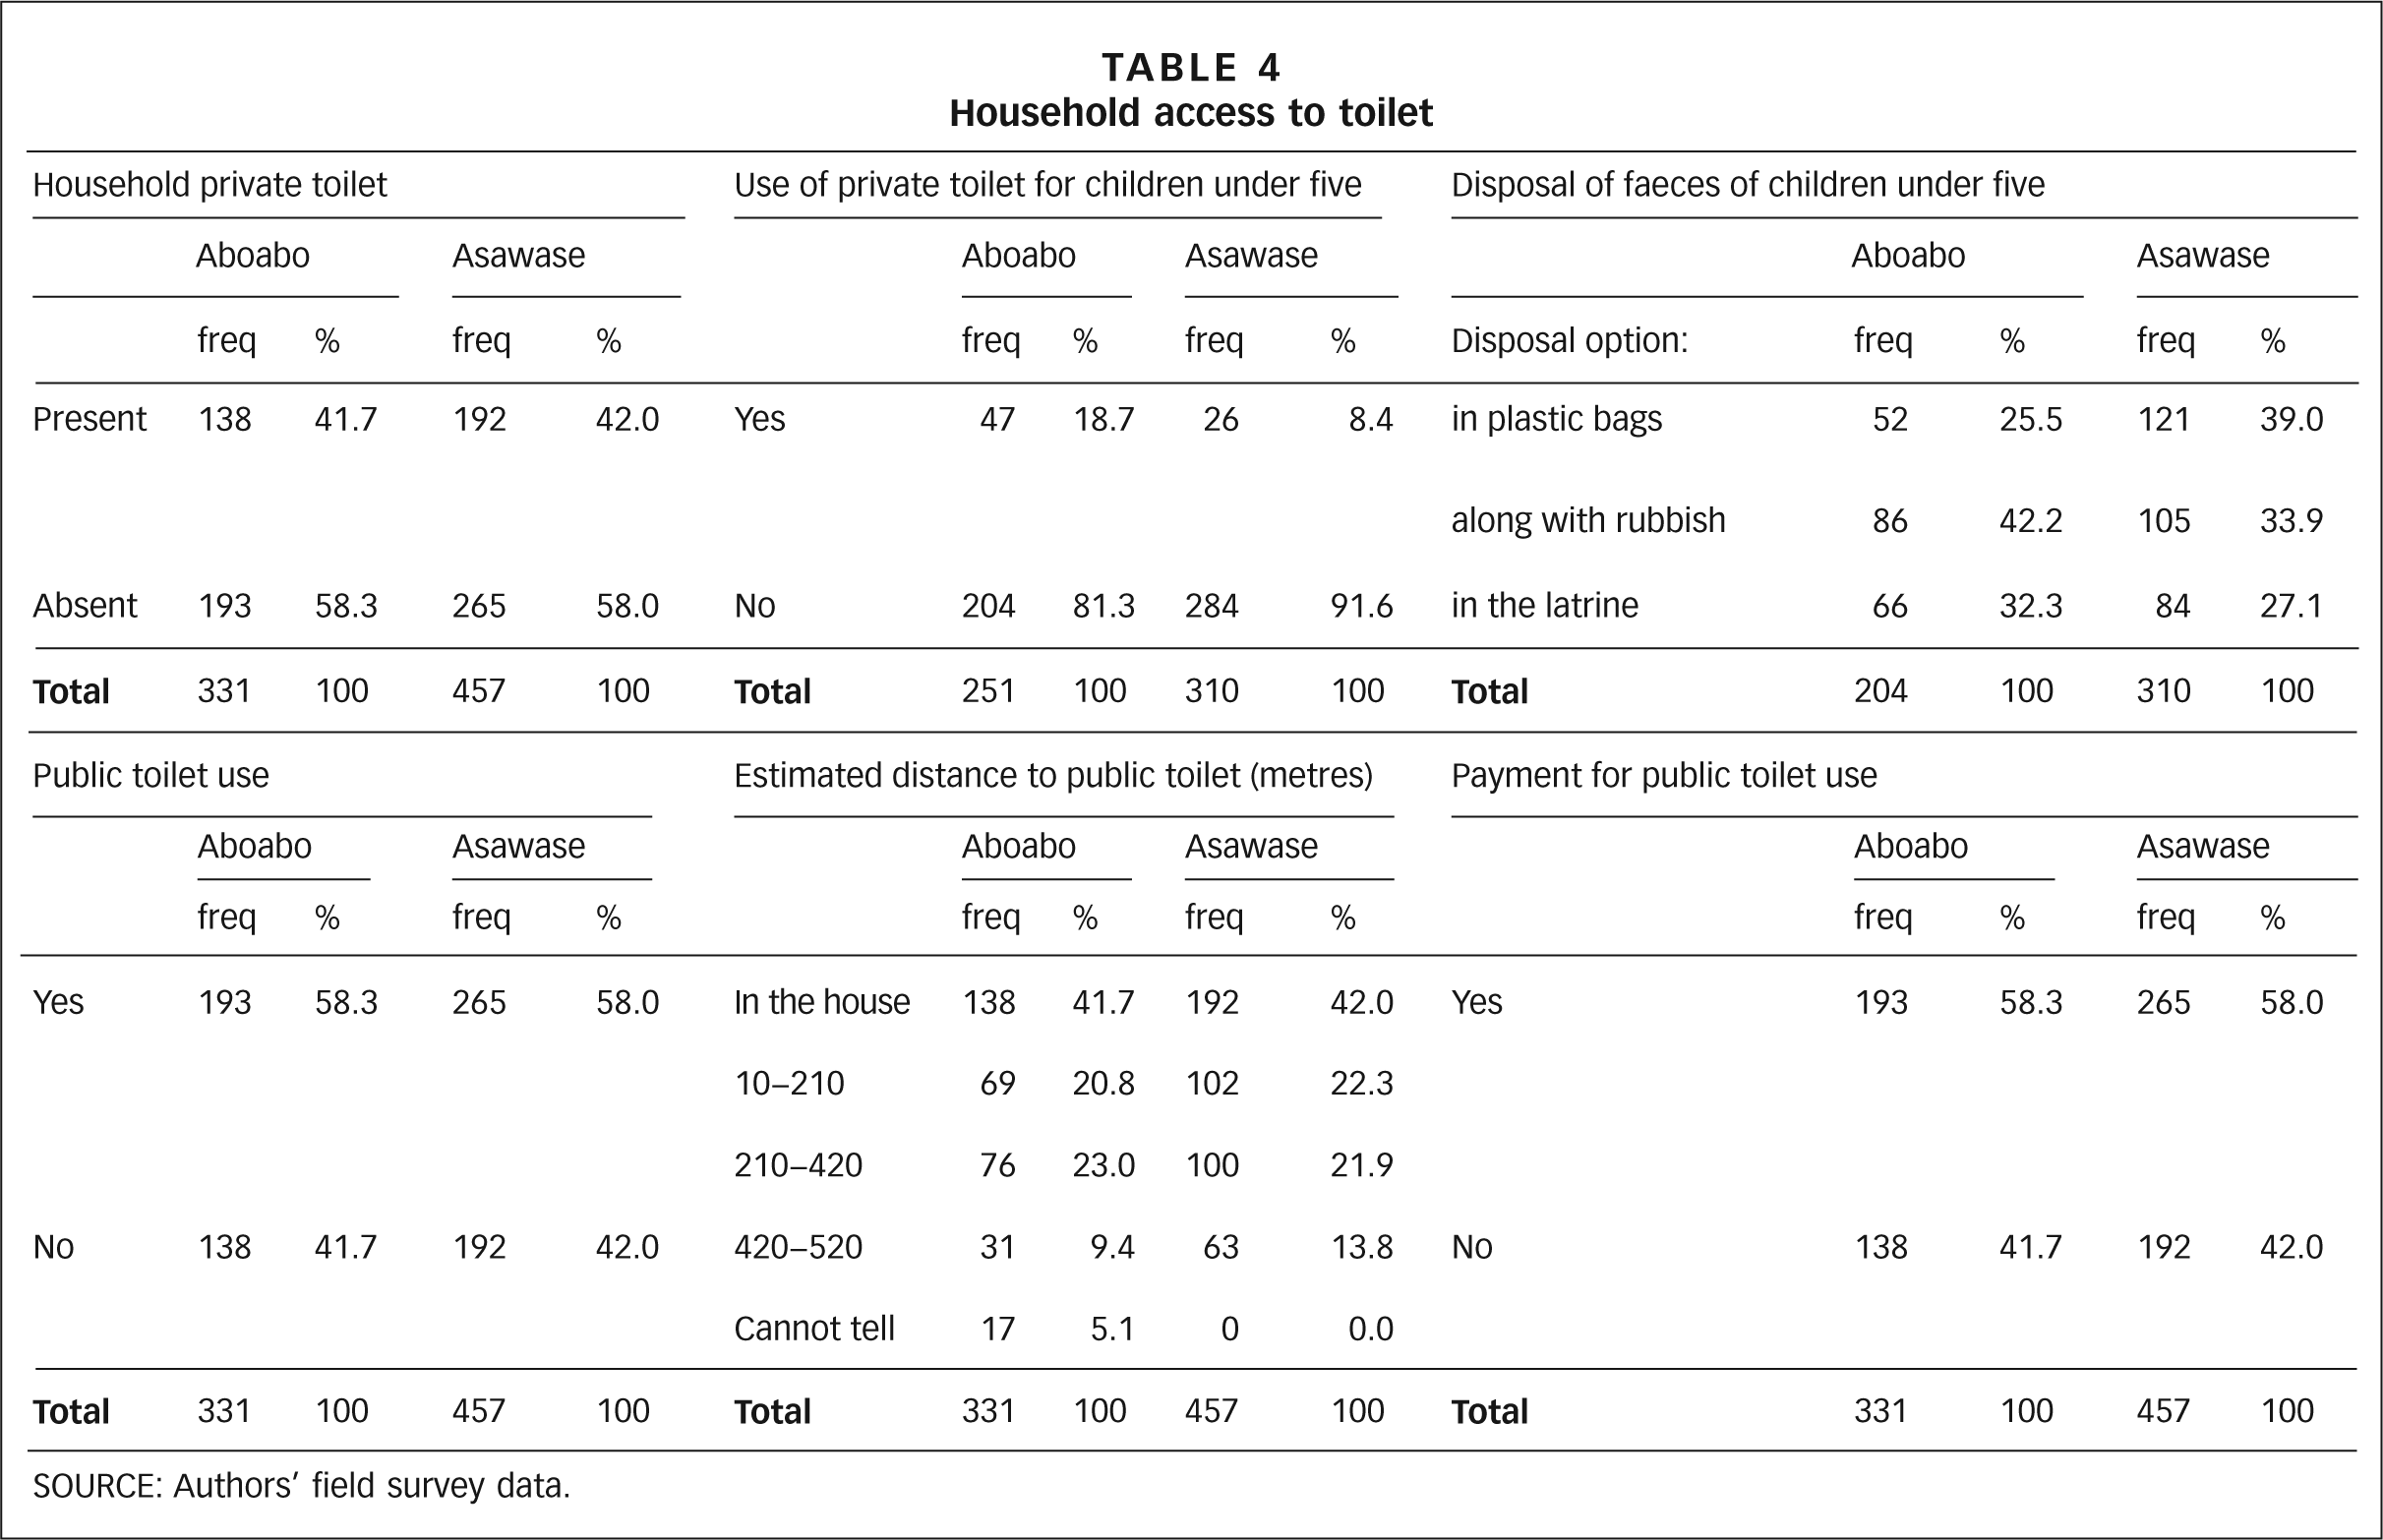
More than half (about 58 per cent in both Aboabo and Asawase) (Table 4) of the households in both communities are without an on-plot toilet and thus use public toilets and open defecation. The two communities share 10 public toilets, each with about 14 squatholes, which serve 80,449 inhabitants (i.e. about 575 people per squathole) on a pay per use basis. According to some key informants, the ever-increasing usage of the public toilets is because some on-plot toilet facilities are used only by landlords and their households. Also, it takes an average of 4.2 years for each toilet pit in Kumasi to fill, depending on pit volume and the number of people using it. The time varies between 10 years or more in high-income areas to three months in low-income areas.(37) Thus, considering the low-income status of these communities and the large number and size of households, the fill-up rate of most of the on-plot pit latrines is rapid. Unfortunately, the affected households are left with no space to construct new latrines.
Household access to toilet
SOURCE: Authors’ field survey data.
Despite an unwillingness to acknowledge the practice of open defecation, this was nonetheless observed along the major drainage systems, in gutters, on dumpsites and in open spaces. Probably a large proportion of residents without private or on-plot latrines (58 per cent) use this method. The refusal to acknowledge it is an indication of the level of discomfort and humiliation that accompanies the practice.
According to the majority of key informants,the limited number of public toilets, the long distances covered to access them (Table 4) (for most households up to about half of a kilometre or more), the presence of fecal matter on toilet floors, poor maintenance of the facilities (100 per cent for both communities) leading to a decline in standards, increases in pay per use fees for the public toilets (currently, fees are 13.7 cents for adults and 6.89 cents for children) and the discontinued free use of the facility by children are reasons for the high occurrence of “flying toilets” and open defecation practices in these communities. This confirms the findings of other studies(38) in the study communities.
f. Disposal of faeces of children under the age of five
Most households with private toilets tend to discourage children under the age of five from using the facility directly for the fear that they might fall in. They are therefore made to defecate in plastic containers, which are later emptied into the latrine. In households without access to private toilets, children’s faeces were disposed of in plastic bags along with household refuse (67.7 per cent and 72.9 per cent, respectively, in Aboabo and Asawase), in gutters and on open plots.This practice of disposing of children faeces is solely the responsibility of women in the households.
g. Household solid waste management
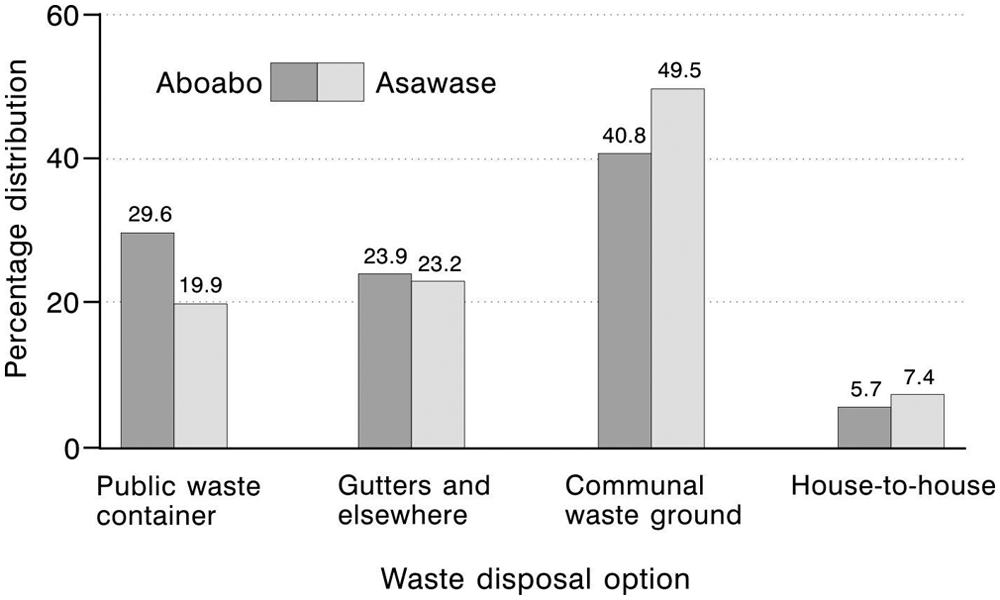
The main waste collection methods used in the city are house-to-house (provided by Zoomlion Ghana Limited), communal waste container systems (skips) and the use of dump sites (Figure 6). The small number of households with a house-to-house waste collection is probably related to the cost – residents are required to pay US$ 3.25 before a filled solid waste container is emptied.
Household waste disposal options
Communal waste skips could partly solve the problem of large volumes of waste if they were emptied frequently. But their infrequent emptying causes vast amounts of waste to spill over and litter the environment, as reported in other studies.(39) Some residents were also worried about the ongoing pay-to-dump scheme for the communal waste skip disposal option, where they have to pay 13.79 cents (a high price in their opinion) every time they dispose of waste into the communal waste skip. This scheme might therefore be causing low-income earning households in the study communities to refrain from using the communal waste skips. Households sometimes mix the solid waste with wastewater and resort to dumping it in any available open space or gutters and yards – often at dawn in order to avoid being seen and or having to pay fees associated with the pay-to-dump scheme. According to other studies,(40) the pay-to-dump initiative often fails where there is lack of willingness to pay for such services. The burden for these arrangements falls entirely on women. Waste collection from the disposal sites by city authorities is considered poor by most households (90 per cent and 88 per cent of the respective communities). During rarely organized clean-up campaigns, waste that is removed from clogged gutters is left on the street shoulders and eventually ends up back in the same gutters from which it was taken.
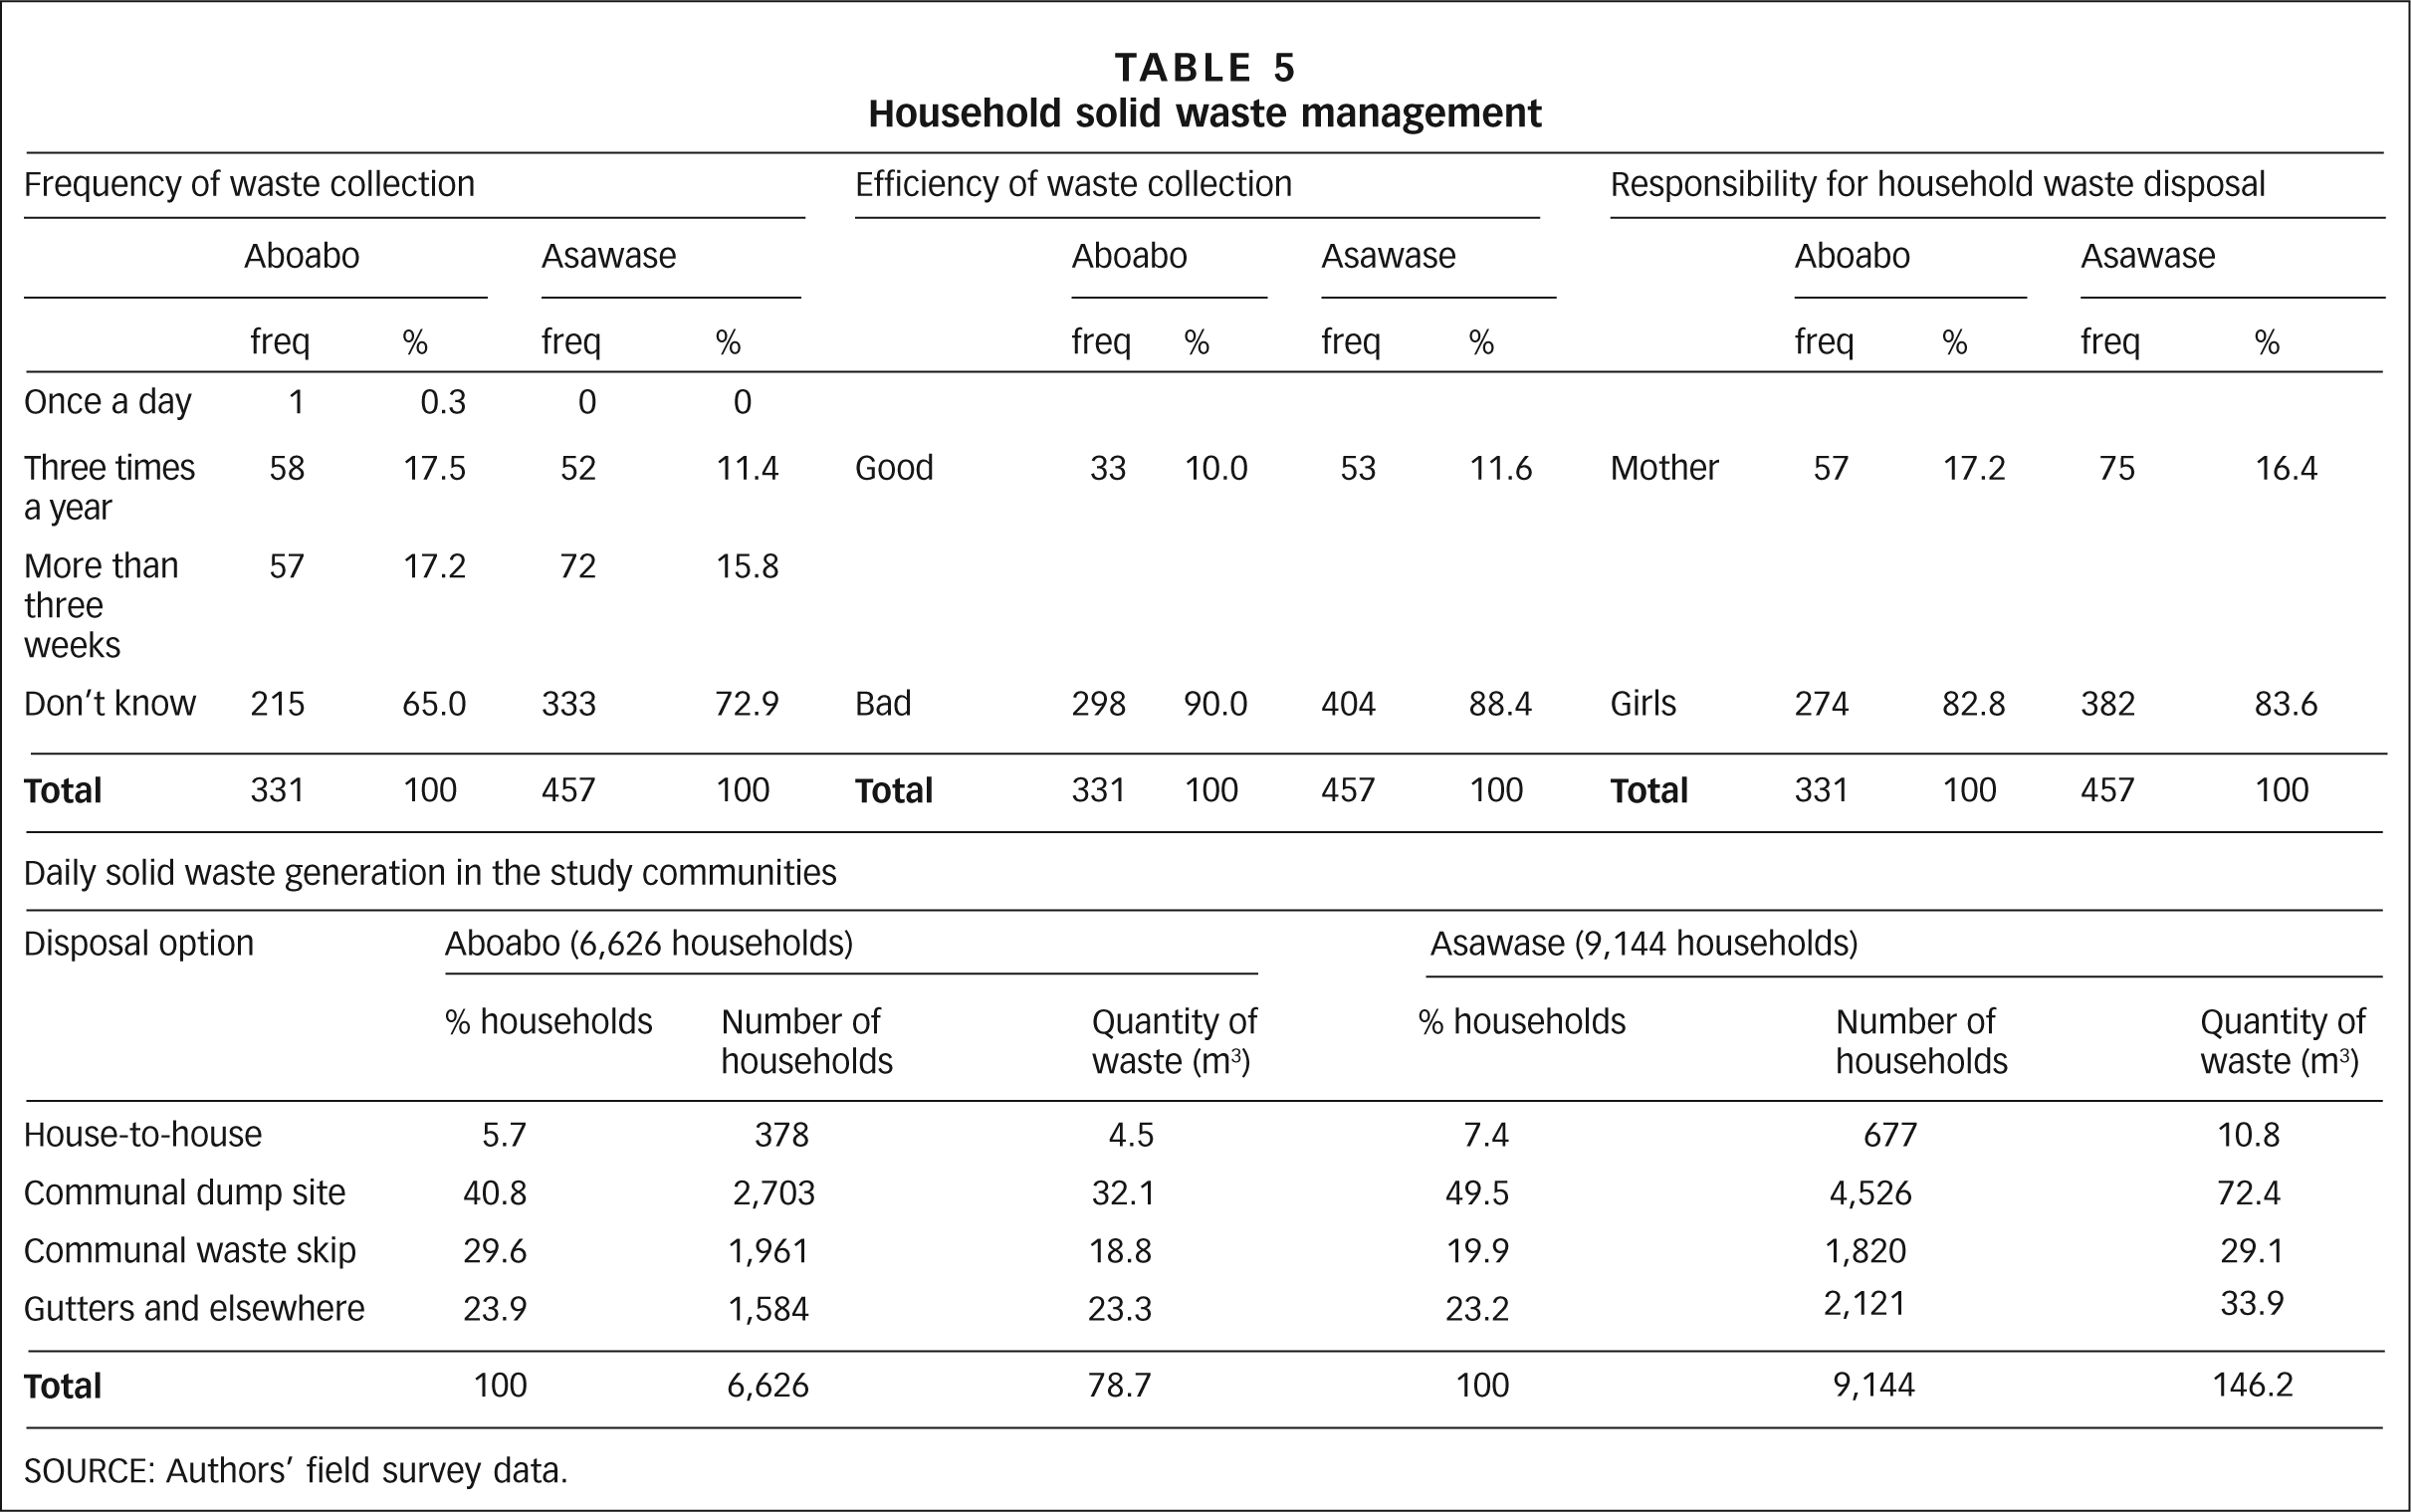
About 94 per cent and 93 per cent of waste generated in Aboabo and Asawase, respectively, remains uncollected, posing health risks to the residents. Just 10 per cent and 12 per cent of the households consider waste collection to be adequate (Table 5).
Household solid waste management
SOURCE: Authors’ field survey data.
h. Solid waste generation in the study communities
Given the quantity of solid waste that is uncollected in the study communities, it is not surprising that 90 per cent and 88 per cent of respondents in Aboabo and Asawase, respectively, were dissatisfied with the collection and disposal of household waste (Table 5). According to all key informants and the observations made during the health walk, waste management in the two communities is very poor, leading to poor environmental sanitation.
There was a positive correlation for the volume of solid waste generated and household numbers, with a correlation coefficient (r) of 1.000 for both Aboabo and Asawase. The high coefficient of determination (R2) values of 1.000 and 1.000 for the regression graphs (Figures 7 and 8) implies that the volume of waste is solely dependent on the number of households. Given that quantities of waste generated are proportional to the population,(41) the waste generation in the two communities can be expected to increase with the high annual growth rate of 5.5 per cent, as shown in Figures 7 and 8.
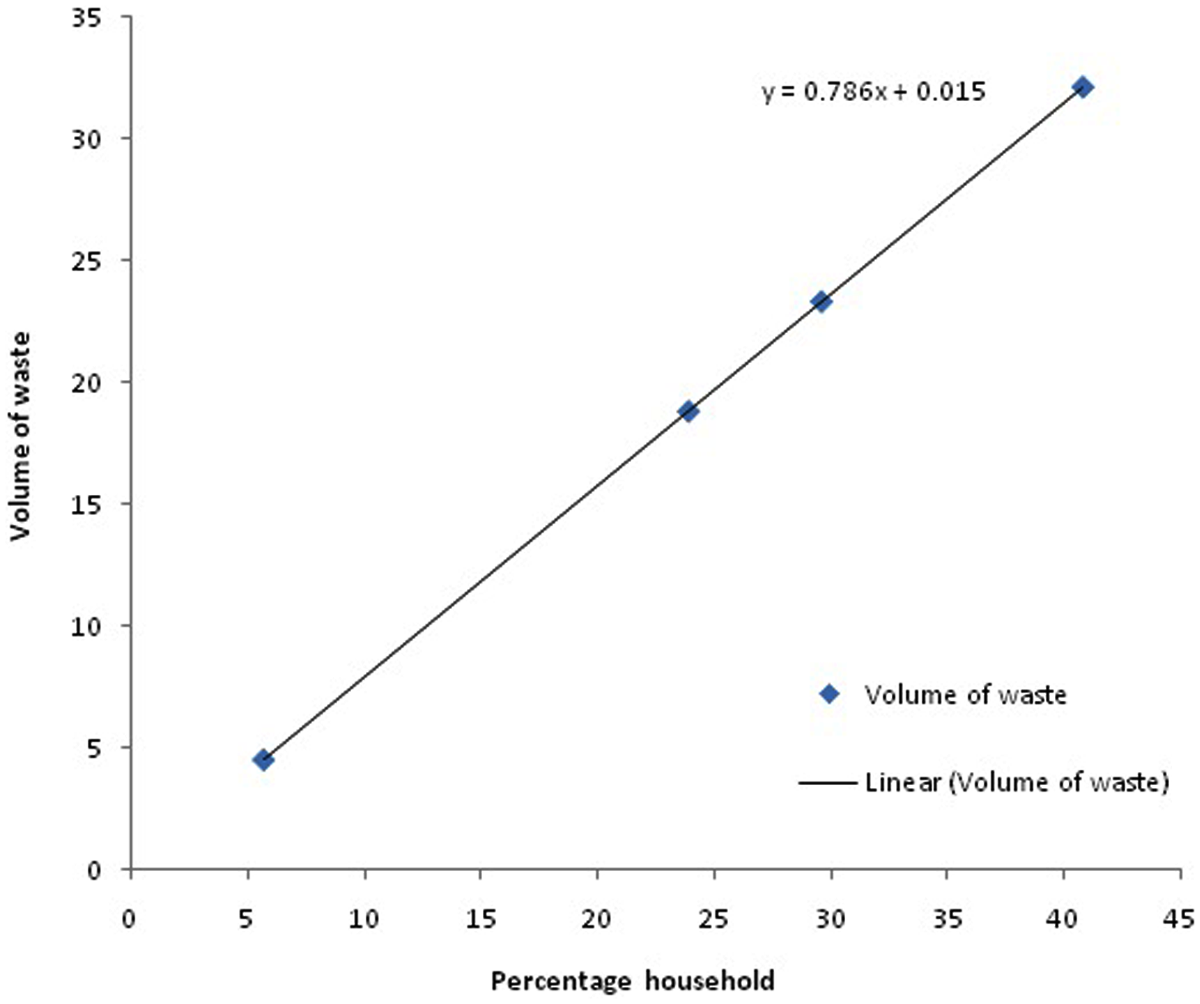
Predictive model for household solid waste generation in Aboabo
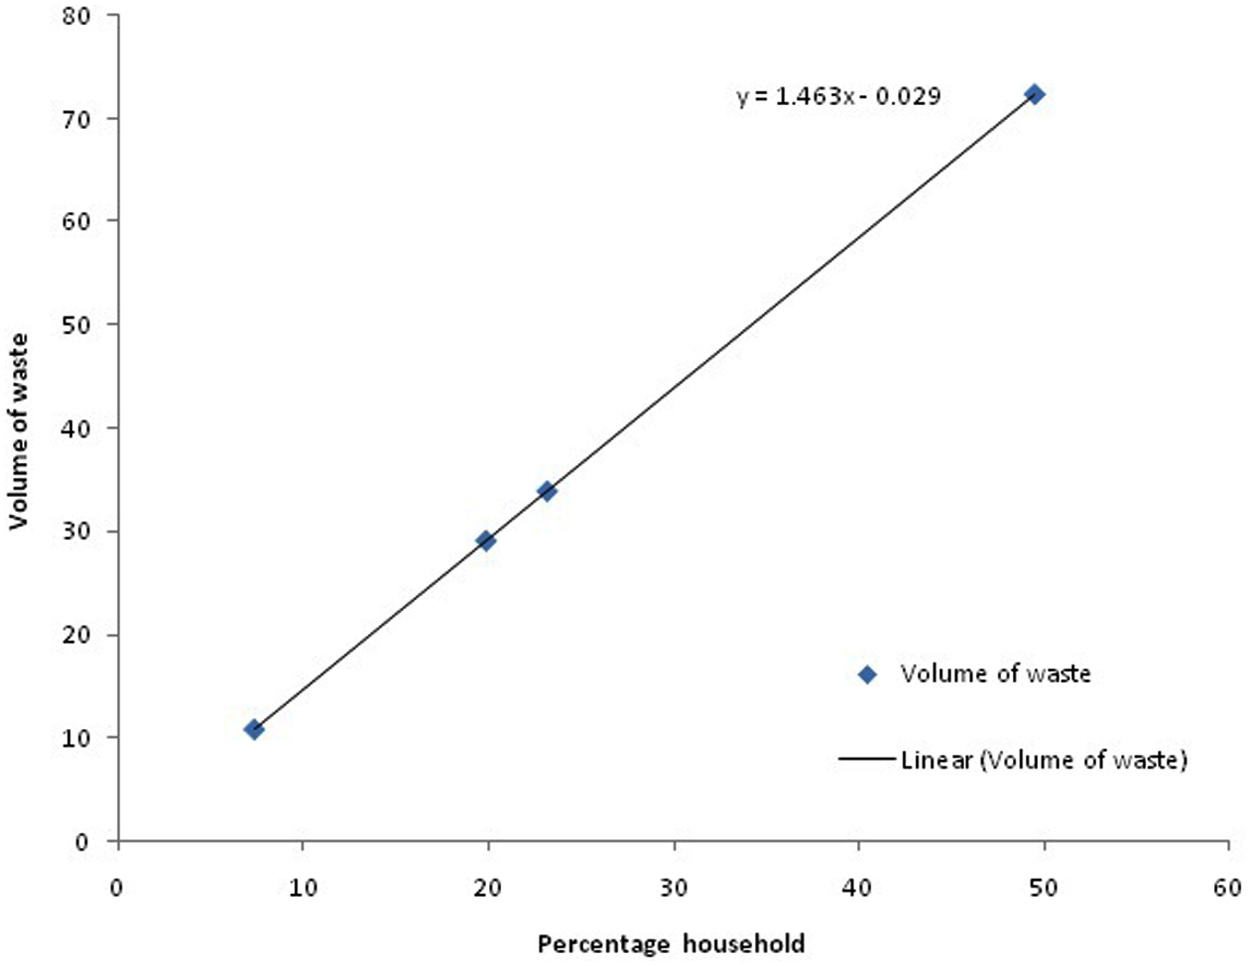
Predictive model for household solid waste generation in Asawase
IV. Conclusions
The two communities of Aboabo and Asawase have been adequately catered for in the provision of improved water coverage (pipe-borne water and protected wells), although not to a level that is convenient and easily affordable. Although most households use pipe-borne water for drinking and other domestic chores, the number of private connections to the metropolitan water supply network is very low. As a result, most households purchase pipe-borne water from neighbouring homes at considerably higher unit prices. Due to the extensive water supply network, women and children in the two communities cover relatively short distances to access water sources. However, in order to provide adequate water provision to the study communities, the municipal authorities and the Ministry of Housing and Water Resources should continue with the provision of public stand pipes, and at a lower cost than purchases made from neighbours.
Although the two communities have been relatively well catered for in the provision of improved water supply, there is an extremely low level of provision for improved sanitation. Few of the households have private toilet facilities, and most of those are shared between two or more households. The only provision available to 58 per cent of the population is the few heavily patronized public toilets, which are poorly maintained. Since these do not come close to meeting demand, there are high levels of open defecation and use of flying toilets, as well as indiscriminate disposal of children’s faeces in gutters, on open plots and in nearby bushes, thus contaminating the two communities’ environments with fecal matter.
Solid waste management is also poor in the study communities. More frequent collection of waste from community waste skips and a reduction in fees for the pay-to-dump scheme could help reduce indiscriminate dumping and consequently result in an improved environment in the study communities.
Footnotes
1.
The term “slum” usually has derogatory connotations and can suggest that a settlement needs replacement or can legitimate the eviction of its residents. However, it is a difficult term to avoid for at least three reasons. First, some networks of neighbourhood organizations choose to identify themselves with a positive use of the term, partly to neutralize these negative connotations; one of the most successful is the National Slum Dwellers Federation in India. Second, the only global estimates for housing deficiencies, collected by the United Nations, are for what they term “slums”. And third, in some nations, there are advantages for residents of informal settlements if their settlement is recognized officially as a “slum”; indeed, the residents may lobby to get their settlement classified as a “notified slum”. Where the term is used in this journal, it refers to settlements characterized by at least some of the following features: a lack of formal recognition on the part of local government of the settlement and its residents; the absence of secure tenure for residents; inadequacies in provision for infrastructure and services; overcrowded and sub-standard dwellings; and location on land less than suitable for occupation. For a discussion of more precise ways to classify the range of housing sub-markets through which those with limited incomes buy, rent or build accommodation, see Environment and Urbanization Vol 1, No 2, October, available at ![]() .
.
2.
Bartlett, S (2003), “Water, sanitation and urban children: the need to go beyond ‘improved’ provision”, Environment and Urbanization Vol 15, No 2, October, pages 57−70.
3.
WHO (2008), “Progress on drinking water and sanitation”, accessed 15 October 2008 at http://www.who.int/water_sanitation_health/monitoring/jmp2008.pdf, 58 pages; also Mara, D, J Drangert, N V Anh, A Tonderski, H Gulyas and K Tonderski (2007), “Selection of sustainable sanitation arrangements”, Water Policy Vol 9, pages 305–318; and Bartram, J, K Lewis, R Lenton and A Wright (2005), “Focusing on improved water and sanitation for health”, Lancet Vol 365, pages 810−812.
4.
Bogrebon, J A (1997), “Household demand for improved sanitation; water and sanitation for all: partnerships and innovations”, 23rd WEDC Conference, 1−5 September 1997, Durban, South Africa; also see reference 3, ![]() .
.
5.
WHO and UNICEF (2010), “Progress on sanitation and drinking water – 2010 update”, available at ![]() .
.
6.
See reference 4, Bogrebon (1997); also see reference 3, ![]() .
.
7.
Totsuka, N, N Trifunovic and K Vairavamoorthy (2004), “Intermittent urban water supply under starving situations”, 30th WEDC International Conference, 25−29 October 2004, Vientiane, Lao PDR; also Keraita, B, P Drechsel and P Amoah (2003), “Influence of urban wastewater on stream water quality and agriculture in and around Kumasi, Ghana”, Environment and Urbanization Vol 15, No 2, October, pages 171−178.
8.
Karn, K S and H Harada (2002), “Field survey on water supply, sanitation and associated health impacts in urban poor communities – a case from Mumbai city, India”, Water Science and Technology Vol 46, No 11−12, pages 269−275; also Altaf, M A (1994), “Household demand for improved water and sanitation in a large secondary city: findings from a study in Gujranwala, Pakistan”, Habitat International Vol 18, No 1, pages 45−55.
9.
Crook, R and J Ayee (2006), “Urban service partnerships, ‘street-level bureaucrats’ and environmental sanitation in Kumasi and Accra, Ghana: coping with organizational change in the public bureaucracy”, Development Policy Review Vol 24, No 1, pages 51−73.
10.
Nyarko, K B, S N Odai and K B Fosuhene (2004), “Optimizing social inclusion in urban water supply in Ghana”, First SWITCH scientific meeting, 9−10 January 2007, University of Birmingham, UK; also McMichael, A J (2000), “The urban environment and health in a world of increasing globalization: issues for developing countries”, Bulletin of the World Health Organization Vol 78, No 9, pages 1117–1126.
11.
See reference 9.
12.
See CHF International (2010) at ![]() .
.
13.
Ghanadistricts.com (2006), “Infant mortality rates”, accessed 21 October 2008 at http://www.ghanadistricts.com/districts/?r=2&_=6&sa=1823.
14.
Redlinger, T, J Graham, V Corella-Barud and R Avitia (2001), “Survival of fecal coliforms in dry-composting toilets”, Applied Environmental Microbiology Vol 67, No 9, pages 4036−4040.
15.
Kumasi Metropolitan Assembly (2006), “Kumasi: demographic characteristics”, accessed 21 October 2008 at http://kma.ghanadistricts.gov.gh/; also Altarejos, R G (1990), “Urbanization in the 21st century”, Population Forum Vol 1, pages 9−10.
16.
18.
Ghana Statistical Services (2005), MCI projections, available at ![]() .
.
19.
See reference 15.
20.
See reference 15.
21.
Devas, N and D Korboe (2000), “City governance and poverty: the case of Kumasi”, Environment and Urbanization Vol 12, No 1, April, pages 123−136; also Amuzu, A T and J Leitmann (1994), “Accra”, Cities Vol 11, No 1, pages 5−9.
22.
See reference 15.
23.
Neumayer, E (2001), “Convergence in access to safe water and adequate sanitation: an analysis across countries and time”, International Journal of Water Vol 1, No 2, pages 210−216; also see reference 9.
24.
Lagardere, J (2007), “Methodology for a health and hygiene baseline survey for WSUP projects”, MSc Thesis, Cranfield University, 127 pages.
25.
See reference 24, page 6.
26.
See reference 17.
27.
See reference 9.
28.
Khalil, N, L Rodic-Wiersma and M Khan (2009), “Solid waste management of a medium size Indian town: a case study of Aligarh city”, Global Nest Journal Vol 11, No 4, pages 535−549; also Zerayakob, B (2002), “Analysis and development of solid waste management system of Addis Ababa”, MSc Thesis, accessed 20 February 2009 at ![]() , page 64.
, page 64.
29.
See reference 15.
30.
International Labour Organization (2004), “Working out of poverty in Ghana: the Ghana decent work pilot programme”, accessed 7 July 2009 at ![]() .
.
31.
See, for example, Ngorima, E, Z Nkuna and G Manase (2008), “Addressing rural health and poverty through water sanitation and hygiene: gender perspectives”, accessed 13 November 2008 at ![]() .
.
32.
See reference 7.
33.
Clasen, T, G G Parra, S Boisson and S Collin (2005), “Household-based ceramic water filters for the prevention of diarrhoea: a randomized, controlled trial of a pilot programme in Colombia”, American Journal of Tropical Medicine and Hygiene Vol 73, No 4, pages 790−795.
34.
35.
See reference 7, Keraita, Drechsel and Amoah (2003).
37.
38.
See reference 35.
39.
See reference 9.
40.
Addo-Yobo, F N and M Ali (2003), “Households: passive users or active managers? The case of solid waste management in Accra, Ghana”, International Development Planning Review Vol 25, No 4, pages 373−389; also Cotton, A, R Scott and V Venkataraman (2002), “Sanitation: a problem of scale”, Paper presented at the World Development Report 2004 Workshop, 4−5 November, Eynsham Hall, Oxfordshire, UK.
41.
Bandara, N J, J P Hettiaratchi, S C Wirasinghe and S Pilapiiya (2007), “Relation of waste generation and composition to socioeconomic factors: a case study”, Environmental Monitoring and Assessment Vol 135, pages 31–39.