
Abstract
Technological advancements in the medical field are often slow and expensive, sometimes due to complexities associated with pre-clinical testing of medical devices and implants. There is therefore a growing need for new test beds that can mimic more closely the in vivo environment of physiological systems. In the present study, a novel bladder model was designed and fabricated with the aim of providing a pre-clinical testing platform for urological stents and catheters. The model is collapsible, has a Young’s modulus that is comparable to a biological bladder, and can be actuated on-demand to enable voiding. Moreover, the developed fabrication technique provides versatility to adjust the model’s shape, size, and thickness, through a rapid and relatively inexpensive process. When compared to a biological bladder, there is a significant difference in compliance; however, the model exhibits cystometry profiles during priming and voiding that are qualitatively comparable to a biological bladder. The developed bladder model has therefore potential for future usage in urological device testing; however, improvements are required to more closely replicate the architecture and relevant flow metrics of a physiological bladder.
Keywords
Introduction
The urinary catheter is deployed clinically to maintain drainage of urine from the bladder via the urethra, when a patient has difficulty urinating naturally. It is also used to administer liquids into the bladder, for treatment or diagnosis (i.e., urodynamic assessment) of bladder function. The catheter is a flexible tube and is typically manufactured from silicone, latex, or another similar material.1,2 Two main catheter types are available: the first is indwelling, which remains in situ over a prolonged period of time; the second is intermittent, which is for short-term use. 3 Both varieties impair the normal voiding cycle of the bladder, as urine drains constantly through the catheter as the bladder fills, rather than once the desire to void is felt and consciously instigated. Catheterisation is extremely common in both acute and long-term care; the US National Healthcare Safety Network has reported that catheterisation occurs in 45%–79% of adult critical care cases, 17% of those on medical wards, 23% on surgical wards, and 9% in rehabilitation. 4
Catheterisation is also a primary cause of urinary tract infection (UTI), which—due to the extensive use of catheters—imposes a significant clinical burden worldwide. A key contributor to Catheter Associated Urinary Tract Infection (CAUTI) is biofilm formation on the surface of the catheter within the bladder; the understanding of this process has been the focus of a significant body of previous research. 5 Studies investigating both biofilm formation and development of improved catheter designs have been limited due to the high cost and ethical implications associated with the requirement for animal models or patients, as well as the lack of suitable in vitro models. 6 As a result, a requirement exists for an artificial model that accurately replicates the physiological micturition cycle of the bladder and associated relevant flow metrics. Such a model would offer a significant improvement over existing in vitro models, which—in most cases—do not attempt to replicate the bladder mechanics nor include any mechanism of detrusor muscle contraction. In addition to catheter development, such a model could also be used in clinical training or in mechanistic research to evaluate the progression, prevention, or treatment of CAUTI.
In a urinary tract model system developed by Hobbs and co-authors, 7 the bladder was modelled by a solid glass container. Given that the study aimed at investigating the formation of kidney stones, a rigid reservoir was deemed suitable for studying the underlying biochemical processes and corresponding changes in fluid composition over time. This model however cannot replicate the physiological physical properties of a bladder, as the walls are not elastic nor compliant, thus realistic pressure-volume relationships cannot be obtained for urodynamic studies. Therefore, a physiological priming and voiding cycle cannot be replicated using this model.
A very limited body of research has been carried out to develop physical bladder models to be employed as a bench testing platform for medical devices. To the best of our knowledge, the model that replicates more closely a collapsible bladder has been developed by Wong et al. 8 It consists of a 3D-printed bladder model, which was manufactured for surgical simulation purposes, specifically for minimally invasive urethrovesical anastomosis. It replicates the size, thickness, and other physical characteristics of the bladder, which are all parameters that concern surgical handling and procedures. However, only limited information was provided about the manufacturing technique, the materials used, as well as the functional characterisation of the model. Authors did not evaluate the compliance of the model, therefore limiting its usability for urodynamic studies or as a model platform for evaluating the performance of endourological devices (such as ureteric stents or catheters).
Given the limitations of previously developed models, the aim of the present study is to develop a physical model of the urinary bladder which replicates its geometry, mechanical properties, and flow dynamics, with potential for future application in catheter testing and development.
Materials and methods
Design rationale of the bladder model system
The model system developed in the present study comprised a hollow bladder compartment, a mechanism replicating the activity of the detrusor muscle, and a structure to hold the different components in place and facilitate the system’s testing and usage.
The core rationale that guided the design of the system is that it should replicate key physical properties of the bladder and of the micturition mechanism, to achieve flow dynamic conditions that are relevant to the physiological urodynamics. In developing the system design, it was necessary to identify specific design criteria, both qualitative and quantitative. These aligned with the design rationale stated above but also with the utility of the model to end-users, who are likely to be biomedical engineers and clinical scientists working in the field of urinary catheter development.
It was determined that it would be necessary to replicate the following properties of the bladder to accurately model its urodynamic behaviour: geometry (in terms of overall dimensions), volumetric capacity, relevant orientation considering assumed body position, compliance, and relevant voiding flow rate. The specific design criteria are as follows:
The bladder is spheroidal in shape but is typically approximated as a spherical body, 9 which simplifies modelling and analysis. Therefore, to aid in comparison with published research, the same approximation was adopted when designing the bladder compartment in the present study.
Bladder size is most often described in terms of volume, as this is easily measured in vivo. The maximum bladder volume of approximately 800 cm3 is not reached in normal (physiological) conditions, as the detrusor muscle is activated at lower priming volumes between 200 and 500 cm3. 10 It was therefore decided that the bladder model should have an average internal volume of 300 cm3.
The bladder wall thickness is an important parameter in determining the compliance of the model; thus, it was decided that the model should replicate the nominal bladder thickness of approximately 3 mm. 11
The elasticity of the urinary bladder ensures its physiological functioning during the micturition cycle. The Young’s modulus of the bladder wall was assumed to be within a range of 5–50 kPa, as stipulated in previous research. 12
The diameter of the urethra in the model was defined to be 4.69 ± 1.09 mm, which is representative of published values in females. 13 The urethra should be located in a central, inferior position.
The diameter of the vesical-ureteric junction (VUJ), that is, the region where the ureter joins the bladder, was set to 3 mm. This is representative of values taken from porcine samples, due to a lack of human data in the literature. 14 The VUJ should be located in a superior position with respect to the urethra.
Crucially, the system must also be capable of replicating detrusor muscle contraction and the associated increase in bladder pressure.
The system must be compatible with clinical equipment and procedures currently used for urological assessment and treatment. The primary requirement is for the model to be compatible with indwelling catheter insertion, which is in line with its intended use in the development and testing of indwelling catheters. This should be achieved by the replication of bladder anatomy, specifically in terms of urethral diameter; however, attention should also be paid to the function of the internal sphincter, which must accommodate the catheter whilst maintaining a pressure seal. For this study, a Teleflex® 2-way Foley catheter (size 12 F, 4.7 mm) was employed as a model catheter.
Finally, the system should also be compatible with existing catheter-based urological testing equipment, namely those required to conduct cystometry.
Manufacturing of the bladder model compartment
The bladder model compartment was designed to comply with the criteria described above. A custom developed manufacturing technique was specifically established to fabricate a compliant and hollow model with the desired physical properties. The detailed description of the design and manufacturing steps is provided in the Appendix. Briefly, the model is fabricated using a 2-part liquid silicone (EcoflexTM 00-35 Fast, Smooth-On Inc.), a 3D-printed 2-part mould, and a custom developed rotational moulding technique, to achieve even wall thickness throughout the model. Once cured, the silicone is semi-transparent, flexible, and compliant, and has modulus E = 69 kPa. The fabricated model met the geometric requirements, with wall thickness of 3 mm, ureteral internal diameter of 3 mm, urethral internal diameter of 4.7 mm, and bladder volume of 310 cm3.
Pneumatic artificial muscle net
A pneumatic artificial muscle (PAM) net was identified as a component system that would replicate the physiological mechanics of detrusor muscle contraction, assuming that a physiologically relevant voiding pressure profile would occur as a result. The concept behind PAM has been utilised in various robotics and medical applications since 1980s, ranging from rehabilitation assistance to the handling of various delicate objects in complex geometries.15,16 In the present study the detrusor muscle contraction was simulated using pneumatic actuators; specifically, McKibben air muscles. 17 A McKibben air muscle comprises an inner inflatable tube, enclosed within a mesh fibre wrap that is secured at each end. The tube is connected to an air flow supply at one end and is closed at the other end. As air is supplied, the inner compliant tube inflates and its diameter increases; this causes an increase in diameter of the outer mesh wrap to accommodate the inner tube’s expansion. However, the woven mesh of inextensible fibres must also shorten in length to achieve the greater diameter. Thus, as the air muscle is inflated, it both increases in diameter and shortens in length (see Figure 1(I) and (II)), in a manner similar to a smooth muscle during contraction. Due to the small air volumes to be inflated, estimated to be approximately 40 cm3 per PAM, the contraction occurs rapidly.
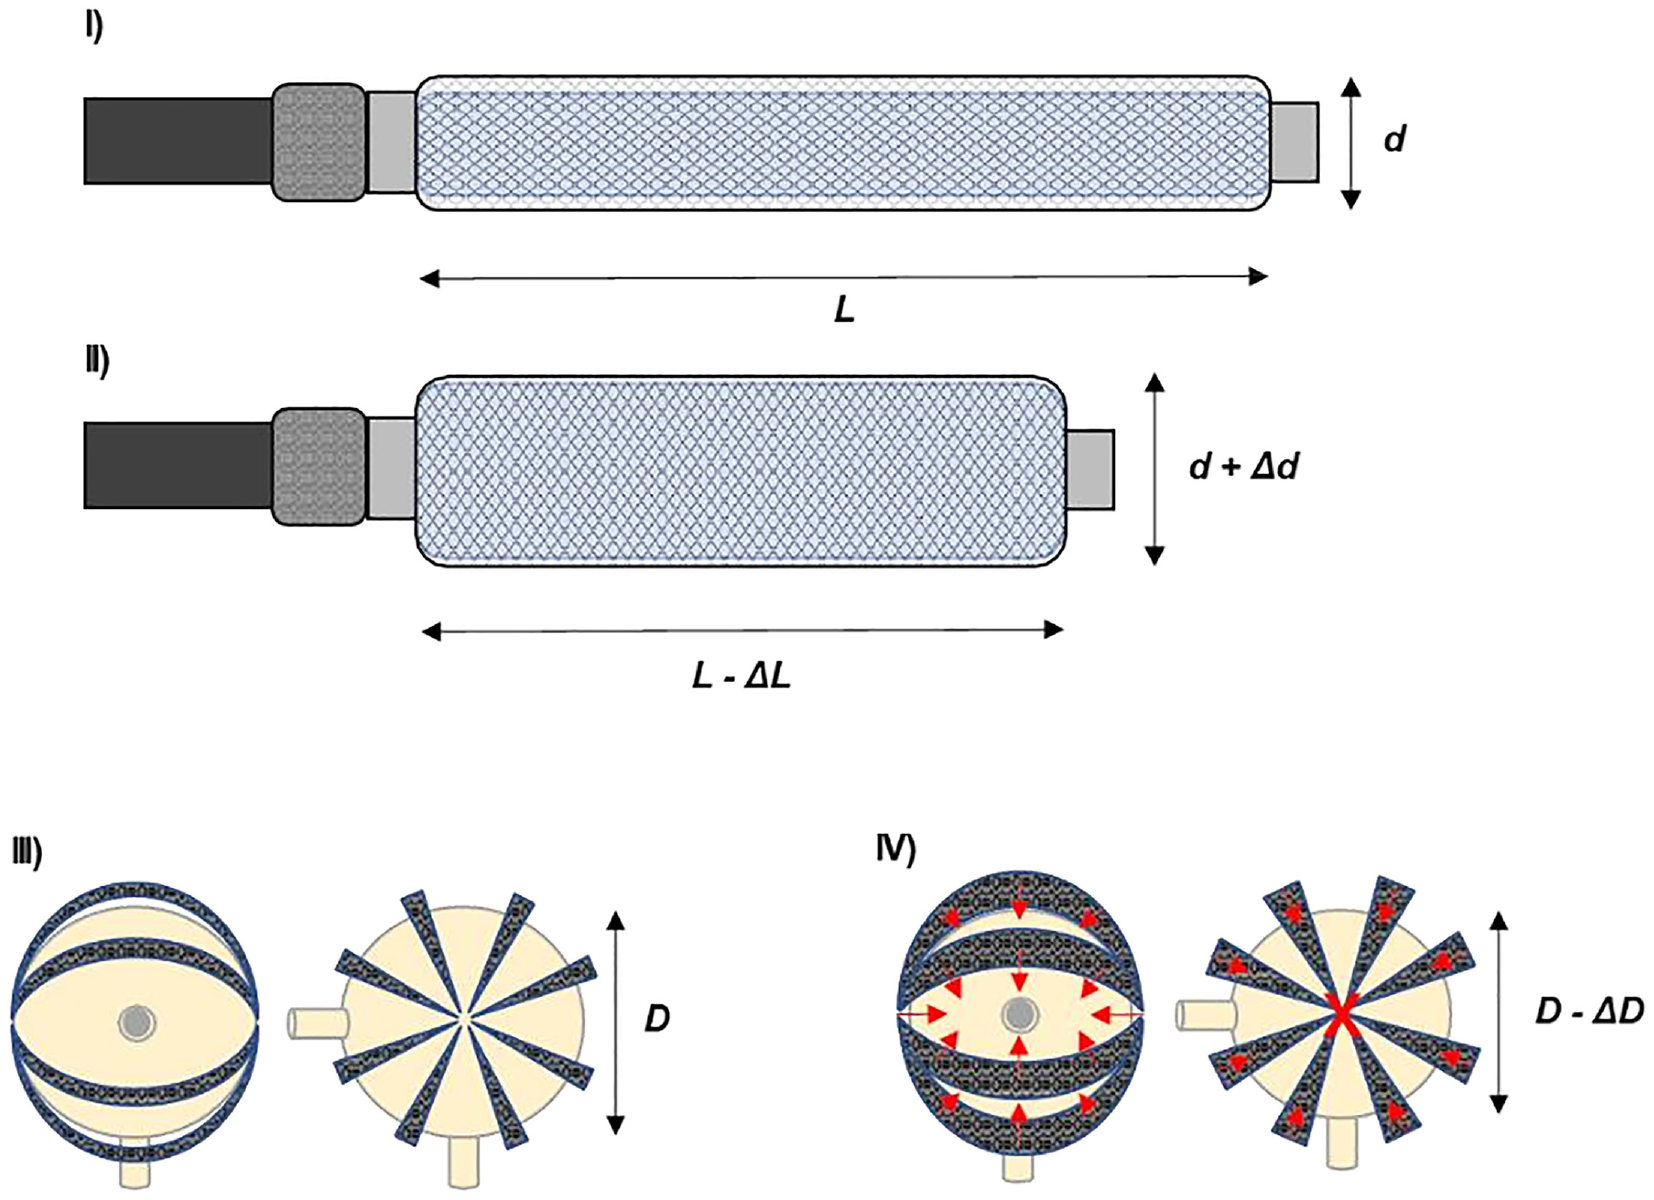
Schematic representation of a McKibben air muscle PAM in (I) uninflated and (II) inflated state. Tube inflation results in increased diameter and decreased length of the outer mesh. A PAM net arrangement around the spherical bladder model, comprising 8 PAMs in total, is shown in (III) during the uninflated, relaxed state, and in (IV) during the inflated, contracted state. A simplified representation of force vectors (in red) resulting from PAM contraction is also shown. The “X” in the centre of the model denotes a force vector that is normal to the plane.
To achieve a uniform pressure exerted over the entire surface of the bladder, it would be necessary to utilise several PAMs arranged in a net around the entire bladder and to inflate these simultaneously, which would require a multi-channel air supply. With the net encompassing the entire surface of the bladder and with all PAMs fixed at one point on opposite sides of the bladder spherical model, the primary axis of contraction would be between these two points due to the shortening of the PAM. This would be complemented by the increased PAM diameter that would exert a force upon the bladder perpendicular to the PAM along its length, resulting in a spatially more uniform contraction. The pressure exerted by the net could be controlled through changes to the number and specifications of PAMs. The arrangement is detailed in Figure 1(III) and (IV). One limitation of this concept is the difficulty in controlling the pressure exerted by the PAM net, which would be challenging to model prior to experimentation and difficult to adjust without significant changes to PAM equipment.
The design process of the PAM began by determining the approximate dimensions of the individual PAM elements. The circumference of the bladder model was calculated to be 283 mm; due to the design requirement for PAMs to be secured centrally on either side of the model, each PAM would need to extend over half of this circumference (i.e., 141.5 mm). The rationale behind this approach was that by setting the initial length of PAMs to closely fit the main bladder body, any shortening or increasing of diameter as a result of inflation would necessarily exert a pressure on the surface of the bladder model. This nominal length was increased of 15% to accommodate fixings, to give a total PAM length specification of 162 mm.
A suitable type of inflatable tube was identified to be the QualatexTM 43907, with uninflated length of 300 mm, uninflated diameter of 5 mm, and inflated diameter of 25 mm. These balloons could be cut to length and sealed with a knot; additionally, their elasticity allowed for a variety of nozzles to be used. A suitable outer mesh was then required, which should be large enough at its minimum diameter to accommodate the uninflated inner tube, but small enough that the diameter must increase (thus achieving the reduction in length) to accommodate the inflated inner tube, giving a range of 6–24 mm nominal diameters. As a result, 10 mm diameter polyester braided tubing with an expansion ratio of 3:1 was selected, which could be cut to length as required.
Multi-channel pneumatic manifold design
The requirement to inflate all PAM elements simultaneously led to the development of a multi-channel manifold to share a single pressurised air supply between a number of PAMs. The developed design was based upon a generic 42 mm polyvinyl chloride (PVC) pipe, which could be used along with laser-cut acrylic end-plugs to rapidly fabricate a manifold. Due to the 42 mm diameter of the pipe, it was necessary to reduce the number of PAM elements within the net from eight to six, as this was the maximum number of 1/8” British Standard Pipe Taper (BSPT) 6 mm threaded connectors that could be accommodated within the area of the end cap. Solidworks software (2019, Dassault Systèmes) was used to design the manifold end-caps, with technical drawings produced for use with the laser-cutter hardware. Figure 2(I) shows the full assembly and corresponding technical drawings.
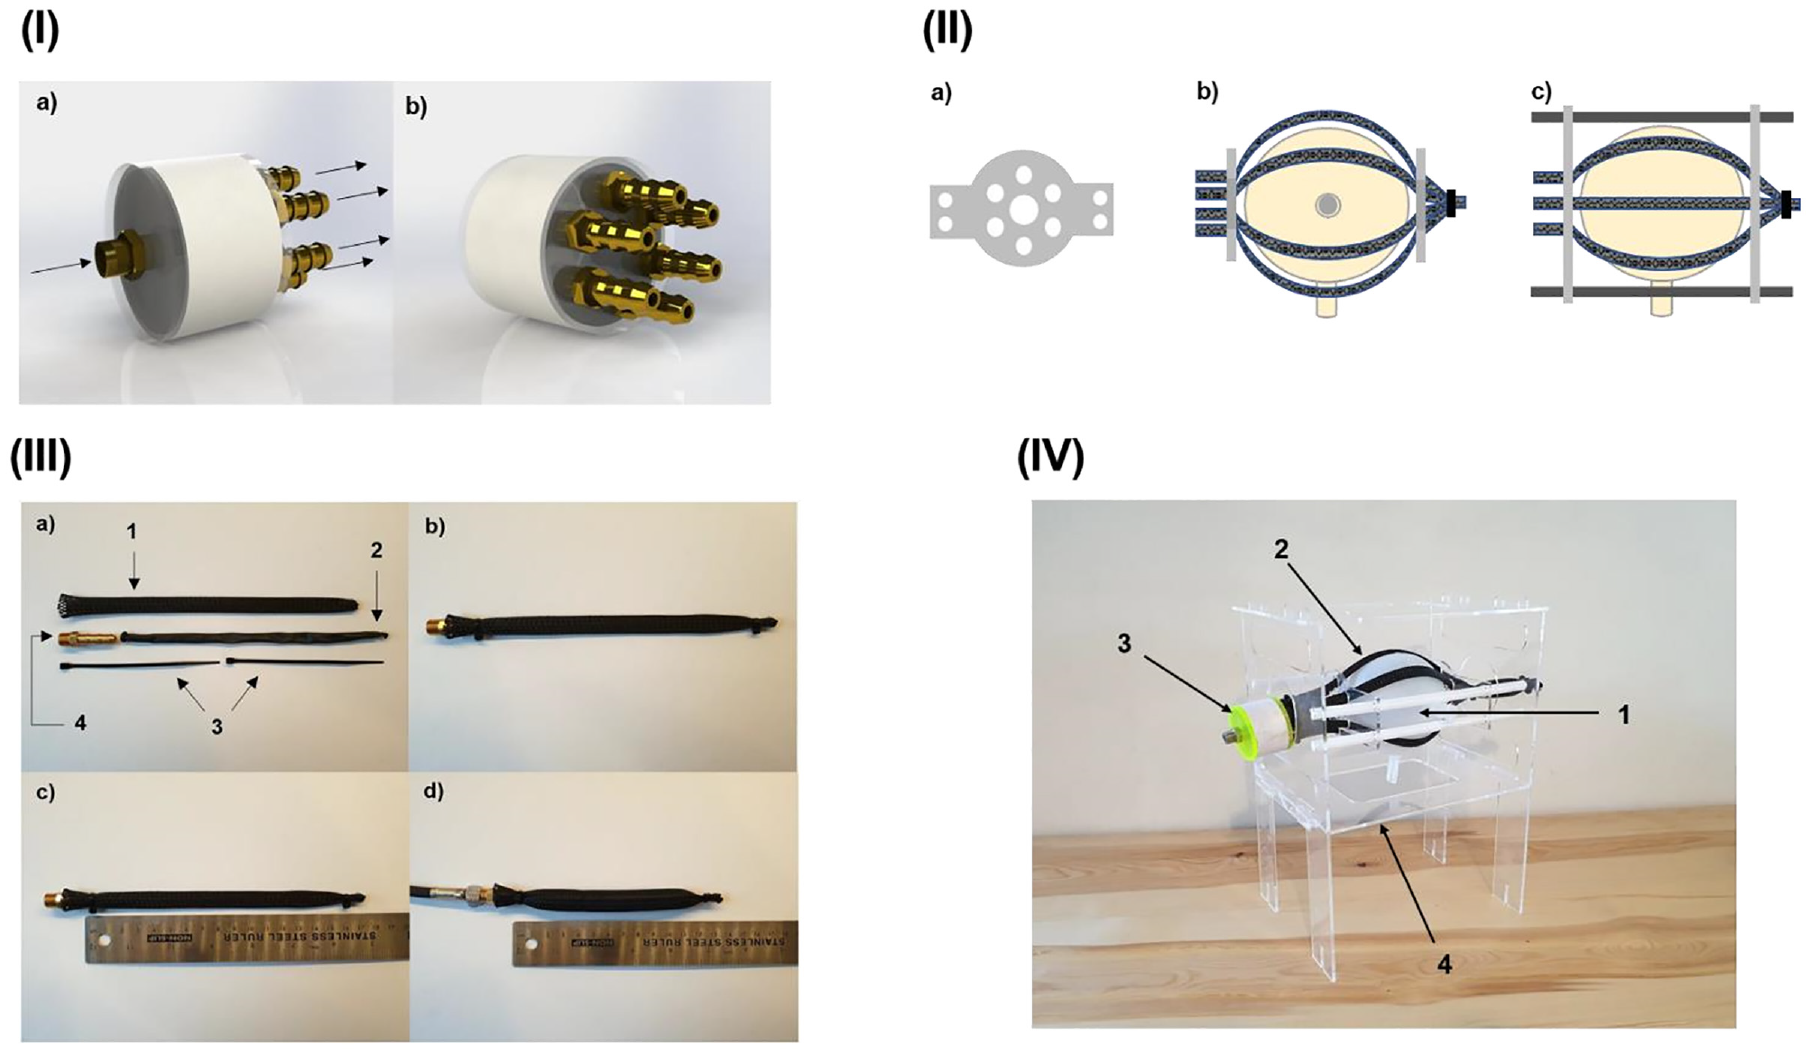
(I) Solidworks render of manifold assembly, comprising a 42 mm PVC pipe, two laser-cut acrylic end-caps, six 1/8” BSPT 6 mm threaded barbed connectors, and one 1/8” BSPT 6 mm threaded connector. (I-a) Shows the input end, with one 1/8” BSPT 6 mm threaded connector for connection to the air supply. The flow direction is denoted with arrows. (I-b) Shows the output end, with six 1/8” BSPT 6 mm threaded barbed connectors for connection to PAMs. (II) Schematic of PAM net design. (II-a) Shows the plate; with six evenly spaced holes for PAMs arranged around the centre and four holes to accommodate rails on the outer “wings.” (II-b) Shows the two plates assembled with PAMs around the bladder model. (II-c) Shows II-b from above and includes the rails, which are omitted in II-b. (III) Overview of parts, assembly and contraction of single example PAM. (III-a) Shows all parts prior to assembly; III-a-1: 10 mm diameter outer mesh wrap, III-a-2: 5 mm diameter inner inflatable tube, III-a-3: two 2.5 mm cable ties, III-a-4: 1/8” BSPT male × 6 mm barbed pneumatic fitting. (III-b) Shows the assembled PAM. (III-c) Shows the active length of the relaxed PAM as ~160 mm. (III-d) Shows the active length of the contracted PAM as ~120 mm, when pressurised to 80 kPa. (IV) Final bladder model assembly, comprising: IV-1: main body, IV-2: PAM net, IV-3: multichannel manifold, and IV-4: frame.
A net was subsequently designed to maintain the desired arrangement of PAM elements in both the relaxed and contracted state, without impeding the contraction mechanism. The chosen design utilised two plates, located at opposite sides of the bladder, which the six PAM elements would pass through. The plates would be mounted on a rail system, to allow linear movement in the horizontal plane while also providing a means of securing the model to a free-standing frame without impeding contraction. The overall shape of the plates was set as circular to accommodate a circular array of PAM guide holes, with two lateral “wing” elements to allow mounting on rails. Figure 2(II) shows a schematic of the plate and the overall PAM net design.
Fabrication and assembly of the system
Concerning the manufacturing of the PAM system, the inner tube was cut to length and knotted at the cut end, and the outer mesh was then cut 15 mm longer to ensure complete coverage of the tube. A heat source was applied to each cut end of the outer mesh, to fuse the end fibres and prevent fraying; whilst still molten, one end was pinched together to form a permanent end cap once solid. The inner tube was fed into the outer mesh using an intuitive pinching and pulling motion and—once fully inserted—it was secured at the closed end using a 2.5 mm cable tie. At this stage, the open end of the inner tube was connected to a means of filling, that is, air-line nozzle or similar, through a 1/8” BSPT male × 6 mm barbed pneumatic fitting, which could be connected directly to an air supply or threaded into a manifold. The outer mesh was then positioned to ensure coverage of the inner tube and connector union, and then secured in place using a second 2.5 mm cable tie. Figure 2(III) provides an overview of the individual PAM parts and their assembly, and the contraction of the mesh upon inflation.
The end-cap parts were cut from a 3 mm acrylic (RS Components) and bonded concentrically using a twopart epoxy (Gorilla epoxy) resin, giving a total thickness of 6 mm. The 8.4 mm holes were then tapped using a 1/8” BSPT tap bit through the full thickness. Both end-caps were then bonded to the PVC pipe using the same two-part epoxy resin. Finally, PTFE thread sealant tape (RS Components) was applied to the 1/8” BSPT threaded connectors, which were then fitted into the tapped holes.
The final assembly of the bladder model required the PAM net to be connected to the multi-channel manifold and through the PAM net plates, before finally positioning the bladder compartment within the PAM net. The final assembly, including the PAM net, is shown in Figure 2(IV).
Cystometry: Replication of the micturition cycle
To validate the model’s performance, cystometry urodynamic testing was performed on the model. The experiment was conducted at the University Hospital Southampton NHS Foundation Trust (UHS) with the assistance of clinical staff. In line with the aims of the study, a successful test would replicate the intravesical pressure (Pves) profile of the micturition cycle, the rise in detrusor pressure at the beginning of the voiding phase, as well as capacity and void flow rate of a healthy bladder. The equipment used was: Voilamart air compressor, 38.1 mm blunt point Luer Lock needle, 3 mm diameter Luer slip stopcock, 2.5 mm cable ties, and the Albyn Medical Hermes Urodynamics System. The latter comprised a computer, a display, a printer, a peristaltic pump, a Pves pressure transducer, a two-lumen 8 F (2.7 mm) 40 cm cystometry catheter filling sensor, a flowscale, and a saline solution drip bag. In this configuration the Hermes system records Pves, the volume of infused fluid (Vinf), the volume voided (Vura), and the void flow rate (Qura).
First, the model ureter and urethra were cut to a length of 10 mm; they were then punctured (since these are manufactured sealed) using a 38.1 mm blunt-point needle, which was then removed. The 3 mm diameter Luer slip stopcock was then pushed into the urethra and secured by fastening a cable tie around the urethra. At this stage, the model frame was placed onto the urodynamics bed, positioned over the flowscale, and the air compressor (off) flexible hose 1/8” connector was connected to the manifold. The bladder was then placed into the PAM net with the ureter at the bottom and the urethra at the front center, ensuring that the model was between the PAM net plates and that the PAM elements were equally spaced around the model. The cystometry catheter was then inserted into the ureter; this was achieved by placing the blunt needle into the flow hole at the tip of the catheter, to push the catheter through the prepunctured hole. The catheter was inserted until it made contact with the opposite internal wall of the bladder; the needle was then removed, and a cable tie tightly fastened around the ureter. Air was then evacuated from the model by opening the stopcock and squeezing the bladder by hand, then closing the stopcock. The general experimental set up is shown in Figure 3(I) and the model set up shown in Figure 3(II).
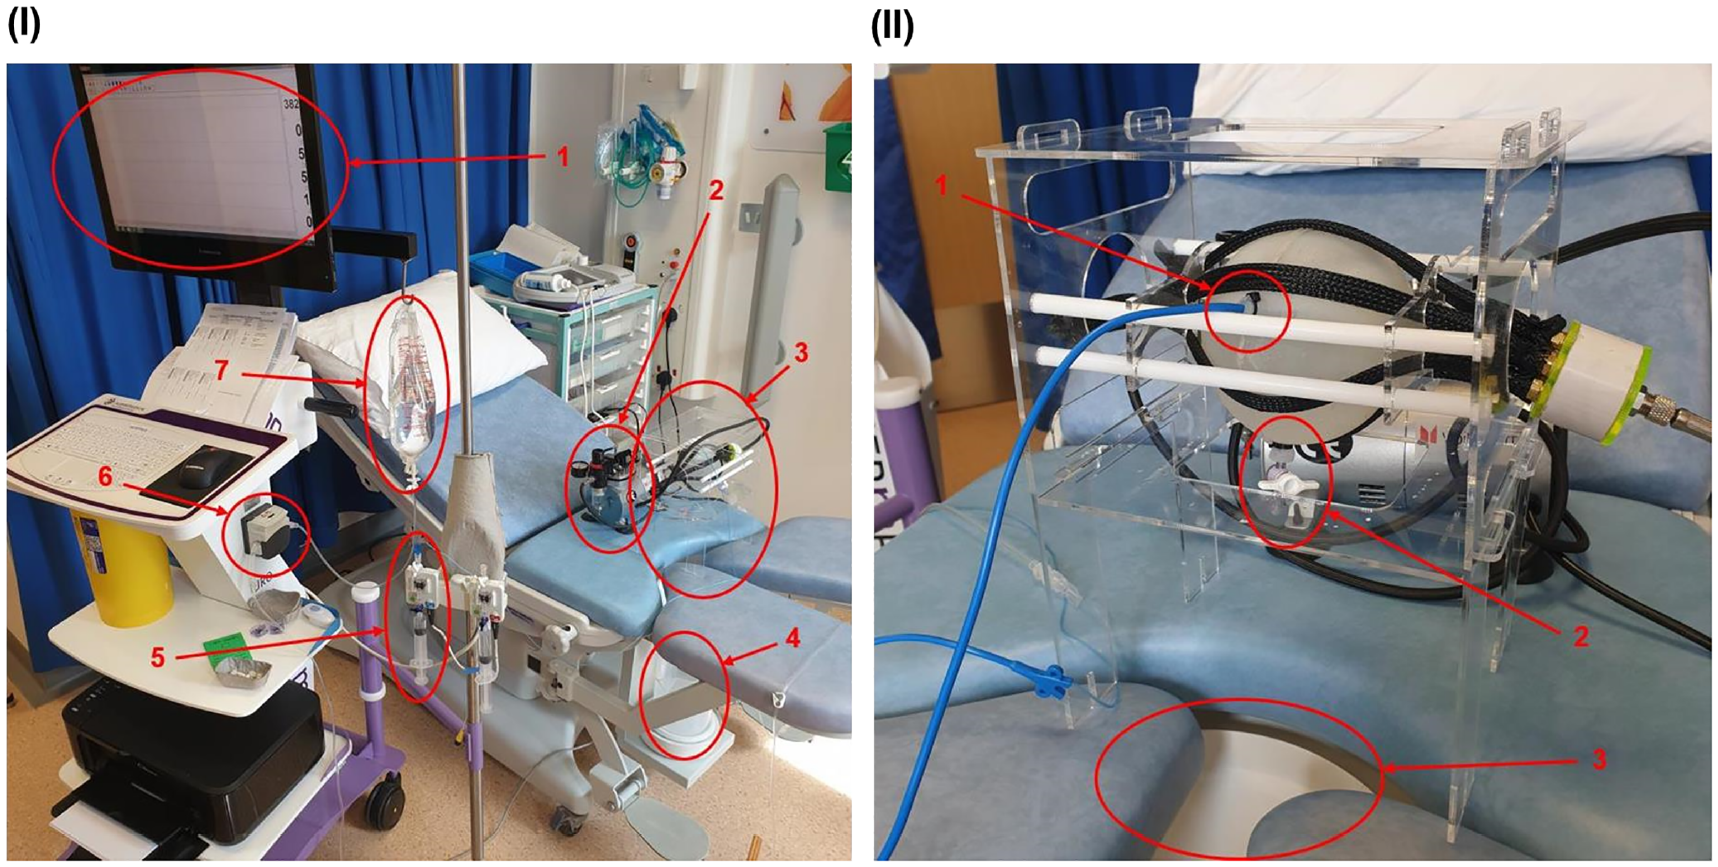
(I) Experimental setup for cystometry. I-1: Hermes urodynamic system display, I-2: air compressor, I-3: model bladder assembly, I-4: flowscale, I-5: Pdet pressure transducer, I-6: fill pump, I-7: saline drip bag. The bladder (I-3) must be approximately levelled with the pressure transducer (I-5) to ensure accurate results. (II) Experimental setup of bladder for cystometry. II-1: 8 F (2.7 mm) two-lumen cystometry catheter inserted into the ureter, II-2: Luer lock stopcock inserted into the urethra, II-3: flowscale funnel positioned directly beneath the urethra.
Two independent cystometry procedures (referred to as “run 1” and “run 2” from herein) were performed.
The test began with the initiation of the recording function of the Hermes system through its user interface. The filling phase then began with the Hermes fill pump being turned on, filling the bladder at a rate of 0.83 ml/s (50 ml/min). During filling, the air compressor was turned on for a period of 1 s on two occasions in run 1 and three occasions in run 2; this was to simulate the patient being asked to cough, which is often used clinically to establish correct functioning of the cystometry equipment, since the cough should register as a corresponding spike in Pves. These instances were labelled as ‘cough’ on the output trace of the Hermes system. Once Vinf had reached 500 ml, the clinician reported this and turned the Hermes fill pump off. The air compressor, which had been set to deliver 100 kPa, was then turned on and allowed to run for 2 s, the urethral stopcock was then opened, and voiding began. After a further 90 s, the stopcock was closed, and the Hermes recording ended. Data was then printed directly from the terminal.
Results
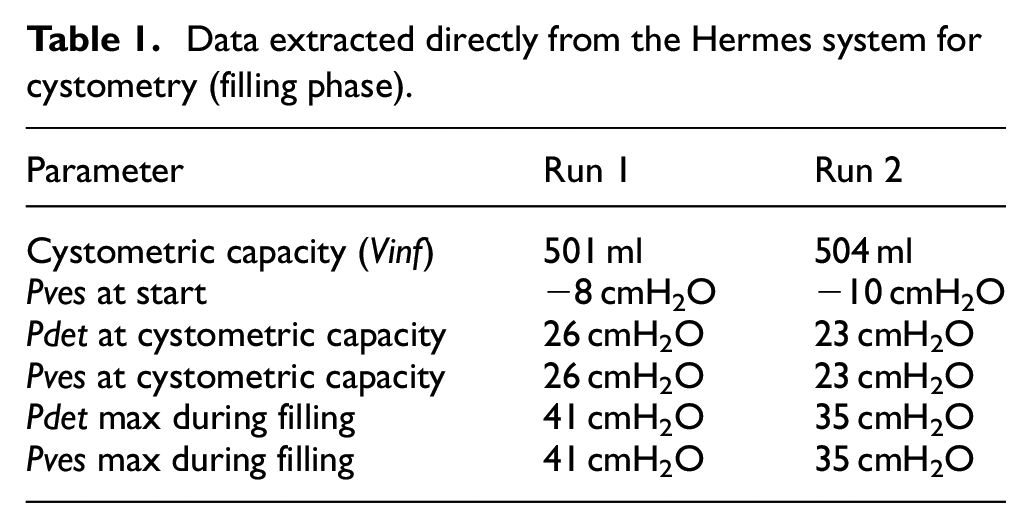
Figure 4 shows the results of the cystometry urodynamic testing carried out on the model, while Tables 1 and 2 show the numerical data points taken directly from the Hermes system. Two artefacts exist within Figure 4(a). Firstly, Pves and Pdet have an initial value of −8 cmH2O; this should be 0 cmH2O and the mismatch is likely caused by the pressure transducer being higher than the bladder. This can be corrected by offsetting all Pves and Pdet values. Secondly, the plots for both Pves and Pdet include noise around event 3; this was due to the bladder position within the PAM net being adjusted before and after the event (it should thus be disregarded). Figure 4(b) includes two artefacts; firstly, Pves and Pdet are initially −10 cmH2O and so should be offset; secondly, both Pves and Pdet include significant noise in the form of a sustained oscillation of ±5 cmH2O for the duration of the fill phase, which is likely as a result of the flow pulsation generated by the peristaltic pump and the proximity of the catheter tip to the VUJ within the bladder. Pabd was not measured in this study and will not be considered.
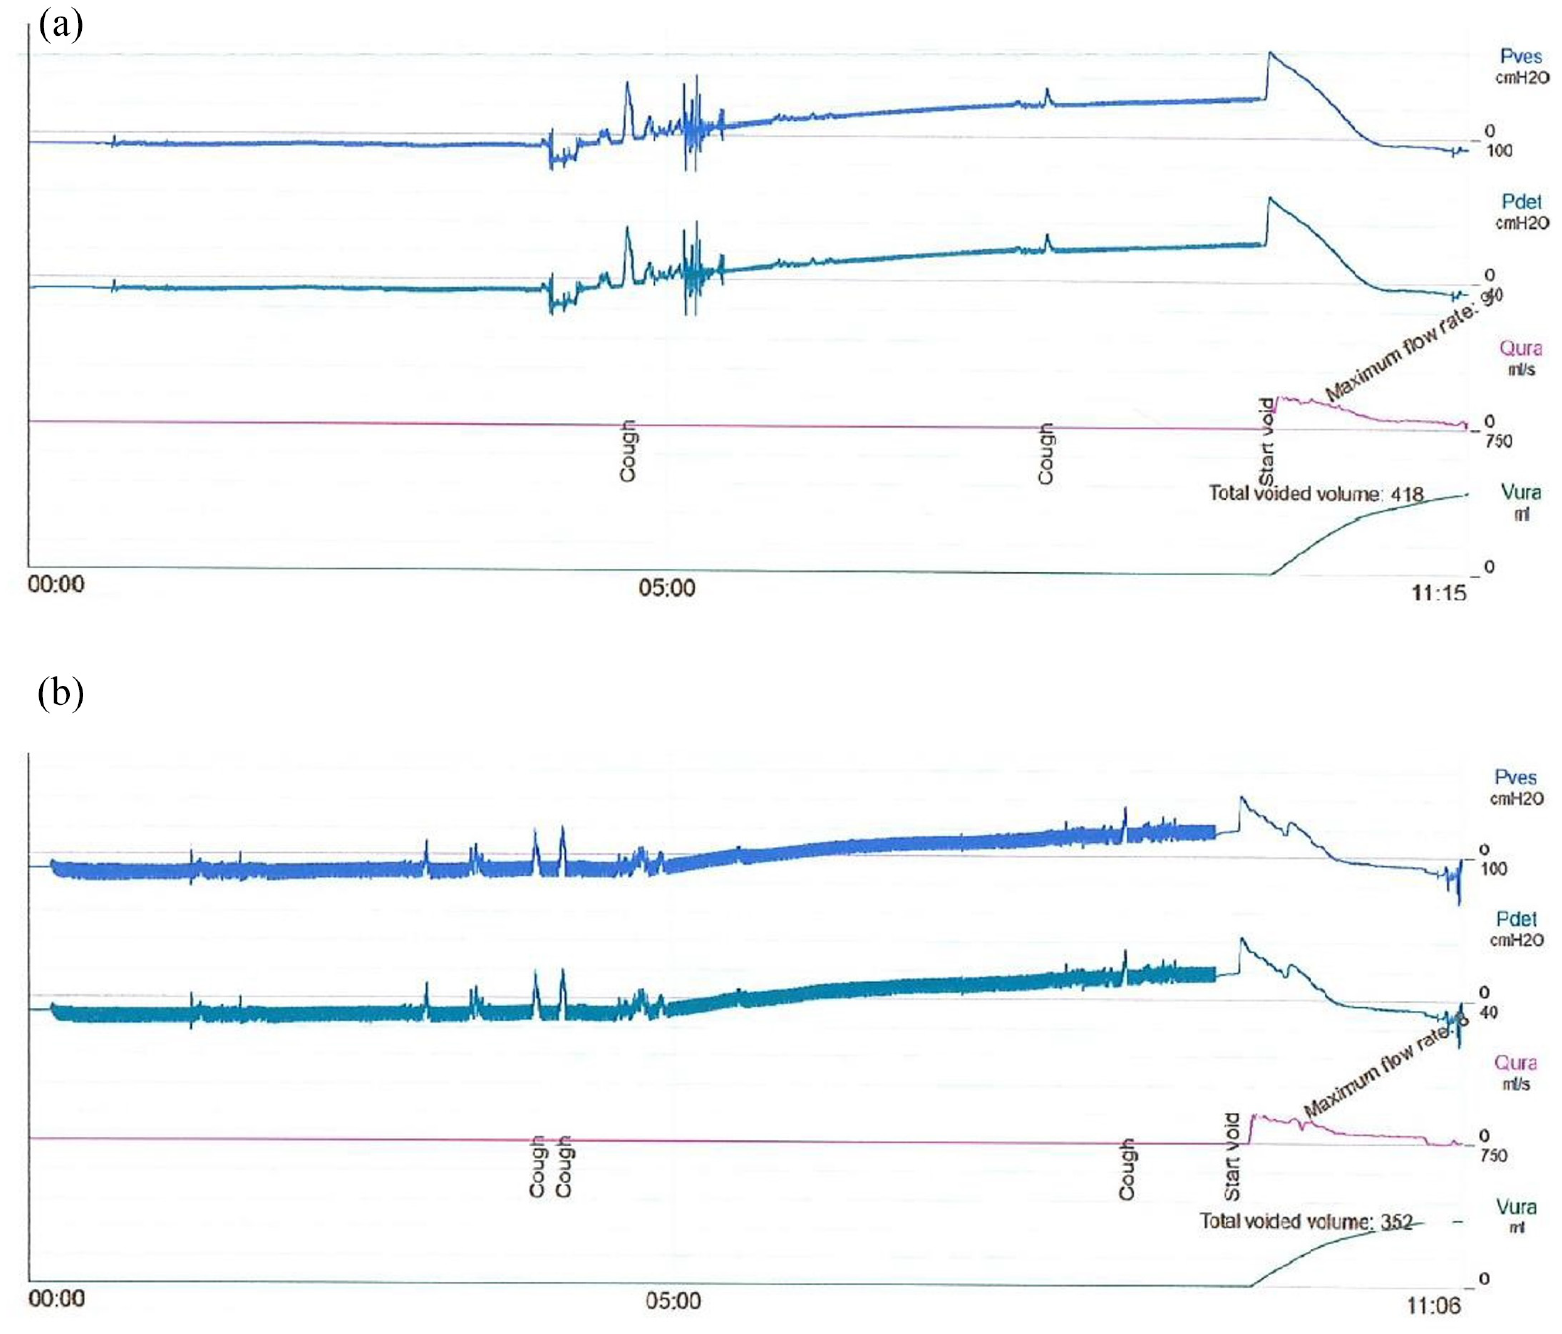
Comparison of run 1 (a) and run 2 (b) of cystometry profiles obtained on the bladder model. These include temporal profiles of Pves, Pdet, Qura, and Vura.
Data extracted directly from the Hermes system for cystometry (filling phase).
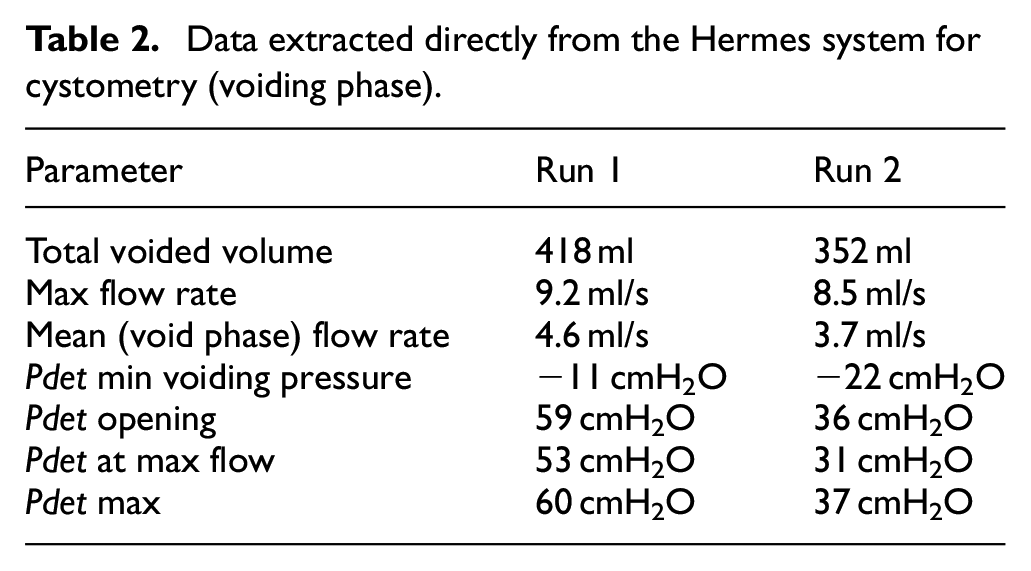
Data extracted directly from the Hermes system for cystometry (voiding phase).
Micturition cycle pressure profile
Generally, the pressure profile observed during micturition was consistent between the two runs. It was characterised by a steady Pdet for the initial 270 s, followed by a steady increase at a mean rate of 0.113 cmH2O/s and 0.110 cmH2O/s between 270 s and 570 s for run 1 and run 2, respectively. During the voiding phase, from approximately 570 s, both runs showed an initial spike in Pdet followed by an initial rapid pressure drop. This was followed by a reduction (at a lower rate) until initial values were restored and voiding ceased. In run 1, the initial voiding pressure spike saw an immediate increase of 33 cmH2O, followed by a rapid, steady drop in pressure of approximately 64 cmH2O at a rate of 1.07 cmH2O/s which then reduced to a much slower, steady drop of approximately 5 cmH2O at a rate of 0.14 cmH2O/s. In run 2 the voiding phase had a different profile; the initial voiding pressure spike saw an immediate increase of 19 cmH2O, followed by a rapid drop of approximately 20 cmH2O at a rate of 0.8 cmH2O/s. At this point, there was a second rapid increase of approximately 5 cmH2O and then a second rapid drop of approximately 30 cmH2O at a rate of 1.2 cmH2O/s; there was then the same slower, steady drop of approximately 5 cmH2O at a rate of 0.08 cmH2O/s.
Voiding flow rate
The voiding flow rate (Qura) was similar in both runs. The profile showed an initial rapid rise to 9.2 ml/s in run 1 and 8.5 ml/s in run 2, coincident with the start of the rapid drop in Pdet, caused by the opening of the urethral valve. Both runs then showed a two-stage reduction in flow rate; an initial higher rate followed by a second lower rate, where the change was coincident with the reduction seen in Pdet. Over the full void phase, the mean value was 3.7 ml/s and 4.6 ml/s for run 1 and run 2, respectively.
Evaluation of model compliance
The Pdet pressure profile in the filling phase was similar in both runs, showing negligible change in the first 270 s, representing a Vinf of approximately 225 ml. From around 270–570 s (500 ml) both plots show an approximately linear increase in Pdet; in run 1, it increased from −8 cmH2O to 26 cmH2O (a total increase of 34 cmH2O) and, in run 2, it increased from −10 cmH2O to 23 cmH2O (a total increase of 33 cmH2O).
Discussion
Micturition cycle pressure profile
The two runs (see Figure 4) show qualitatively consistent results and produced pressure profiles that captured features of the dynamic behaviour of a human bladder. Representative curves for the healthy bladder are shown in the work by Mahfuz et al. 18 for comparison. All data points obtained in this study from the Hermes system are included in Tables 1 and 2. Where analysis has been based on data not reported in these Tables, this has been extracted from Figure 4, as electronic data was not available. As a result, some analysis is based on estimated values.
The filling phase was consistent between runs, with both run 1 and 2 showing a stable Pdet pressure for approximately the first 210 ml of Vinf, before undergoing a steady increase in pressure until Vinf reached a maximum value of 500 ml. This is generally in accordance with the expected behaviour of a bladder. 18 Since the bladder model has a nominal internal volume of 310 ml, it follows that any increase in pressure due to deformation of the bladder wall would not occur until Vinf reached this value; however, this does not consider the volume of air in the bladder prior to priming, which would not have been negligible as the bladder was not completely evacuated. Approximately ∼100 ml of air could be reasonably expected to remain within the bladder and potentially explain the early onset of the rise in pressure. In future experiments, greater effort should be made to evacuate air more effectively from the model prior to cystometry; this could be easily achieved via the second channel of the cystometry catheter. From Vinf of 210 ml to 500 ml, a steady increase in Pdet of approximately 0.11 cmH2O/s is observed in both run 1 and 2, giving a total pressure increase of ∼33 cmH2O across the entire fill phase. The expected increase in Pdet for an human bladder undergoing cystometry is of 6–10 cmH2O; thus, the model is not representative of the physiological bladder in this metric.18,19 A possible explanation for this is the cystometric capacity (maximum Vinf) selected for the experiment, which was 500 ml. This value is 190 ml higher than the model’s nominal geometric capacity of 310 ml, meaning the bladder has had to elastically deform to accommodate the additional Vinf, resulting in the observed increase in pressure.
Selection of appropriate capacity for the model is problematic. The current value of 310 ml was chosen as it fell within the 300–500 ml found in the literature; however, this range was representative of the value of Vinf at which patients reported a strong desire to void, rather than the geometric capacity. 10 It is likely that a model with a higher nominal geometric capacity, for example, 500 ml, would experience a much smaller increase in Pdet during filling up to a cystometric capacity of 500 ml. Another possible explanation for the point at which the pressure increase begins to occur could be the position of the catheter itself. The catheter was inserted until it made contact with the opposite internal wall of the model, which is in line with the normal clinical practice. Since the ureteric access, which is positioned at approximately half height of the model (see Figure 3(II)), was used for catheter insertion, the tip of the catheter would only become submerged at around half cystometric capacity (Vinf = 155 ml). From this point the hydrostatic pressure of the fluid would be measured by the catheter. This hypothesis could be tested in future work by determining catheter tip position prior to filling, then observing the fill level (visible through the semi-transparent bladder walls) and recording the point at which the fluid submerged the tip.
Both runs showed qualitatively similar profiles in the voiding phase, with an initial spike in Pdet followed by a rapid, steady decrease. This was then followed by a slower steady decrease until a return to initial values. The initial spike is a result of the simulated detrusor contraction, with an increase of 33 cmH2O and 19 cmH2O in run 1 and 2, respectively. The literature reports an expected increase of ∼50 cmH2O for a physiological bladder; therefore, the pressure value in run 2, in particular, appears to be lower than desired. 20 However, the pressure increase reported in the literature is from an initial value of ∼0 cmH2O, due to the lack of a significant increase in Pdet during the filling phase. Thus, the maximum Pdet expected from the literature is approximately 50 cmH2O. In run 1, the maximum Pdet was 60 cmH2O and in run 2 was 37 cmH2O; considering that the starting pressures were of approximately −8 cmH2O and −10 cmH2O in run 1 and 2, respectively, the overall pressure increase was equal to 68 cmH2O (run 1) and 47 cmH2O (run 2). These results appear representative of the in vivo behavior, but further work is required to establish whether it is the increase in Pdet or its maximum value (or both), which is more significant in detrusor replication. The rate of increase in Pdet is also significantly higher in the model compared to reported clinical values, with the rise being near instantaneous; it is hypothesised that this is a result of the experimental process of initiating detrusor contraction prior to opening of the external sphincter, causing the pressure to rise rapidly. Although the literature presents no indication of the physiological sequencing of this process, it can be logically inferred that by opening the internal sphincter simultaneously with the detrusor contraction, the rate of Pdet increase would be reduced; this should be investigated in future work.
The decrease in pressure following the initial spike occurs as a result of the opening of the urethral valve (i.e., the simulated internal sphincter) and is similar in magnitude between both run 1 and 2. Both runs exhibited an initial decrease in Pdet at a rate of approximately 1.1 cmH2O/s, followed by a reduction in the rate of pressure change to approximately 0.1 cmH2O/s, as Pdet reached a value of ∼10 cmH2O lower than the initial state. This behaviour is not seen in the typical physiological profile, with a steady rate of pressure reduction across the entire void phase. One explanation for this discrepancy could be related to the design of the PAM detrusor net; since this is a separate entity to the bladder wall, once the model has reached a sufficiently low volume that causes it to collapse, the bladder walls are no longer in contact with the PAM net and cease to experience detrusor contraction. This could be mitigated in the future by selecting PAM components which facilitate a greater increase in diameter, such that the net is capable of contraction to the extent that no free volume is left in the centre; thus, the contraction pressure continues to be exerted upon the bladder through the entire void phase. Run 2 exhibits a small increase in Pdet approximately halfway through the region of rapid decrease; this is likely as a result of the air compressor duty cycle, whereby the compressor runs until the desired pressure is achieved (100 kPa) before turning off.
Voiding flow rate
The voiding flow rate was consistent between both run 1 and 2, with the maximum flow rate (Qmax) observed at the initiation of flow and a two-stage decrease in flow rate seen afterwards. This rate change was coincident with the reduction in Pdet rate change seen in the pressure profile. Qmax was 9.2 and 8.5 ml/s in run 1 and 2, respectively. The literature gives an expected range of 13–25 ml/s in healthy females; limited data is available for males, but Zambon et al. 21 reported a range of 9.5–22.9 ml/s for males aged 50–59. The experimental values obtained from the model fall ∼65% and ∼61% short of those expected in females and males, respectively; thus, the model is not fully representative of the physiological bladder in this metric. Since Pdet at voiding is also representative of in vivo conditions, an alternative explanation for the lower value of Qmax must be sought. A likely explanation is the use of a 3 mm diameter Luer slip stopcock as a simulated internal sphincter; since this is smaller than the 4.69 ± 1.09 mm reported in the literature as the mean urethral diameter, it would have necessarily restricted the flow to some degree. 13
Evaluation of model compliance
Both experimental runs exhibited similar values of compliance; that is, 14.7 and 15.15 ml/cmH2O for run 1 and 2, respectively. These values are low in comparison to those reported in the literature, which identified a normal range of between 30 and 100 ml/cmH2O in healthy bladders. 18 This reduced compliance is a likely cause of the greater Pdet levels seen in the model during voiding, compared to reported physiological values. A material with lower Young’s modulus should be used in the future to achieve lower compliance. Moreover, higher values of compliance would also be expected if the nominal geometric capacity of the model was to be increased.
Conclusions
A silicone-based hollow model, produced via a novel rotational moulding technique, was manufactured to accurately replicate the geometry of the urinary bladder. The compliance of the model is lower than values reported in the literature for the physiological bladder; this is likely due to the higher Young’s modulus of the material, although literature values for this parameter are contradictory. The model presented in this work has successfully replicated the rise in bladder pressure via detrusor muscle contraction, which was achieved by enclosing the bladder in a pneumatic artificial muscle net. The model was validated via clinical cystometry urodynamic testing—the first artificial bladder model to do so—representing a significant improvement over existing physical models. Notably, this approach allows direct comparison with clinical data and offers improved accessibility to clinicians. The model is compatible with catheter use but improvements should be made to the design to facilitate this integration; specifically, due to the use of a stopcock it is not possible to void via the urethra while bypassing an in situ catheter, which is required in normal cystometry. With the improvements identified, the model is likely to offer significantly improved flow metrics to existing models and could contribute to overcoming the current stagnation in catheter development. 22
Due to its ability to qualitatively replicate the flow mechanics of the physiological bladder and its unique integration with a contraction-driven voiding mechanism, the developed model has demonstrated significant potential over existing physical models in mimicking the full physiological micturition cycle of the human bladder. Therefore, it offers extensive opportunities for future use in the development of indwelling catheters and in urological research more broadly, as well as for clinical training purposes.
Future research and improvements on the model are however required before it can be employed as a reliable tool in medical device research. Further investigations should be conducted to assess the relationship between PAM-mediated contraction and the voiding flow rate, to assess whether a range of flow rates could be achieved that is more representative of variations across patients. The model could also be adjusted in its physical properties, such as stiffness, thickness, and shape, to replicate patient-specific bladder features—including those representative of pathological conditions. In this respect, it would also be beneficial to establish a more comprehensive dataset of clinical data of flow metrics for comparison with the model’s outputs. The level of control and automation of the PAM system and internal sphincter could also be improved to avoid non-physiological changes in pressure prior to voiding. It is expected that this would also improve consistency of some flow metrics across cystometry runs, by overcoming the detrimental effect of manual operation on experimental reproducibility. Although it is not expected to have played a significant role in this study, material’s degradation across multiple runs should also be assessed for reliable long-term operation in the future. Moreover, it is necessary to investigate a method of improving the model’s compliance; for example, this could be achieved by reducing the thickness of the model or utilising a different constitutive material. Internal sphincter replication could also be improved; this is currently achieved with the use of a conventional medical stopcock. A better solution could be an external hydraulic cuff, which would surround the model urethra and seal it closed via hydraulic pressure. This flexible design would better accommodate indwelling catheters and improve the utility of the model in catheter development. Finally, the current paper primarily focuses on the design and manufacturing process of the bladder model and its proof-of-concept functional evaluation via cystometry. Additional cystometry runs should be performed in the future to obtain a more statistically robust and quantitative analysis of model’s performance.
Supplemental Material
sj-docx-1-pih-10.1177_09544119241262372 – Supplemental material for Artificial urinary bladder model
Supplemental material, sj-docx-1-pih-10.1177_09544119241262372 for Artificial urinary bladder model by Benjamin Read, Annecia Tan Sze Wuan, Amelia Pietropaolo, Bhaskar K Somani, Dario Carugo and Ali Mosayyebi in Proceedings of the Institution of Mechanical Engineers, Part H: Journal of Engineering in Medicine
Footnotes
Declaration of conflicting interests
The author(s) declared the following potential conflicts of interest with respect to the research, authorship, and/or publication of this article: The conflict of interest is indirect and is as follows: Dr Ali Mosayyebi and Dr Dario Carugo are co-inventors of a novel ureteric stent design aimed at reducing particle deposition. An NIHR-funded project is currently underway to test this technology in a first-in-human clinical investigation.
Funding
The author(s) received no financial support for the research, authorship, and/or publication of this article.
Supplemental material
Supplemental material for this article is available online.
References
Supplementary Material
Please find the following supplemental material available below.
For Open Access articles published under a Creative Commons License, all supplemental material carries the same license as the article it is associated with.
For non-Open Access articles published, all supplemental material carries a non-exclusive license, and permission requests for re-use of supplemental material or any part of supplemental material shall be sent directly to the copyright owner as specified in the copyright notice associated with the article.