
Abstract
Leaf fall during the autumn season creates low adhesion problems on the railways. Traction gels are used to prevent low adhesion, but very little testing has been carried out to assess their performance. Views on their effectiveness vary and their usage is inconsistent across the UK network as a result. This work developed a range of full-scale laboratory and field tests that can be used to assess traction gel performance. The outcomes can lead to increased industry confidence in their ability to mitigate low adhesion, as well as in future product development. It was shown that as a wheel passes over a puddle of traction gel on a rail head, that the gel element is squeezed away leaving the solid particles behind, pick-up on the wheel of particles was also evident. Traction gels were shown to increase traction in full-scale laboratory friction tests in dry and low adhesion conditions. Field brake tests showed that braking was effective in low adhesion and dry conditions with traction gel applied, matching the laboratory test results. The traction gel was also shown to remove a leaf layer, artificially produced by running a DMU over leaf material on a test track. Subsequent work should validate the results on a working railway line during the autumn season.
Introduction
Leaf fall on the railways causes low adhesion issues every autumn due to increased journey times, wheel flats, station overruns and safety issues. Leaves are blown or fall directly onto the railway and stick to the railhead in wet conditions. Chemical reactions between the leaf material and the steel then take place 1 , 2 and black material is formed which can be pushed or washed down the railhead with subsequent wheel passes and rainfall.
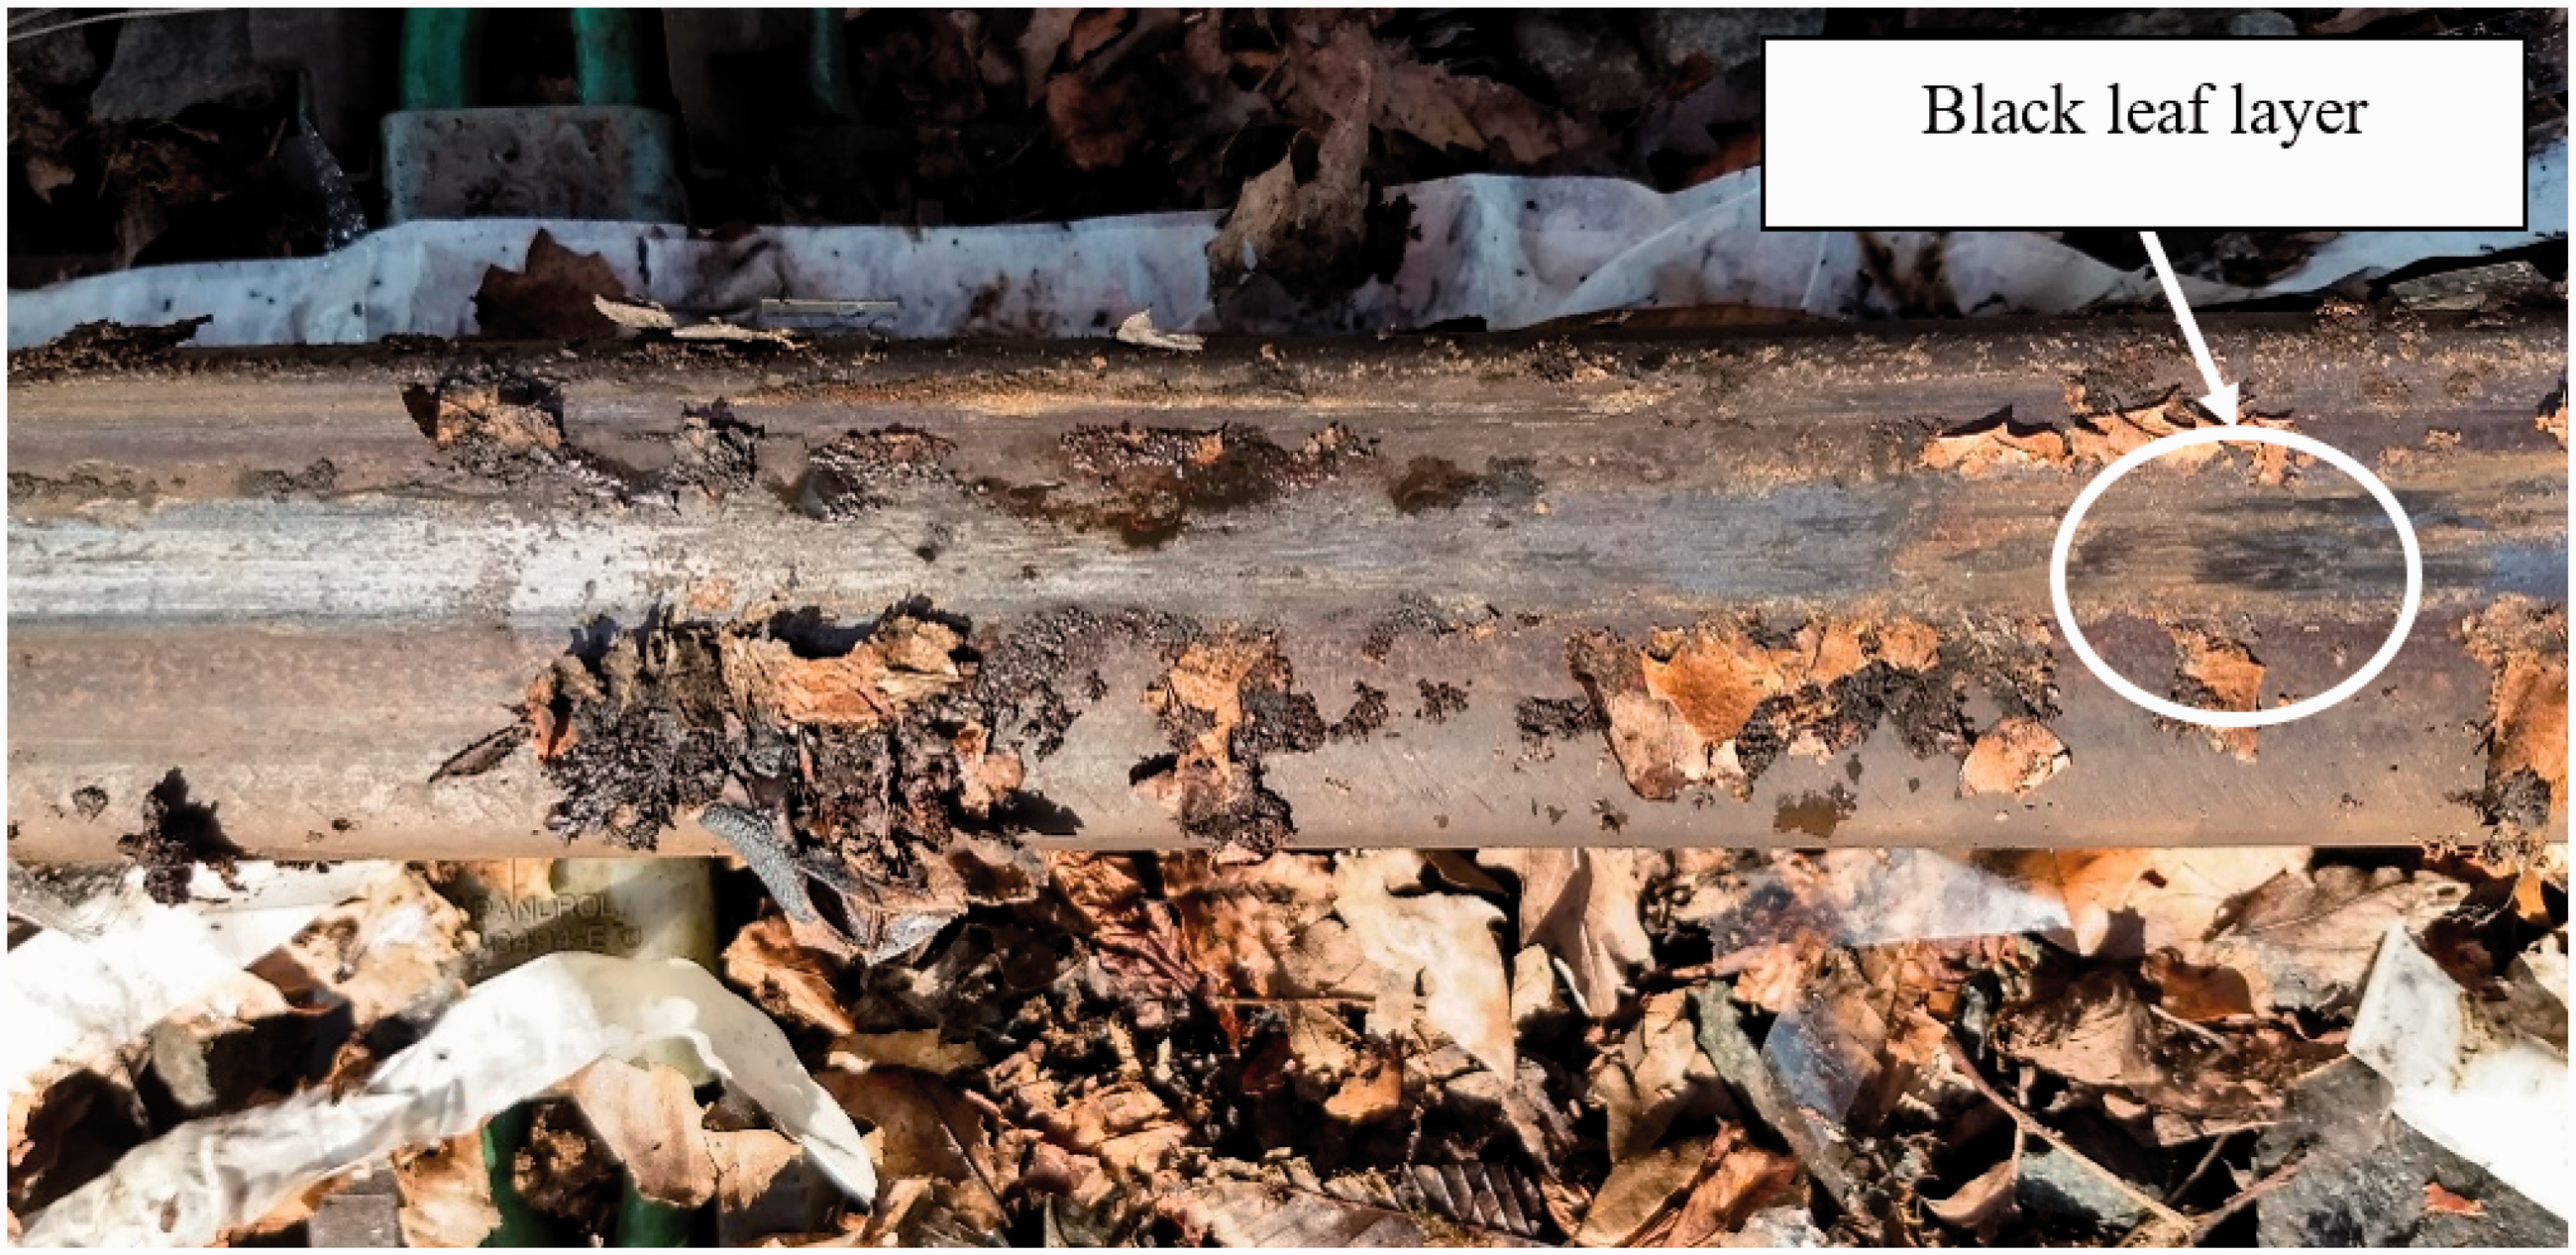
Figure 1 shows the blackened leaf material in the contact band after recent rainfall. As well as the bulk leaf, a black, sticky, and paste-like material has been washed down the railhead and is present both in and outside the contact band. The photographed railway line is irregularly used and in this case the leaf seems to be intact, the number of wheel passes that have occurred over this leaf is unknown, but there is a clear difference between the leaf properties in the centre of the leaf over the running band, as opposed to the edges of the leaf.
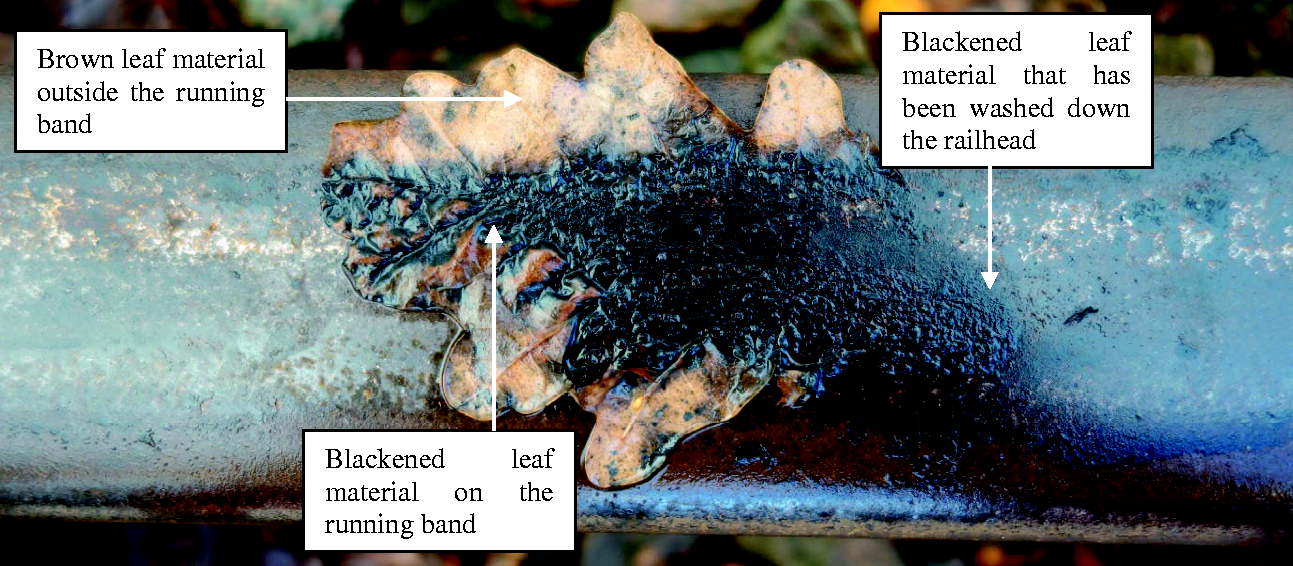
A partially blackened leaf on the railhead.
Figure 2 shows a more compressed leaf in dry conditions which has been entrained by wheel passes into the rail running band to form a hard and well bonded layer. It is seen that, in this situation, the black leaf layer also covers the entire railhead rather than just the running band.
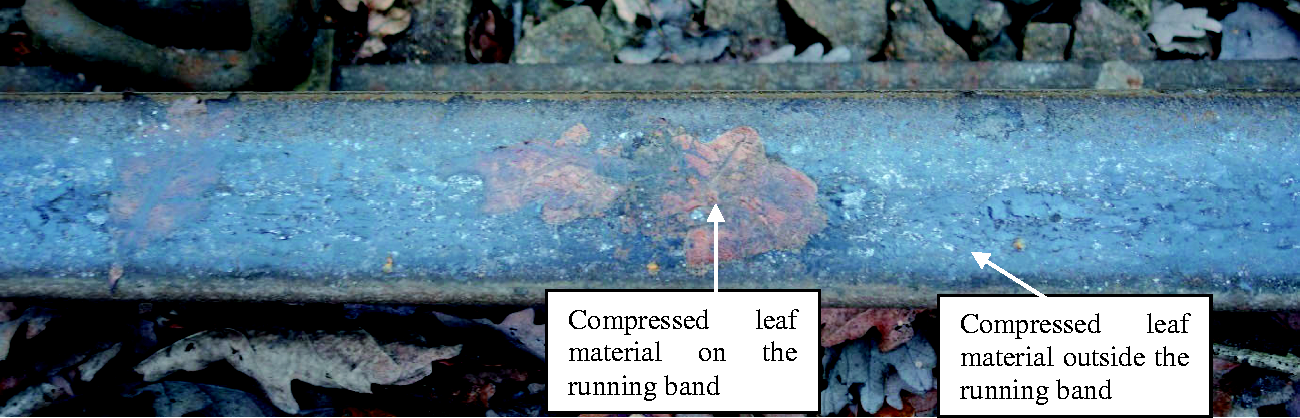
A leaf layer on the railhead.
Traction gels contain solid particles suspended in a gel which are added to the wheel-rail contact to increase traction on the railway. They can be applied wayside using a traction gel applicator (TGA), or applied directly onto the railhead from a railhead treatment train.
There are 3 different traction gels used in the UK during the autumn season, but there is a shortage of data to show how effective these products are, in particularly methods that could be used to test the effectiveness of individual products throughout the year. A detailed review of previous work is found in Skipper et al. 3 Field braking tests have been carried out on working railways, 4 , 5 but these used leaf contaminated track during the autumn season so would be difficult and expensive to repeat. Small scale testing has been carried out to assess traction gel performance in a previous papers. 6 , 7 This is good for ranking product performance, but the results cannot be directly translated to the field.
This paper describes full-scale laboratory and field testing methodologies that are able to be carried out in either a laboratory or a closed loop test track throughout the year, to assess the performance of traction gels. This paper aims to provide an overview of multiple test methods and results, so that a more detailed set of tests can be undertaken in future to determine effectiveness, compare products and improve product formulations.
Test methodologies
Full-scale laboratory testing
The full-scale test wheel/rail test facility (FSR), built by British Rail and used in previous work at The University of Sheffield, 8 was used to analyse traction gel pick-up/carry-down mechanisms and determine the effect on traction throughout the wheel pass.
The full-scale test rig consists of a rail moving (pulled by a hydraulic actuator) under an actual wheel, causing it to rotate on its axle. A normal force is applied to the wheel axle using a hydraulic actuator. A chain is attached between the wheel and another hydraulic actuator; the chain can be pulled as the rail is moving to induce creep in the contact by rotating the wheel at a slightly higher speed. A load cell is mounted that can measure the tangential force and, by dividing by normal force the friction coefficient can be found, which can be read throughout the wheel cycle. A schematic of the FSR is shown in Figure 3.
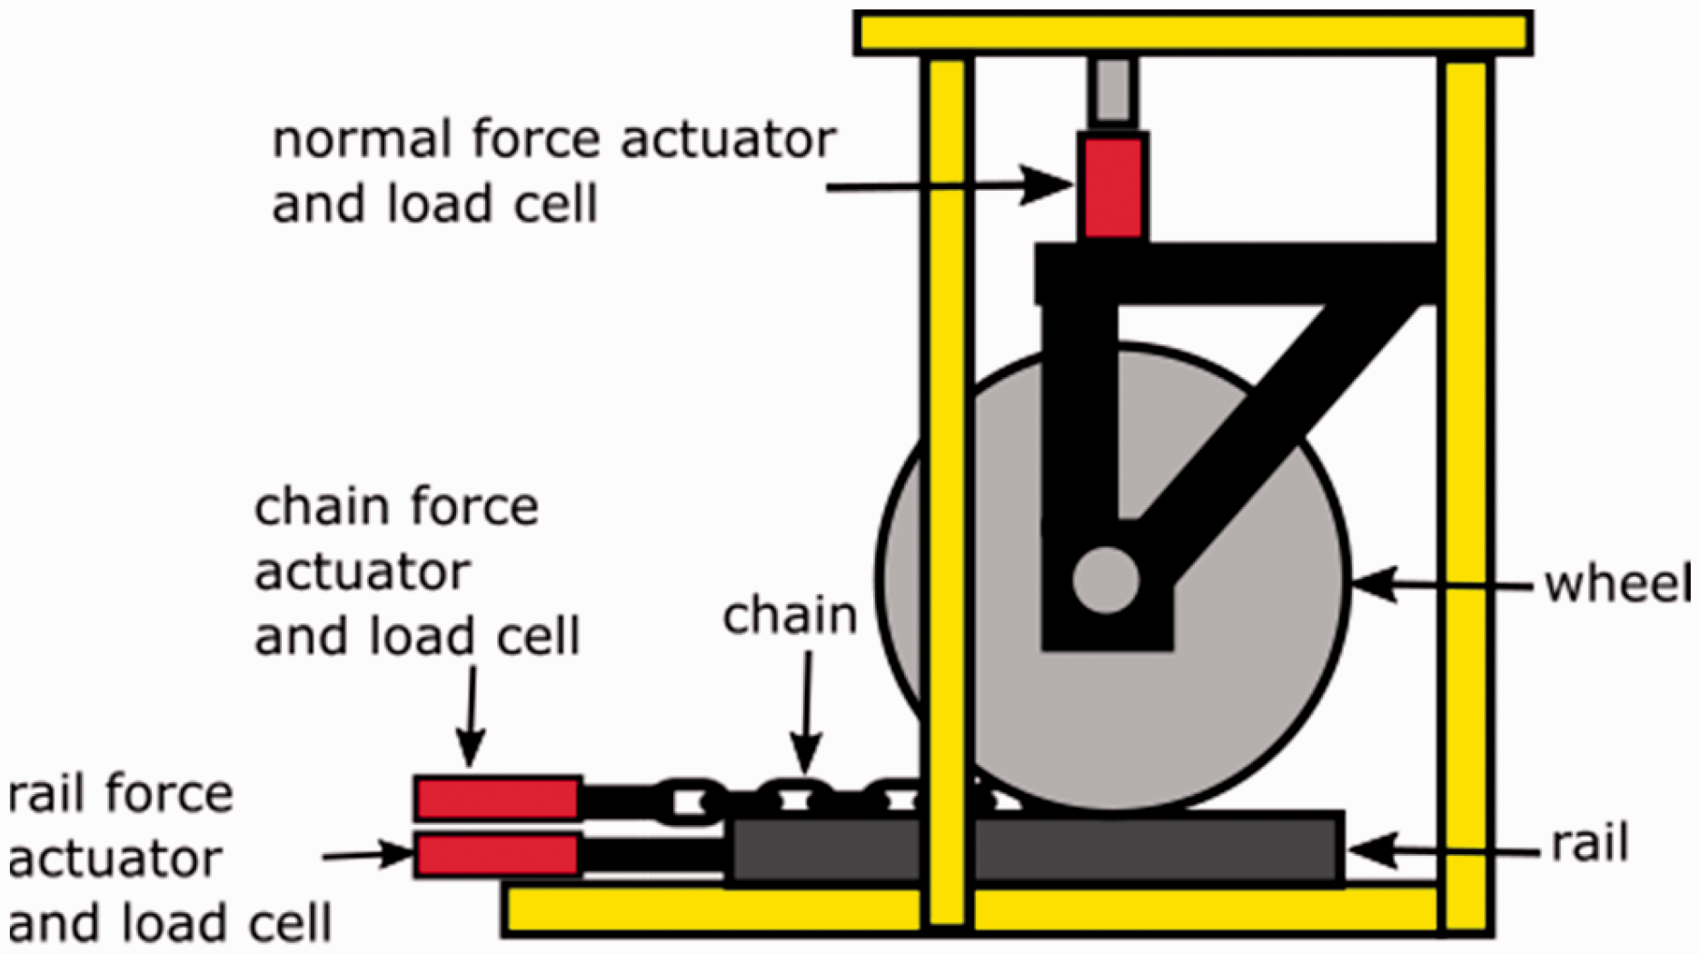
A schematic of the FSR.
Retentivity test
In this context, “retentivity” refers to the ability of a traction gel to remain effective after multiple wheel passes. The FSR was used to determine how many wheel passes could be carried out before the traction gel was no longer transferred from rail to wheel. The following steps were carried out:
Traction gel was applied to the top of the rail surface; this was approximately 25 g (corresponding to the amount applied by a TGA) of traction gel in an area 180mm long by 40mm wide situated in the wheel running band, nearer the gauge side of the rail. One cycle of the FSR was run. Conditions were 100 kN normal force, 3% slip and a rail velocity of 100 mm/s. The wheel was wiped clean of all traction gel. Steps 2 and 3 were repeated until no more traction gel was transferred onto the wheel.
Traction performance
During the “retentivity” test series described in ‘Brake testing’ section, traction coefficient data was logged which was used to assess the traction gel performance. Two further sets of tests were also carried out for reference purposes; a dry baseline with no contamination and a wet baseline with 250 ml of tap water applied. This large volume of water was used to ensure that the contact was completely “flooded”.
Field testing
Brake testing
Field testing was carried out using a Class 117 Diesel Multiple Unit (DMU) and a 300 m stretch of track at the Quinton Rail Technology Centre test facility. A camera was mounted above the front wheel to monitor brake application and wheel slip. An on-board GPS sensor (VBox) was used to record data and a potentiometer was fitted to the brake lever to monitor the brake application point. A more detailed test procedure for this work is described in Lanigan et al.
9
The following steps were followed to create a low adhesion leaf layer on the railhead:
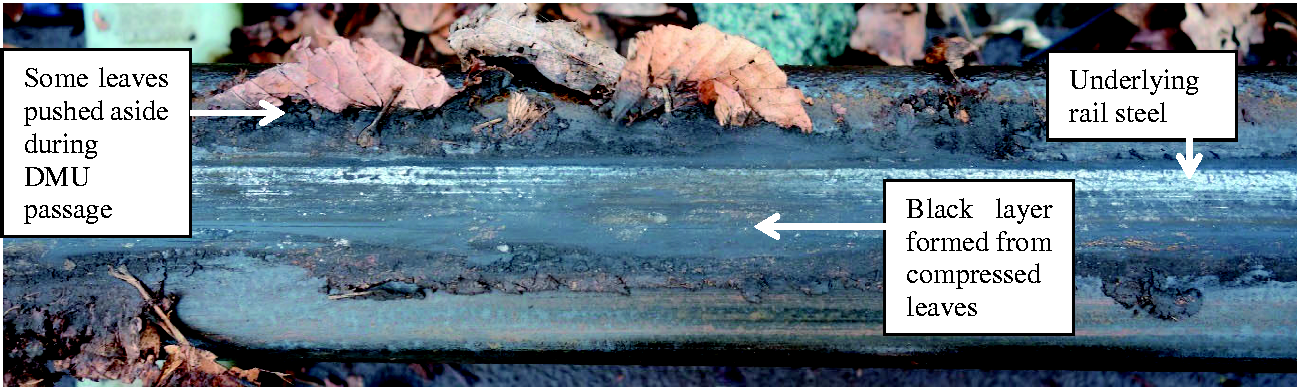
The track was visually inspected to ensure it was free of contaminants and the intended low adhesion zone was marked out. Leaves were placed on the rail in the designated low adhesion zone, securing them with adhesive paper tape. Care was taken to ensure that none of the tape was in the running band of the rail. The driver coasted the DMU (no braking or traction) over the leaves 5 times. After each run, the low adhesion zone was checked to ensure it remained covered. Leaves were re-applied if necessary. After 5 passes over the leaves, a black layer was formed on the contact band (as seen in Figure 4).
The leaf layer, after formation using the DMU.
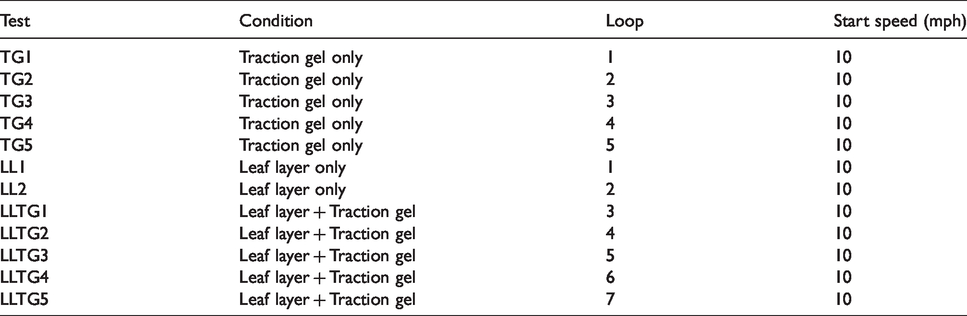
The leaf layer was only created once for these tests; the leaf layer was robust enough to be used for multiple repeats as described in Lanigan et al. 9 A table of tests and conditions are seen in Table 1. Due to warm and dry conditions, the leaf layer was sprayed with water to rehydrate before each vehicle pass. The leaf layer was created prior to test “LL1” in Table 1.
Field test plan.
A 3 m long leaf layer was created. A marker was placed trackside to indicate the braking point directly after the low adhesion zone, as shown in Figure 5. 9 An image of the leaves ready to be rolled over and the traction gel application is shown in Figure 6.
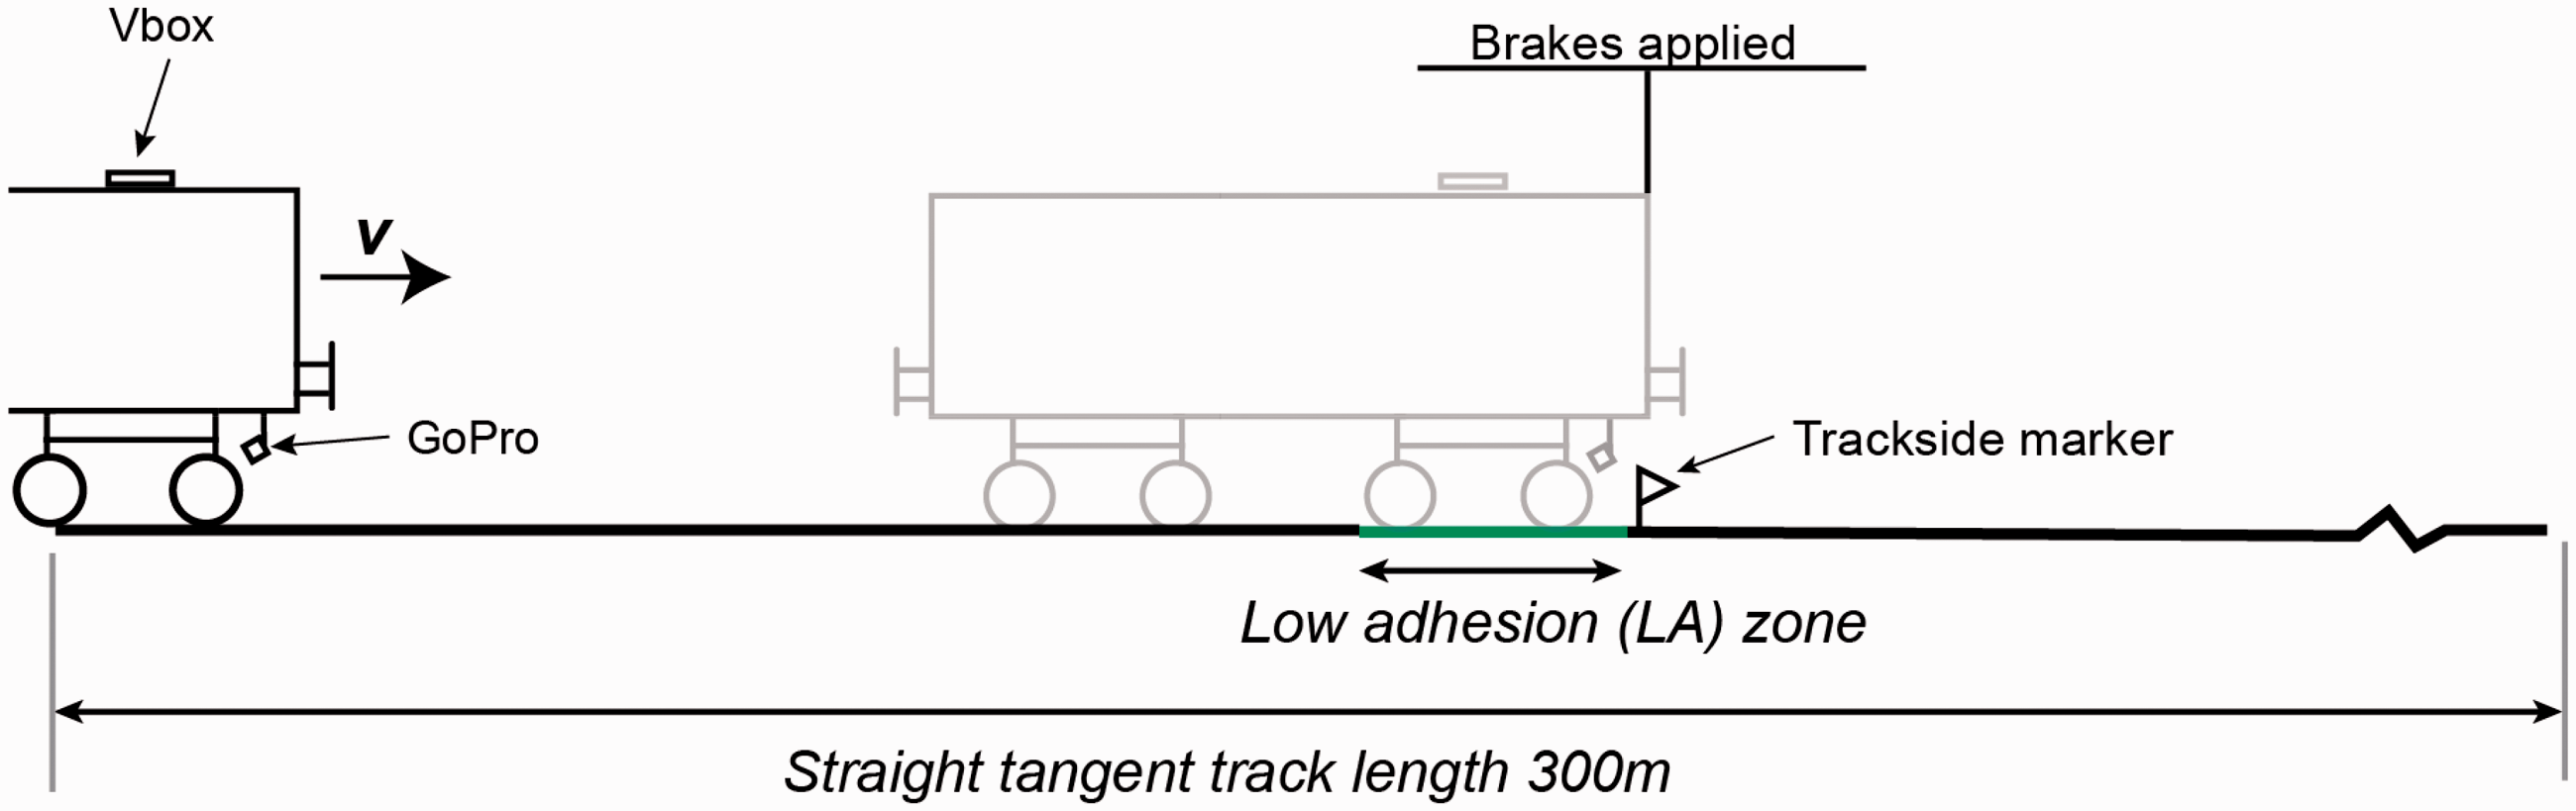
A schematic diagram of the braking test. 9
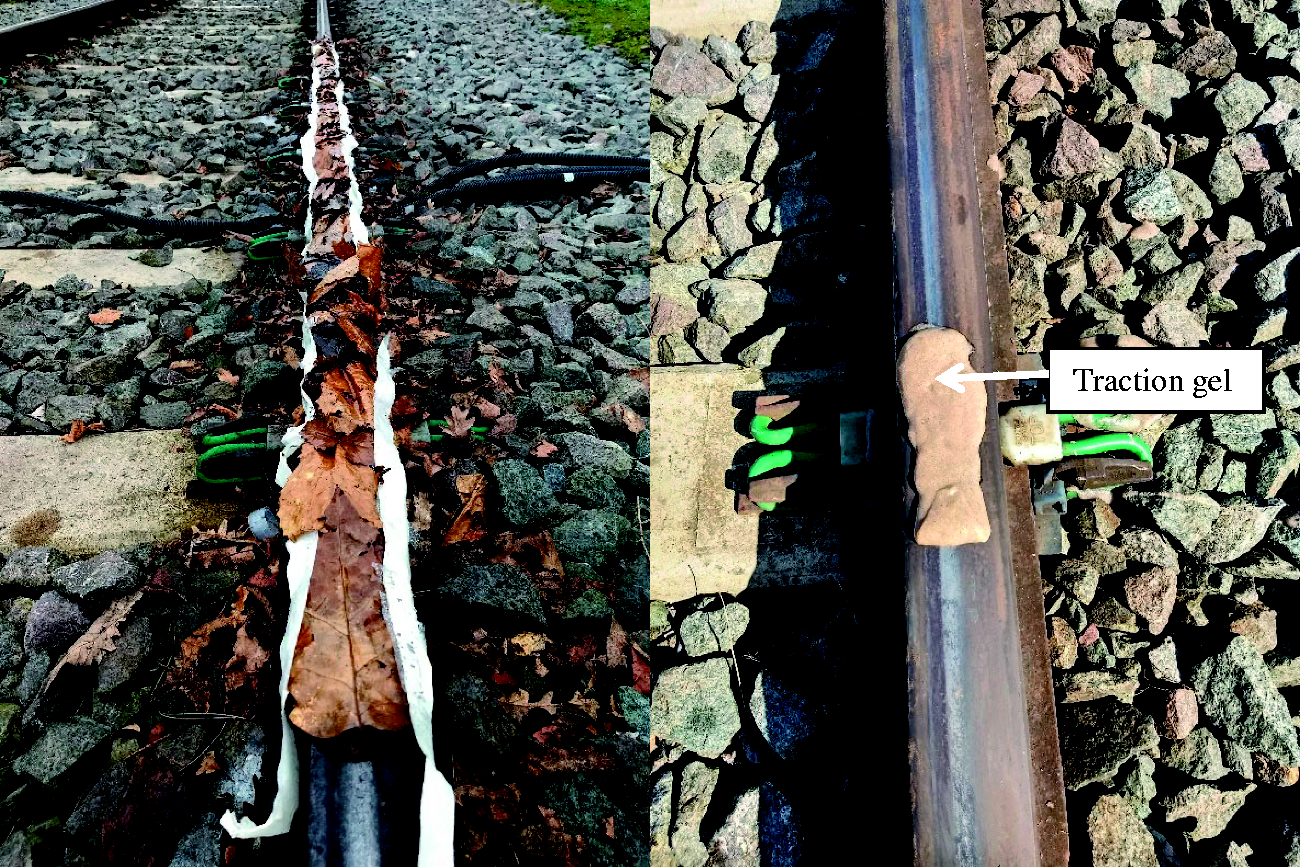
(L) Leaves stuck to rail using tape; (R) traction gel applied to rail.
Each subsequent brake test followed the same standard procedure:
The leaf layer was re-hydrated by spraying with water If required, approximately 25 g (the amount applied by a TGA) of traction gel was applied to the top of rail 10 m before the low adhesion zone. The rail was wiped clean and traction gel re-applied for each repeat. The driver accelerated from the holding position to 10 mph prior to entering the low adhesion zone. The driver applied the brake at a standard braking rate at the point specified by the marker. The brake was applied until the vehicle came to a complete stop. The driver completed a loop of the test track and returned to the holding position. Images were taken of the zone where traction gel was initially applied (for tests that use traction gel). Steps 1-6 were repeated until the specified number of tests had been completed.
X-Ray photoelectron spectroscopy (XPS) was carried out on a well bonded, black leaf layer formed on the section of rail seen in Figure 2. The line, situated near Barnsley, UK, is infrequently used and has regular low traction problems throughout the autumn season. This sample was compared to the leaf layer that has been formed during these field braking tests. The XPS results showed that the black leaf layer taken from the railhead near Barnsley, which appeared to have been on the rail for longer, had a lower percentage of carbon and a higher percentage of iron, oxygen and nitrogen. Further details are found in Lanigan et al. 9
Leaf layer removal
A leaf layer was formed using the technique explained in 2.2.1. Sites on the railhead leaf layer were marked for examination. 0.9 g of traction gel was applied by syringe to the railhead at 3 of these sites, whilst 2 others were left without any product application as a control. The DMU was used to roll over the leaf layer 3 times and the railhead was photographed. The remaining crushed traction gel on the railhead surface was then gently wiped away using a soft cloth to expose the remaining leaf layer and photographed again.
Results
Full-scale testing
Retentivity test
The images in Figure 7 show that the “gel” component of the product is squeezed out after a single wheel pass to leave the solid particles in the contact band. Some particles remain on the rail and others are transferred to the wheel, which could therefore be carried further down the track in a real situation. The amount of traction gel picked up by the wheel is very low after 3 wheel passes.
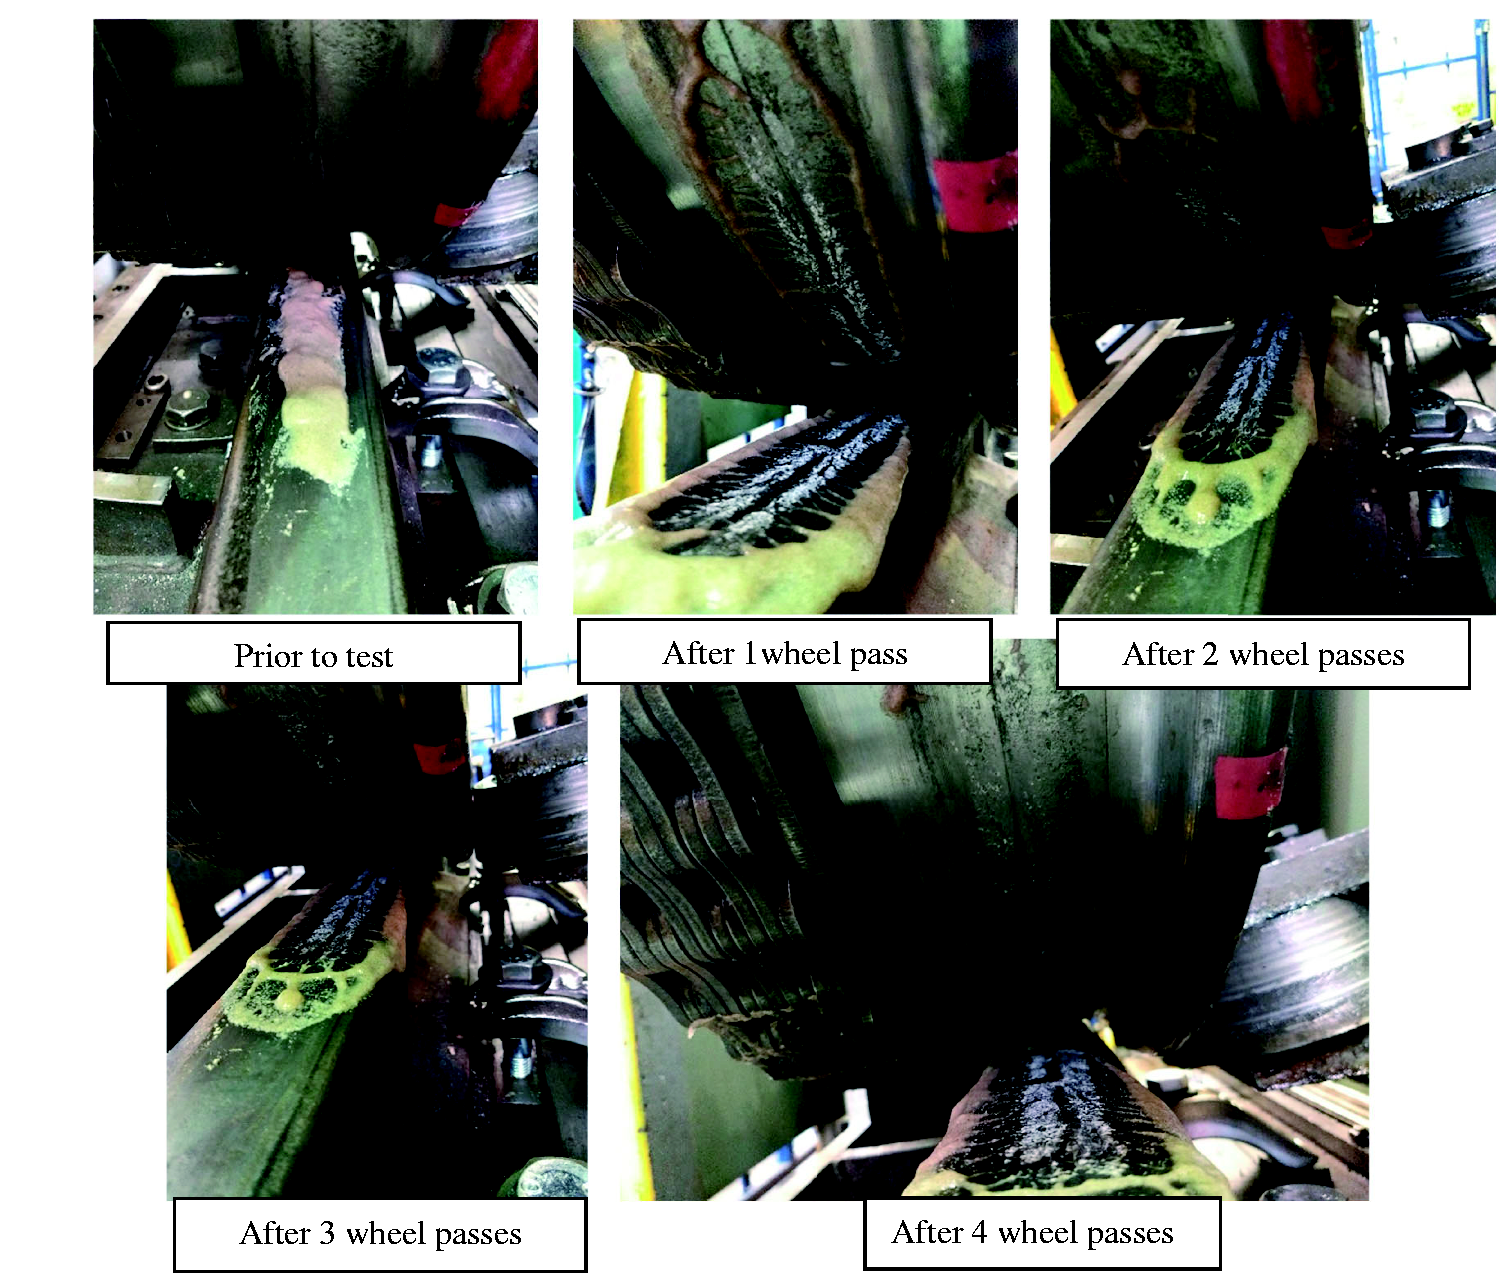
Progression of traction gel deposits on wheel after subsequent wheel passes.
Traction performance
Traction data over four FSR cycles is shown in Figure 8. “Traction gel on rail” is data from the 4 wheel passes shown in the retentivity testing. Wet and dry baselines were also logged. The wet traction coefficients are at expected levels, with a wet traction coefficient of approximately 0.16. The dry traction coefficients, of approximately 0.2-0.25, increase after the first cycle which may mean there was oxide formation or a small amount of contamination in the contact, but this was quickly removed and there was a traction increase in the second cycle. The traction coefficient with traction gel exceeds the dry traction coefficients during every cycle, ranging between 0.27 and 0.32.
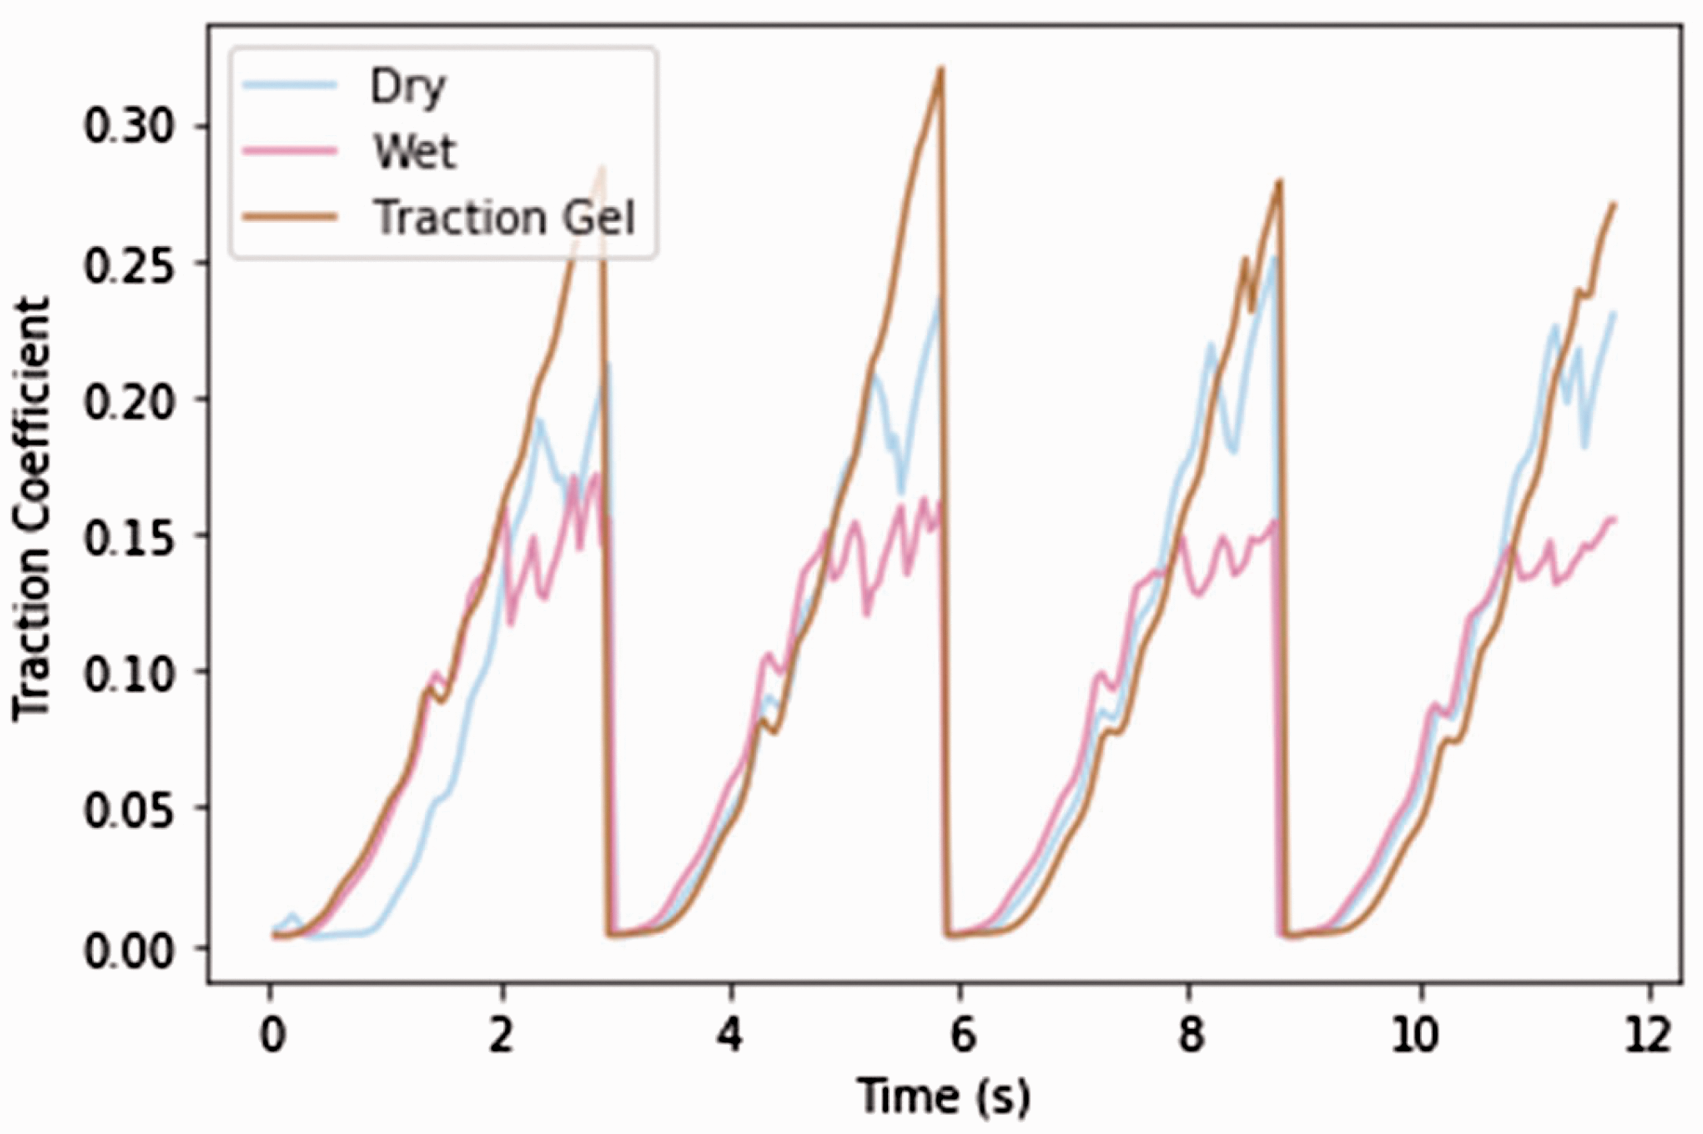
Traction data from the full-scale rig tests.
Field testing
Brake testing
The initial leaf layer was laid down over 3 m before test “LL1”, but during the leaf layer tests “LL1” and “LL2” (Table 1) the black layer had been visibly spread to approximately 10 m down the railhead, transferred by the wheels rolling and sliding over the initial layer. This meant that the low adhesion producing zone was likely to be longer than the initial 3 m.
Stopping distance and average linear deceleration for different rail conditions, plotted against velocity at the braking point, is shown in Figure 9. The leaf layer caused a much lower deceleration rate, with traction gel and dry values being similar. The velocity has been plotted against displacement for all braking tests and is shown in Figure 10. The mean average linear deceleration value for the dry conditions was 1.09 m/s2, the leaf layer was 0.80 m/s2, the leaf layer and traction gel was 1.06 m/s2 and the traction gel only was 1.26 m/s2.
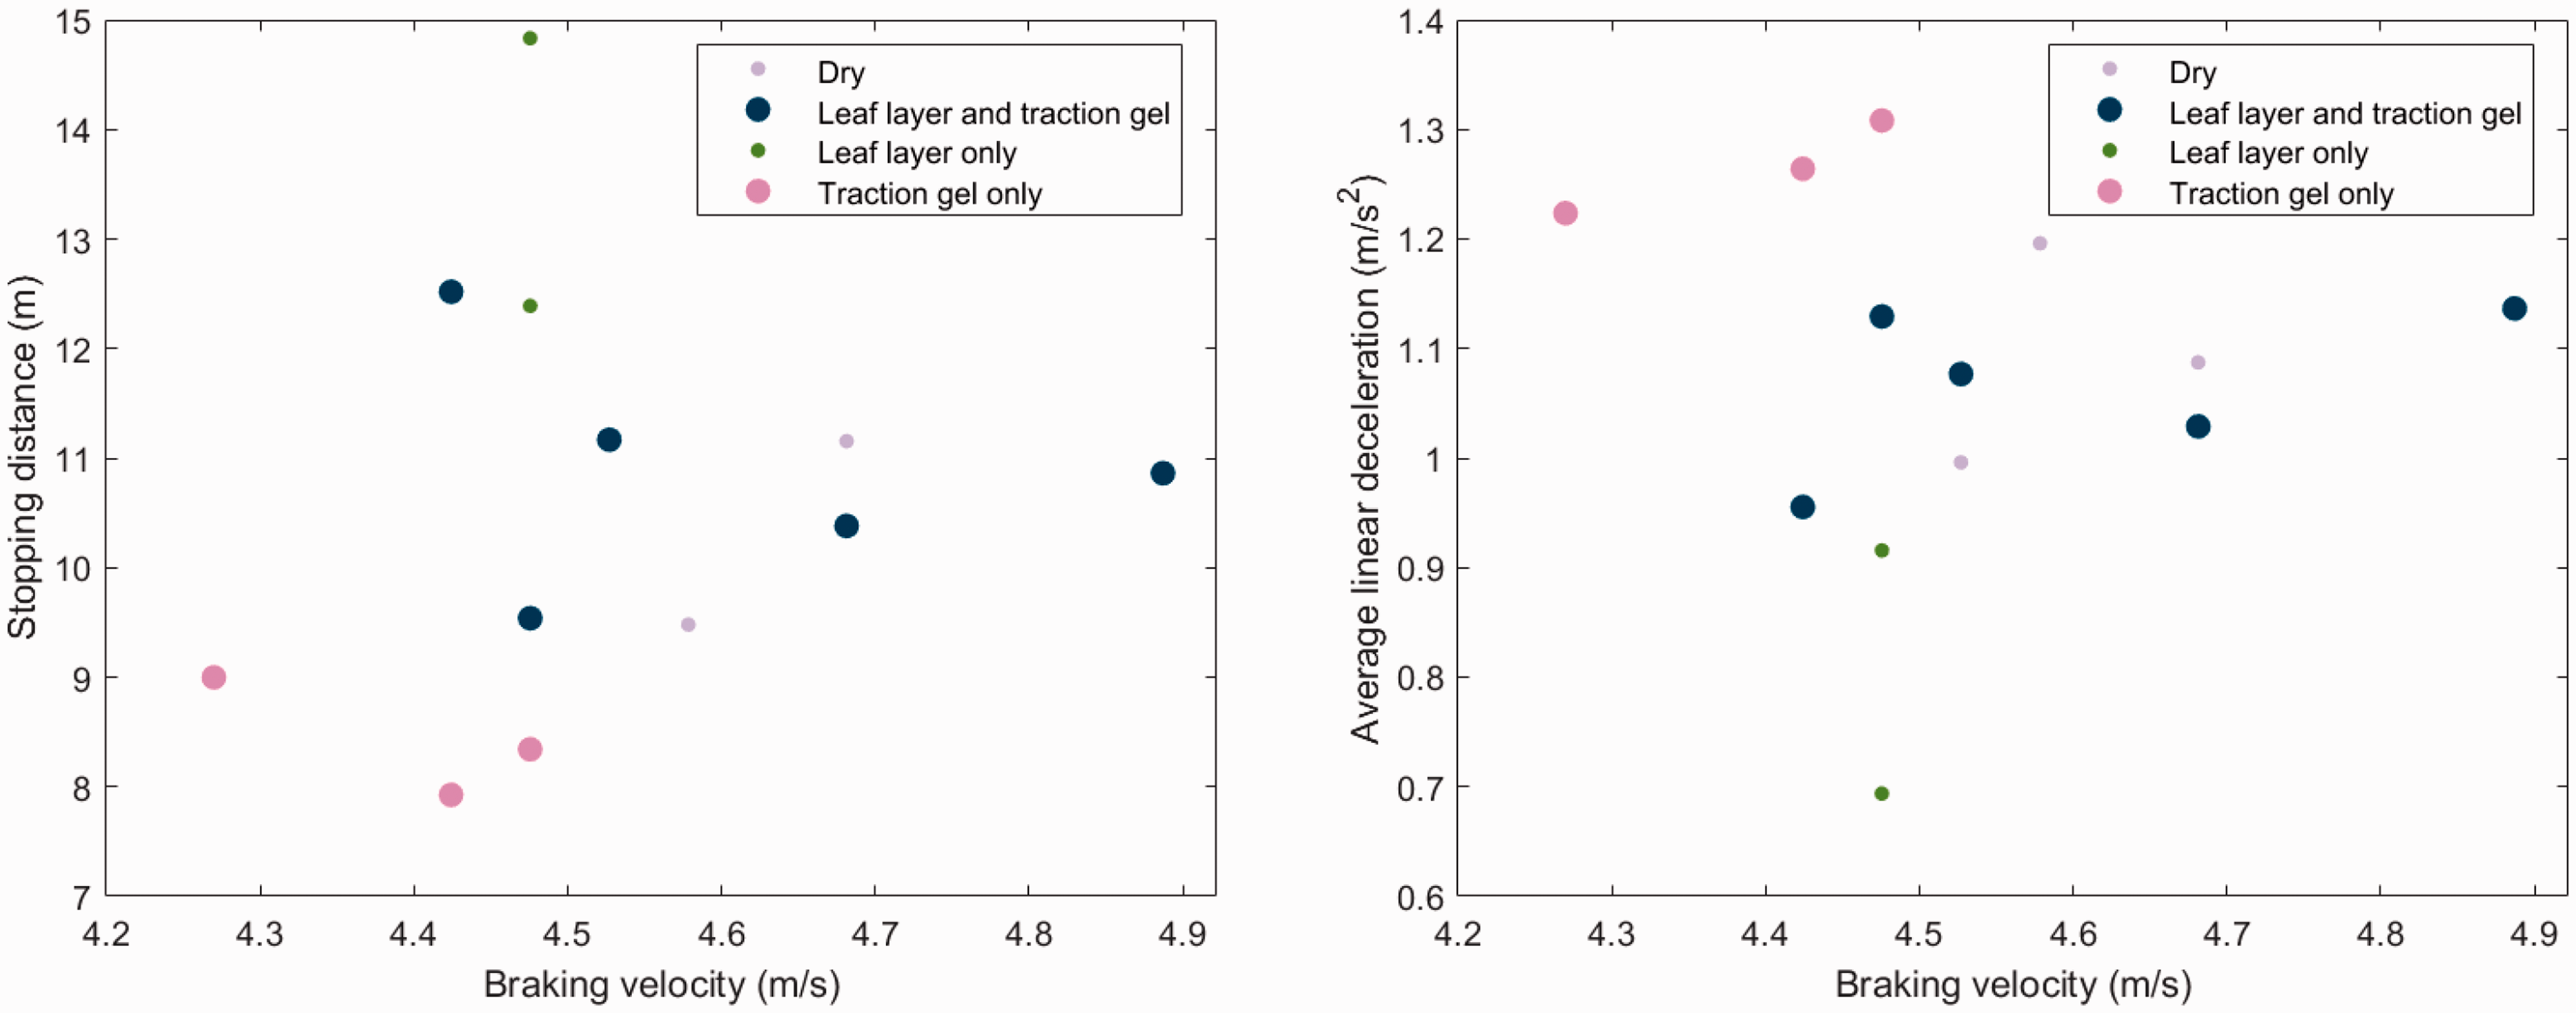
Stopping distance for different rail conditions, plotted against velocity at braking point (L), average linear deceleration, plotted against velocity at braking point for different rail conditions (R).
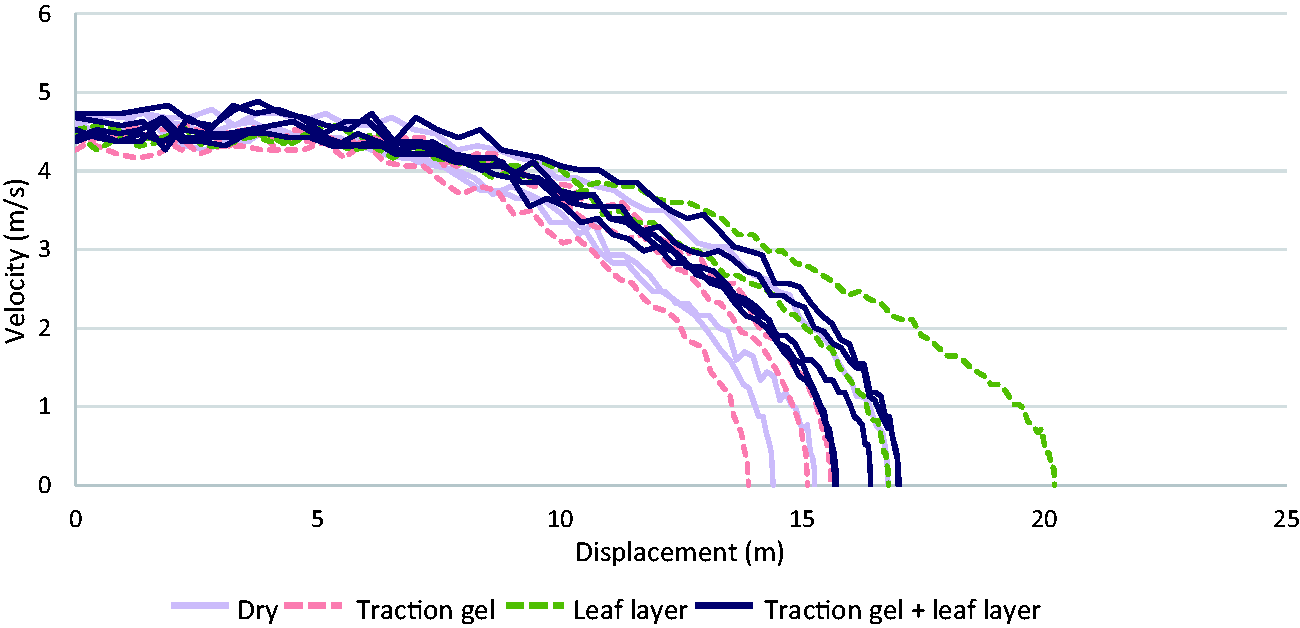
Velocity plotted against displacement for braking tests.
The results show that the average deceleration, and therefore adhesion, for the leaf layer only tests is lowest. Adhesion levels for dry and “Leaf layer + Traction gel” tests are similar, whilst the highest levels of adhesion are seen for the traction gel only tests. Images of the traction gel application zone after testing are shown in Figure 11, the gel component has again been pushed out to leave the solid particulates behind, similar to that seen in the full-scale laboratory testing in Figure 7.
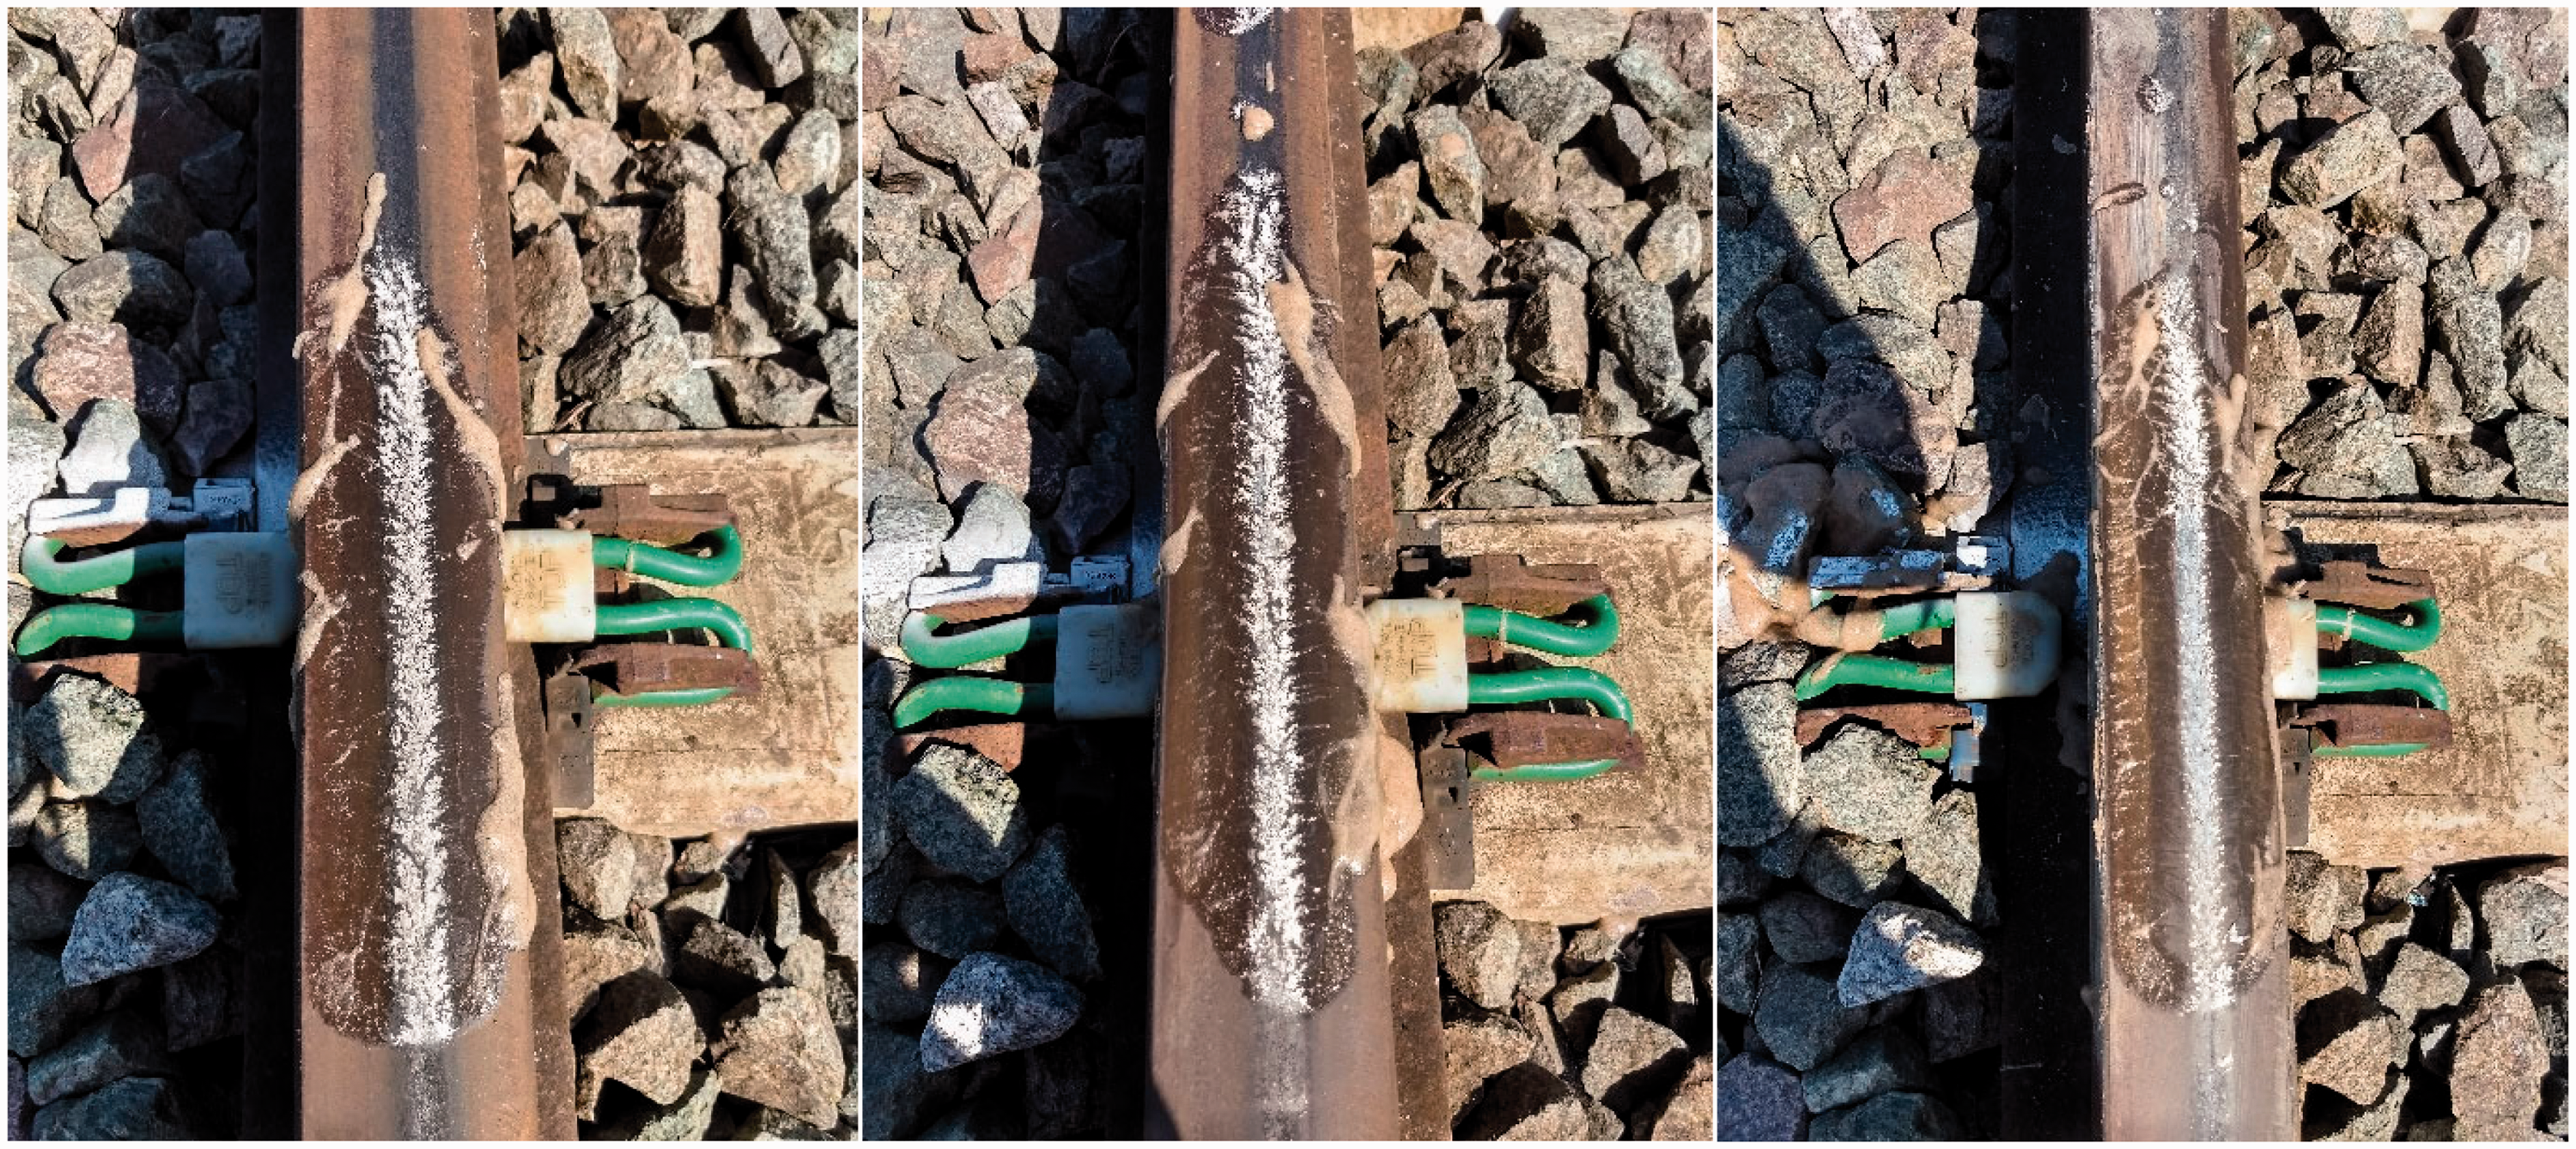
Images of the traction gel application zone, after testing.
Leaf layer removal
Images of the leaf layer removal test are shown in Figure 12, showing; the leaf layer before gel addition (a) the applied traction gel (b) the traction gel after 3 DMU passes (c) the subsequent removed leaf layer (d). The leaf layer formed was found to be approximately 20 µm, measured using an eddy current device similar to that previously used by Network Rail. 4 The leaf layer has been removed where the traction gel was added, with the metallic cleaned rail steel visible underneath (see Figure 12(d)).
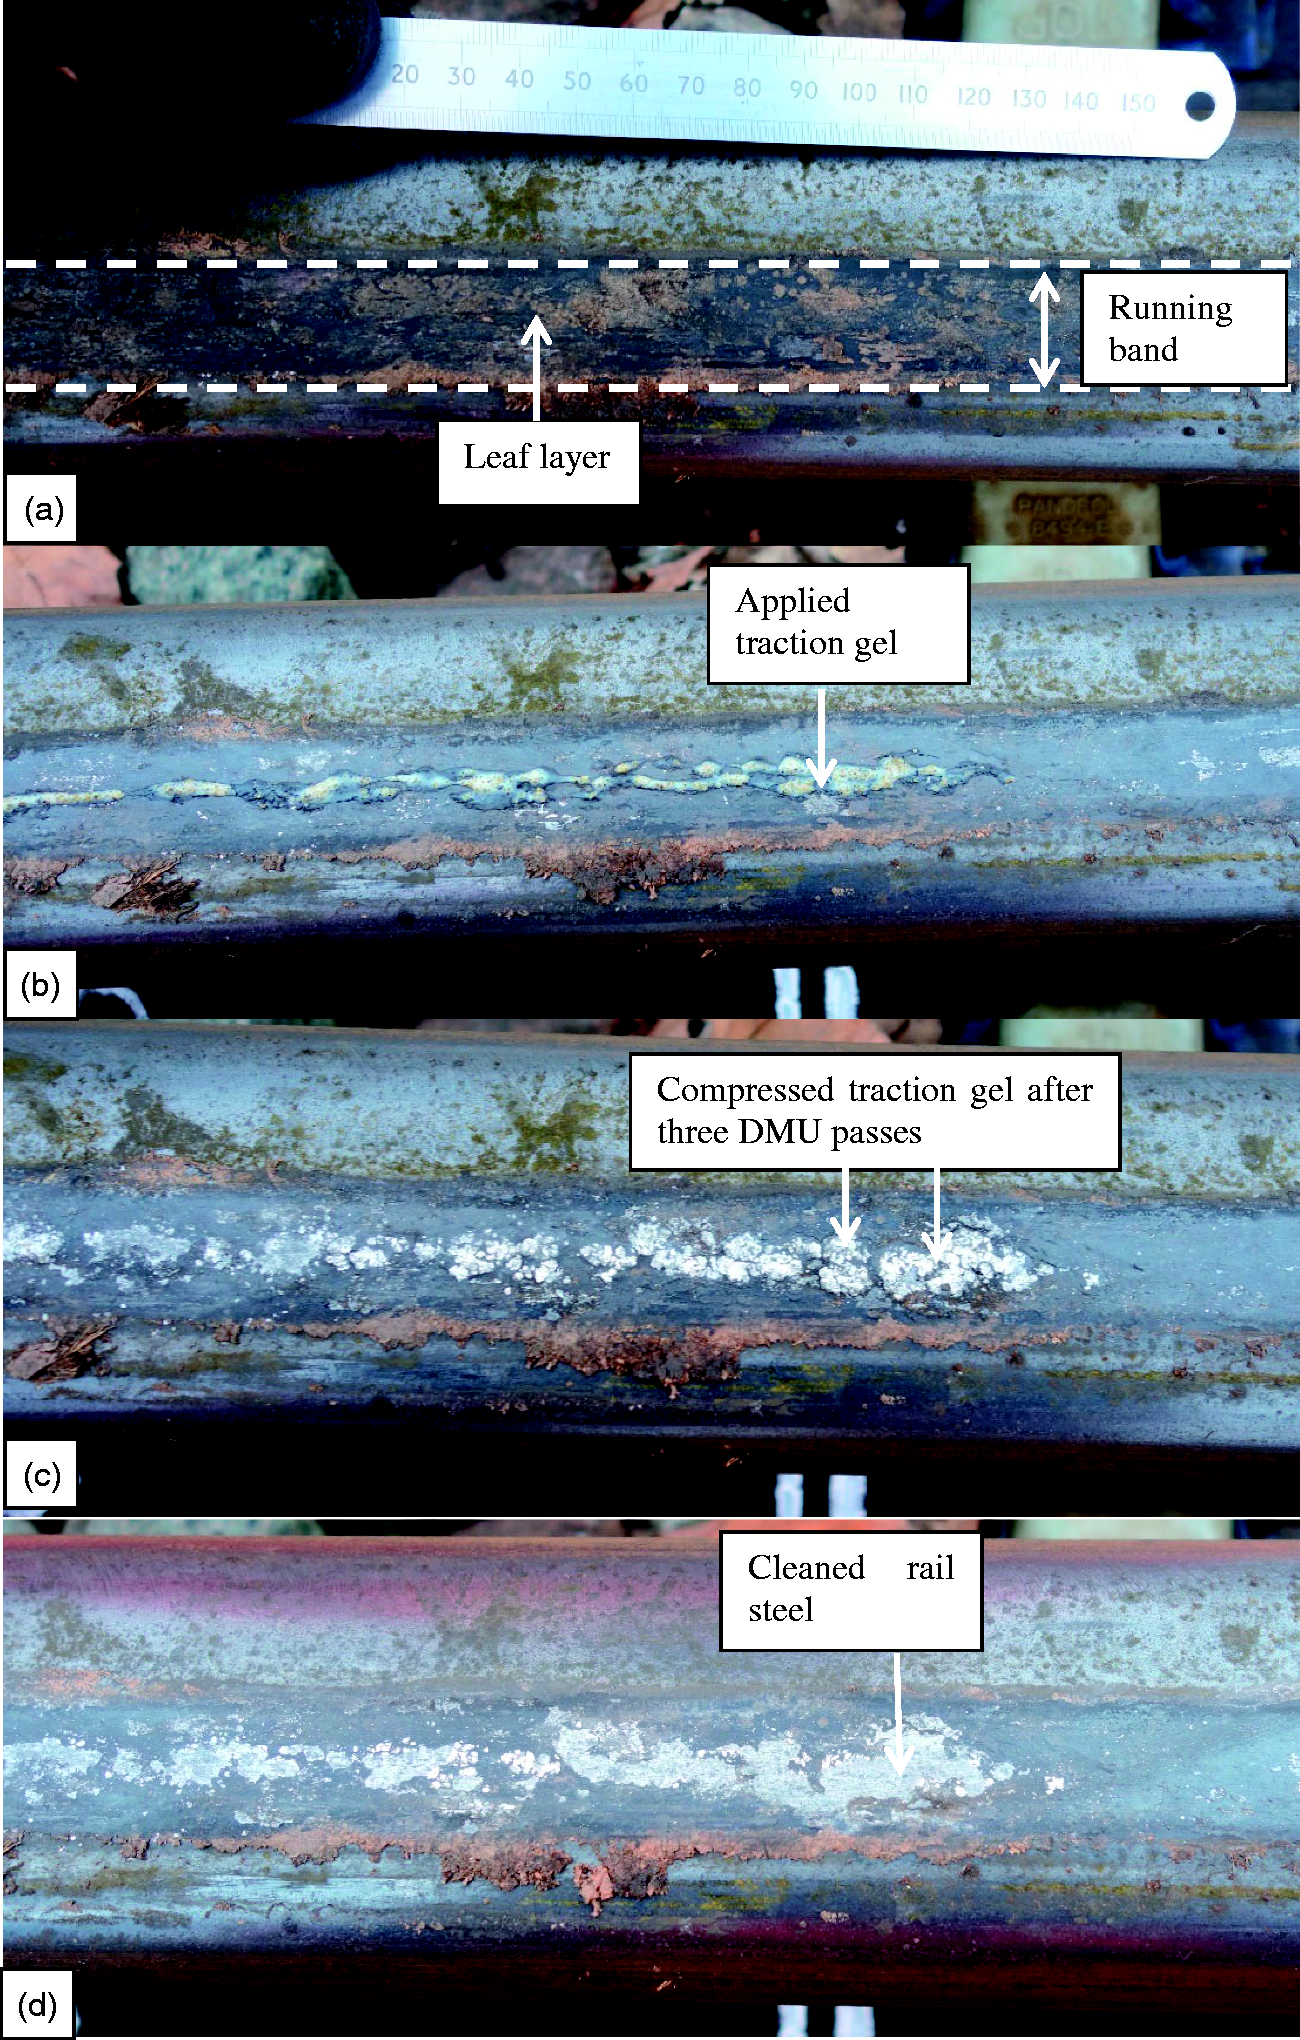
Traction gel removing a leaf layer; (a) the leaf layer before gel addition (b) the product deposited on the railhead (c) the product after 3 passes with the DMU (d) the railhead after wiping excess product away with a soft cloth.
Discussion
Full-scale testing
Retentivity tests
The sand particles become crushed in the contact during retentivity tests, forming a fine white powder that adheres to the rail and wheel (see Figure 7). The powder remains in the running band whilst the gel seems to be squeezed out of the contact within a single pass. This suggests that the gel is purely acting as a carrier for the sand particles; it is squeezed from the contact and therefore has a less significant effect on traction over the course of multiple wheel-passes. After 4 wheel-passes, neither the gel nor sand particles are being picked up by the wheel.
Traction performance
The dry values are consistent across the four cycles with peaks ranging between 0.20-0.25. This is slightly lower than the traction coefficients found on a railway using British Rail’s tribometer-train, which were between 0.25 and 0.4 10 and much lower than the dry traction coefficient seen in twin disc testing which is approximately 0.6. The adhesion difference between small and full scale testing is due to a thicker third body layer on the full-scale/field tests, as well as the rapidly recycling contact used in the twin disc contact. 11
The difference in traction coefficients under different conditions is clear in this data. A wet baseline was successfully achieved, producing traction coefficient values up to 0.16. This is again slightly lower than what would normally be expected (approximately 0.2), but the consistent values seen in this testing imply that the slightly lower than expected friction coefficients are due to the measurement system or the wheel and rail materials used, rather than the presence of any contamination. The slightly lower than expected values do not affect the overall trend observed in these results.
Figure 8 shows that the presence of traction gel in the contact has a positive effect on the traction coefficient, with values up to 0.32 being obtained. The increase in traction can be explained by the effect of the sand particles in the wheel-rail interface. As shown in Figure 6, the traction gel particles become crushed during the wheel-pass and adhere to the rail and wheel surface. This may increase the surface roughness of the two bodies (wheel and rail) and the number of trapped wear particles in the contact, increasing surface ploughing.
In previous twin disc testing, 6 traction gel reduced the traction coefficient to very low levels (0.04) compared to a dry contact at the beginning of a test and it was proposed that this was due to the gel component reducing the traction coefficient before being squeezed out. However, initial traction coefficient does not drop as low in this full-scale testing. There is a small increase between the first and second cycle of the traction gel test, but this was also seen in the dry testing.
Field testing
Brake testing
A low adhesion zone was successfully created using the method outlined in ‘Brake testing’ section, verified by the stopping distances and deceleration rates presented in Figure 9. The data shows an average increase in stopping distance of 30% and an average decrease in deceleration rate of 27% for the leaf layer compared to dry conditions. However, the results varied, likely due to differences in driver behaviour or leaf layer coverage.
The leaf layer created in this test, shown in Figure 13, is similar to the upper, loosely bonded, recently crushed leaf in Figure 1, rather than the tightly bonder, black, underlying layer as shown in Figure 2. The XPS testing showed that the levels of iron, oxygen and nitrogen were lower in the layer produced for the field braking tests which suggests that over time, more iron oxide becomes present in the leaf layer. This iron oxide may be required for the black, strongly bonded leaf layer to form. 9 Any differences in resulting friction due to these differences in leaf layer composition are currently unclear.
The leaf layer after field brake testing.
These tests showed that the traction gel was successful at mitigating against low adhesion due to leaf layers in this situation. This was confirmed by the average linear deceleration rates presented in Figure 9 where the application of traction gel on the leaf layer helped recover the deceleration rate to that of dry conditions. The stopping distance decreased when traction gel was applied to the leaf layer, indicating that traction gel successfully enhanced traction. There were changes in braking velocity, shown in Figure 10, which is inevitable in this type of field testing. This short series of tests could be expanded with further repeats in future work to help strengthen these conclusions.
As a comparison to previous work, the results from a separate set of field tests using the same DMU and leaf layer formation method is included in Figure 14. 9 Figure 14 shows the average linear deceleration for 41 braking tests on both dry (26 tests) and leaf contaminated rail (15 tests), with 5 consecutive braking runs carried out on each leaf layer produced using the same methodology described in this paper (‘Field testing’ section) The expected deceleration for the class 117 DMU under emergency braking conditions is represented by the grey horizontal line, showing that the leaf layer is producing low adhesion conditions. 9
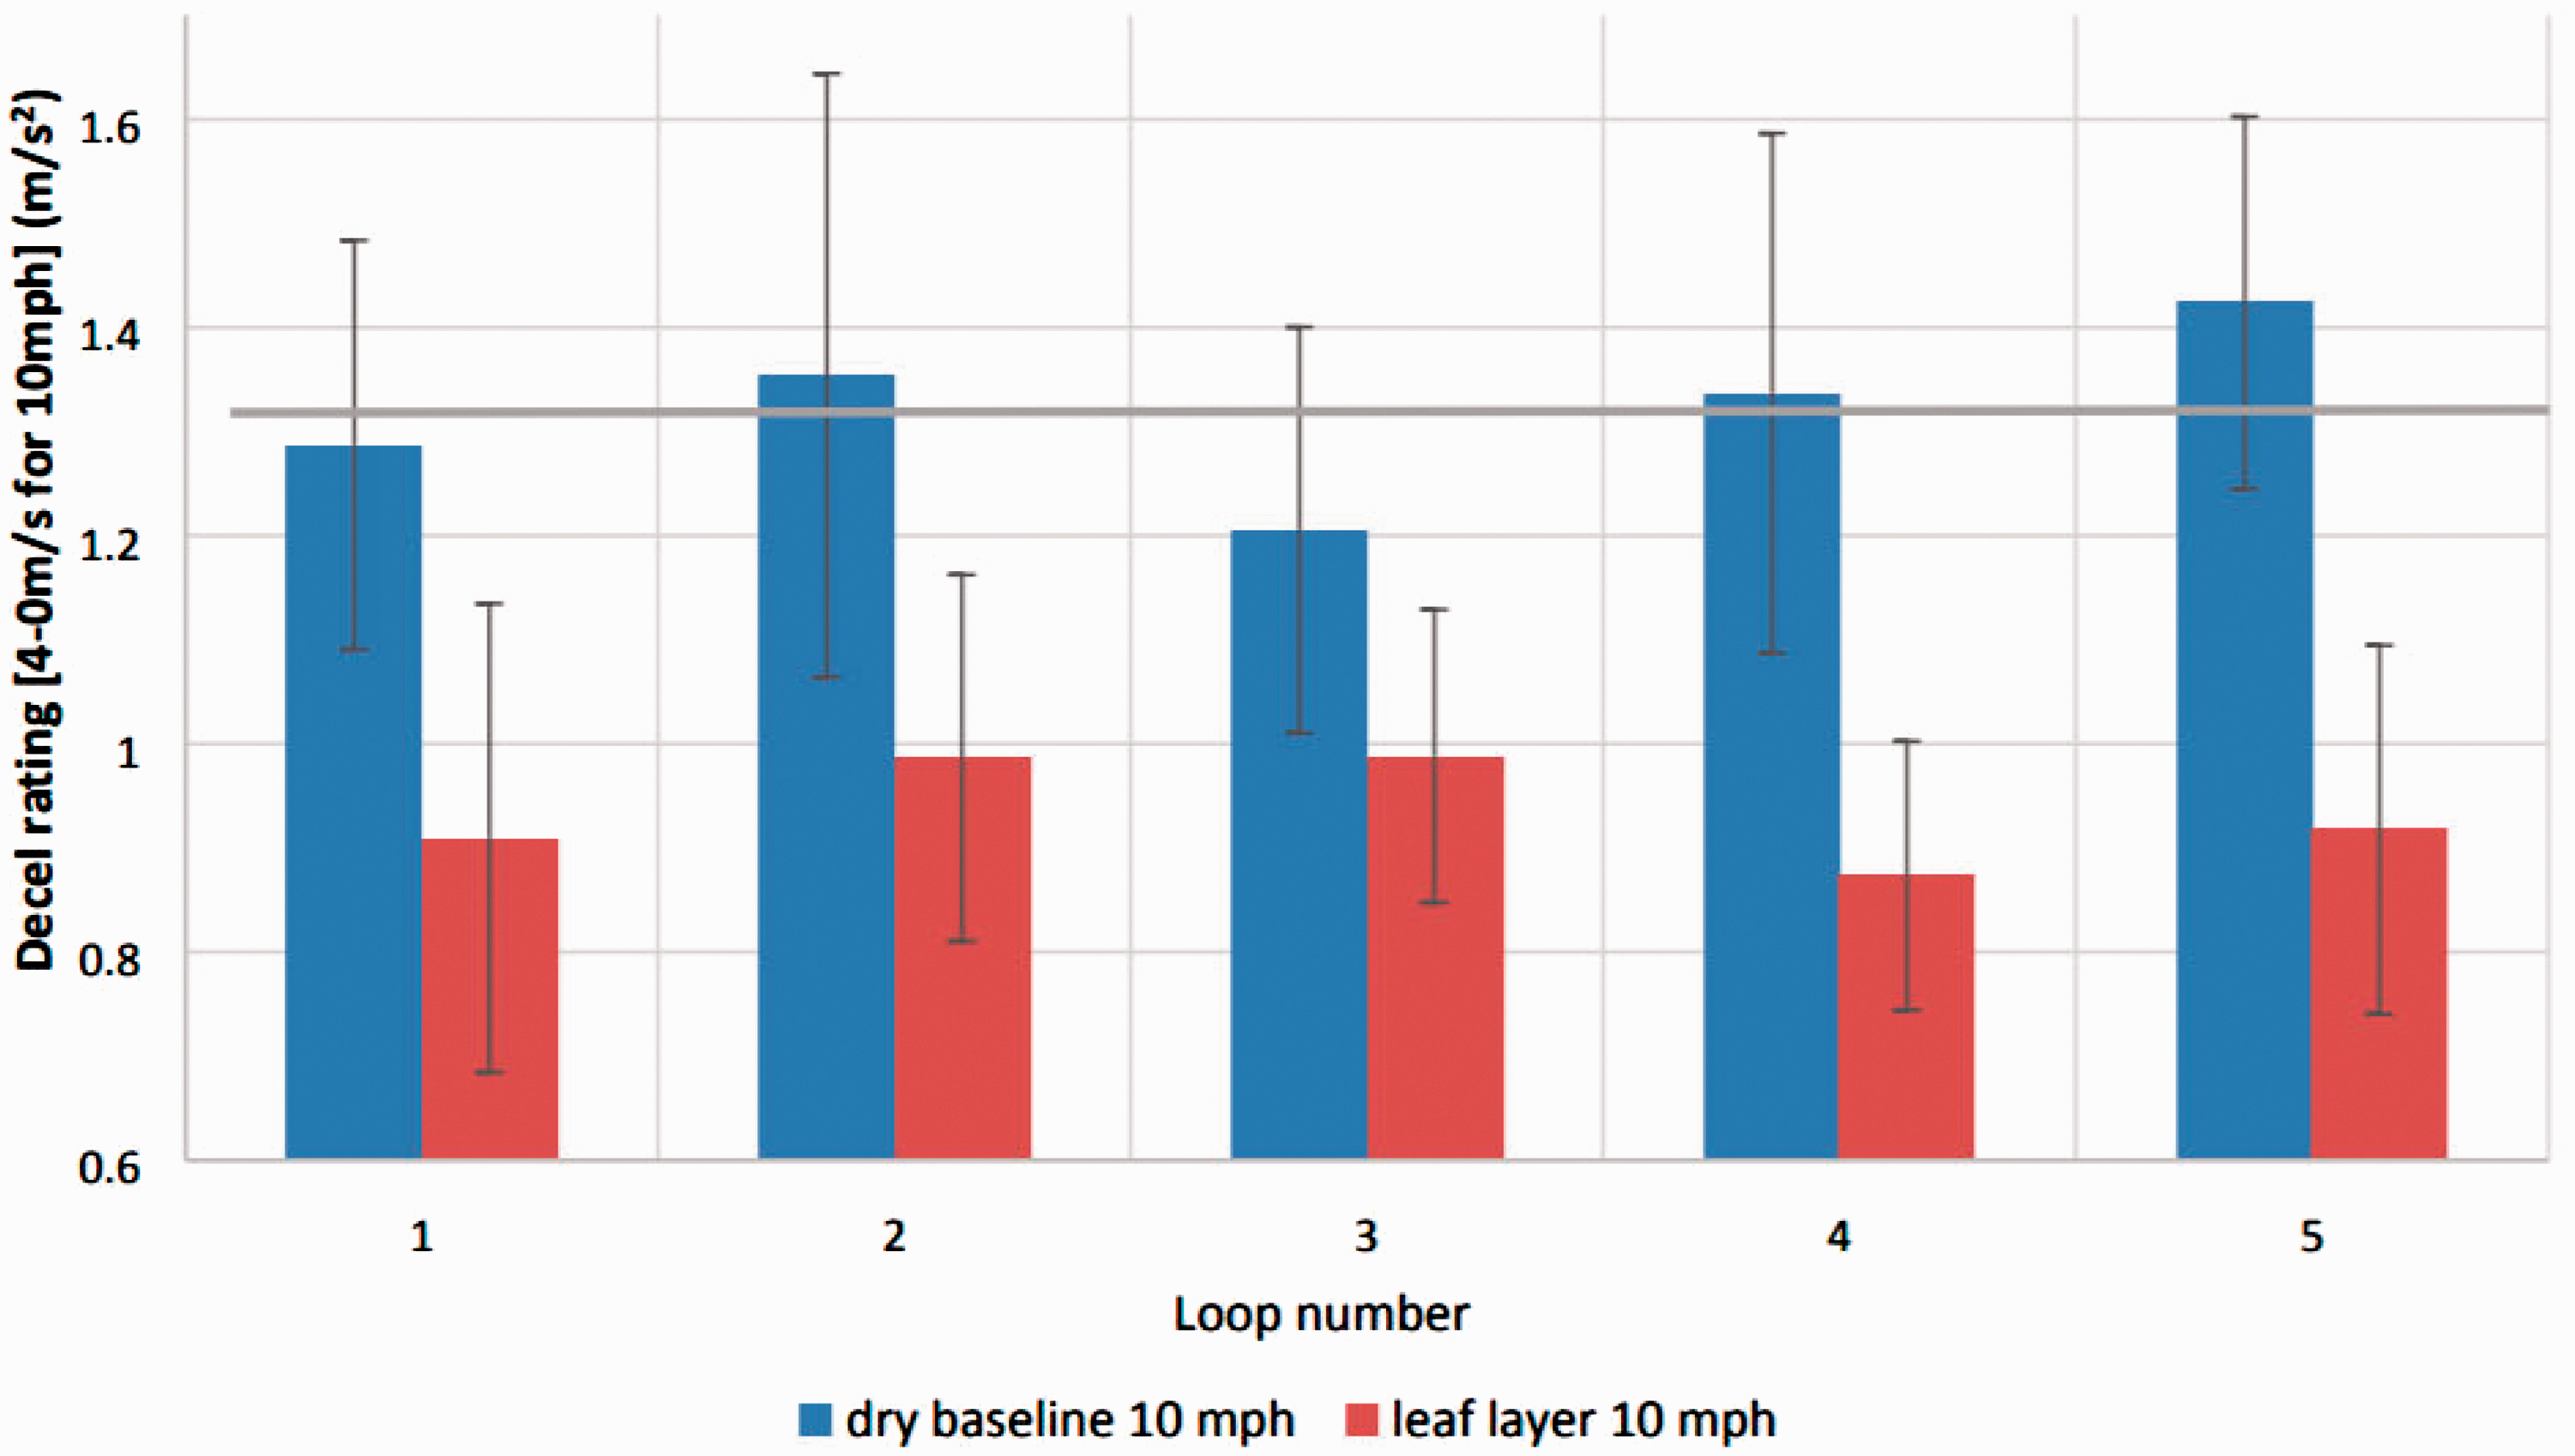
Previous results (41 total tests) showing the DMU braked from 10 mph. The grey horizontal line represents the expected deceleration for this class of DMU. 9
The results carried out in the current project gave an average dry deceleration of 1.09 m/s2 and a deceleration of 0.80 m/s2 on the leaf layer. This dry deceleration is lower than the average for previous tests in Figure 14.9 The leaf layer deceleration results are similar to that recorded in previous work, 9 although at the lower end of the results range. These differences are expected in field testing due to the number of variables, for example time of year, weather conditions, wheel and rail condition, leaf composition or driver braking behaviour.
Based on the information shown in Figure 14, and presented in the previous work, the average friction coefficient for the testing under dry conditions was found to be: µ = 0.135. The friction coefficient for the leaf layer tests was found to be µ = 0.095. 9
The highest deceleration values occurred when traction gel was applied to an uncontaminated rail in the “traction gel only” tests, but these were similar to previously collected dry values. Further field testing repeats would be needed to determine whether traction gel enhances the braking performance in a dry situation due to the low number of repeats and variability of field testing.
Network operators tend to turn off traction gel applicators outside the autumn season as they are thought to be ineffective in the absence of a leaf layer or in some instances even cause low adhesion, so these results are important in supporting the hypothesis that traction gels do not appear to create braking issues when used in non-leaf contaminated areas.
The images in Figure 11 show the condition of the traction gel application zone after a single test run. Images were recorded after every test and were all similar. The most noteworthy aspect of the images is the condition of the traction gel in the rail contact band, which is clearly seen as a strip of white powder along the middle of the rail. This confirms the observations in the full-scale rig tests where the gel is dispersed during a single wheel-pass, leaving the solid particles to become crushed in the contact. Video footage was also analysed and confirmed that the particles were adhering to the wheel tread.
Leaf layer removal
The results of the leaf layer removal tests show that in this situation, the traction gel is effective at removing the leaf layer. After rolling over three times with the DMU and wiping away excess product, the bare steel underneath the traction gel can be clearly seen. The solid traction gel particles that were wiped away after the test looked finer than originally laid down and the gel component was no longer present. This implied that the gel was squeezed out and the solid particles crushed, confirming the mechanism proposed in previous work. 6 The shape of the bare underlying steel exactly matched the shape of the crushed traction gel, implying that the solid particles were embedded into the leaf layer and sheared it when compressed.
The traction gel only removed the leaf layer in the area where it was laid down and compressed, which implies that the solid product particles were preferentially remaining on the railhead during these rolling tests, rather than sticking to the wheel and rolling further along the railhead. This is likely due to the leaf layer being softer than the wheel steel
The leaf layer created on a closed-loop test track in these tests causes low adhesion, but is not as well bonded as those seen in the field as seen in Figure 2. Further validation on a leaf layers found on a working railway line could be carried out in future.
Conclusions
The full scale laboratory testing showed that traction gel was able to increase the traction coefficient compared to both a dry and wet contact. In future work, a realistic low-adhesion layer could be created from leaves using the FSR, similar to that created in the field testing in this work.
A low adhesion layer was created during the field braking tests and traction gel successfully mitigated the low adhesion. When traction gel was applied to a dry railhead, it did not impede the braking performance of the DMU. The traction gel was also able to remove leaf layers as well as increasing traction, although this should be repeated on a leaf layer that has been formed on a line in service due to the chemical differences between the leaf layers.
Multiple methods have been presented in this work, which can be used in future to provide more detailed comparisons of products and to help develop new products. Future work should be carried out to compare small and full-scale results to assess scaling effects and help validate small scale tests.
Footnotes
Declaration of Conflicting Interests
The author(s) declared no potential conflicts of interest with respect to the research, authorship, and/or publication of this article.
Funding
The author(s) received no financial support for the research, authorship, and/or publication of this article.