
Abstract
Clinching is a mechanical joining technology, in which a mainly form-fit joint is created by means of local cold forming. To characterize the load-bearing behavior of such joints, they are typically analyzed destructively, for example by tensile-shear tests in combination with metallographic sections. However, both the initiation and progress of failure can only be described to a limited extent by this method. Furthermore, these tests allow only limited conclusions about clinch points under in-service loading. More purposefully, clinch points can be analyzed nondestructively by combining in-situ computed tomography (CT) and transient dynamic analysis (TDA). The TDA continuously measures the dynamic behavior of the specimen and indicates failure events like crack initiation, which then can be evaluated thoroughly by stopping the test and performing a CT scan. To qualify the TDA for this task, it is necessary to link the observed damage behavior with specific dynamic characteristics. In this work, the complementation of in-situ CT and TDA is investigated by testing a clinched single-lap tensile-shear specimen made of aluminum. The testing procedure is stepwise: at certain displacement levels, the specimen is investigated by in-situ CT and TDA. While the in-situ CT provides the location, extent, and development of the failure phenomena, the TDA uses this information to evaluate the dynamic signal and detect relevant frequency ranges, which indicate damage events. The results demonstrate, that failure initiation and progression can be analyzed efficiently by combining both measuring systems. The TDA reliably detects relevant signal changes in the monitored frequency band. By means of in-situ computed tomography, the corresponding failure phenomena can be described in detail, enhancing the understanding of the load-bearing and deformation behavior of clinch points. The concatenation of characteristic signal changes and observed failure phenomena can henceforth be transferred to analyze complex structures during operation nondestructively by TDA.
Introduction
In nowadays car body constructions, various materials are combined requiring adequate joining solutions. Likewise, products are desired to be well separable during recycling. Compared to joining lightweight materials such as aluminum by bolting and riveting, clinching can allow good recyclability as there are no additional ferrous joining parts introduced to the system. 1 Additionally, when high-strength adhesives are used, clinching has further recycling advantages. 1 Moreover, different materials can be joined 2 and 30–60% of the costs compared to resistance spot welding can be saved. 3
When analyzing the failure behavior of clinch points, mechanical testing according to ISO 12996 4 often in combination with macroscopic examination or (ex-situ) computed tomography (CT) is common. Here, the macroscopic examination enables the analysis of deformations and cracks in a specific cross-section, whereas CT allows a three-dimensional analysis of the clinch point. However, due to elastic springback and closing crack phenomena, these methods have only limited informational value. 2 Additionally, the development of deformations or cracks cannot be analyzed. Thus, in this study, an alternative approach for analyzing the failure behavior of a clinch point by combining in-situ CT and transient dynamic analysis (TDA) is investigated.
In-situ CT
Ex-situ CT is an established method for three-dimensional analysis. In order to upgrade an object in situ, the testing machine can be combined with a conventional CT system and the testing process is interrupted at different displacements. At each interruption (measurement point—MP), a CT scan is performed while the specimen is at rest but constantly loaded. This nondestructive testing method can for instance be used for composite materials to detect internal imperfections and inhomogeneities 5 or for additively manufactured aluminum alloys, providing insights into the evolution of pores under tensile loading. 6 Furthermore, it can be used to analyze various types of joints. For example, it can evaluate the damage behavior of a single overlapping adhesively bonded riveted lap joint of FRP and Al 7 or of a metal pin joining fiber-reinforced sheets. 8 Especially the interaction of metal inserts and FRP is investigated in depth. Here, tests with loading in a vertical direction were performed using inserts embedded in glass FRP 9 or embedded in carbon FRP. 10 Furthermore, in-situ CT can be used to measure the internal displacement field in adhesives by tracking characteristic markers within adhesives during loading. 11 Additionally, it has the potential to validate numerical models of joining processes 12 or shear tests 13 of clinch points.
When analyzing local phenomena such as cracks in clinch points, good image contrast and low noise are required. This leads to CT scans with a measurement duration (beamtime) of up to 120 min. Moreover, an in-situ CT investigation multiplies the beamtime by the factor of the investigated number of MP. Additionally, when analyzing failure behavior in classical in-situ CT, the specimen needs to be investigated in small, incremental steps near the expected failure initiation. Considering also the variance of failure initiation between different specimens, a high number of CT scans is required, resulting in high measuring efforts.
Dynamic analysis
Since CT is an expensive procedure, the aim is to reduce beamtime during in-situ CT while maintaining or increasing the informational gain. One approach is the combination with another nondestructive testing method, like the TDA as described in Sadeghian et al. 14 The TDA investigates the dynamic behavior of a structure by selectively introducing structure-borne sound waves by a piezoceramic actuator and recording the damped response behavior using a piezoceramic sensor with a high temporal resolution.
There is a variety of dynamic analysis methods, which are used in particular for structural health monitoring 15 and condition-based maintenance. 16 In addition to the field of application, these methods differ in terms of vibration introduction 17 and evaluation, for example on the basis of dissipated energy 18 or changes in amplitudes. 19 Current studies are focusing on the possibilities of data evaluation, especially utilizing machine learning. 20 With regard to mechanical joints, various works are available for bolted joints. For example, the increase of damping while maintaining the load-carrying capacity of a steel beam structure 19 or the monitoring of bolt loosening. 18 In own preparatory work the TDA was successfully applied to bolted 21 and clinched joints. 22 However, the interpretation of the data with regard to clinch points as well as the application limits of the TDA is still the subject of ongoing research.
Combined in-situ CT and dynamic analysis
In order to evaluate the application of a combined TDA and in-situ CT, this article examines the failure behavior of clinched aluminum specimens. The experimental procedure is shown in Figure 1. As a first step, a continuous quasi-static tensile-shear test is performed and the critical displacement is determined as the uniform strain is exceeded. In order to cover the defect initiation in an in-situ CT and TDA investigation with a new specimen, MPs are selected with fine displacement differences in the proximity of the critical displacement. At each MP, a TDA and CT measurement of the loaded specimen is performed.
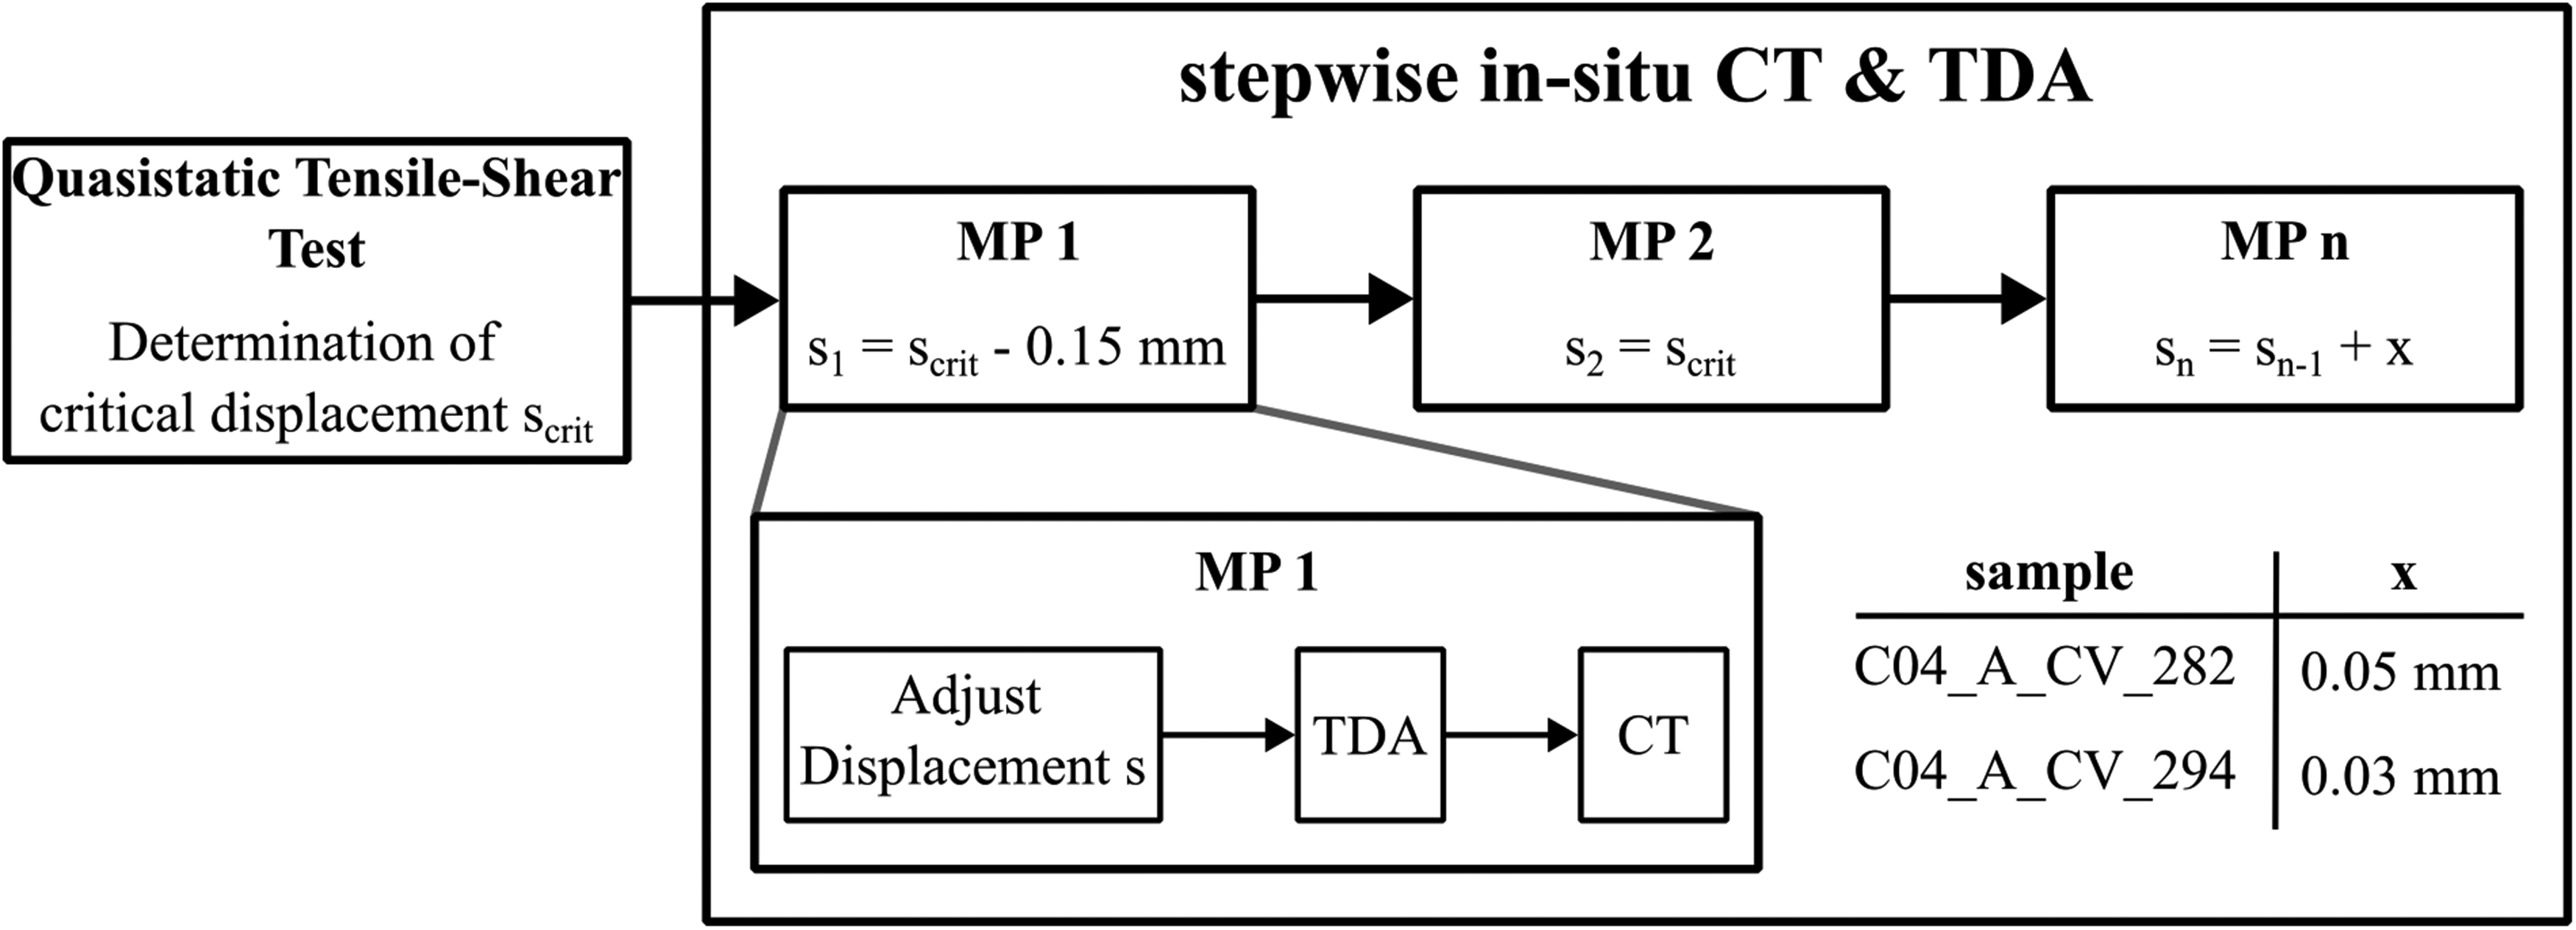
Procedure of stepwise in-situ CT and TDA.
Methods
Specimen preparation
Each test specimen consists of two aluminum sheets of 2 mm thickness (EN AW 6014-T4, Advanz™ 6F-e170, Novelis Inc., Atlanta, USA) that are clinched with a punch A50100 and a die BE8012 (both TOX PRESSOTECHNIK GmbH & Co. KG, Weingarten, Germany). EN AW 6014-T4 with the properties described in Supplemental Tables 1 and 2 is chosen as the material as it is a common material in the automotive industry. 23 In order to investigate different failure phenomena, a regular specimen as well as a specimen with initial defect are investigated. The specimen with an initial defect is manufactured using a punch with a lateral punch offset δ = 0.2 mm in the y-direction (specimen C04_A_CV_294, see Figure 2(a)). The regular specimen is manufactured with an offset δ = 0 mm (specimen C04_A_CV_282). Both specimens are solution heat-treated and artificially aged (T6) at 185 °C for 20 min. The specimen has been labeled according to the Transregional Collaborative Research Centre 285/2 guideline.
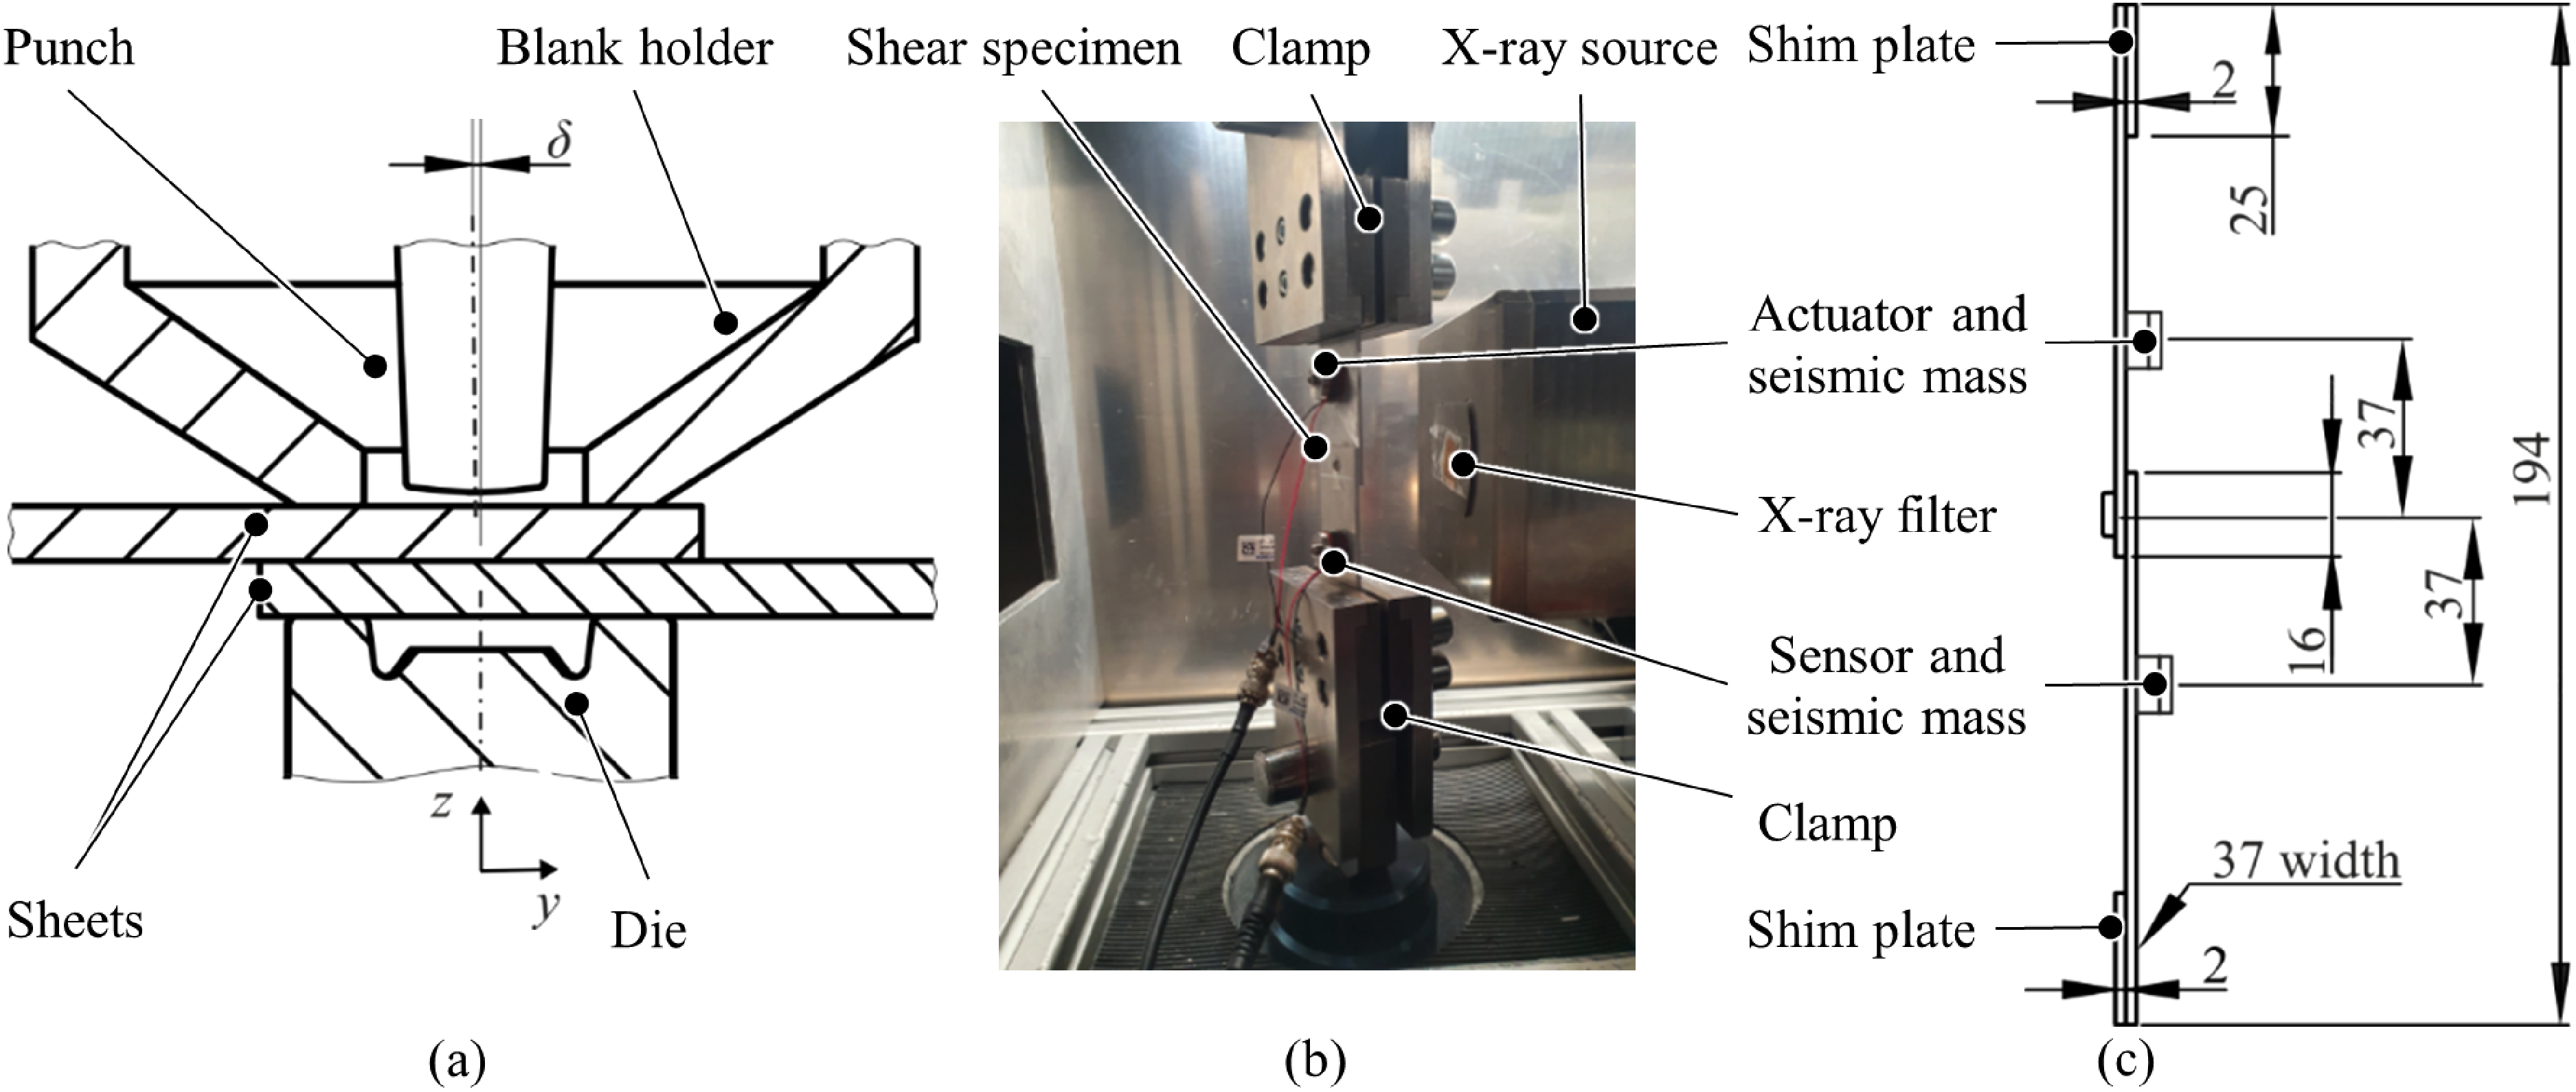
Clinching setup with lateral offset δ of the punch relative to the die (a); experimental setup for in-situ CT and TDA during tensile-shear testing of clinched specimens (b); specimen dimensions (c).
The single-lap tensile-shear specimen dimensions are leaned on ISO 12996, see Figure 2(c). However, in contrast to the standard, the specimen width is 37 mm (cf. Figure 2(c)) to fit the clamps and an additional clearance hole Ø 3.3 mm per sheet was provided for mounting a stacked piezoceramic element for the TDA in reproducible position. Furthermore, two shim plates are adhesively bonded onto the ends of the sheets to ensure a deformation-free clamping of the specimens.
In-situ CT measurement setup
The specimens are tested in a tensile testing machine ZwickRoell Z250 (ZwickRoell GmbH & Co. KG, Ulm, Germany) with the lower traverse moving at approximately 50% relative humidity and 20 °C ambient temperature. Stopping the displacement at specific MPs allows the specimen to be investigated using the CT system FCTS 160—IS (FineTec FineFocus Technologies GmbH, Garbsen, Germany, 150 kV transmission tube). The MPs are finely graded inside a range covering the critical displacement which is derived from continuous quasi-static tensile-shear tests. The in-situ CT parameters are shown in detail in Table 1. After scanning, the digital volumes are reconstructed using the Feldkamp algorithm in Cera eXplorer (Version 2.3.1 Siemens Healthcare GmbH, Erlangen, Germany). The subsequent digital evaluation is done with the volume graphics program VG Studio Max (Version 3.4, Volume Graphics GmbH, Heidelberg, Germany).
In-situ CT parameters.
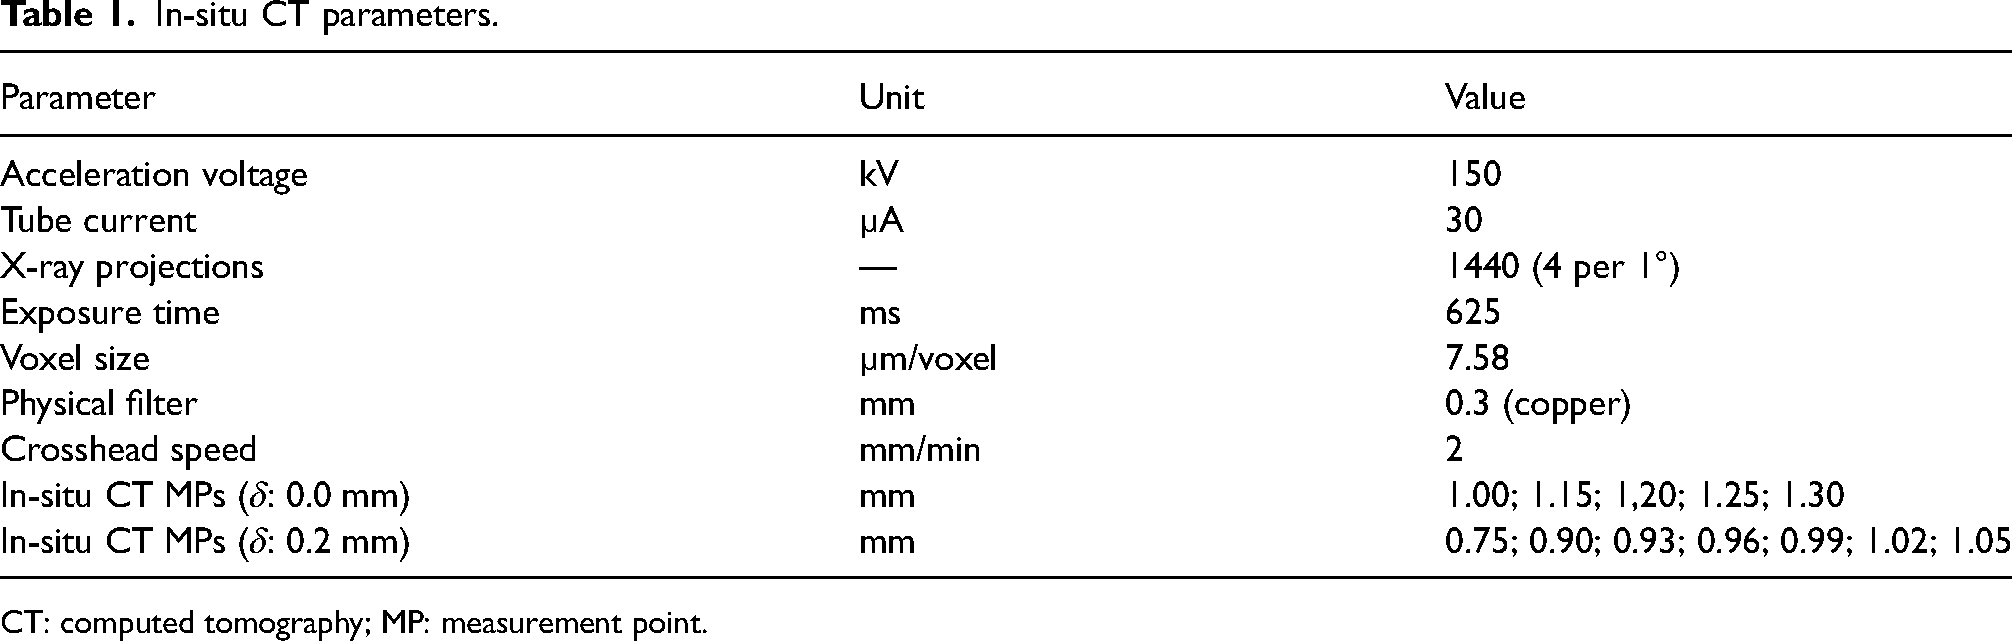
CT: computed tomography; MP: measurement point.
TDA setup
The application of the TDA is realized tactilely using stacked piezoceramic elements (Type P-016.00h, PI Ceramic GmbH, Lederhose, Germany). These elements including the seismic mass are axially preloaded by a bolted joint. The bolted joint of size M3 is assembled with a tightening torque of M = 2.2 Nm to set up the compressive stress required for dynamic use. The actuator (excitation) is mounted on the die side sheet, and the sensor (response) is located on the punch side sheet. The actuator and the sensor are both equipped with an effective seismic mass of m = 9.5 g. This intensifies the initiated vibration at the actuator and, at the same time, increases the sensitivity of the sensor. The seismic masses used reduce the resonance frequency of the piezoelectric stack actuators from f = 144 kHz to f ≈ 76 kHz.
LabView (National Instruments Corp., Austin, Texas, United States) is used to control the measurement process. The sinusoidal excitation with an amplitude of 4 V is emitted via the analog output of the NI6356 data acquisition card (National Instruments Corp., Austin, Texas, United States) and amplified to U = 67 V by means of an analog signal amplifier type HV-LE150-100-EBW (piezosystem jena GmbH, Jena, Germany). The measurement data obtained are recorded using the NI6356 (National Instruments Corp., Austin, Texas, United States). The sampling rate used is equivalent to eight times the excitation frequency.
The filtering of the recorded raw data differs between the two investigations shown in order to improve the signal quality of the TDA. The data of specimen C04_A_CV_282 is filtered with a high-pass filter (cut-off frequency f = 147 Hz). The data of specimen C04_A_CV_294 (δ = 0.2 mm) passes a combination of a f = 1 kHz high-pass filter (type EF111, Thorlabs Inc., Newton, New Jersey, United States) and a f = 30 kHz low-pass filter integrated in the Kistler 5018A charge amplifier (Kistler Instrumente AG, Winterthur, Switzerland) used. The high-pass filter avoids influences of the mains fluctuations on the measurements. The additional low-pass filtering eliminates aliasing effects in the considered frequency range.
While the specimen is at rest at each MP and before the in-situ CT measurement, TDA measurements are carried out stepwise. The specimen is excited with a defined frequency, starting at 100 Hz, for 2 s. To analyze a harmonic oscillation, only the last 0.5 s of the measurement are recorded and evaluated. Subsequently, the excitation frequency is increased by 100 Hz and the test procedure repeats until the excitation frequency of 20 kHz is reached.
Results and discussion
In-situ CT results
Photographs showing the initial state of the specimens and of the failure phenomena of each specimen can be found in Supplemental Figure 1. In Figure 3 the force–displacement curves of the continuous quasi-static and the in-situ CT tests are shown. The continuous tests, with and without lateral punch displacement, exhibit a similar maximum force of 2170 N and 2130 N, respectively. However, for the specimens with offset, the sharp drop in force occurs at much lower displacements. This goes along with the reduced neck thickness in the highly stressed neck area of the specimens with lateral offsets. Based on these results, the MPs for in-situ CT measurements are finely arranged around the critical displacement. In the force–displacement curve of the in-situ CT with δ = 0.2 mm, a significant drop in force at the MP = 0.99 mm is visible.
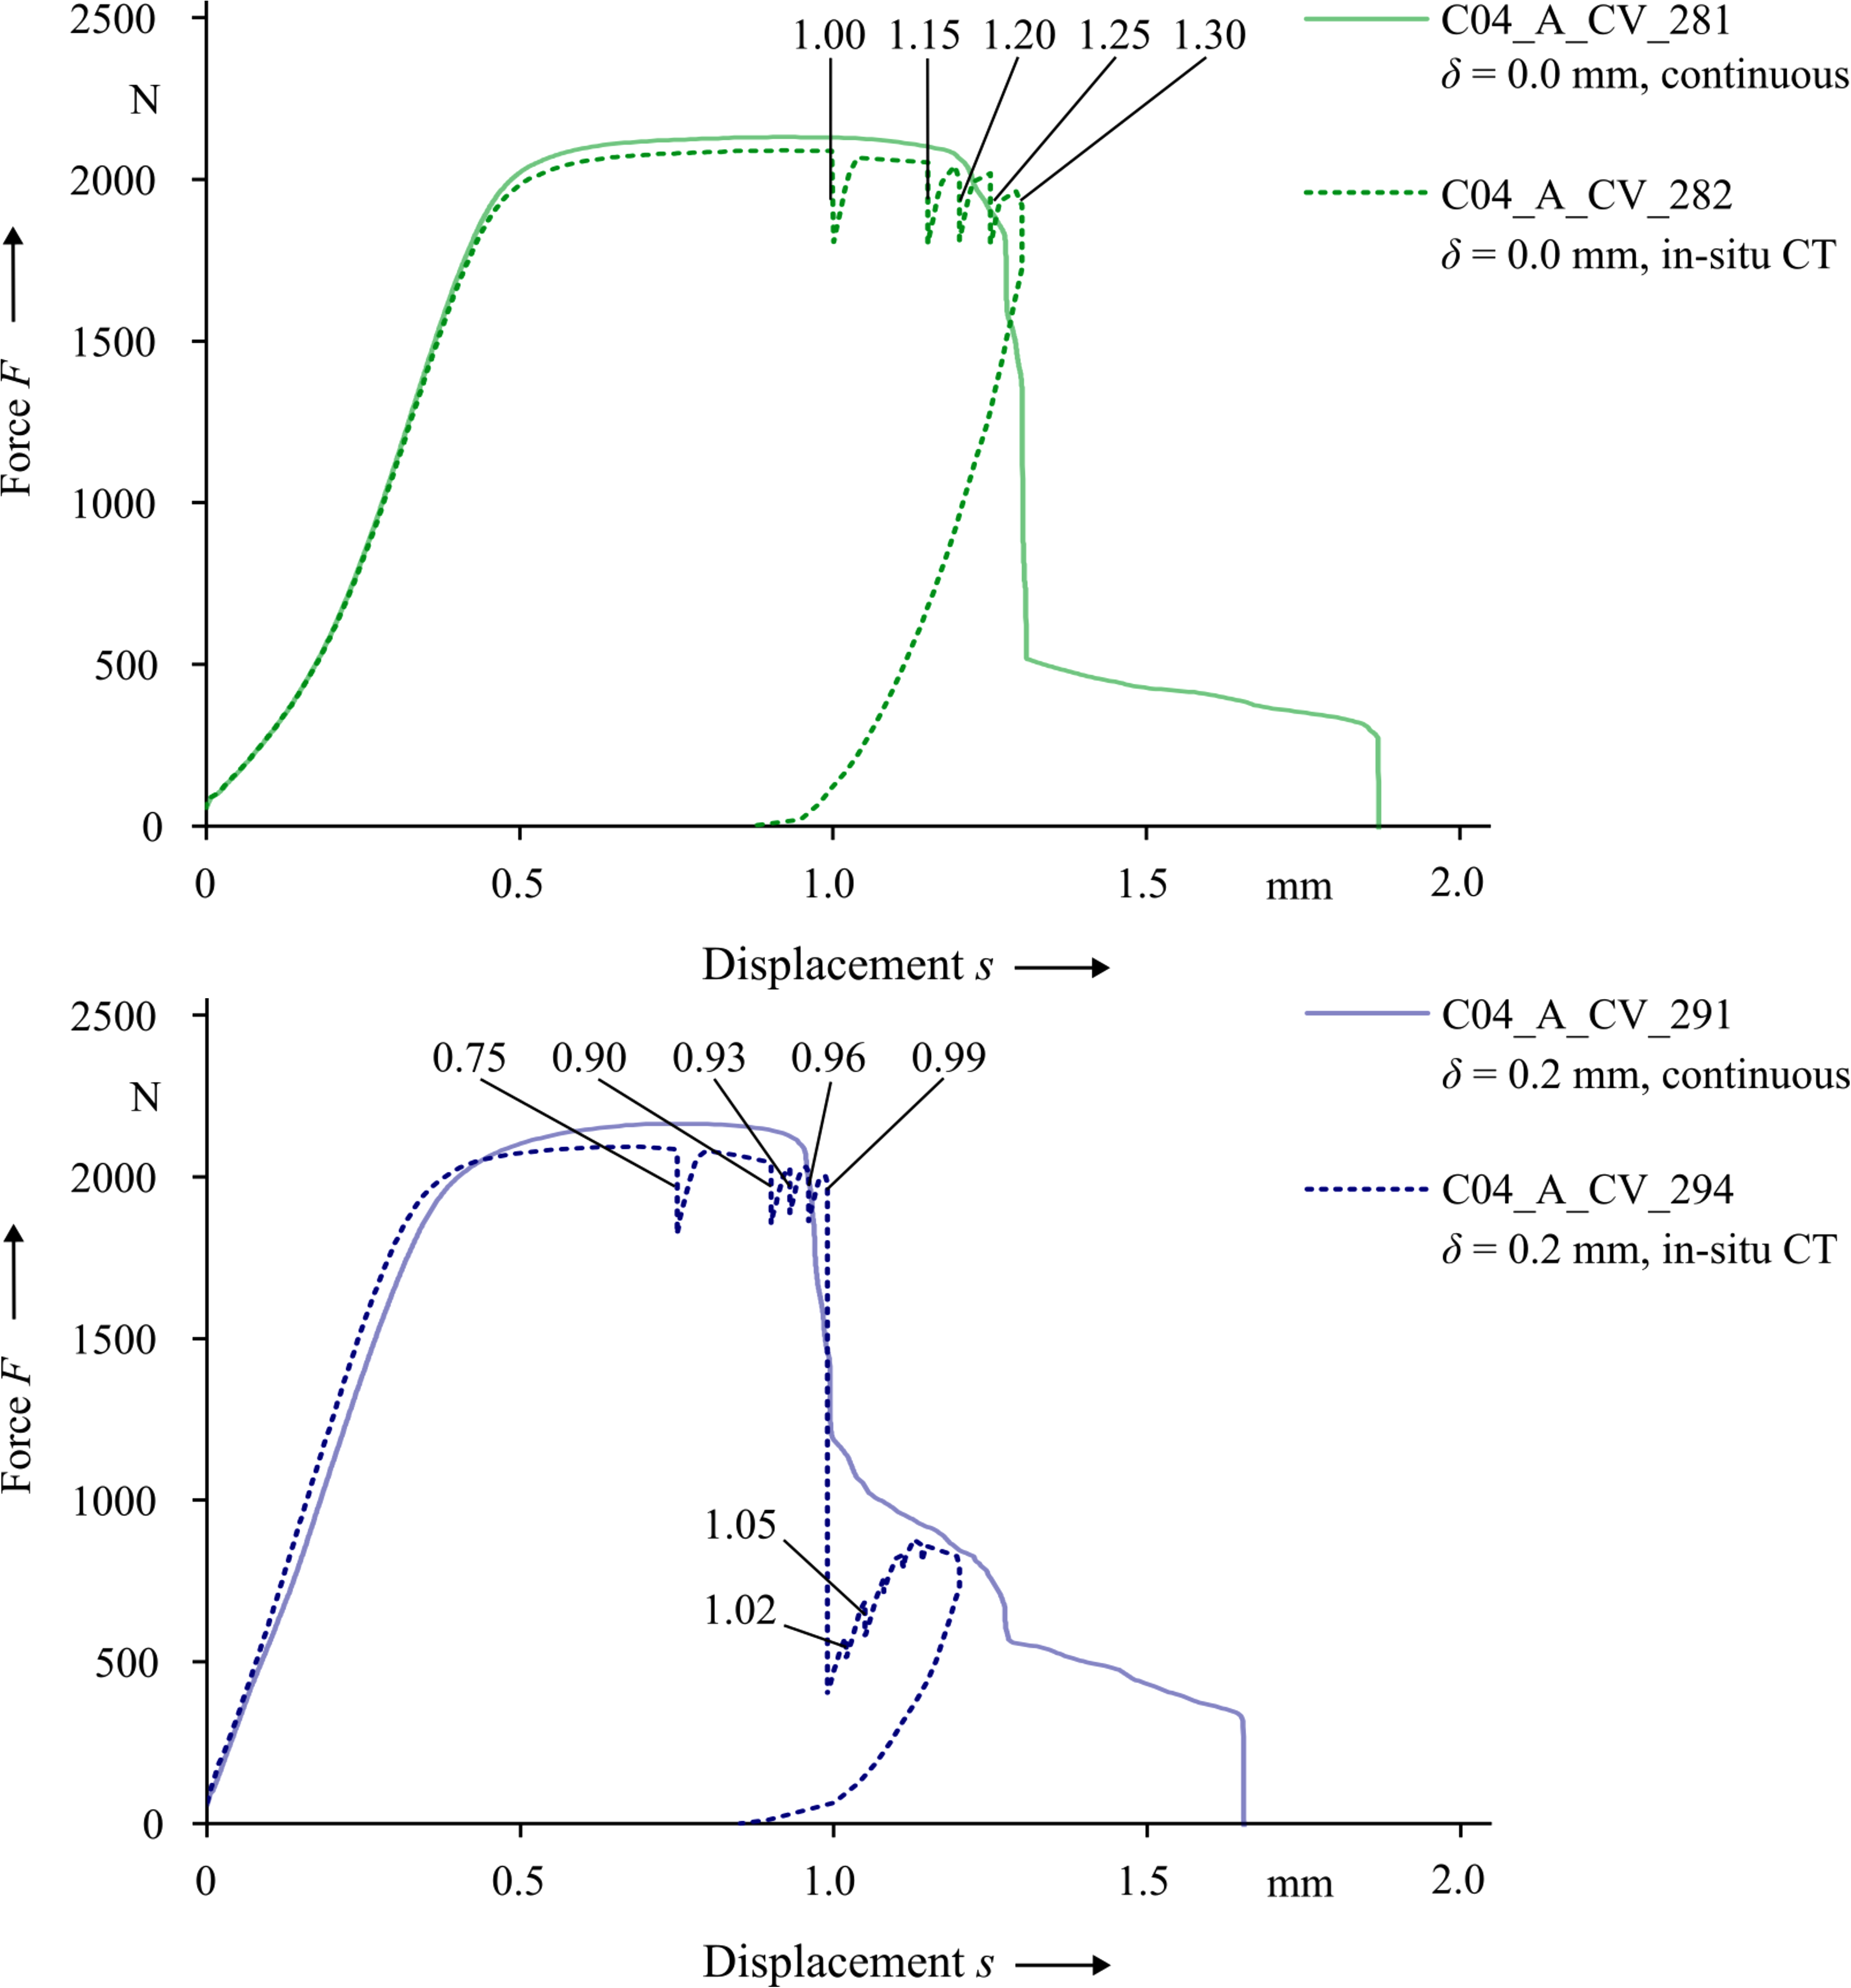
Force displacement diagram of the continuous and in-situ CT tests with 0.0 mm (a) and 0.2 mm (b) lateral punch offset specimens with the respective MP.
Figure 4 shows five transverse tomograms of C04_A_CV_282, a specimen with δ = 0.0 mm, at the investigated MPs in the in-situ CT measurement. The deformation state without visible failure phenomena is shown in (a). Then the chronology of the failure phenomena necking (b and c), crack initiation in the neck at the side of the specimen (d) and crack propagation (e) can be clearly traced. At MP = 1.25 mm a crack can be found in the neck area, significantly before the drop in force occurs (cf. Figure 3(a)). The crack is investigated in detail in Figure 5. Here, the sagittal tomogram (a) is shown, which is usually investigated in a macrograph analysis, showing no failure phenomenon. However, the parasagittal (b) and -coronal (c) tomogram at the respective load level allow the analysis of the crack.
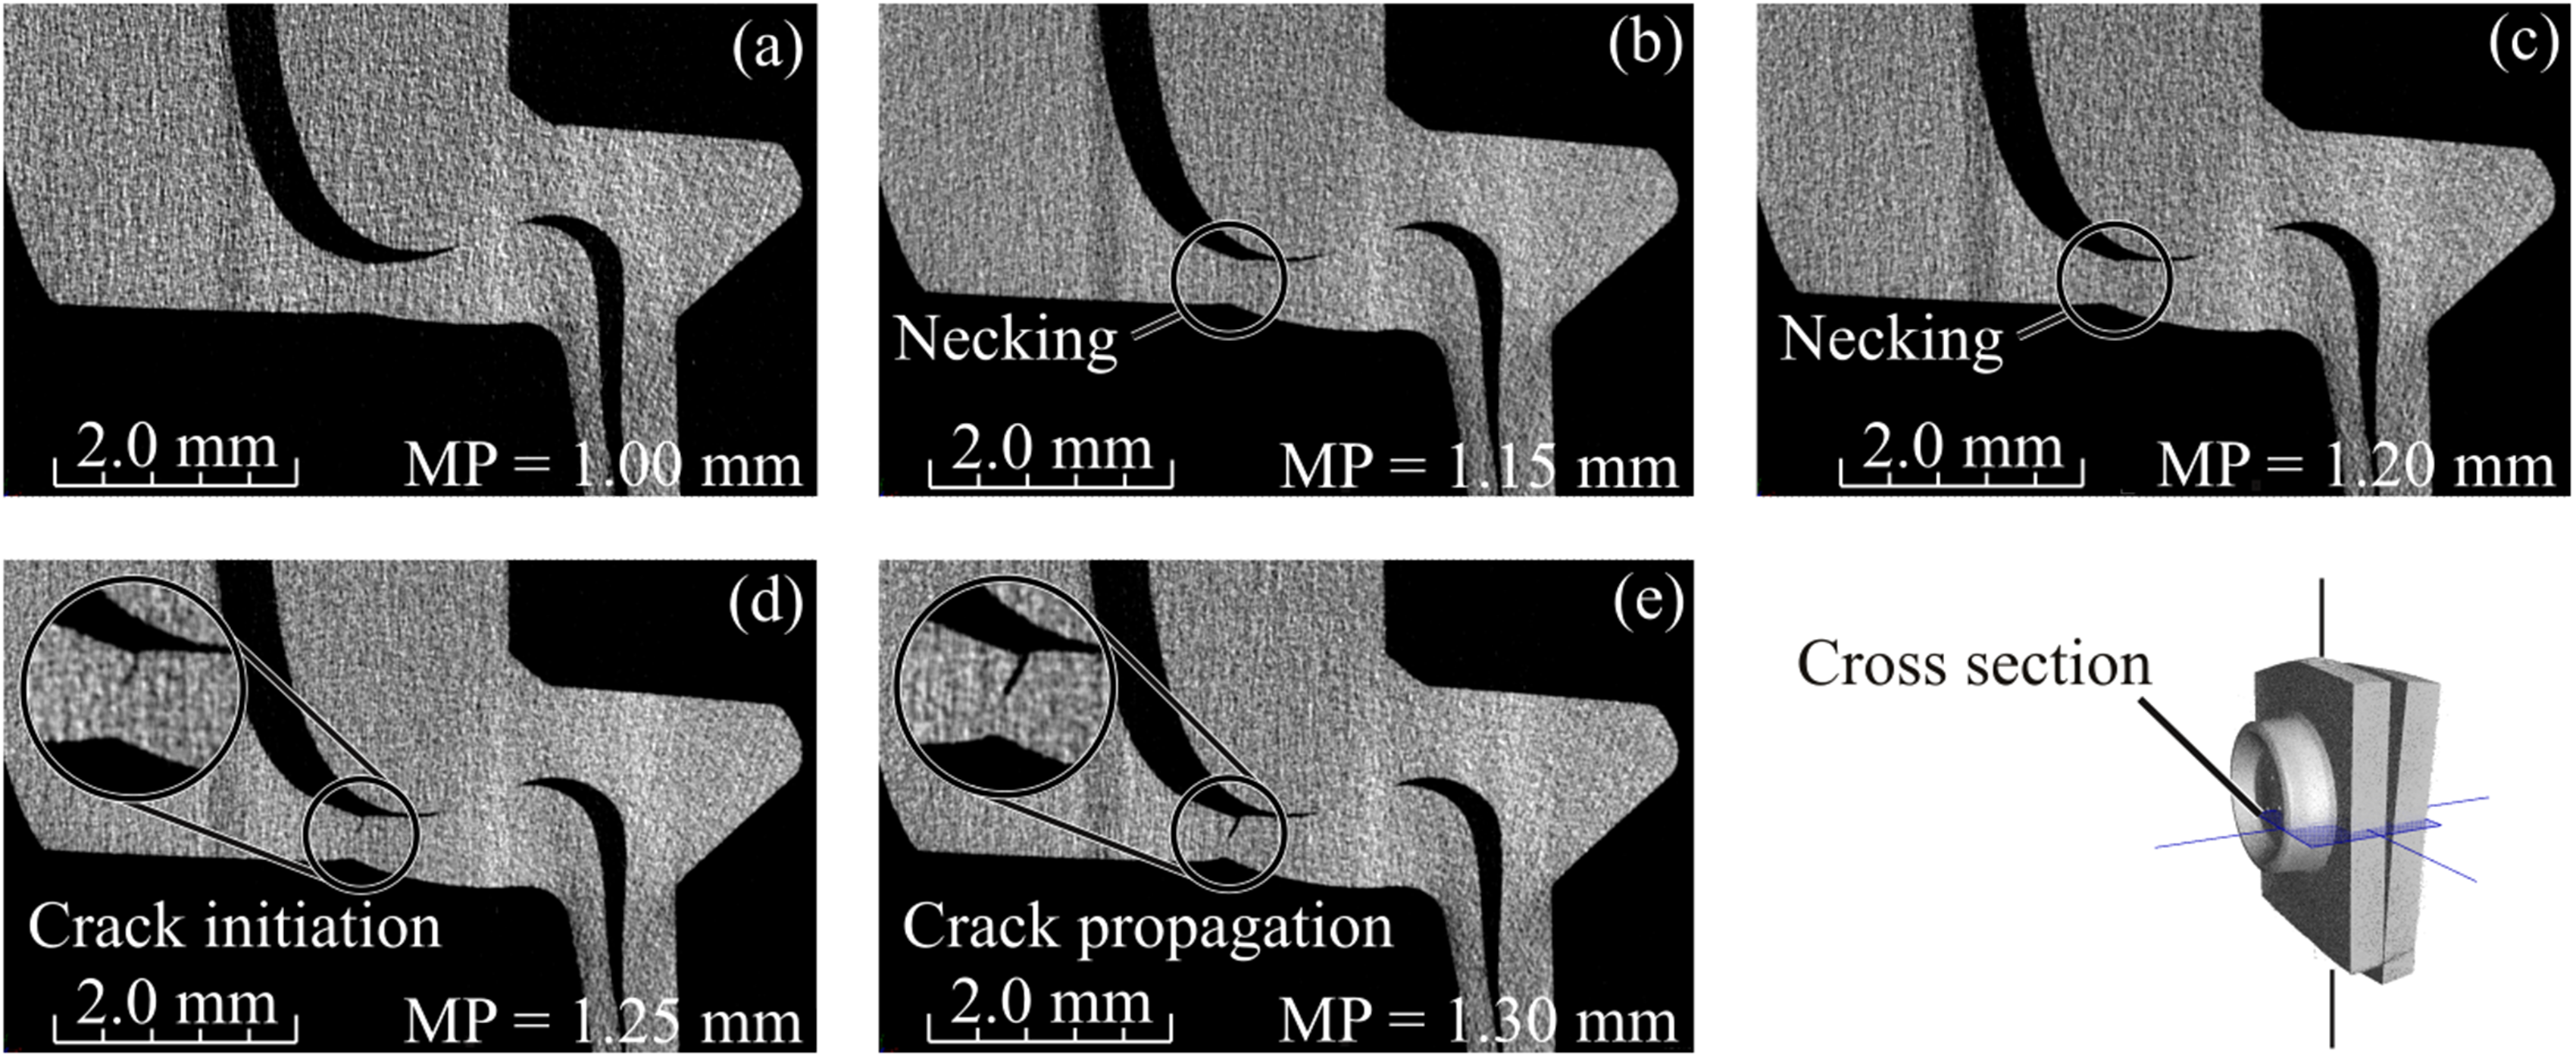
Transverse tomograms of specimen C04_A_CV_282, a specimen with δ = 0.0 mm, from MP = 0.0 mm (a) to MP = 1.30 mm (e) with the respective cross-section.
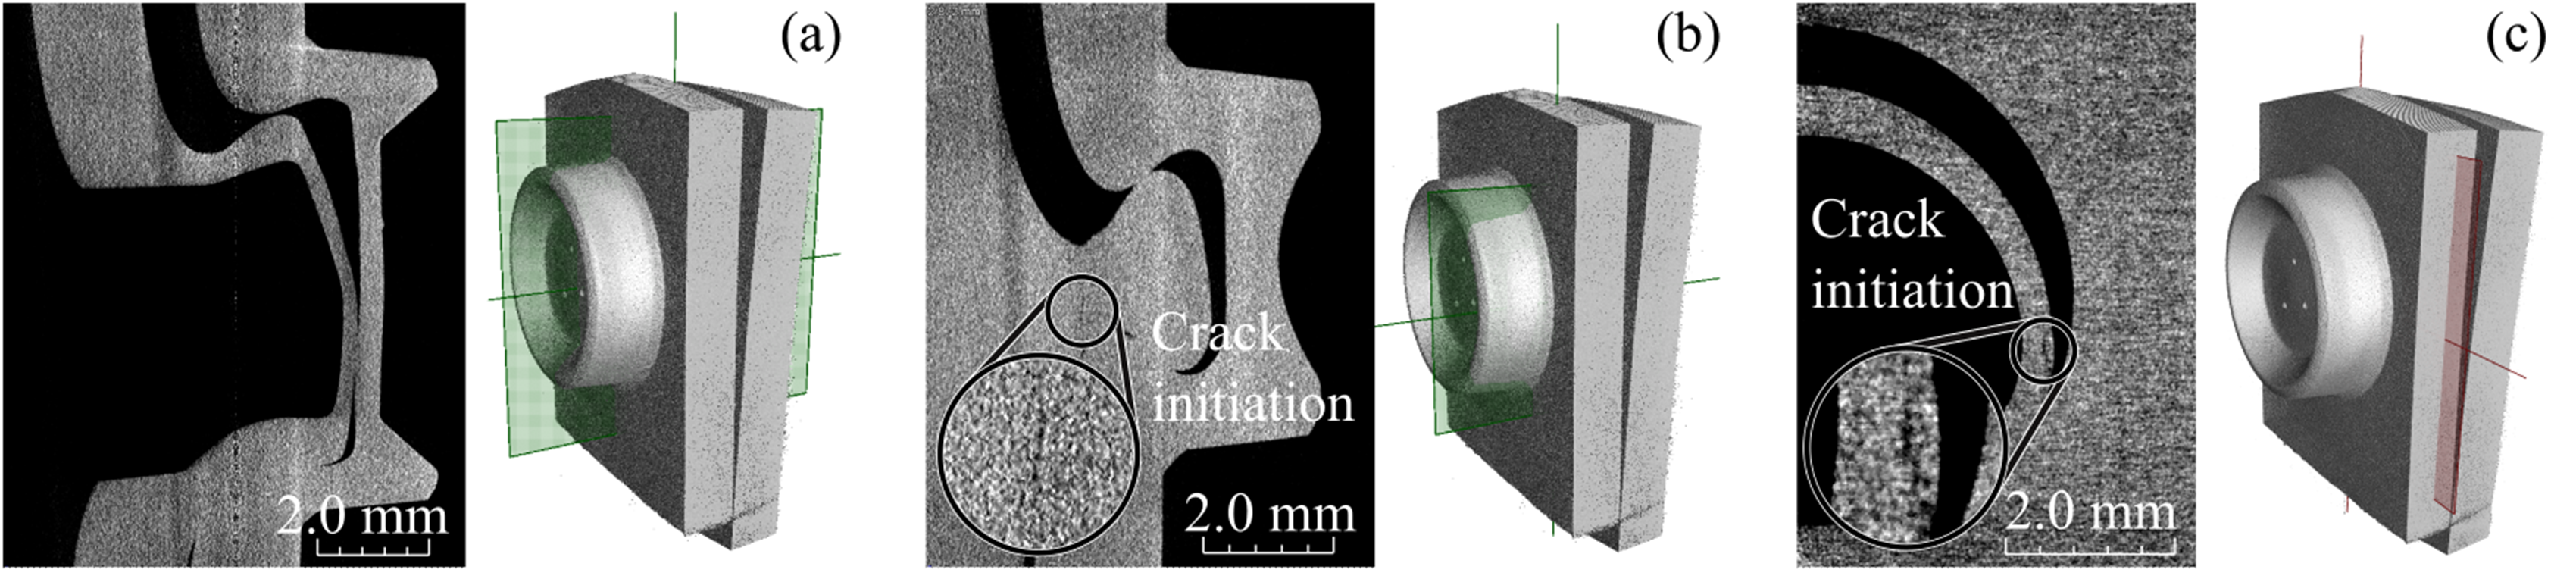
Tomograms of specimen C04_A_CV_282 (δ = 0.0 mm) at MP = 1.25 mm. The sagittal tomogram (a), a parasagittal tomogram (b) and the paracoronal tomogram (c) with the respective cross section at the position of the initial crack.
In Figure 6, the necking and fracture can be seen for C04_A_CV_294, a specimen with δ = 0.2 mm. For a more detailed analysis of the crack development, smaller steps between the MPs are chosen. First, a state without visible failure phenomena is given (a). Then, similar to the specimen without lateral offset, the necking indicates an upcoming failure (b–d). Although, there is no visible crack at lower MPs, a significant fracture is observed at MP = 0.99 mm (e) with no significant change in dimension at the subsequent MPs (f–g). A detailed analysis of the CT raw data at MP = 0.99 mm shows a movement of the specimen between two projection images. This indicates a sudden formation of the fracture during CT scanning. Thus, the reconstruction for MP = 0.99 mm is done with the remaining projections, visualizing the damaged state of the clinch point. This sudden occurrence of the rupture is accompanied by a strong drop in force (cf. Figure 3).
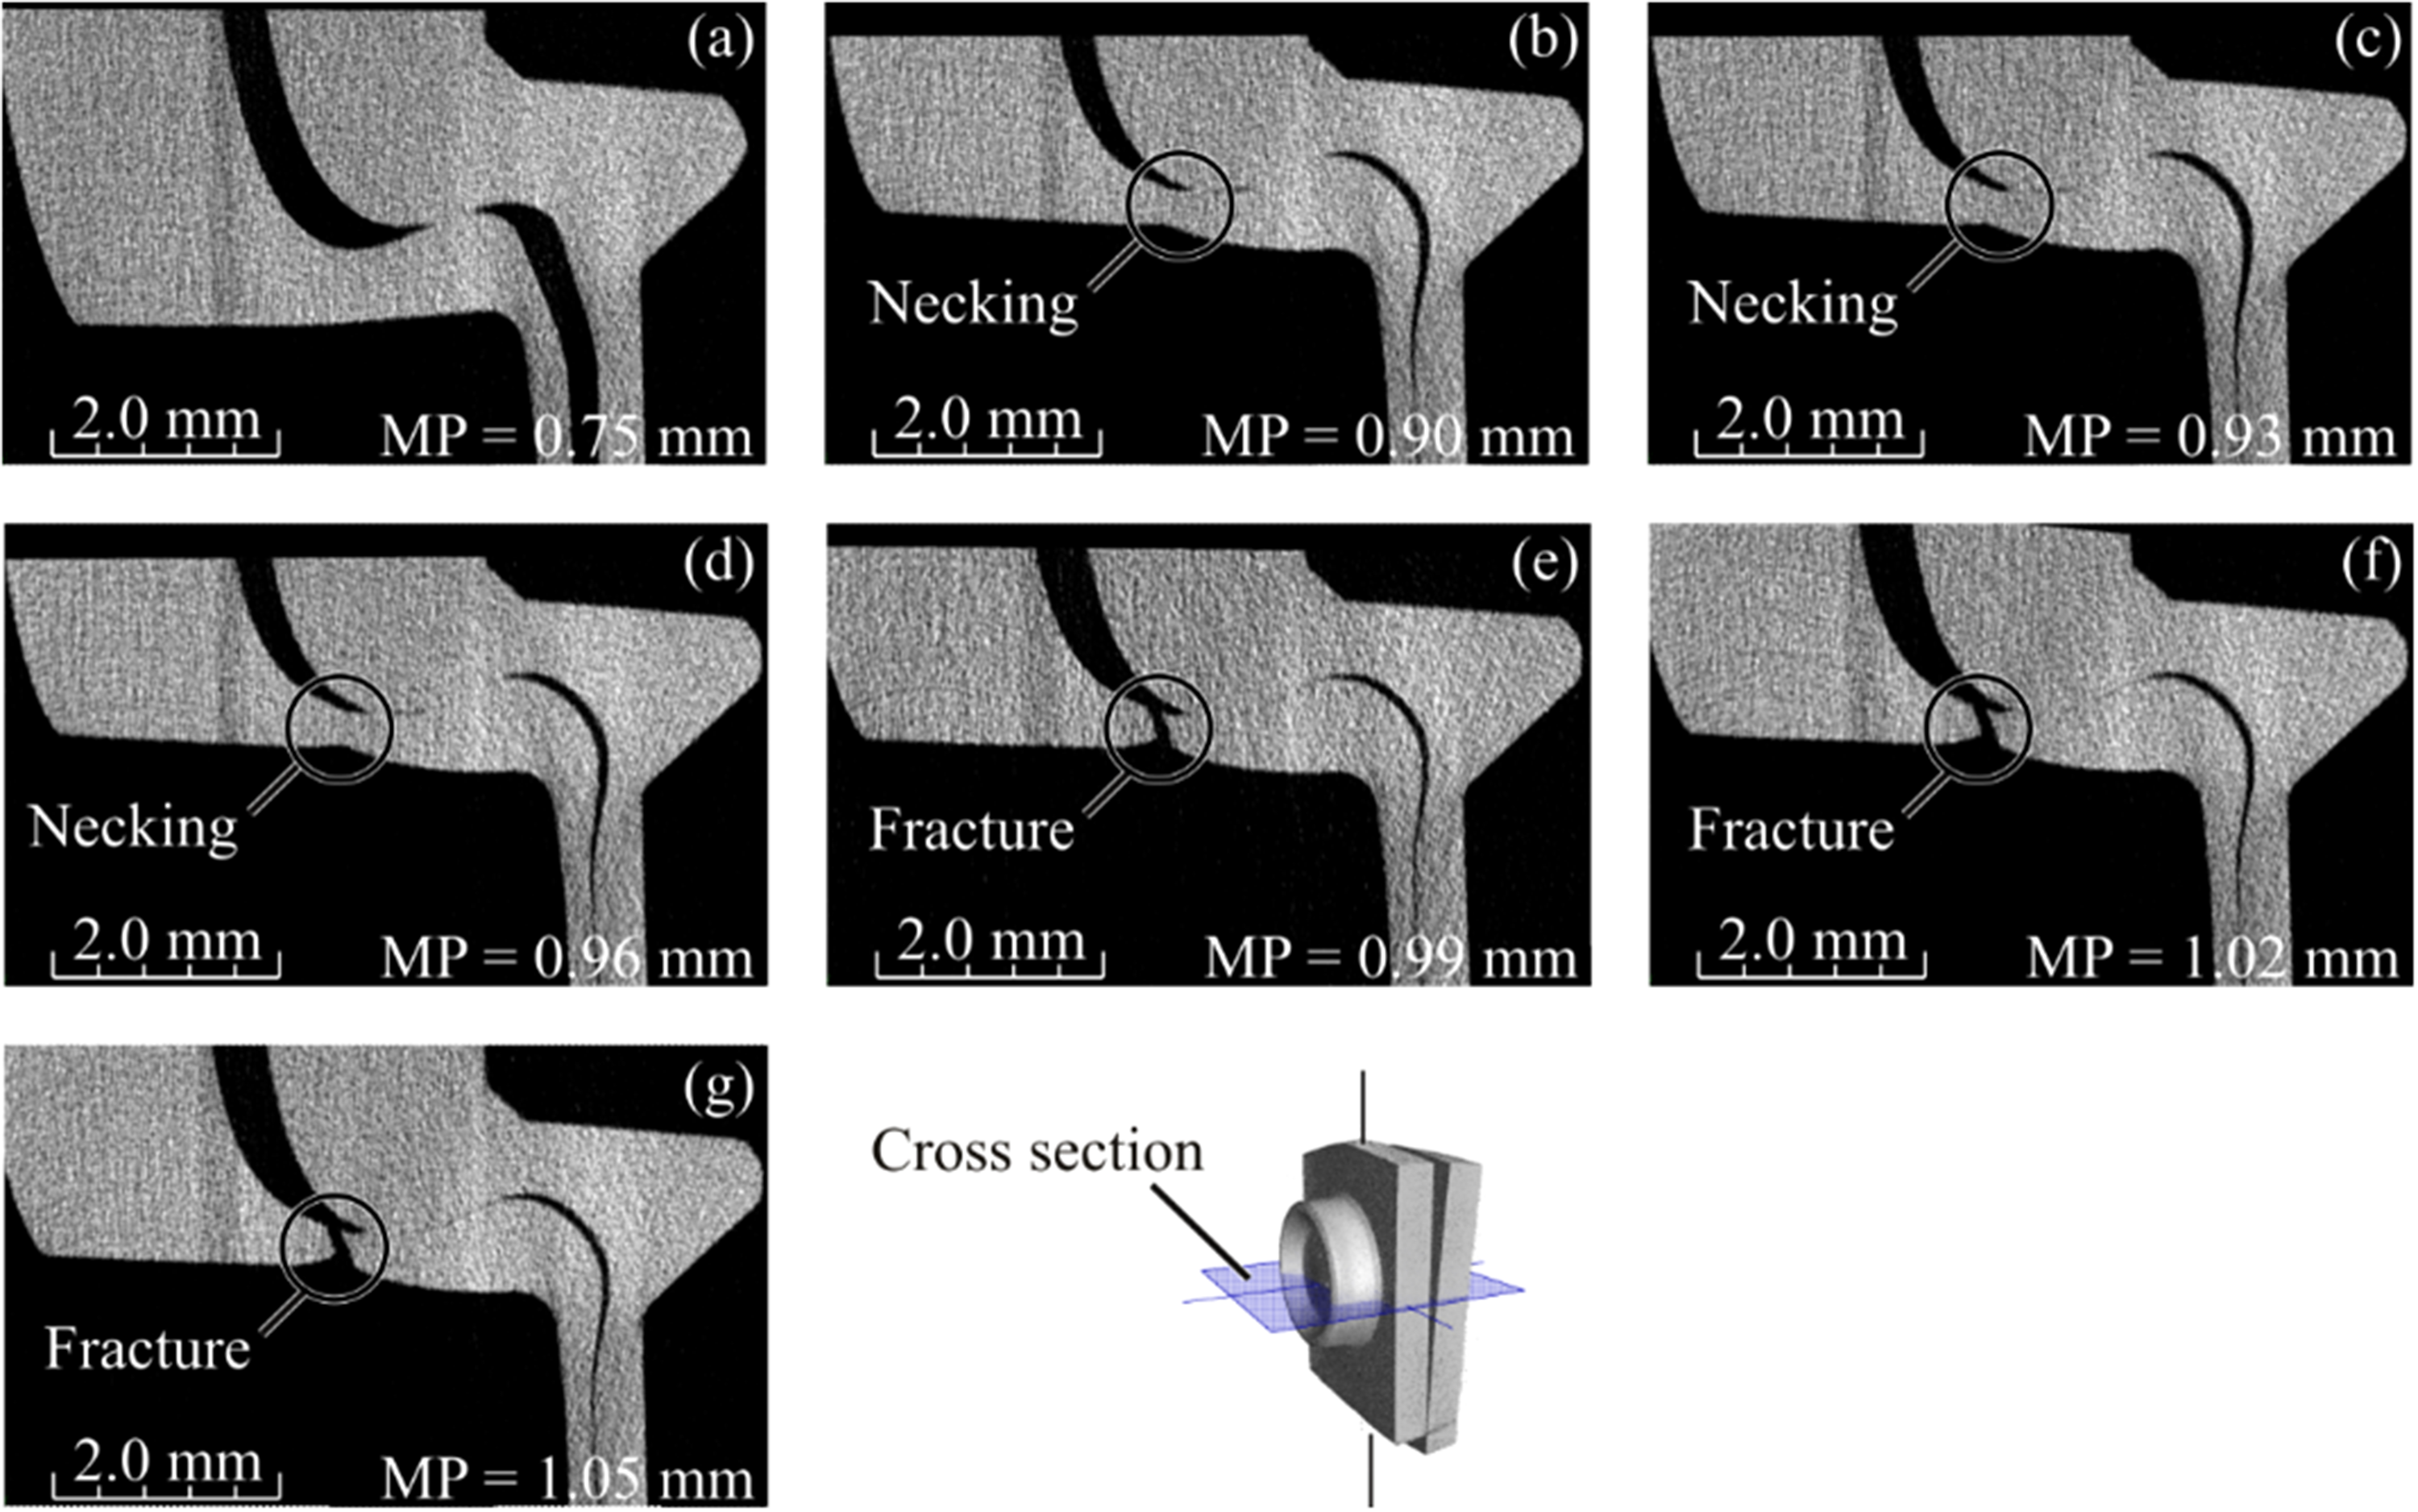
Transverse tomograms of specimen C04_A_CV_294, a specimen with δ = 0.2 mm, from MP = 0.0 mm (a) to MP = 1.05 mm (f) with the respective cross-section.
TDA results
The results of the TDA can be represented frequency-discrete by means of a fast Fourier transform. The measurement results of specimen C04_A_CV_282 are shown in Figure 7. For each excitation frequency examined, an FFT is performed and the maximum amplitude of the sensor at this excitation frequency is evaluated. These individual data points are collected for all MPs, linearly interpolated between them and displayed as a heat map.
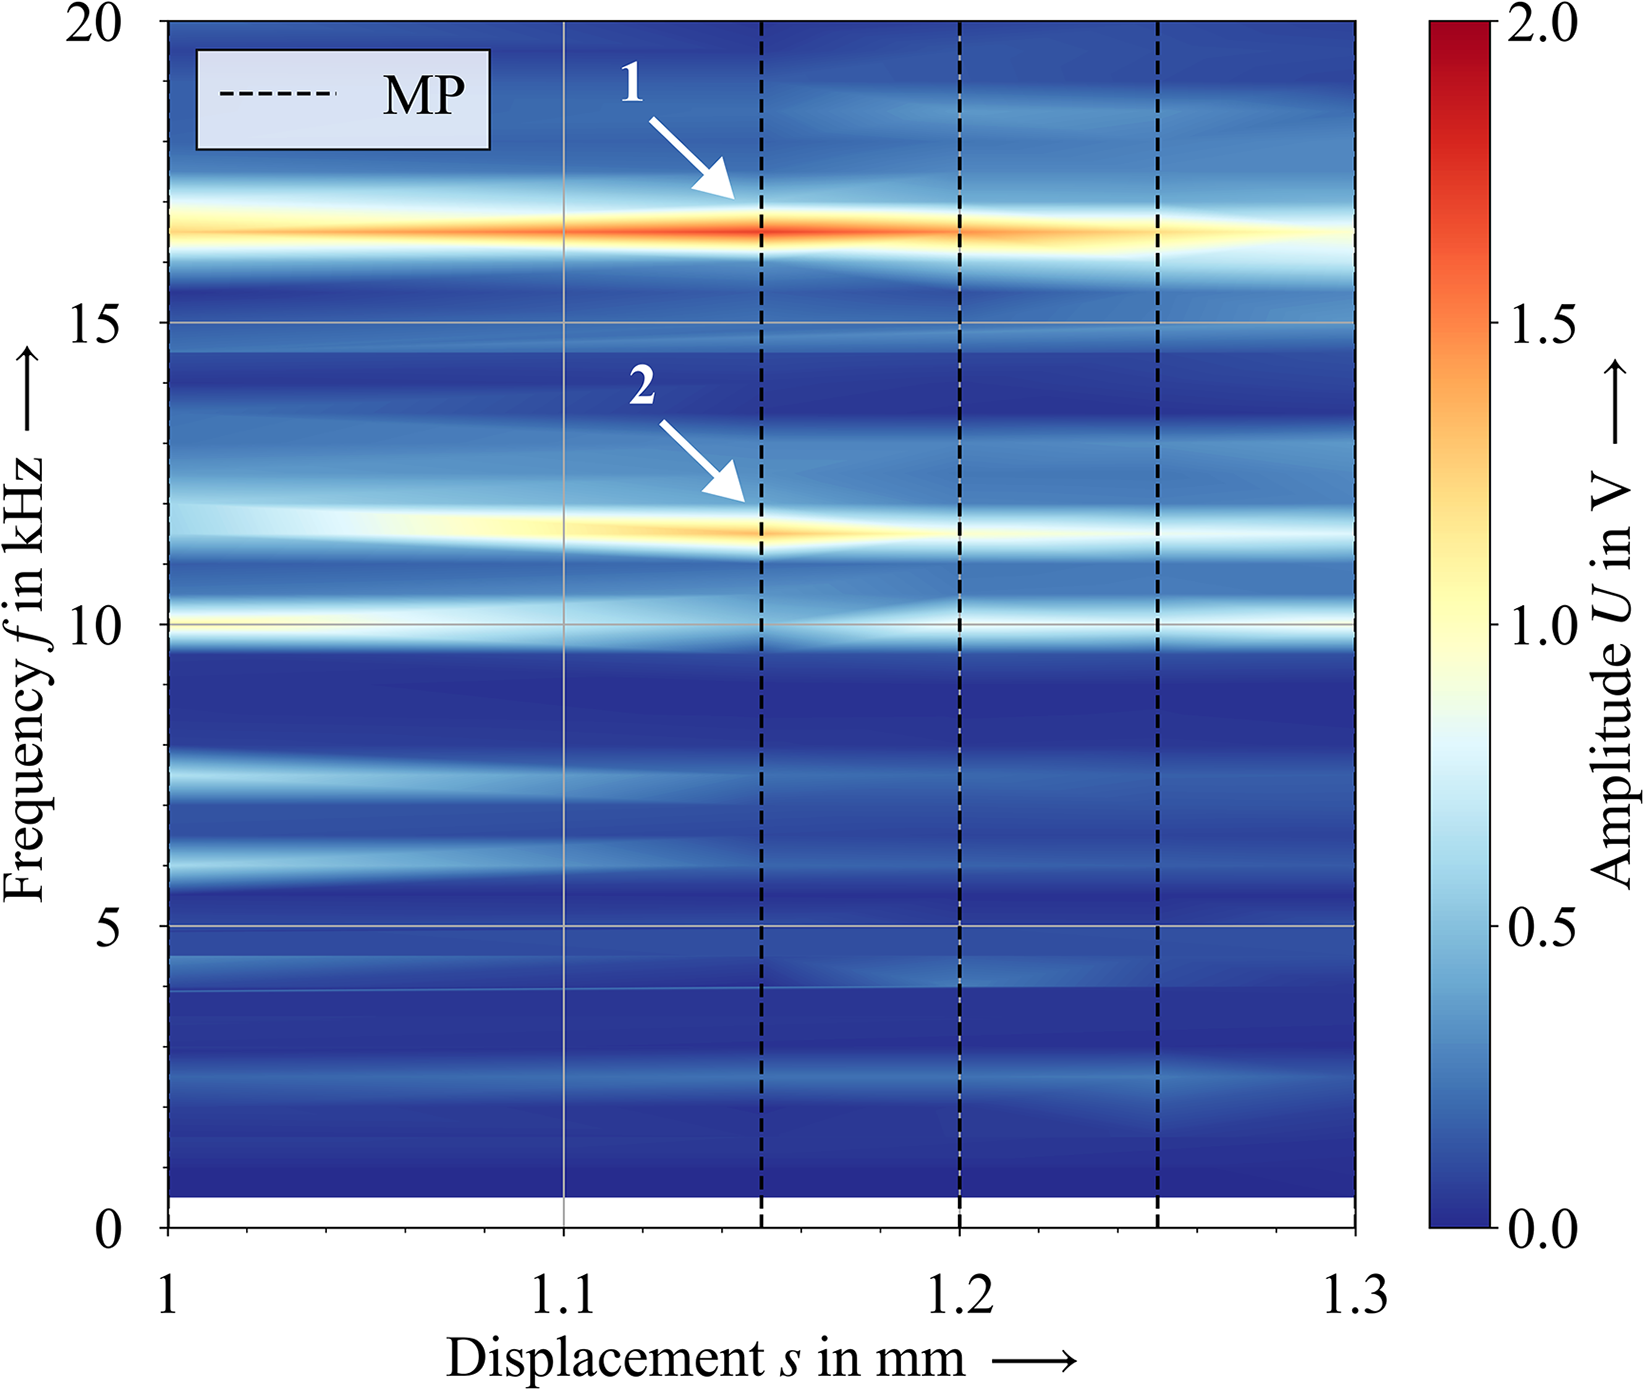
Spectrogram of specimen C04_A_CV_282.
It is noticeable that only a few areas of the spectrogram stand out from the background noise of the measurement. The exact knowledge of relevant frequency ranges is therefore a basic requirement for TDA. It is therefore not possible to use arbitrary frequencies for excitation and evaluation. At the excitation frequencies f = 16.5 kHz (1) and f = 11.5 kHz (2) there are clear signal changes between the MPs. Especially at MP = 1.15 mm the largest amplitudes are recognizable at these frequencies and can be assigned to the initiating constriction in the neck area. With increasing displacement these amplitudes reduce. This can be attributed to the progressing constriction and crack formation, which means a reduction of the cross-sectional area and the mechanical coupling of the joining partners.
Figure 8 shows the results of specimen C04_A_CV_294 (δ = 0.2 mm). In contrast to Figure 7, the more detailed representation and the larger maximum amplitudes are apparent. This is due to the modified filtering (see Chapter 2.3) of the raw data, which significantly improves the signal–noise ratio. The comparability of the measurements is nevertheless given since only frequency ranges are filtered that are not relevant in the evaluation.
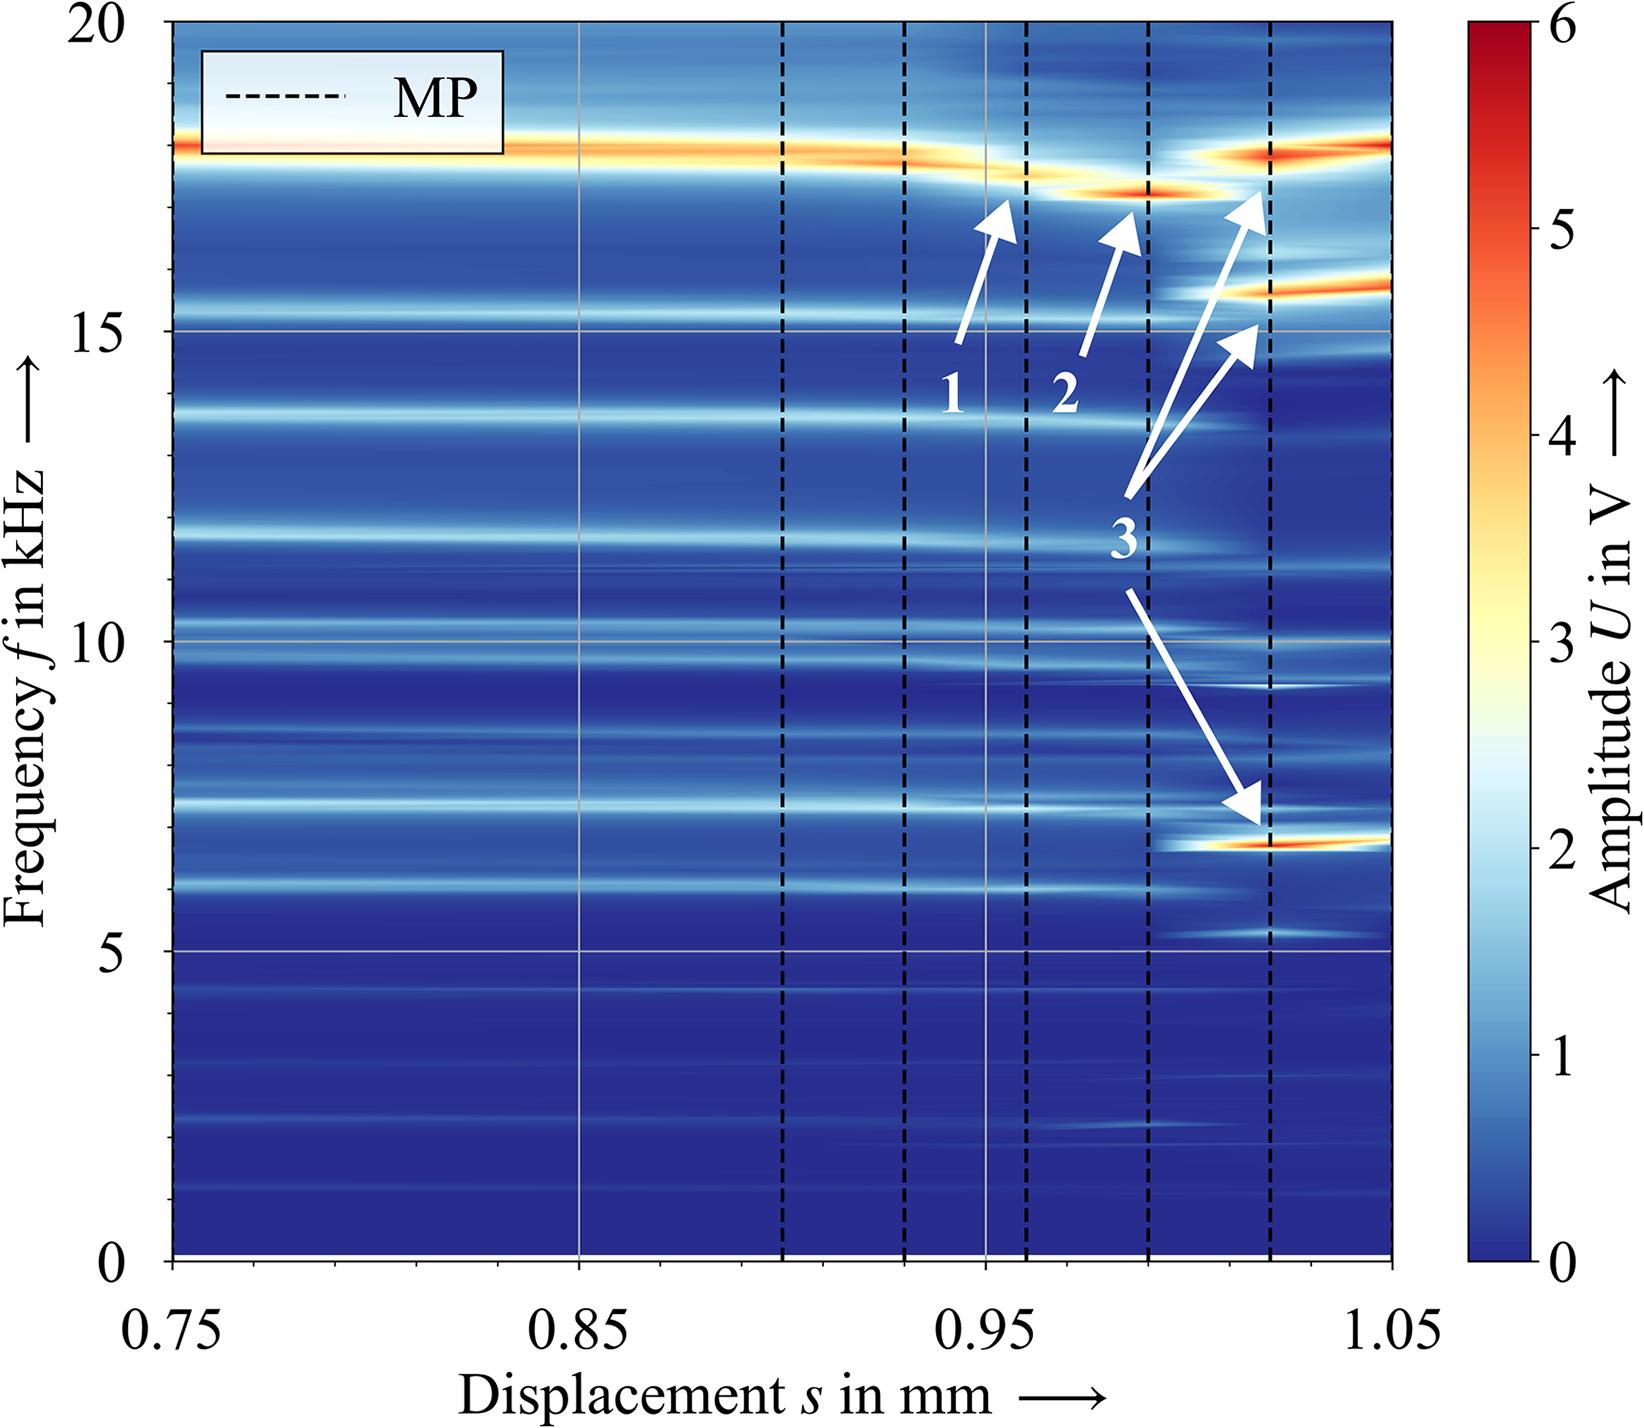
Spectrogram of specimen C04_A_CV_294.
The constriction in the neck area of specimen C04_A_CV_294 also results in a signal change. It shows that the amplitude at f = 18 kHz drops significantly between the MP = 0.93 mm and MP = 0.96 mm (1). As the fracture develops (MP = 0.99 mm), a peak at f = 17.5 kHz appears (2). This frequency range was previously inconspicuous. As the fracture grows, local peaks appear at the frequencies f = 5.3 kHz, 15.6 kHz and 17.8 kHz (3).
In summary, failure phenomena (neck constriction, crack initiation, and rupture) can be correlated with signal changes in both examinations. By enhancing the signal quality of the TDA, a significant signal change can additionally be detected in specimen C04_A_CV_294 before rupture. Thus, by applying TDA, events of interest to perform a CT scan can be identified. This possibility has already been postulated in previous studies for a clinched mixed joint 1 and has been confirmed with these investigations. The adjustment of the lateral punch offset (δ = 0.2 mm) leads to a shift of the evaluated peaks to higher frequencies. Thus, the initial defect in the clinch point is already detected ahead of the destructive testing.
Between the oscillation initiated at the actuator and the response behavior of the structure determined at the sensor, a phase shift results. According to the aforementioned procedure, the phase shift between the actuator and sensor is determined for each excitation frequency of an MP, and the data of all MPs are compiled. For specimen C04_A_CV_294, these results are shown in Figure 9 for excitation frequencies 10 kHz ≤ f ≤ 20 kHz. Significant changes in the phase shift depending on the frequency can be detected at all MPs. Especially the data of the MP = 1.02 mm and MP = 1.05 mm deviate from the other MPs. This can be explained by the substantially changed damping behavior of the joint after rupturing at MP = 0.99 mm.
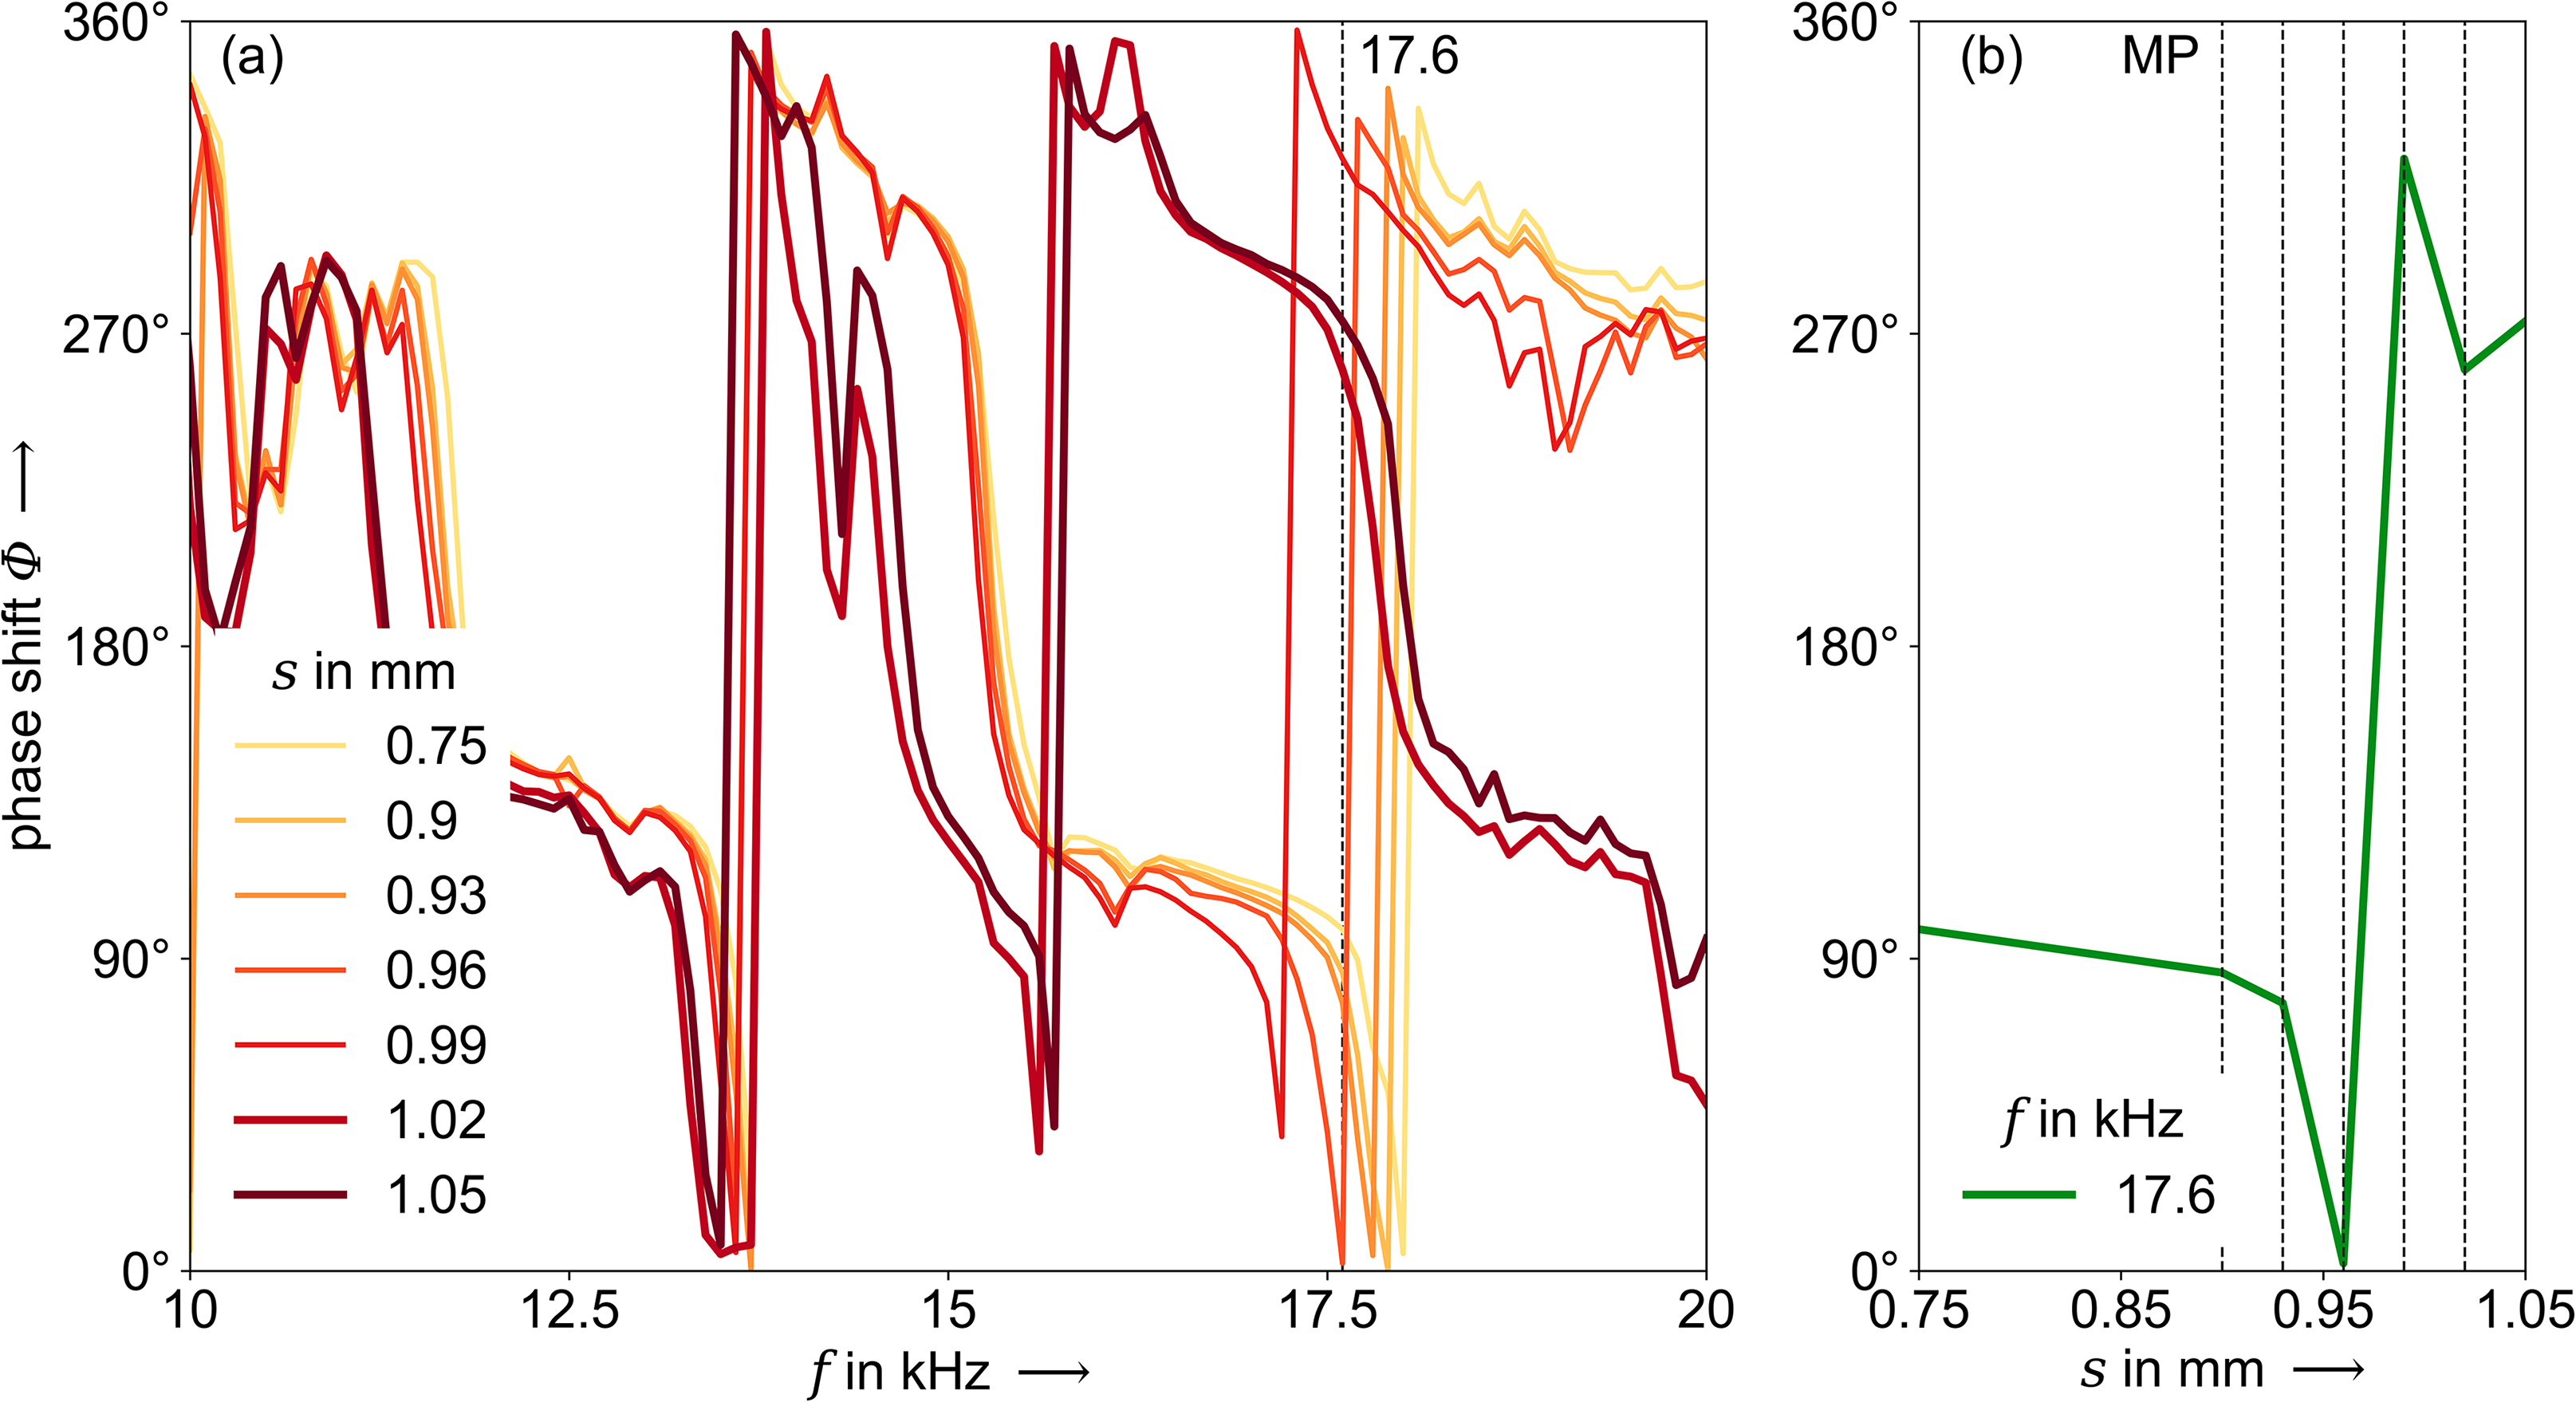
Phase shift of specimen C04_A_CV_294 frequency-dependent (a) and displacement-dependent (b).
At the excitation frequency f = 17.6 kHz, marked by a vertical line, a steady reduction of the phase shift can be observed up to the MP = 0.93 mm. It reduces abruptly at the MP = 0.96 mm and increases rapidly thereafter as the specimen fails (see Figure 9(b)). The phase shift shows a clear signal change before the occurrence of the failure and is consistent with the observations concerning the amplitude. Due to the abrupt change of the phase shift between the MPs, the evaluation of the gradient seems to be appropriate in further investigations.
In investigations of mechanical joints by means of transient dynamic analysis, phase shift has so far not been focused. However, frequency ranges can be identified that show correlatable changes in phase shift to the observed failure phenomena. With regard to a holistic evaluation of the measurement data, further investigations are necessary to prove the significance of the phase shift concerning the detection of defects or irregularities.
Conclusions
In this article, single-lap tensile-shear specimens made of aluminum are clinched with a punch exhibiting a lateral offset relative to the die. By adjusting the lateral punch offset (0.0 mm and 0.2 mm), a defined variation of the failure behavior in the tensile-shear tests is achieved. The specimens are loaded stepwise until failure. During the loading, TDA and in-situ CT are applied for the analysis of the failure behavior at defined MPs. The TDA indicates the occurrence of failure phenomena during the test procedure. Using in-situ CT, the phenomena of necking, crack initiation and rupture can be observed.
The evaluations of the amplitude and the phase shift of the dynamic response show clear signal changes even prior to failure for both specimen categories. This indicates, that the TDA can be used to trigger a subsequent in-situ CT analysis of the failure development. In the case of continuous crack growth, the in-situ CT provides detailed information on the location and shape of the damage, even before a drop in force can be measured. However, the method is limited, if a sudden failure occurs.
It can be concluded, that the combined application of TDA and in-situ CT allows early detection of upcoming damage and a detailed analysis of failure development in clinched joints at limited CT beamtime, making the analysis of the load-bearing behavior of mechanical joints more efficient. In future work, the in-situ CT information can help to interpret the TDA signals in more detail, possibly qualifying the TDA as a new and efficient quality assurance tool.
Supplemental Material
sj-docx-1-pie-10.1177_09544089241251646 - Supplemental material for In-situ computed tomography and transient dynamic analysis – failure analysis of a single-lap tensile-shear test with clinch points
Supplemental material, sj-docx-1-pie-10.1177_09544089241251646 for In-situ computed tomography and transient dynamic analysis – failure analysis of a single-lap tensile-shear test with clinch points by G Reschke, D Köhler, R Kupfer, J Troschitz, M Gude and A Brosius in Proceedings of the Institution of Mechanical Engineers, Part E: Journal of Process Mechanical Engineering
Supplemental Material
sj-docx-2-pie-10.1177_09544089241251646 - Supplemental material for In-situ computed tomography and transient dynamic analysis – failure analysis of a single-lap tensile-shear test with clinch points
Supplemental material, sj-docx-2-pie-10.1177_09544089241251646 for In-situ computed tomography and transient dynamic analysis – failure analysis of a single-lap tensile-shear test with clinch points by G Reschke, D Köhler, R Kupfer, J Troschitz, M Gude and A Brosius in Proceedings of the Institution of Mechanical Engineers, Part E: Journal of Process Mechanical Engineering
Supplemental Material
sj-png-3-pie-10.1177_09544089241251646 - Supplemental material for In-situ computed tomography and transient dynamic analysis – failure analysis of a single-lap tensile-shear test with clinch points
Supplemental material, sj-png-3-pie-10.1177_09544089241251646 for In-situ computed tomography and transient dynamic analysis – failure analysis of a single-lap tensile-shear test with clinch points by G Reschke, D Köhler, R Kupfer, J Troschitz, M Gude and A Brosius in Proceedings of the Institution of Mechanical Engineers, Part E: Journal of Process Mechanical Engineering
Footnotes
Acknowledgments
This research was funded by the German Research Foundation (DFG) within the project Transregional Collaborative Research Centre 285/2 (TRR 285/2, project number 418701707), sub-project C04 (project number 426959879).
Declaration of conflicting interests
The authors declared no potential conflicts of interest with respect to the research, authorship, and/or publication of this article.
Funding
The authors disclosed receipt of the following financial support for the research, authorship, and/or publication of this article: This work was supported by the Deutsche Forschungsgemeinschaft (Grant No. 418701707).
Supplemental material
Supplemental material for this article is available online.
References
Supplementary Material
Please find the following supplemental material available below.
For Open Access articles published under a Creative Commons License, all supplemental material carries the same license as the article it is associated with.
For non-Open Access articles published, all supplemental material carries a non-exclusive license, and permission requests for re-use of supplemental material or any part of supplemental material shall be sent directly to the copyright owner as specified in the copyright notice associated with the article.