
Abstract
For optics used in high-power laser beams, high accuracy requirements in full spatial frequency must be fulfilled. Among them, the allowable root mean square value is less than 5 nm in the PSD1 band. In order to evaluate the dynamic performance of the spindle system and put forward a quantitative index, a novel accurate model of the spindle system was built and a series of dynamic simulations were performed. Harmonic response analysis reveals natural frequencies and frequency response functions. Transient analysis indicates vibration waveforms of the tool-tip. Furthermore, by analyzing surface topography, it can be found that the medium-frequency waviness in the machined surface matches the vibration waveform. Obviously, the medium-frequency waviness is generated by the modal vibration of the spindle system. So that a quantitative index for the aerostatic spindle is proposed: when the amplitude of vibration in transient analysis is smaller than 8 nm, the allowable error in the PSD1 band can be fulfilled.
Introduction
In high-power laser systems, the potassium dihydrogen phosphate (KDP) crystal is the only feasible material used as frequency conversion components and photoelectric switches. High-power laser beams not only have high requirements for surface roughness but also have strict requirements for power spectral density (PSD). In the frequency band designations for optics, the spatial wavelength of 0.12–2.5 mm is specified as PSD2 and the spatial wavelength of 2.5–33 mm is specified as PSD1. 1 The required root mean square (RMS) value in the PSD1 band for KDP crystals is better than 5 nm. The medium-frequency error of KDP crystals would introduce light intensity modulation, reduce laser beams’ quality and even damage downstream components. 2 For now, ultraprecision flycutting machining is the most efficient way to finish KDP crystals.3,4
In the ultraprecision flycutting, the surface topography of workpiece is copied from the tool-tip trajectory. Therefore, the dynamic performance of the machine tool has a great effect on surface topography. For the above reason, studies on improving the dynamic performance of the spindle system have attracted much attention. Chen et al. 5 measured rotation errors of the spindle in three directions and summarized the amplitude change law. Then Chen et al. 6 studied the influence of rotation errors on the machined surface. Zhu et al. 7 proposed an innovative servo system for a deterministic generation. Through the servo system, they found that the dynamic performance of the spindle system has a significant influence on surface quality. And the optimal tool-path generation strategy for the servo system was also developed by Zhu et al. 8 Liang et al. 9 found that defects are corresponded to the tool vibration and designed a new tool holder for achieving micron-level feeding. Zhang et al. 10 studied a five-degree-of-freedom aerostatic spindle and stated that the axial movement contributes a lot to surface topography. It was further validated with mathematical solutions by Zhang et al. 11 Moreover, Deng et al. 12 found a kind of low-frequency waviness, who is generated by the deformation of spindle system because of air pressure fluctuations. Similarly, waviness also steams from oil pressure fluctuations stated by Gao et al. 13 In particular, the dynamic performance of the flycutting machine tool contributes significantly to medium-frequency errors. In the study by Chen et al., 14 wavelet method was adopted for surface analysis. They stated that the flycutting process has few impacts on high-frequency errors. Chen et al.15,16 simulated the macroscale surface and stated that machining quality is influenced by machine kinetic characteristics. For mitigating the effects of waviness, researchers have done a lot of works on the servo systems and the structure of machine tool. However, optimizations for the aerostatic spindle structure have not been noticed.
In the authors’ related studies,17–19 it has been confirmed that the most typical medium-frequency waviness along the cutting direction is produced by the vibration of the spindle. The mechanism of the vibration has been defined as well. However, there is no exact evaluation index for the spindle system to realize the error mitigation in the PSD1 band. In this article, two aerostatic spindle systems with different structures are proposed. The pressure distribution is used as constraints for transient analysis to obtain accurate results. The relationship between vibration trajectory and medium-frequency waviness is established. Through the results, a quantitative index is presented, which would be a significant criterion for the structural design of spindle systems.
Flycutting machine tool
The ultraprecision flycutting machine tool is illustrated in Figure 1(a). It is mainly made up with a bed, columns, a beam, a feed slide, and an aerostatic spindle. The bed, the column, and the beam are made of marble. The hydraulic feed slide system and the aerostatic spindle are main moving parts. When machining KDP crystals, the workpiece is adsorbed on the hydraulic feed slide to do feed motion. At the same time, the cutter mounted on the cutter head rotates rapidly to remove the material.
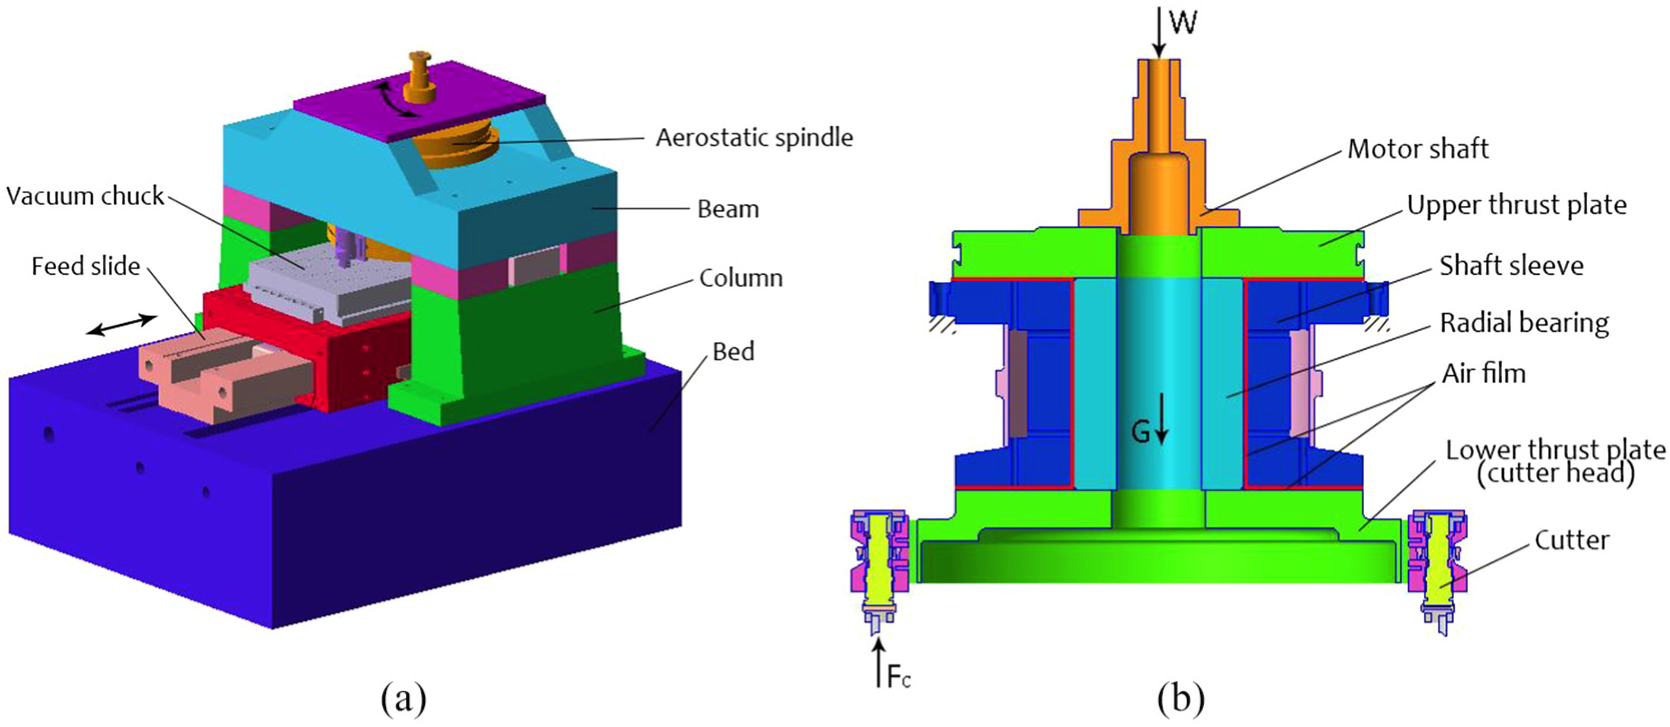
(a) The flycutting machine tool and (b) the aerostatic spindle system.
The structure of the aerostatic spindle system is exhibited in Figure 1(b). It contains a motor shaft, two thrust plates, a radial bearing, and a shaft sleeve. The motor shaft and the upper thrust plate, the upper thrust plate and the radial bearing, the radial bearing and the lower thrust plate are bolted, respectively. Two cutters are mounted symmetrically on the cutter head, but only one of them works. The air film between the bearing and the sleeve is filled with high pressure air.
As demonstrated in Figure 1(b), the shaft sleeve is fixed on the beam by bolts. When air pressure increases from zero to the working pressure, the spindle rises under the high pressure. At the same time, the gravity, the motor force, and the reaction force from the workpiece are taken into account as well. So the bearing capacity of the film is described as

Where
The stiffness of the air film is described as
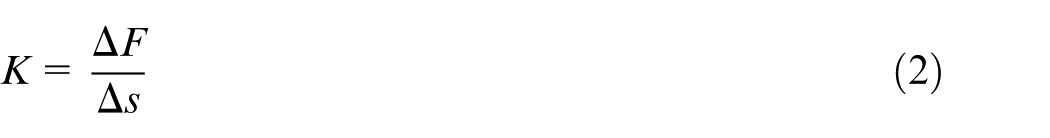
Where
In the static state, the bearings move down because of the gravity. The offset of bearings can be expressed as
Where
The material of bearings is known as 38CrMoAl (elastic modulus: 2.06e11 Pa, Poisson’s ratio: 0.3, density: 7850 kg/m3). 20 The total mass of rotating parts is 310 kg, and the total stiffness measured by the loading weight method is 3574.4 N/μm. Consequently, the bearing goes down 1 μm because of its gravity according to the equation (3). The initial clearance of the air film is 8 μm, therefore, the upper air film becomes 7 μm and the lower film becomes 9 μm.
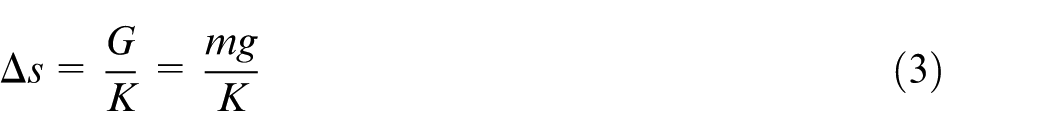
As demonstrated in Figure 2, two aerostatic spindle systems with different cutter heads are designed to explore the effect of the structure on processing. As exhibited in Figure 2(a), the cutter head of the original spindle system has two steps and central thickness is only 45 mm. While the cutter head of the new spindle system has a big chamfer between two steps and central thickness increases to 70 mm as exhibited in Figure 2(b).
Section views of the cutter heads: (a) the original cutter head and (b) the new cutter head.
Fluid-structure coupled analysis
In the aerostatic spindle system, the distribution and fluctuation of the air pressure would lead structural deformation. In the ultraprecision machining, the deformation of the spindle system caused by air pressure cannot be ignored. Therefore, it is necessary to simulate the spindle system with the fluid-structure coupled method.
In the computational fluid dynamics (CFD), fluid flow needs to follow the conservation laws. 21 The medium of the film is air. Based on the conservation law of mass, the fluid continuity differential equation is deduced as equation (4)
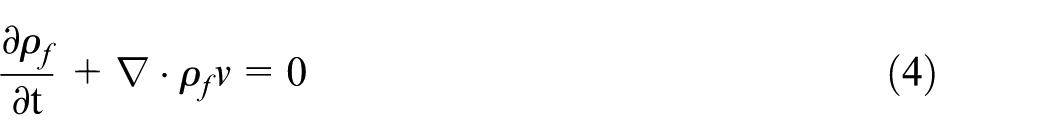
Where
As expressed in equation (5), the conservation equation of the solid can be derived from Newton’s second law

Where
The coupling of fluid and solid is achieved by transferring data on the fluid–solid interface. The structure deforms under the air pressure. In this case, the total stress and the displacement of both film and structure should be equal on the interface as expressed in equation (6)
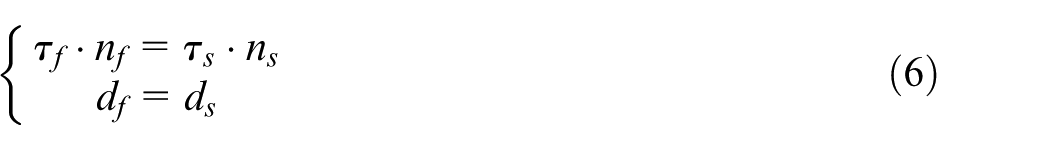
Where
The finite element method (FEM) was adopted for simulations. Considering that aspect ratio of the air film exceeds 10,000, arcs were replaced by regular polygons. The finite element mesh of the air film was divided in the ICEM-CFD software, and the final grid quality was better than 0.5, which was an acceptable result. Similarly, the finite element model of the structure was built as well.
The fluid-structure-coupled simulation was conducted in the ANSYS workbench software. 22 First, the FLUENT module was employed for fluid analysis. According to the practical situations, inlet pressure and outlet pressure were set as 0.5 MPa (gauge pressure) and 0 MPa (gauge pressure), respectively. The obtained pressure distribution of the air film is displayed in Figure 3(a). In the axial direction, high pressure maintains between two rows of orifices. The pressure decreases along the radial direction. And there are small high pressure areas around orifices.
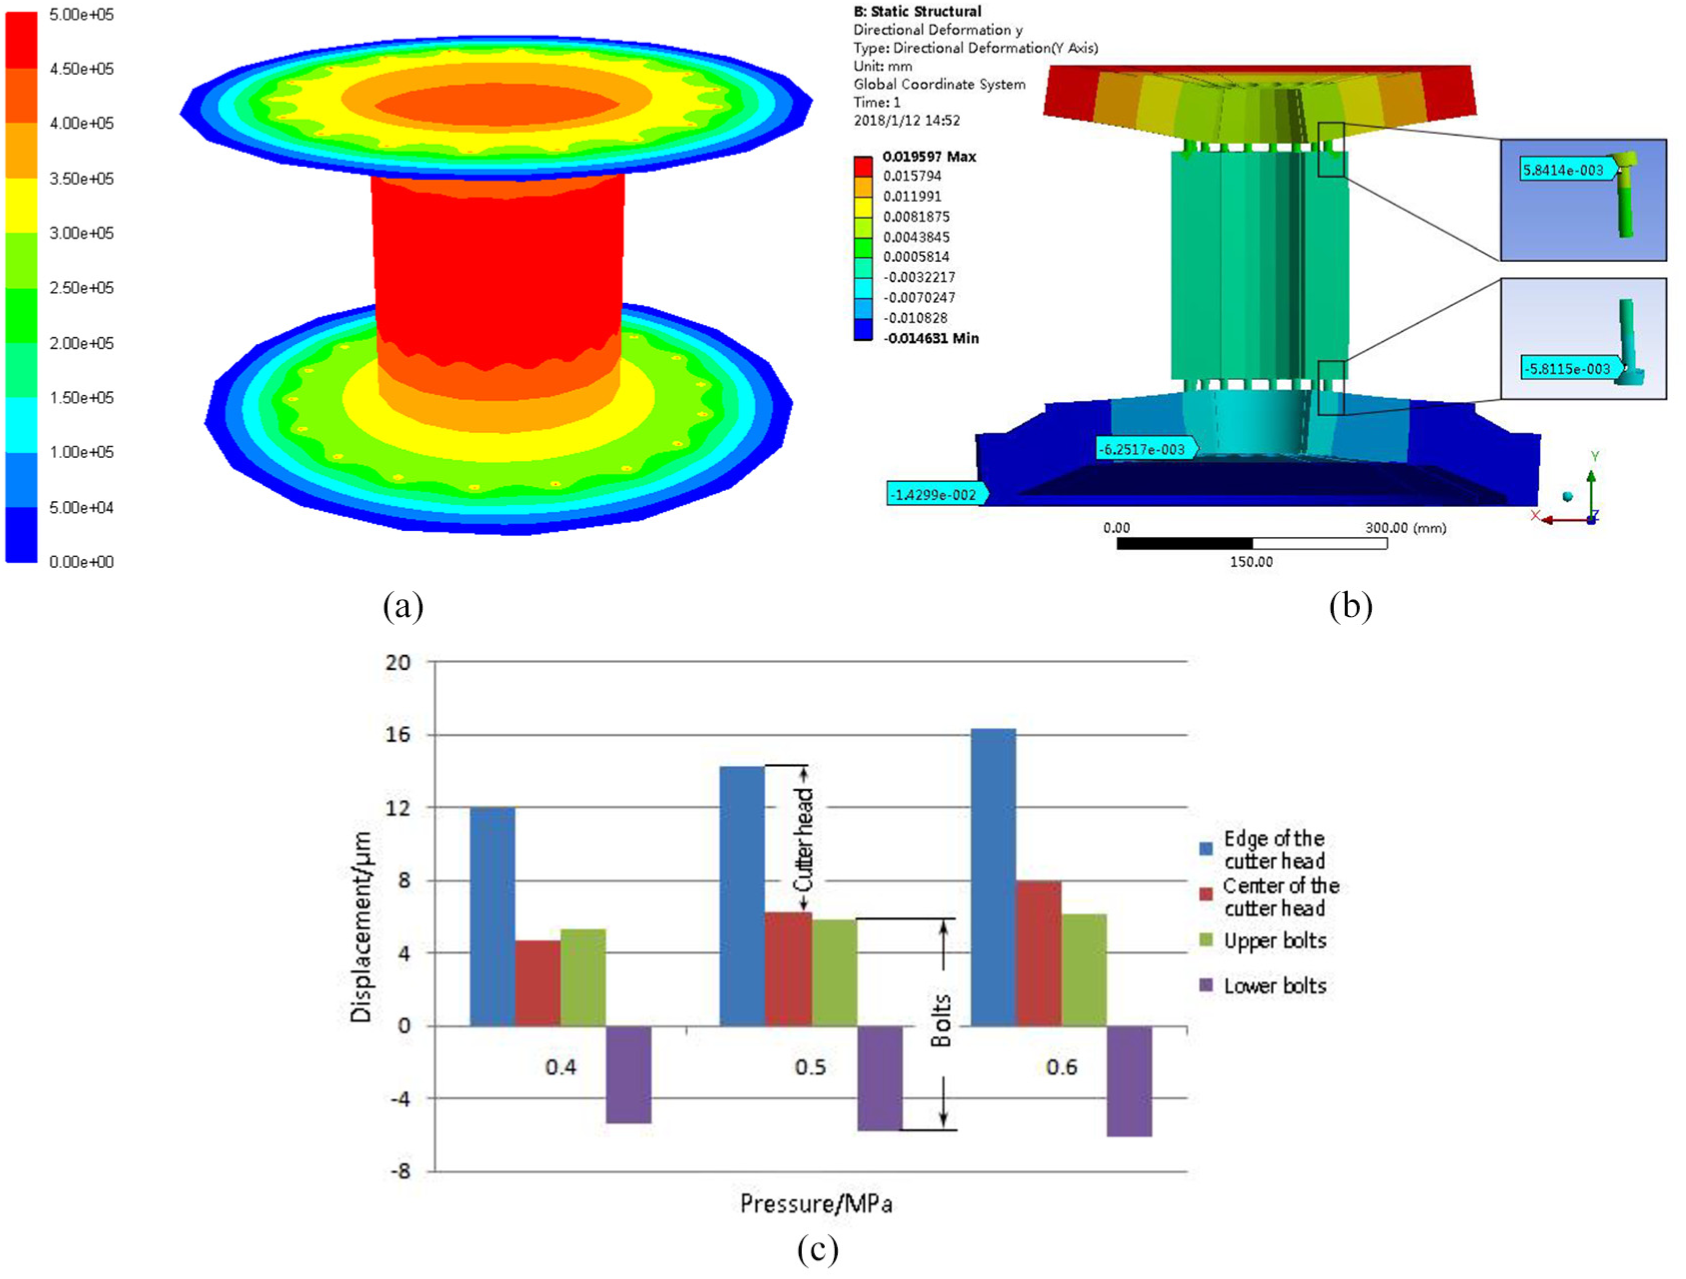
(a) Contour of air pressure distribution (0.5 MPa), (b) contour of structure deformation (0.5 MPa), and (c) displacement of the cutter head and bolts.
Subsequently, the pressure distribution data obtained by fluid analysis were imported into structural analysis module as constraints. The structural analysis result is exhibited in Figure 3(b). It reveals that the thrust plates bend outward, and the bolts are stretched badly.
Furthermore, the fluid-structure-coupled simulations were performed twice more with higher pressure. The inlet pressure of the air film was changed to 0.4 MPa and 0.6 MPa, respectively. The results of three simulations were analyzed comprehensively. As exhibited in Figure 3(c), deformation of the cutter head and bolts under different air pressure was extracted.
As illustrated in Figure 3(c), the difference between edge and center of the cutter head is regarded as the deformation of the cutter head, and the difference between the upper and the lower bolts is regarded as total tensile deformation of bolts. In this way, when input pressure is 0.4 MPa, the deformation of the cutter head and the bolts is 7.35 μm and 10.69 μm, respectively. When input pressure is 0.5 MPa, the deformation of the cutter head and the bolts is 8.04 μm and 11.65 μm, respectively. When input pressure is 0.6 MPa, the deformation of the cutter head and the bolts is 8.36 μm and 12.30 μm, respectively. Moreover, increments of deformation under the certain pressure are also known. When input pressure increases from 0.4 MPa to 0.5 MPa, the deformation of the cutter head increases by 0.69 μm, and the deformation of the bolts increases by 0.96 μm. When input pressure increases from 0.5 MPa to 0.6 MPa, the deformation of the cutter head increases by 0.33 μm, and the deformation of the bolts increases by 0.65 μm. This law of deformation is very useful to understand the effects of air pressure on machining, which can even be used to achieve a submicro cutting depth in the flycutting process.
Dynamic performance analysis by FEM
Subdivided constraints
In the study of Miao et al., 19 aerostatic bearings were regarded as two elastic constraints when building the aerostatic spindle model. However, based on the pressure distribution as exhibited in Figure 3(a), the pressure distribution is uneven in both axial and radial directions. So, it is inaccurate to regard bearings as two elastic restraints, especially in the case of analyzing partial loads.
By analyzing the characteristics of the pressure distribution, it is found that pressure at the same radius is basically the same in thrust plates. And in the radial bearing, pressure is the same at the same height. Thus, taking both accuracy and computational efficiency into account, two surfaces of thrust plates were divided into 14 concentric rings with different radii, and a surface of the radial bearing was divided into six cylinders with different heights. There were 22 pressure units in total including two inlet units. The pressure value of each unit can be calculated as follows.
The deformation of thrust plates under pressure is proportional to the radius, namely

Where
Combining equation (2) with equation (7)
Where
The total stiffness of all units should be equal to the total bearing stiffness
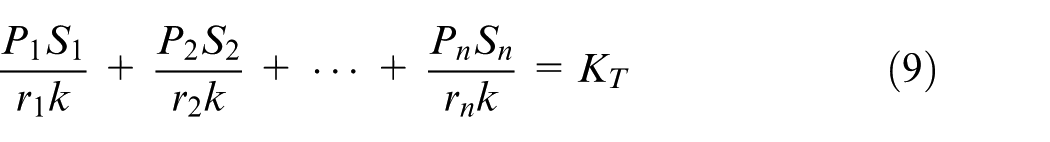
Where
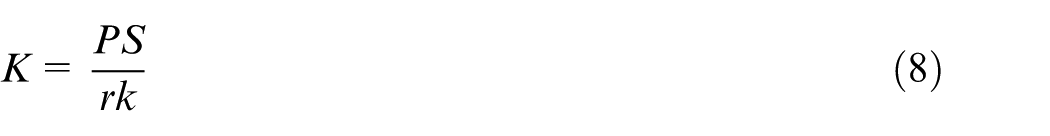
The pressure of each unit were extracted from the pressure distribution. The areas, the radii, and measured total stiffness were also known. So equations (8) and (9) are available for calculating the stiffness of each unit. Elastic constraints were applied on the corresponding units as shown in Figure 4.
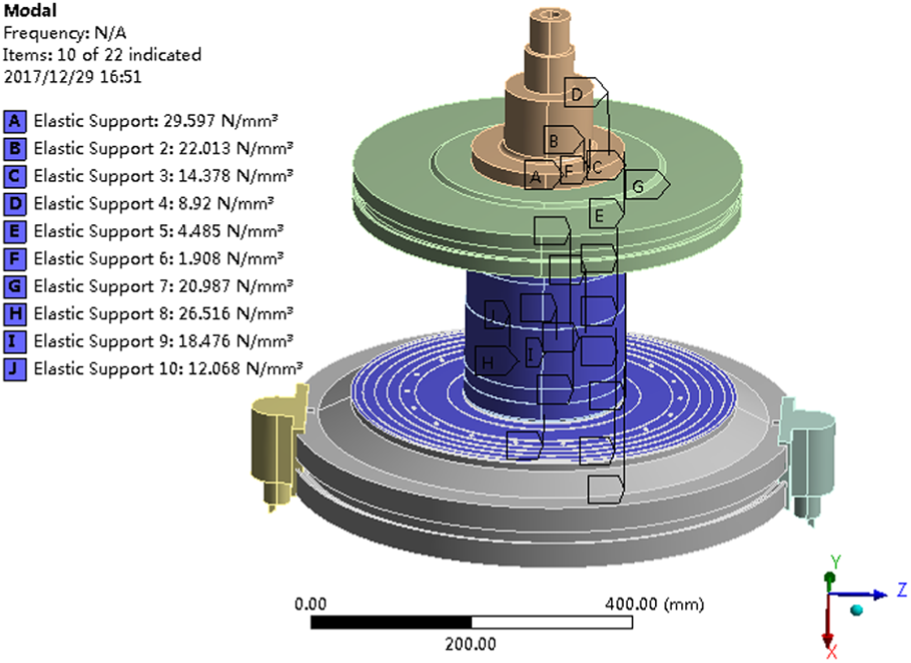
Elastic constraints of the model.
Modal analysis and harmonic response analysis
Modal analysis and harmonic response analysis for two aerostatic spindle systems were carried out with the subdivided constraints. The results of modal analysis are exhibited in Figure 5(a) and (c), the contours indicate that the original spindle is pretty sensitive to the sixth order mode, in which the cutter head deforms greatly. While the new spindle is sensitive to the 10th order mode. The sixth order natural frequency of the original spindle system is 551.79 Hz, and the 10th order natural frequency of the new spindle system is 854.24 Hz.
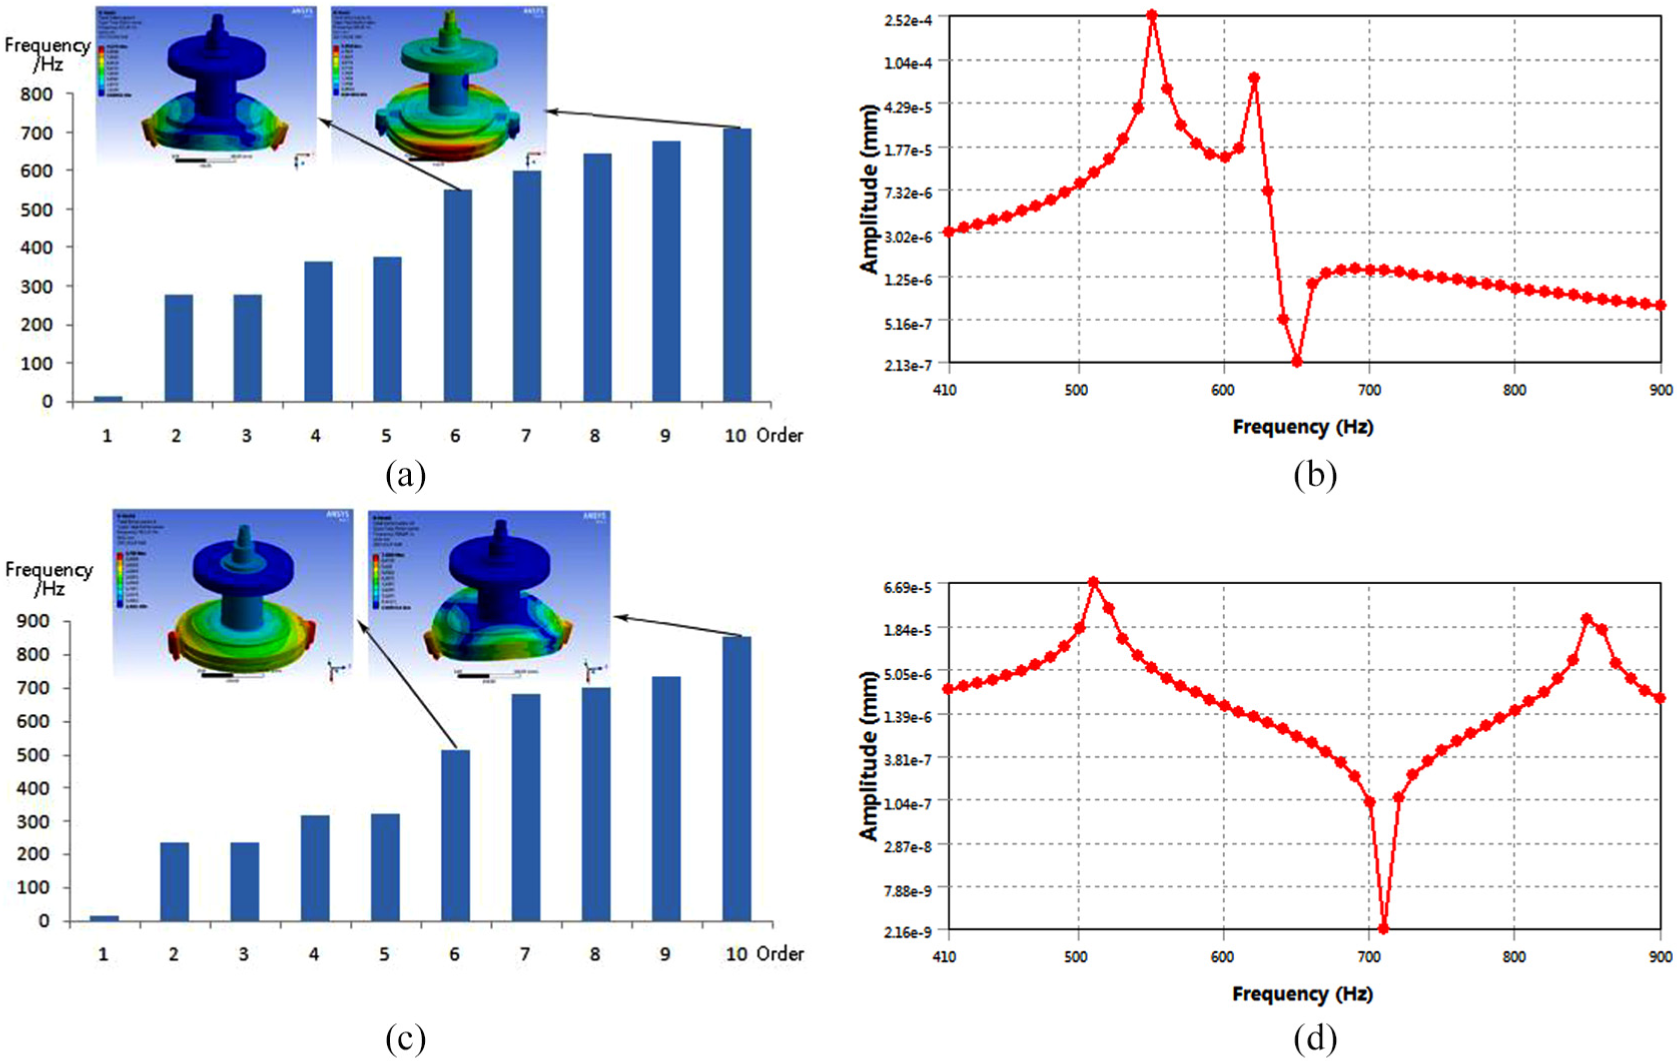
(a) Modes of the original spindle, (b) the FRF of the original spindle, (c) modes of the new spindle, and (d) the FRF of the new spindle.
Furthermore, harmonic response analysis was conducted on the basis of modal analysis. In the setting, the reaction of cutting force was applied on the tool-tip, then the frequency response function (FRF) of the spindle system was investigated in the frequency range of 400–900 Hz. The FRFs of the original spindle and new spindle are exhibited in Figure 5(b) and (d), respectively. It can be seen that the most sensitive frequencies of the original spindle are 550 Hz and 620 Hz, while the most sensitive frequencies of the new spindle become 510 Hz and 850 Hz.
Transient analysis
Modal analysis and harmonic response analysis can obtain natural frequencies and vibration modes, but hardly evaluate the trajectory of vibrations, which has a vital effect on medium-frequency waviness. Thus, transient analysis was carried out for both original and new spindle systems with the subdivided constraints. In the fly cutting process, the cutting force is 1.5 N measured by the Kistler dynamometer. So the impact force acting on the tool-tip was set as 1.5 N and the duration was 10 ms.
As illustrated in Figure 6(a), the analysis result of the original spindle system indicates that the cutter head bends obviously and the maximum deformation occurs in the tool-tip. The analysis of the new structure was conducted with the same settings, and the result is exhibited in Figure 6(b). The maximum deformation occurs in the tool-tip as well. While the largest deformation reduces greatly from 13.27 nm to 8.56 nm.
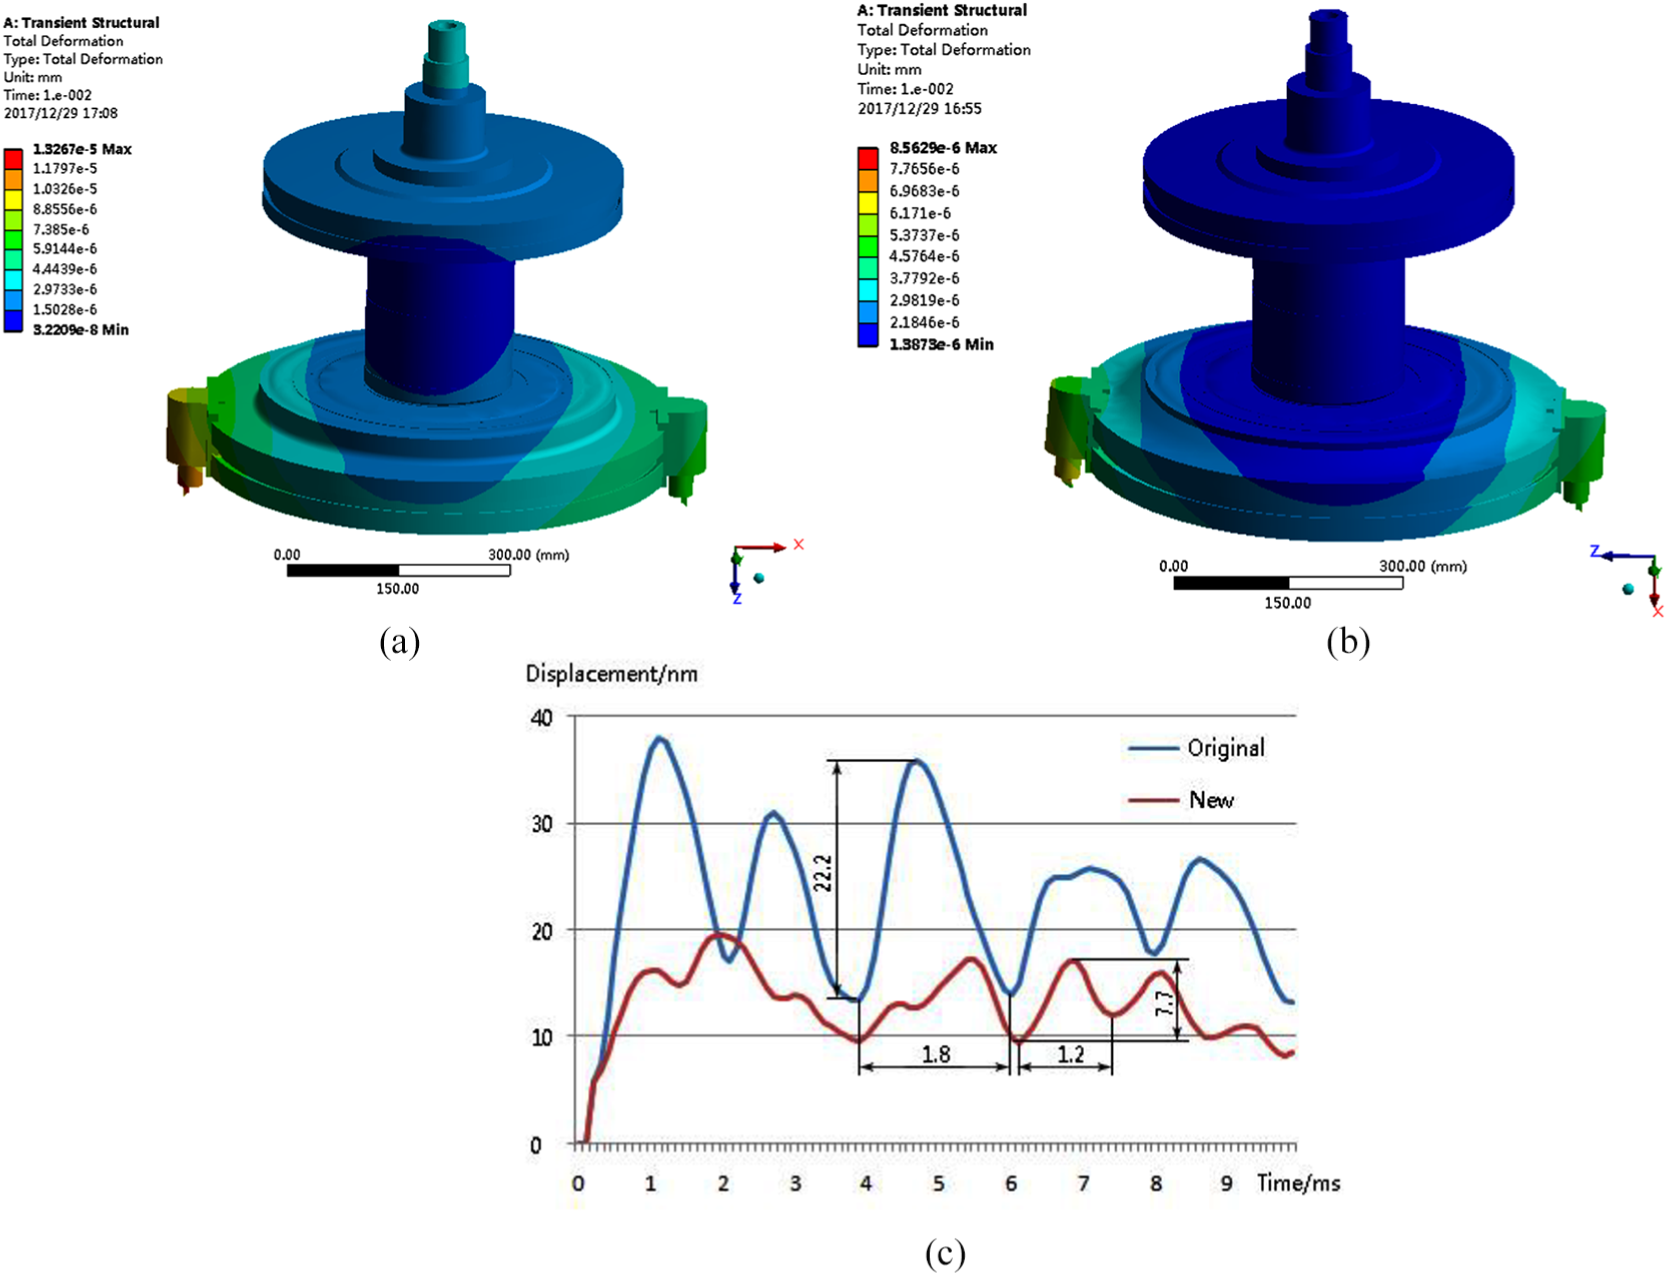
(a) Deformation of original spindle system, (b) deformation of new spindle system, and (c) vibration trajectories of the tool-tip.
As exhibited in Figure 6(c), vibration trajectories of the tool-tip in 10 ms were extracted. In the analysis for the original spindle system, the typical period is about 1.8 ms, of which corresponding frequency is 555.56 Hz. It is consistent with the sixth-order natural frequency of 551.79 Hz in modal analysis. In the analysis for the new spindle system, the typical period is about 1.2 ms, of which corresponding frequency is 833.33 Hz. It is consistent with the 10th modal frequency 854.24 Hz in modal analysis. Besides, the amplitude of the vibration waveform decreases greatly from 22.2 nm to 7.7 nm, which is beneficial to mitigate the medium-frequency waviness in the PSD1 band.
Experimental validation
Static displacement measurement
An experiment of static displacement measurement was designed to verify the fluid-structure coupled simulations. The capacitance displacement sensors (NCDT CS005), produced by Micro-epsilon Measurement Co., were used for the measurement, of which measuring range is 50 μm and resolution is 5 nm. As shown in Figure 7(a), three capacitance displacement sensors were arranged on the upper center of the shaft, the lower center of the shaft and the edge of the cutter head, respectively.
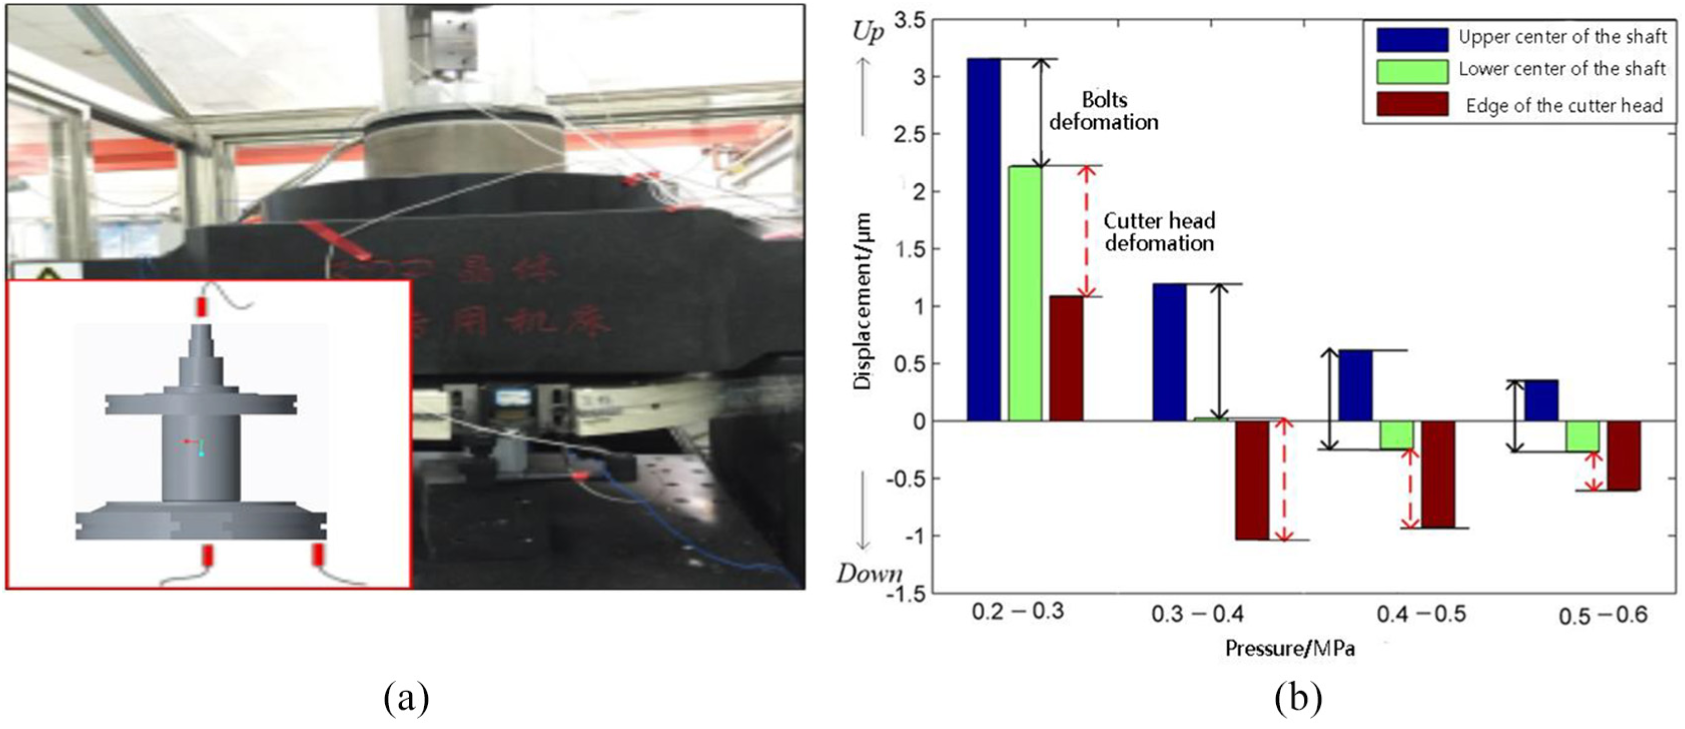
(a) Arrangement of the sensors and (b) relations between the displacement and air pressure.
In this experiment, gaps between sensors and measurement positions were controlled within 50 μm to ensure the optimal measurement accuracy. Inlet air pressure of aerostatic spindle increased gradually from 0.2 MPa to 0.6 MPa, and the increment was 0.1 MPa per step. So that the displacement of the certain position was measured.
The results of the measurement are illustrated in Figure 7(b), when pressure increases from 0.2 MPa to 0.3 MPa, all three measurement positions move up, which indicates that the whole spindle floats up. After that, the cutter head bends down and the bolts are stretched with the pressure increasing from 0.3 MPa to 0.6 MPa. The higher the pressure, the smaller the deformation increment. The displacement difference between the upper shaft center and lower shaft center reflects the deformation of the bolts. The displacement difference between the center and the edge of the cutter head mainly reflects the deformation of the cutter head.
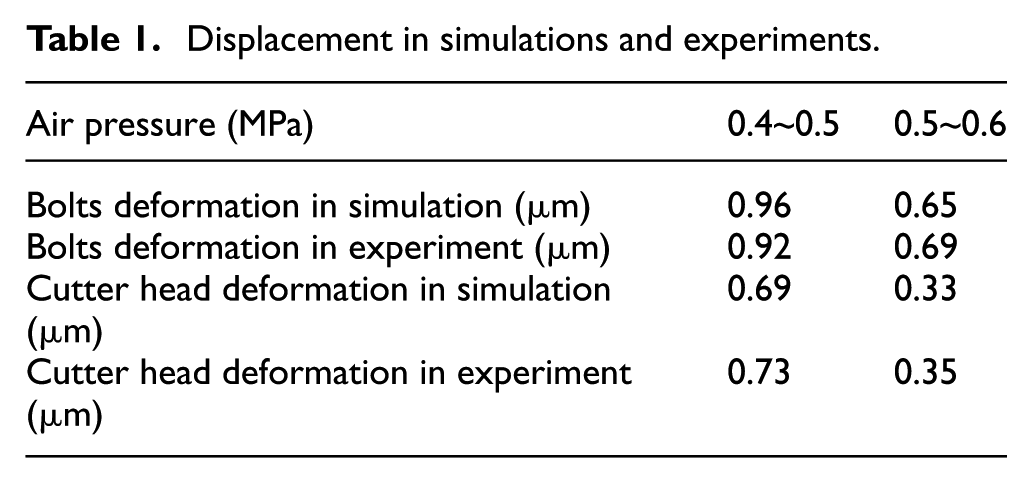
As shown in Table 1, the results of the measurement are compared with the results of fluid-structure coupled simulations. It indicates that the deformation in the simulation and measurement are highly consistent. The maximum error is 5.8%, which proves the accuracy of the fluid-structure coupled model.
Displacement in simulations and experiments.
Impact testing
In order to verify modal analysis, the impact testing was carried out. 23 As illustrated in Figure 8(a), an acceleration sensor (ULT2030VB) was arranged on the one side of the cutter head, and the hammer (ULT3302B) was used to tap on the other side gently. The FRF of the spindle system was displayed on the computer through the acquisition system, as exhibited in Figure 8(b). It demonstrates that the first three most sensitive frequencies are 132.5 Hz, 183.75 Hz, and 555 Hz. Combined with the vibration modes in modal analysis, the frequency of 555 Hz has the most significant influence on the waviness in the PSD1 band (Corresponding frequency range: 400–5000 Hz).
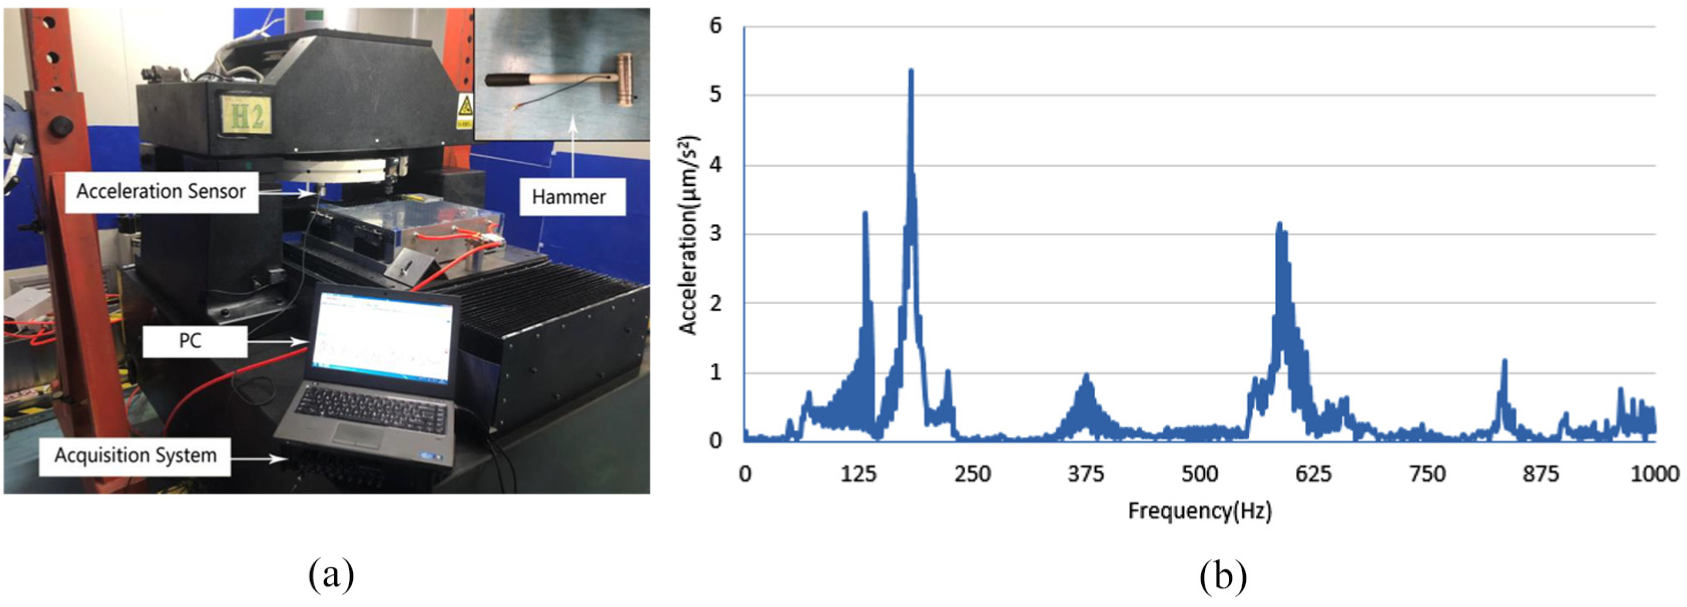
(a) The test device, and (b) the tested FRF of spindle system.
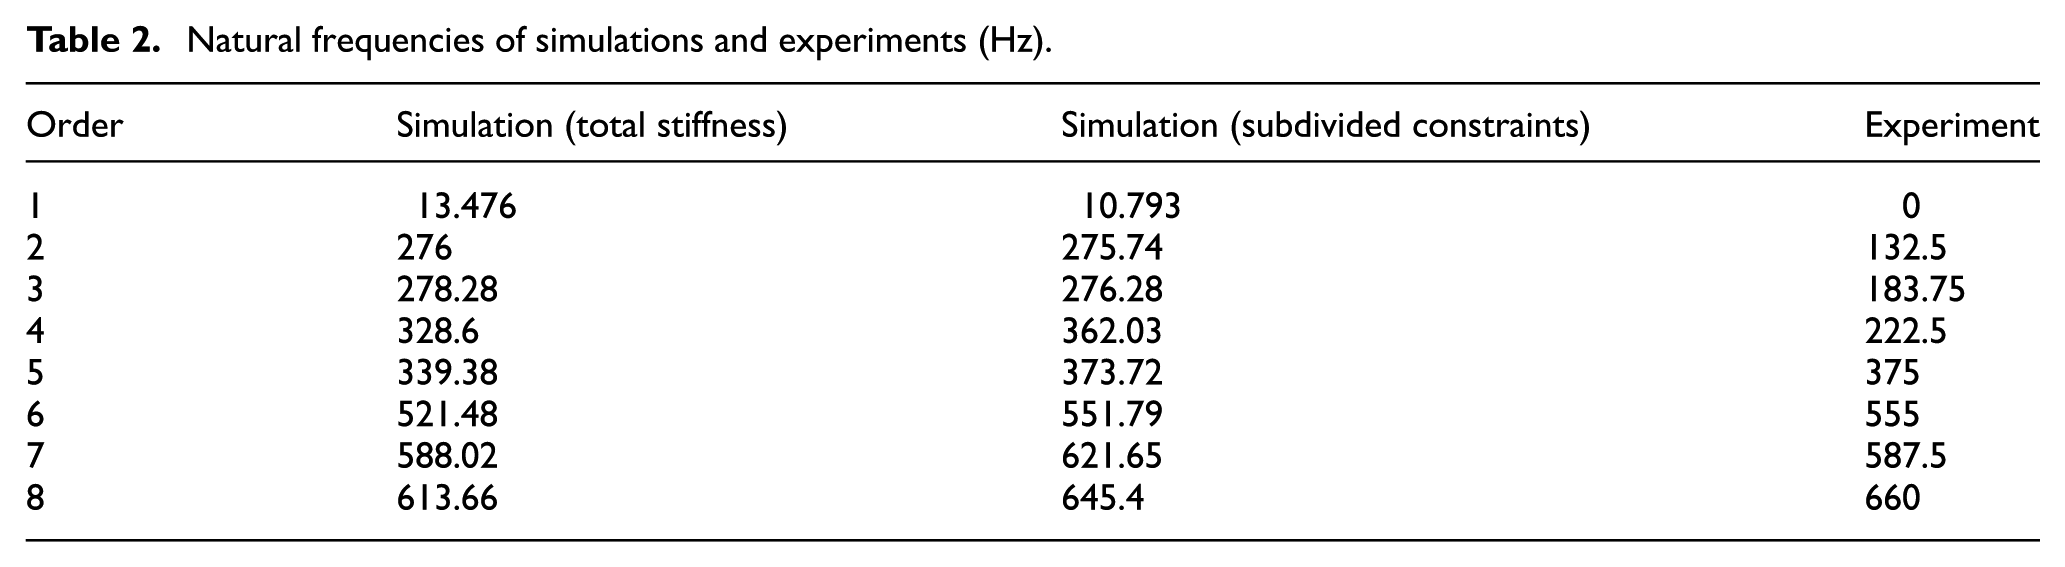
Natural frequencies of modal analysis and experiments are listed in Table 2. It indicates that the model with subdivided constraints has more precise results than the none subdivided one, especially in the sixth order. The error between the model with subdivided constraints and the experiment is only 0.61% in the sixth order. The accuracy of the model with subdivided constraints increases by 5.5% compared with the model imposed total stiffness.
Natural frequencies of simulations and experiments (Hz).
Flycutting experiment
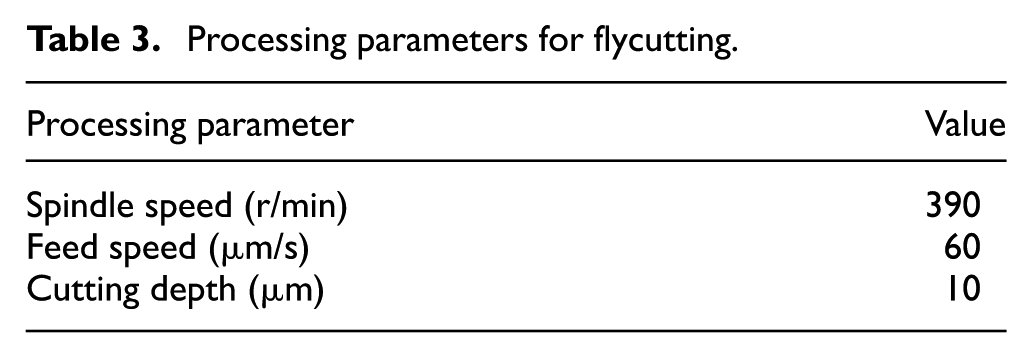
Two flycutting experiments were performed on the flycutting machine tool with different spindle systems. In the first experiment, the machine tool was assembled with the original spindle system. While in the second experiment, it was assembled with the new spindle system. Air pressure of the aerostatic spindle was 0.5 MPa. Processing parameters are listed in Table 3. After machining the KDP crystals, the workpiece surface was detected by the plane interferometer (ZYGO-32), of which the lateral resolution is 0.8 mm/pix and the detection accuracy of the cavity is 1/10λ (λ = 632.8 nm).
Processing parameters for flycutting.
Surfaces machined by two spindle systems are exhibited in Figures 9 and 10, respectively. Figures 9(a) and 10(a) are machined surfaces detected by the plane interferometer, in which it is hard to find the difference. Figures 9(b) and 10(b) show the medium-frequency waviness processed by the PSD1 algorithm. There are not only cambered waves along the feeding direction (longitudinal), but also visible waves along the cutting direction (horizontal). Their RMS values in the PSD1 band are 7.4 nm and 3.6 nm, respectively. It means that the workpiece machined by the original spindle is unqualified, while the workpiece machined by the new spindle is qualified.
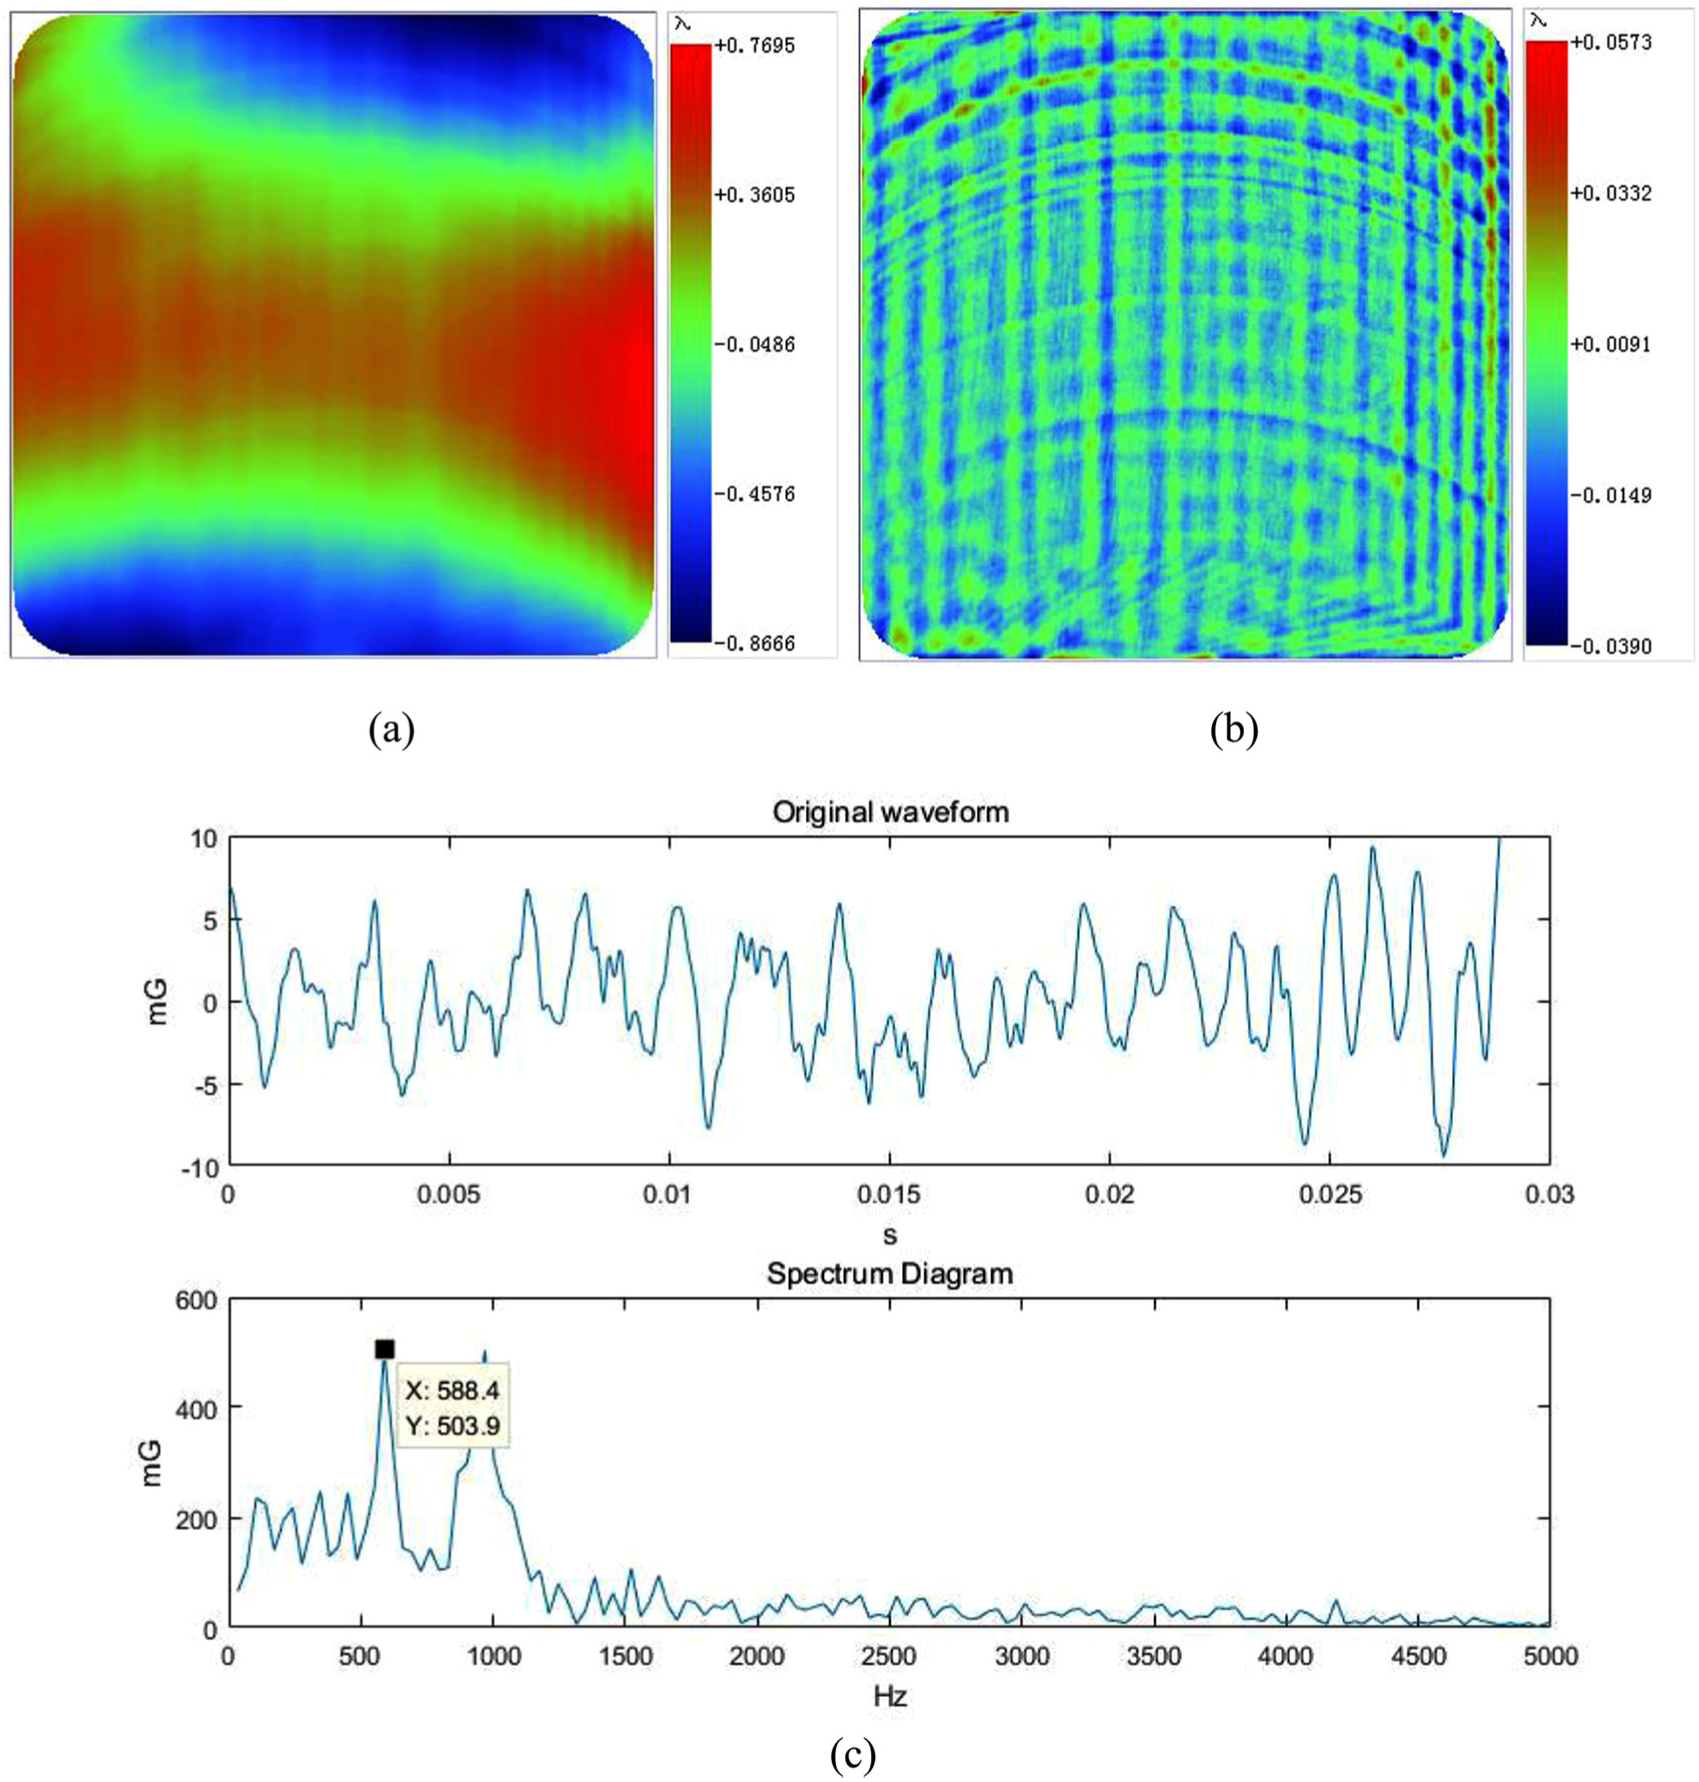
Surface topography machined by the original spindle system: (a) transmission of wavefornt, (b) waviness in the PSD1 band, and (c) waveform and spectrum along the cutting direction.
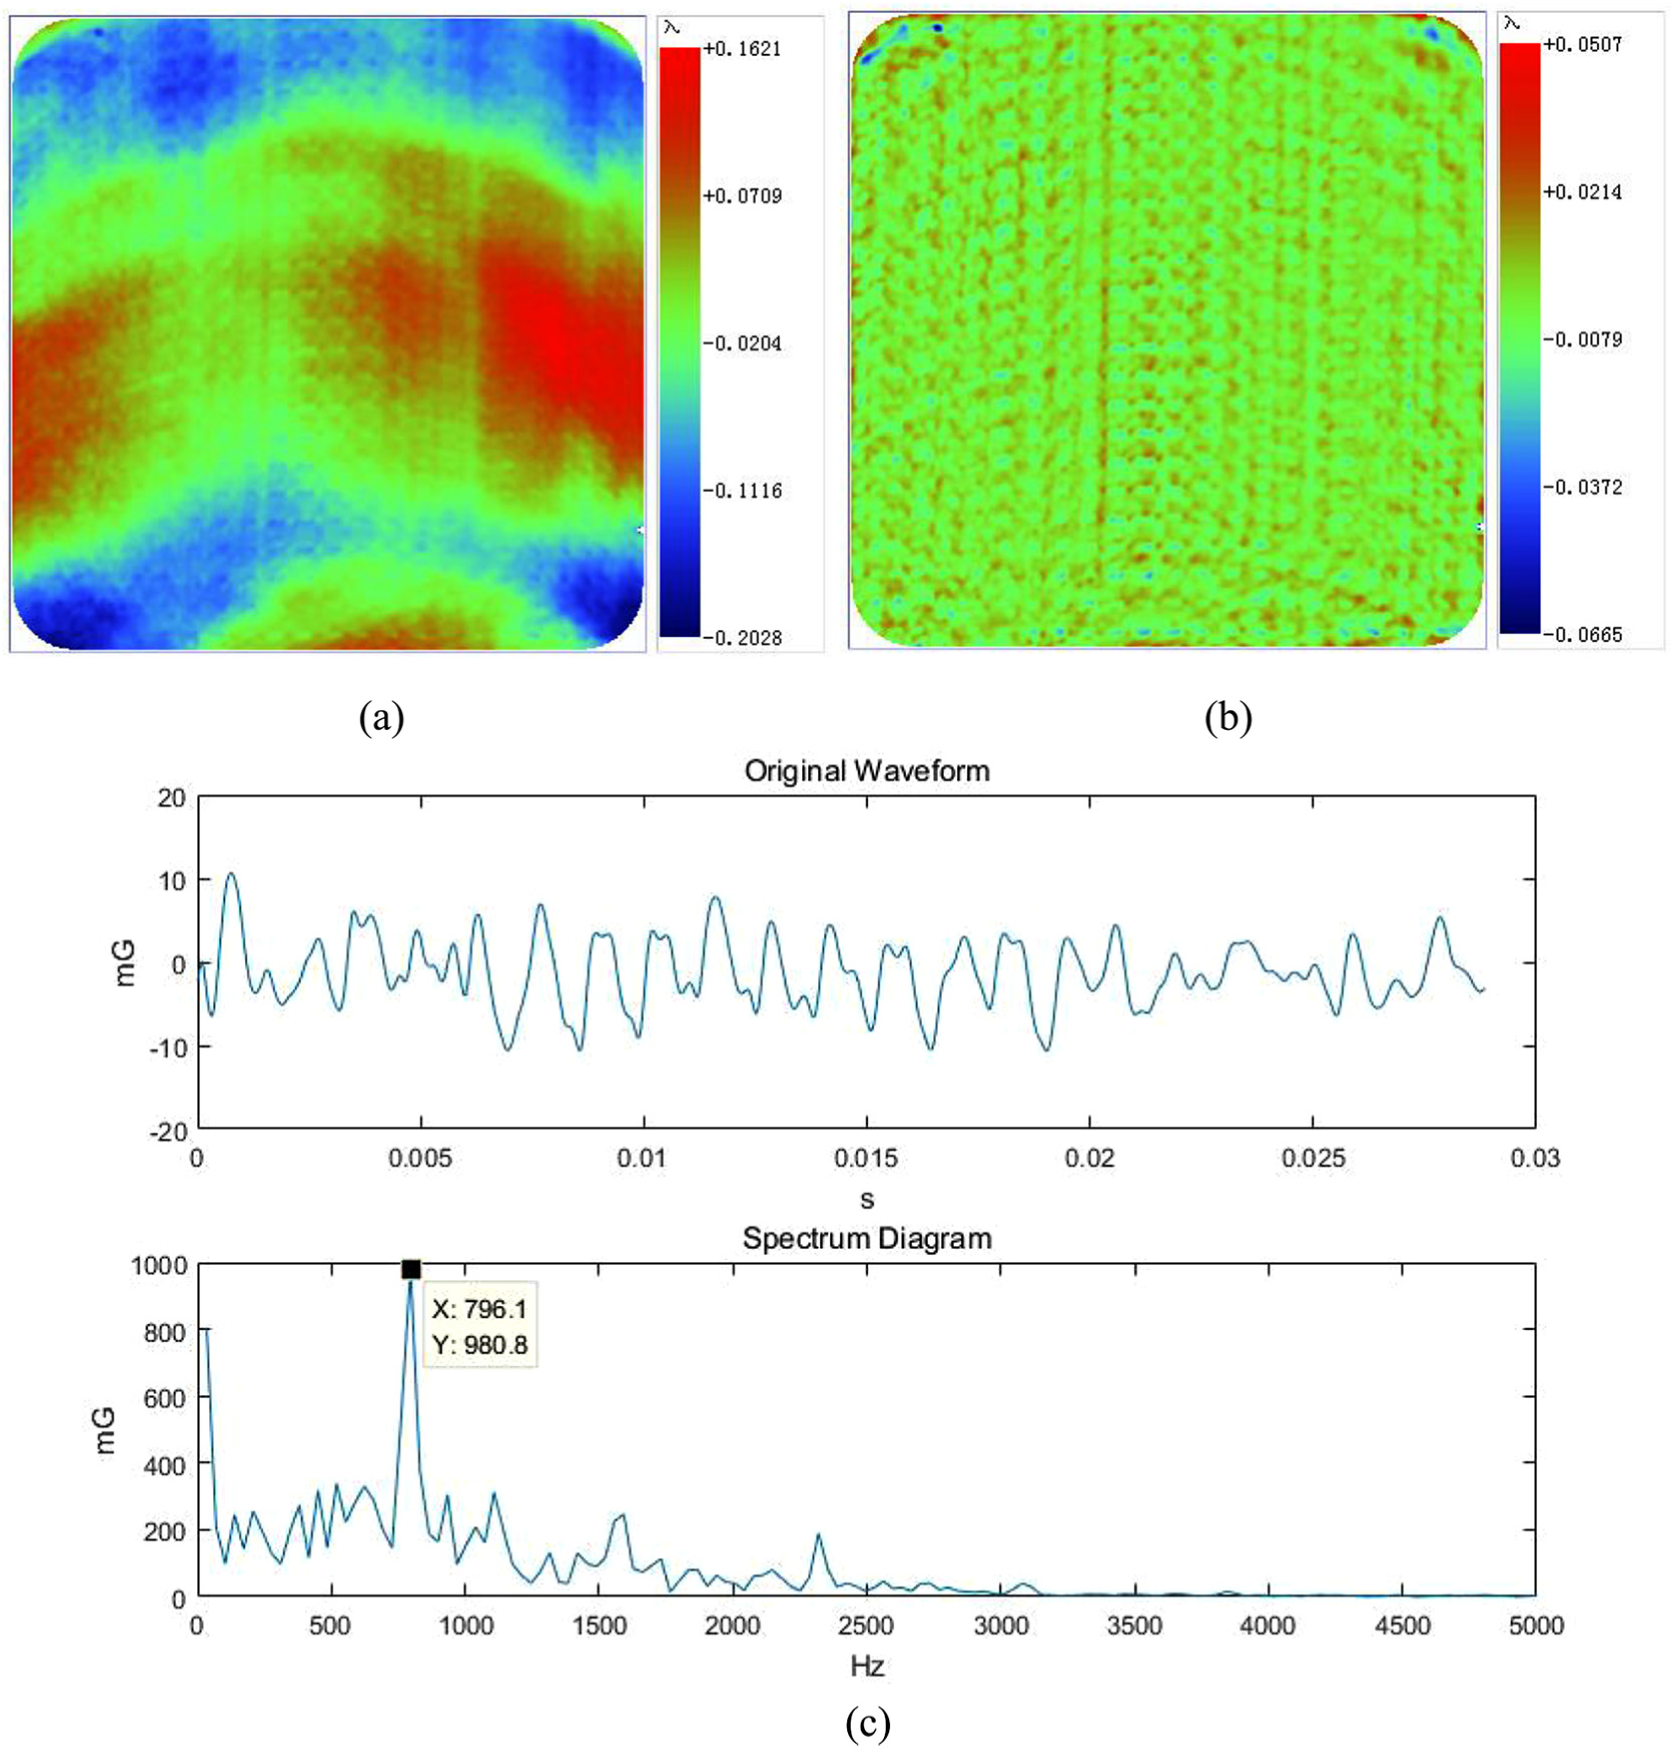
Surface topography machined by the new spindle system: (a) transmission of wavefornt, (b) waviness in the PSD1 band, and (c) waveform and spectrum along the cutting direction.
As displayed in Figures 9(c) and 10(c), waveforms were extracted along the cutting direction, and spectrum diagrams were analyzed by the fast Fourier transform (FFT) method in the MATLAB. In the spectrum diagrams, it can be seen that the dominant frequencies are 588.4 Hz and 796.1 Hz, which contributes most to the medium-frequency waviness. This result is consistent with the sensitive frequencies in modal analysis and transient analysis.
It can be found that there is a strong correlation between the vibration of the tool-tip and the medium-frequency waviness. So the characteristic of transient response could be a significant criterion for the structural design. Combining transient analysis with fly cutting experiments, in order to ensure that the RMS value in the PSD1 band is smaller than 5 nm, the amplitude of vibration waveform in transient analysis should be smaller than 8 nm.
Conclusion
In order to meet the requirement of KDP crystals in the PSD1 band, the dynamic performance of aerostatic spindle and its influence on machined surfaces were investigated by finite element simulations and experiments. The main conclusions are drawn as follows:
Modal analysis and harmonic response analysis indicate that the sensitive natural frequency of the original spindle is 551.79 Hz in the sixth order, while the sensitive natural frequency of the new spindle becomes 854.24 Hz in 10th order.
Transient analysis shows that the vibration frequencies of the tool-tip are consistent with the sensitive natural frequencies. The amplitude of vibration reduces greatly from 22.2 nm to 7.7 nm.
In two machined KDP crystals, the dominant frequencies of waviness along the cutting direction are 588.4 Hz and 796.1 Hz, respectively. It means the medium-frequency waviness is caused by modal vibration of the spindle.
For meeting the requirement that the RMS value should be smaller than 5 nm in the PSD1 band, the technical index is proposed: the amplitude of vibration in the transient analysis should be smaller than 8 nm.
Footnotes
Appendix 1
Declaration of conflicting interests
The author(s) declared no potential conflicts of interest with respect to the research, authorship, and/or publication of this article.
Funding
The author(s) disclosed receipt of the following financial support for the research, authorship, and/or publication of this article: This work was supported by the Science Challenge Project (No. JCKY2016212A506-0504).