
Abstract
The objective of this study was to identify the dynamic response of the bicycle rider’s body during translational perturbations, in an effort to improve two-wheeler safety and comfort. A bicycle mock-up was equipped with sensors measuring three-dimensional seat and trunk accelerations and rider’s force responses at the seat, handlebars, and footpegs. The bicycle mock-up was driven by a hexapod motion platform that generated random noise perturbations in the range of 0–10 Hz. Twenty-four healthy male adults participated in this study. Responses are represented as frequency response functions capturing three-dimensional force interactions of the rider’s body at the seat, handlebars and footpegs in terms of apparent mass, and rider’s trunk motion (one-dimensional) as function of seat motion as seat-to-sternum transmissibility. Results showed that the vertical and longitudinal apparent mass for most of the bicycle interfaces followed the resonance of the seat-to-sternum transmissibility. A twice as high magnitude was observed at the resonance, although a more heavily damped system was apparent in the seat-to-sternum transmissibility. Resonant frequencies were considerably higher in the vertical direction compared to the longitudinal direction. Different dynamics were observed for the lateral measurements, where all magnitudes decreased after the base frequency, and no resonance was observed.
Introduction
In cycling, the rider’s mass is much larger than the vehicle mass. Hence, the rider can contribute considerably to the dynamic behavior of the bicycle, not only by means of voluntary control actions but also by means of the passive biomechanics of his or her body. The rider’s body consists of inertial and visco-elastic properties that interact with the bicycle and affect the dynamic response of the combined system. The stabilization of dangerous oscillatory two-wheeler modes such as weave 1 and wobble 2 are influenced by the rider’s biomechanical properties. Therefore, a biomechanical model with human-like properties needs to be included to study the dynamic behavior of the combined bicycle-rider system.
In the automotive field, the biodynamic response of seated subjects exposed to whole-body vibration (WBV) has been extensively reported in terms of the apparent mass (APMS). Fairley and Griffin 3 measured the APMS of seated humans with and without backrest in the fore-aft and lateral directions. Mansfield and Lundström 4 measured the APMS of seated humans exposed to non-orthogonal horizontal vibrations. Rakheja et al. 5 and Toward and Griffin 6 measured the APMS of seated humans under automotive postures hands-in-lap (e.g. passengers) and hands-on-steering wheel (e.g. drivers) in the vertical direction. Toward and Griffin 7 measured the vertical APMS of seated humans for four different backrest conditions. Wang et al. 8 and Kim et al. 9 reported the vertical APMS for different sitting postures and seat designs. Gao et al. 10 conducted similar experiments as Toward and Griffin. 7 A simple two-mass-lumped model was adopted to describe the vertical vibration characteristics of the seated human body. The APMS predicted by the established model agreed very well with those obtained from experiments. In general, body mass dependent models are successful in predicting the APMS and transmissibility responses of a seated human body. 11 The driving point mechanical impedance, seat-to-head transmissibility, and APMS are the principal characteristics used to describe the biodynamic response of a seated human body under WBV in the automotive sector. The APMS is popular, as it is straightforward in physics and can be measured conveniently. A review on the fundamentals of biomechanical modeling of the human body in transport systems is presented by Więckowski. 12
In the field of two-wheelers, no study was found reporting the APMS of seated riders exposed to translational perturbations. Most studies focus on rotational motions and measure different biodynamic characteristics. For example, Katayama et al. 13 measured the center of mass and moment of inertia for normal and forward-leaning riding positions and proposed two different biomechanical models to describe the passive biomechanics of the rider’s body. One of these models has two degrees of freedom (DOFs) concerning leaning motion of the trunk and lateral movement of the lower trunk, the other model describes the yaw motions of upper and lower body segments. These models, however, have not yet been experimentally validated. Cossalter et al. 14 generated steer torque perturbations using a motorcycle simulator to identify the visco-elastic properties of the rider’s arms (i.e. steering impedance) and trunk. A two DOF model was adopted for this purpose, but the coefficient of variation (ratio of the standard deviation to the mean) of the identified arm properties was quite large. The variations were possibly due to differences in the physique and riding experience of the participants. Doria and Tognazzo 15 generated yaw perturbations using a motorcycle mock-up and developed two biomechanical models to simulate the response of the rider to yaw and steer oscillations. Predictions of the one-DOF model were successful below 4 Hz, whereas the two-DOF model captured the whole frequency bandwidth of 0–10 Hz. The identified values of stiffness and damping of waist and arms were in good agreement between the two models. Doria et al. 16 used a motorcycle mock-up and Doria and Tognazzo 17 a bicycle mock-up to generate roll perturbations and measured the rider’s trunk lean stiffness and steering impedance. Biomechanical models with up to five DOF were used in the first study. In the second study, a similar approach to the one of Schwab et al. 18 was followed to model and analyze effects of the passive response of the rider’s body on the stability of a bicycle. Similar results with Doria and Tognazzo 15 were observed for the one-, two-, and three-DOF models. The five-DOF model which included a detailed description of the arms stiffness and damping properties was able to simulate accurately both the lean and torque responses.
The aim of this study is to identify the dynamic response of the rider’s body at all interfaces and in all three translational directions. The response of the rider’s body is represented in the frequency domain by means of frequency response functions (FRFs). More specific, the interaction of the rider’s body in the seat, handlebars, and footpegs is expressed in terms of APMS and as seat-to-sternum transmissibility (STST) functions. The paper is organized as follows: First, the experimental set-up, the perturbation signal design, and experimental procedure are presented. Next, the results, including STST and APMS, are presented. The article ends with a discussion and conclusion section highlighting the main findings. All notations of this paper are presented with alphabetic order in Appendix 1.
Methods
Description of experimental set-up
To identify the rider’s body response to WBV, a dedicated modular experimental set-up was developed, consisting of a custom-made bicycle mock-up placed on an industrial high-end hexapod, see Figure 1(a). The experimental set-up is able to perturb and monitor the rider’s body in a wide frequency range (0–12 Hz), while keeping the rider in an upright riding posture similar to that of a city bike. The mechanical structure of the bicycle mock-up consists of standard bicycle parts and steel tubes held together with aluminum clamps. The steering assembly is fixed and the footpegs are placed symmetrically in order to obtain comparable results between the two sides. The geometry of the bicycle mock-up is based on the dutch city bike Batavus Browser (56 cm). The fundamental geometrical dimensions of the constructed frame, together with a seated rider are presented in Figure 1(b): (D) declares the seat post inclination which is 72°, (E) is the head angle which is 12°, (TT) is the top tube length which is 68 cm, (RTH) and (STH) are the reach and stack to handlebars dimensions which are 44 and 75 cm, respectively. The average seated rider had an upper trunk inclination (A) of approximately 20°, a knee (B) and ankle angle (C) of about 90° and 75°, respectively. The latter applies to the body build of the 95% of the male European population. 19
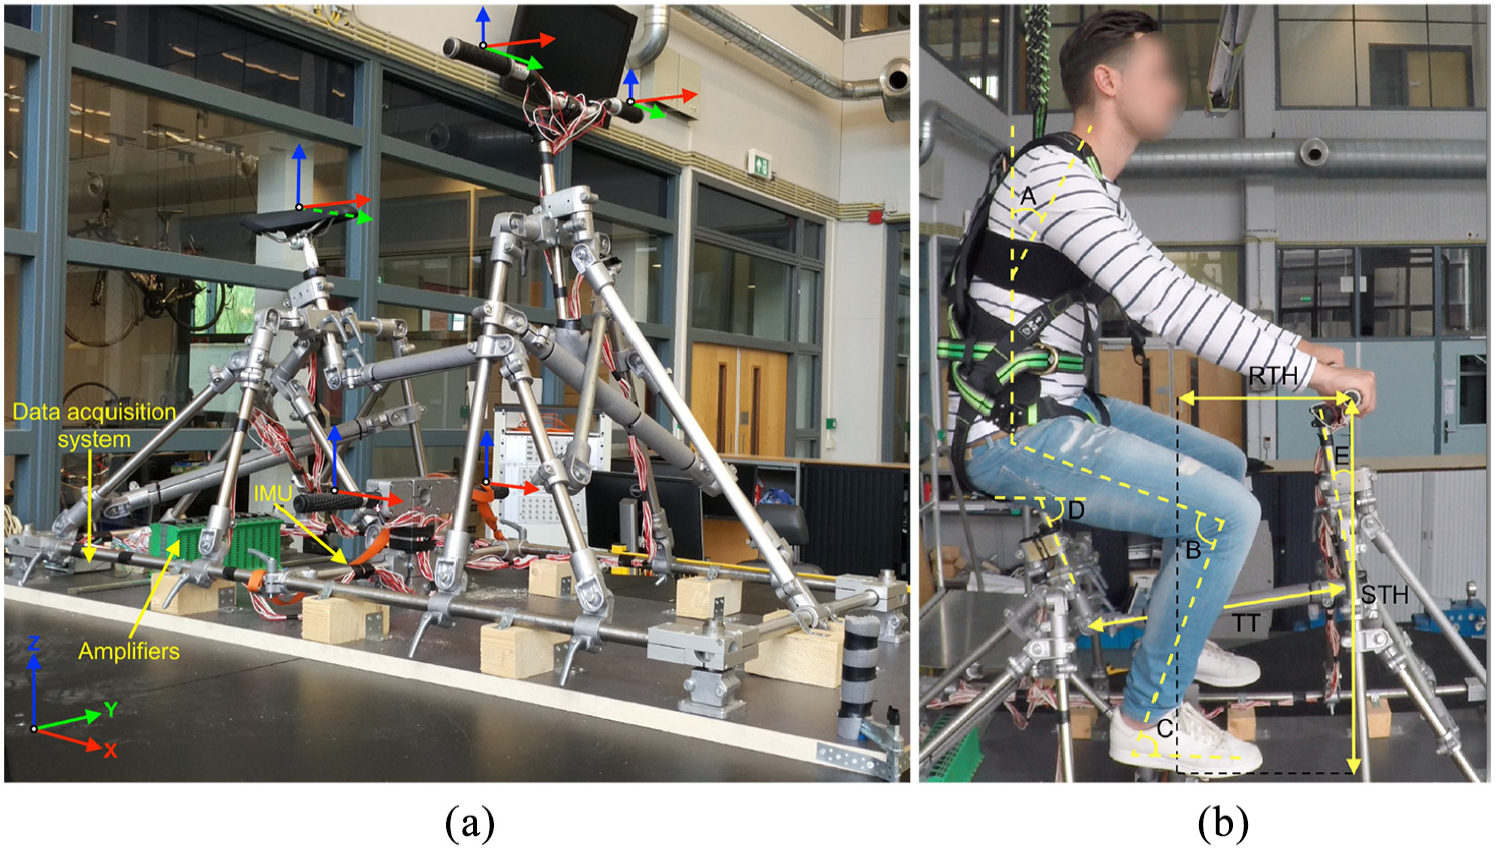
Bicycle mock-up without and with seated rider: (a) location of sensors and amplifiers and (b) basic frame dimensions with seated rider and safety harness.
The bicycle mock-up is equipped with an inertial measurement unit (IMU) and a total of 13 full-bridge strain gauge sensors in half-bridge configuration to measure the motion and the forces at the interfaces. Six half-bridges are located at each handlebar, four at each footpeg, and six at the seatpost. A side view of the locations of the half-bridges is shown in Figure 2. With the strain gauge configuration, the rider’s force responses in all interfaces and directions can be measured (except for the footpeg forces in lateral Y-axis, where no relevant force responses are expected). Laboratory tests were performed to determine the optimal location of the strain gauges on the handlebars, minimizing the potential geometrical and crosstalk effects. For instance, the strain gauges that measure the vertical and longitudinal applied handlebar loads (i.e. Z-, X-axis) were placed immediately after the tapered clamping area. On the contrary, the strain gauges that measure the lateral applied handlebar loads (i.e. Y-axis) were placed near the grips to avoid any geometrical artifact due to the handlebar curvature, see Figure 2(a). The footpeg and saddle strain gauges were placed as close as possible to the mounting area of the bicycle frame, see Figure 2(b) and (c). Crosstalk, the influence of forces from the non-measuring direction, was subtracted from the strain gauge measurements.
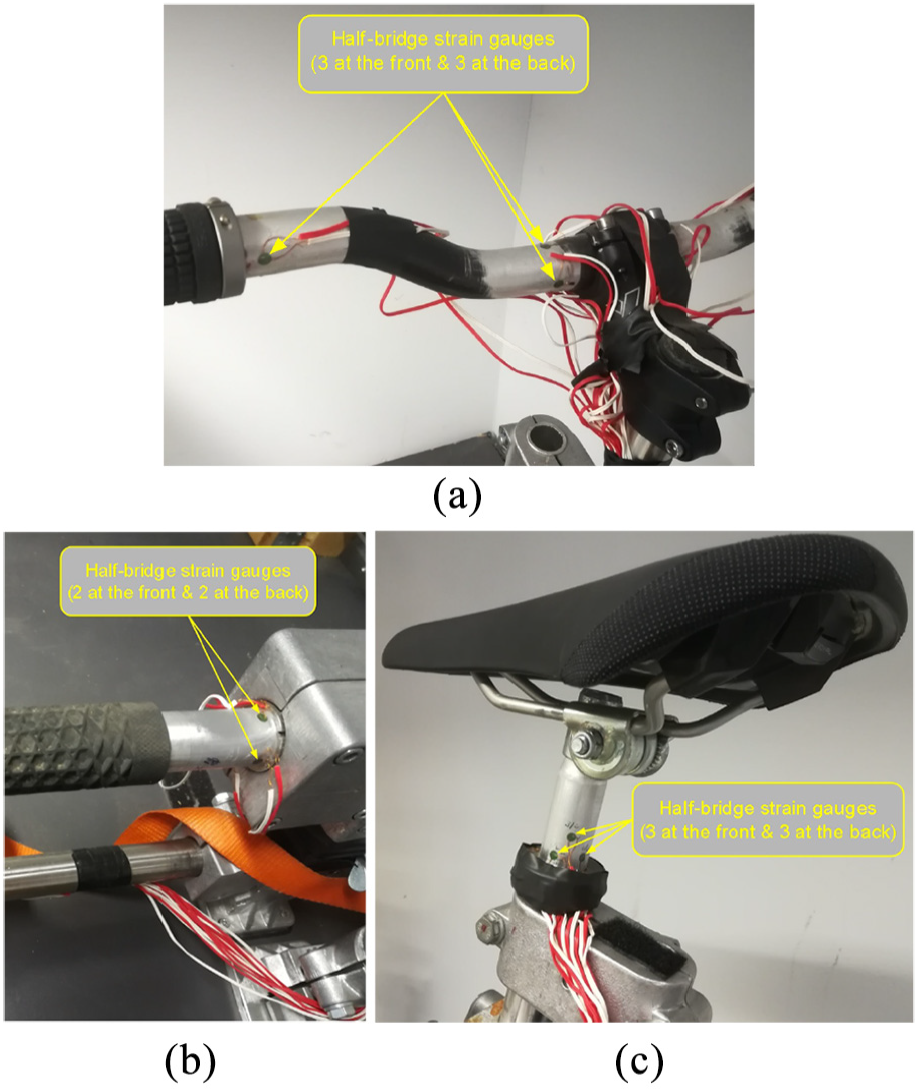
Locations of the strain gauges at the bicycle interfaces: (a) left handlebar, (b) left footpeg, and (c) seatpost.
A data acquisition system from National Instruments (LabVIEW) and MTW Awinda (Xsens software) sampled the strain gauges and IMU signals at 100 Hz. The bicycle mock-up was mounted on the top of a hexapod from E2M Technologies. The hexapod provides a sufficient response up to around 10 Hz; for higher frequencies, there was observable latency in the system. The perturbation signals were designed in MATLAB and were implemented in the platform using the eMove eM6-670 electric motion system of the hexapod.
Perturbation signal selection and design
In the automotive field, random noise oscillations with different bandwidths and magnitudes are typically applied to identify the APMS of seated humans. Fairley and Griffin
3
used random noise perturbations in which the frequency bandwidth was limited between 0.25 and 20 Hz, the acceleration spectral density was flat
In the field of two-wheelers, frequency sweep perturbations are commonly used to excite the seated rider. Cossalter et al. 14 used steer sine-sweep excitations with a duration of 200 s, a mean amplitude of 2° and a frequency range 0.5–12 Hz. Doria and Tognazzo 15 used yaw sine-sweep excitations with a duration of 115 s, a mean amplitude of 2°, and frequency range 0.5–10 Hz. Doria et al. 16 and Doria and Tognazzo 17 used roll sine-sweep oscillations, the initial amplitude was set to 1.5°, duration and frequency range remained the same as previous study. To avoid rider discomfort, the amplitude was decreased at higher frequencies by dividing with the square root of the instantaneous angular frequency.
In general, an optimal perturbation signal requires prior knowledge of the system and the expected noise characteristics. 20 Since the dynamics of the passive bicycle-rider system are unknown, filtered white-noise was used to excite the rider’s body. A 5-pole Butterworth filter with a cut-off frequency of 9 Hz was used to filter the white-noise signal. With the filter, the signal is concentrated in the frequency bandwidth 0–9 Hz and thereby improving the signal-to-noise ratio (SNR). The maximum perturbation amplitudes and rms for the translational signals were selected based on naturalistic cycling data collected from Ouden and Schwab 21 (see Table 1).
Amplitudes of perturbation signals in the three translational directions including mean
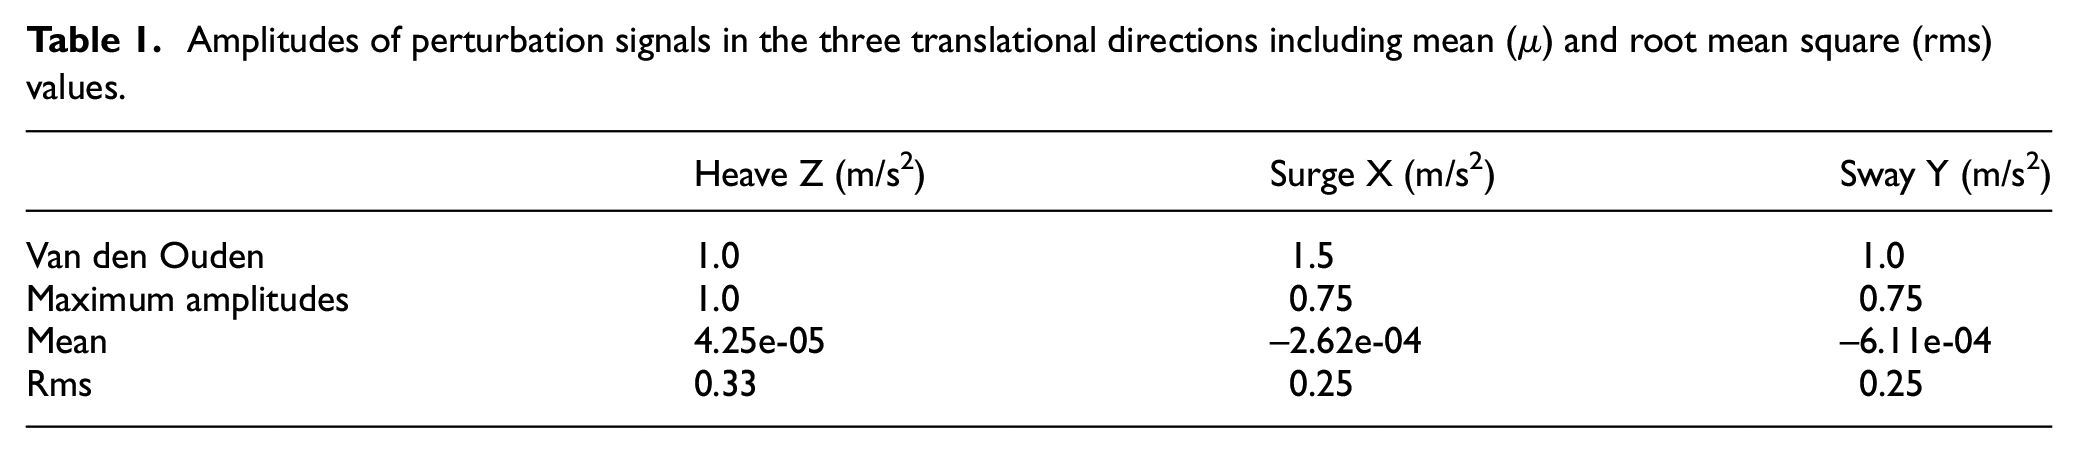
For safety and comfort, the acceleration of all perturbation signals was limited to 1 m/s2 rms. The selected frequency bandwidth includes the oscillation frequencies of dangerous oscillatory modes such as weave (0–4 Hz) and wobble (0–9 Hz) observed by Meijaard et al.
1
and Plöchl et al.
2
The filtered white-noise signals had a duration of 60 s, see Figure 3 as an example of the heave acceleration signal
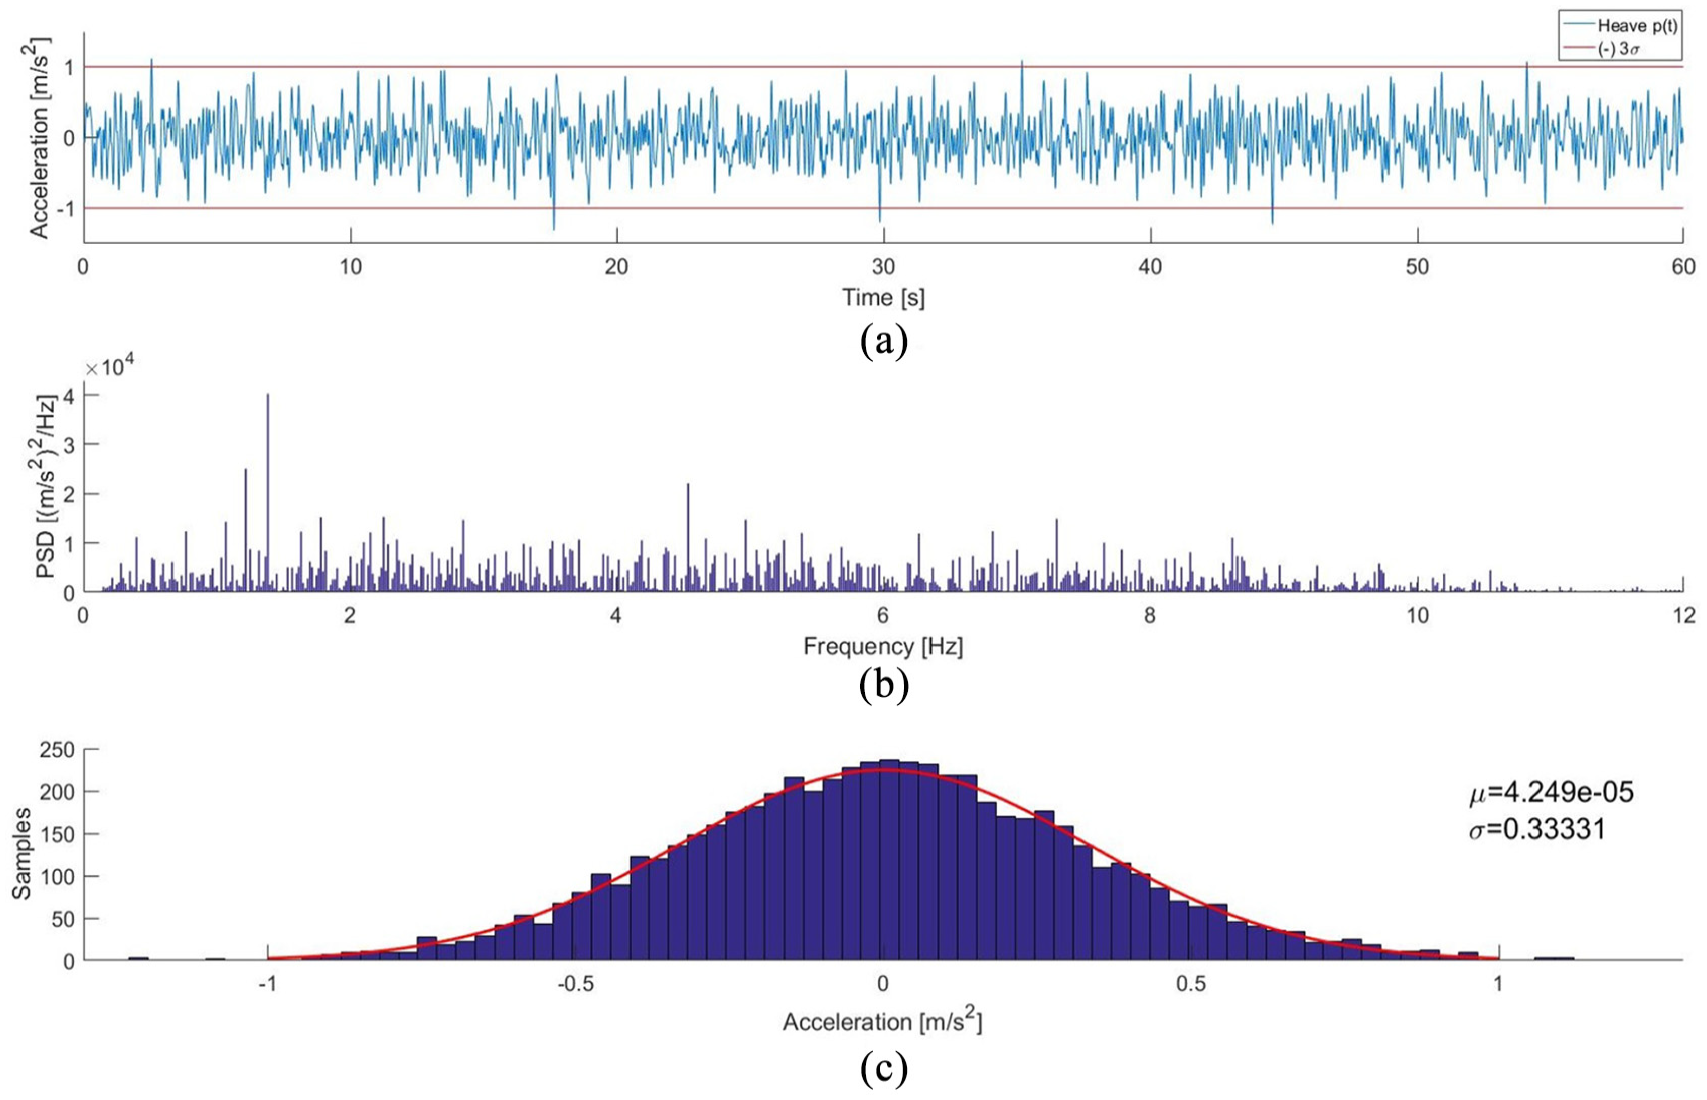
Profile of heave acceleration signal
Procedure
Twenty-four healthy men (mean age = 26 ± 3 years, weight = 81.7 ± 7.4 kg, height = 181 ± 7 cm) volunteered in this study. To assure safety, a full body safety harness was used as a fall arrest system during the experiments. All participants gave informed consent according to the guidelines of the human research ethics committee of the Delft University of Technology. Women were not included due to their different body build. Participants self-reported that they did not experience any kind of pain or injury in the year before the experiments. The mean weight of the participants was selected to be close to the European population, 22 whereas the height is close to the mean height of young European men. 23
Each experimental trial had a duration of 69 s consisting of a 4.5 s fade-in period, 60 s perturbation signal
Data recording and processing
Subjective measures
The participants completed a subjective assessment immediately after finishing the experiment. A NASA “Raw-TLX” questionnaire was used to evaluate the perceived workload, effectiveness, and other aspects of performance. 24 The NASA-TLX includes six sub-scales with scores ranging from 0–100%, from which the experimental workload is assessed.
Static and dynamic force measurements
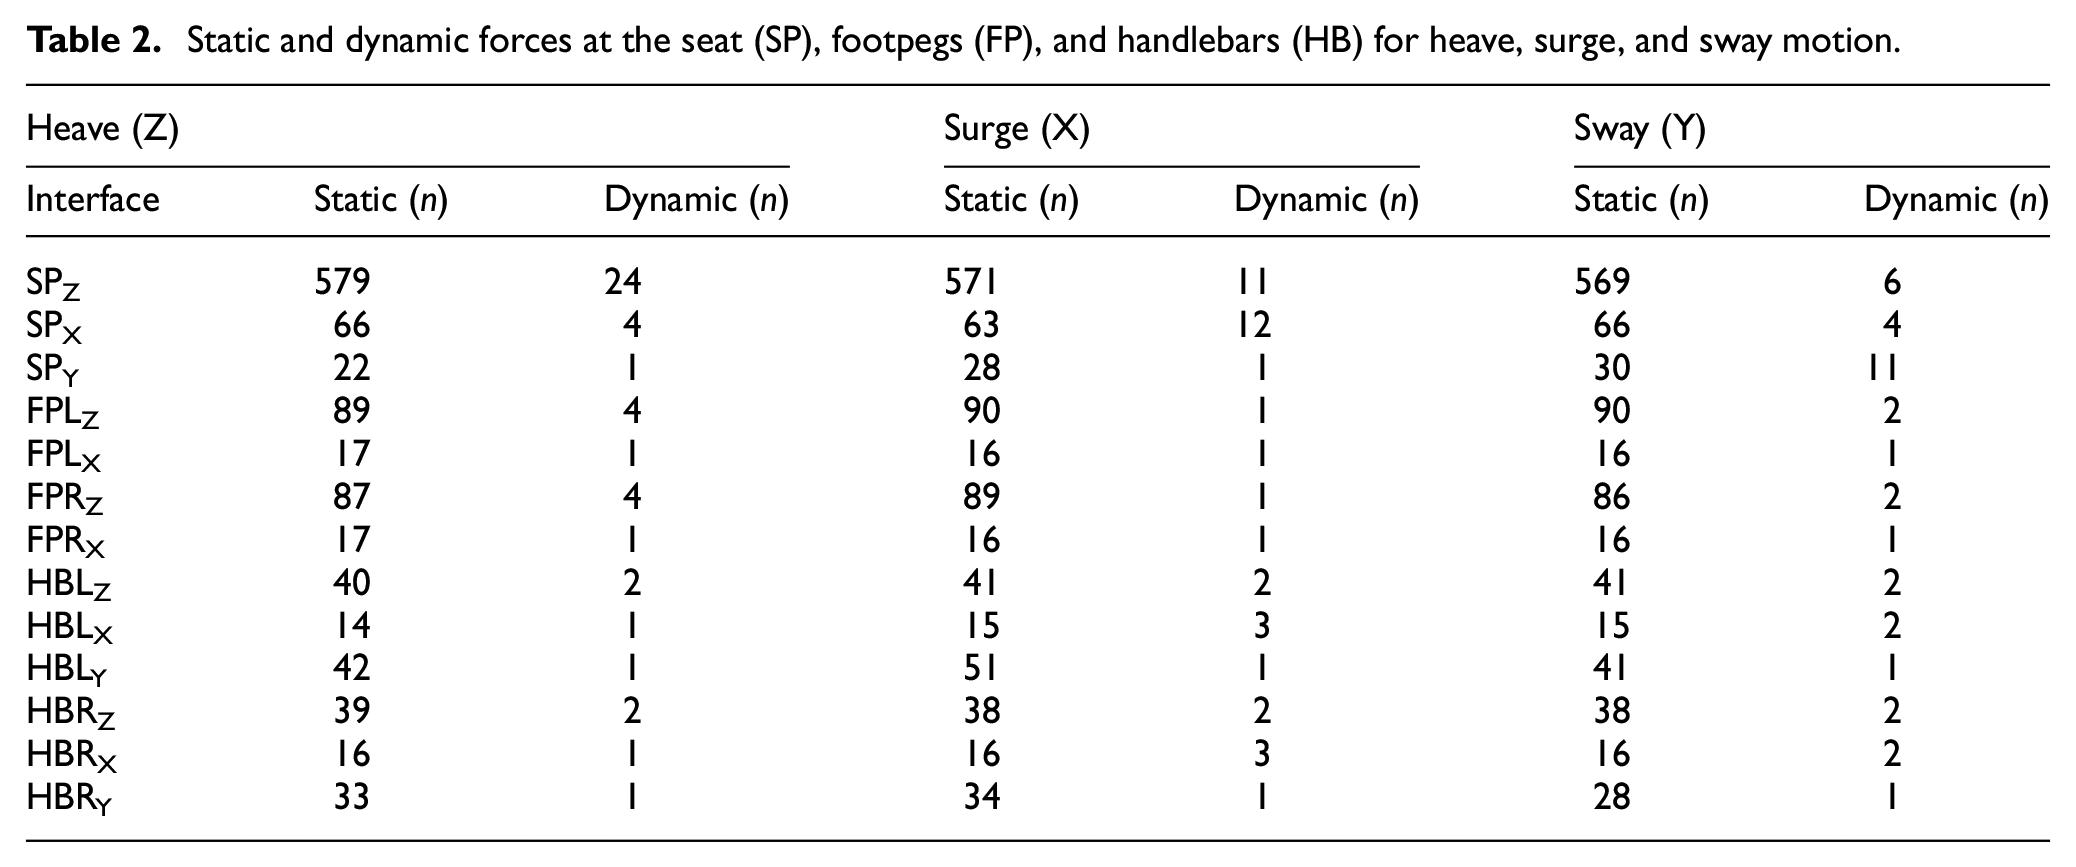
For each motion, the static forces and dynamic forces in the time domain are used as a measure to indicate dominant force directions at the three interfaces. The static force is a measure of the gravitational forces that the rider’s body mass exerts at all bicycle interfaces and is calculated as the average of the mean force over the participants. The dynamic force is a measure of behavior during the experimental trials and is computed as the rms of the force signal, see Table 2.
Static and dynamic forces at the seat (SP), footpegs (FP), and handlebars (HB) for heave, surge, and sway motion.
Transfer functions
The block diagram of the motion platform combined with the passive rider is presented in Figure 4, where
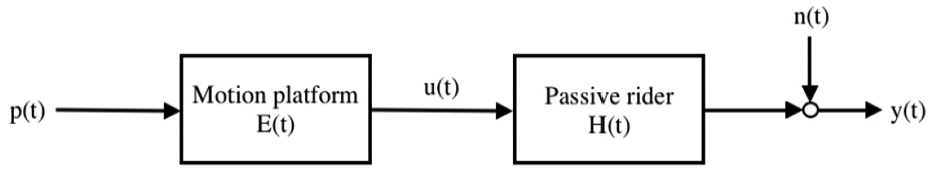
Block diagram of motion platform combined with passive rider system.
The dynamics of the rider are described based on the input–output relationship of the measured signals in the frequency domain. The STST and APMS are defined as ratios and calculated as transfer functions using the cross-spectral density (CSD) method defined by Mansfield 25 and Griffin 26

The linear correlation between the input and output is expressed in terms of the coherence, see equation (2). Coherence ranges from 0 to 1, where one reflects a perfect, noise-free linear relation

The transfer functions of the STST and APMS of the rider’s body are estimated using Welch’s method in which the spectral densities are averaged over 10 segments. 27 The dynamic responses of the left and right handlebar and footpeg side appeared symmetrical; therefore, the results of the left and right side are merged as the mean resultant forces and APMSs. The mean magnitude and standard deviation (SD) is calculated over all subjects; however for the phase a different approach is used. The mean phase is calculated by taking the angle of the average complex number, whereas the SD by estimating the circular standard deviation. The SD is displayed as a shaded area around the mean line. The coherence significance level (CSL) is shown as a dashed line in the coherence plots. A Hanning window with 50% segment overlap is used to prevent frequency leakage and the five independent segments result in a CSL of 0.53 with probability p < 0.05. 28 The SD demonstrates the variability in the behavior between the participants, whereas CSL underlines the confidence interval of the spectral estimator.
STST
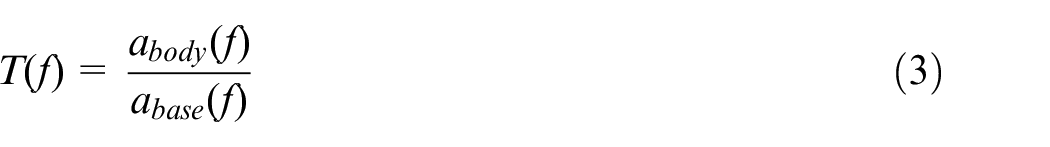
Measurement of the transmission of vibration between the bicycle mock-up and rider’s upper body is expressed in terms of transmissibility. Transmissibility T(f) is defined as the ratio of the acceleration at a point on the body to the acceleration at the base of the mock-up
To measure the transmissibility, an additional IMU was mounted on the rider’s sternum, see Figure 5 for the exact locations of the two IMUs. The IMU of the rider’s sternum was placed between two elastic stretch bands to avoid local displacements due to skin movements. Because the accelerations of the bicycle base and seat are identical, the term STST is used herein to express the acceleration transmissibility measurements between the seat base and rider’s sternum. For all motions, the acceleration measurements were transformed to the inertial reference frame, all sign conventions follow the right-handed Cartesian coordinate system, see Figure 5. In other words, all accelerations are positive in the forward (X-axis), left (Y-axis), and upward direction (Z-axis), respectively.
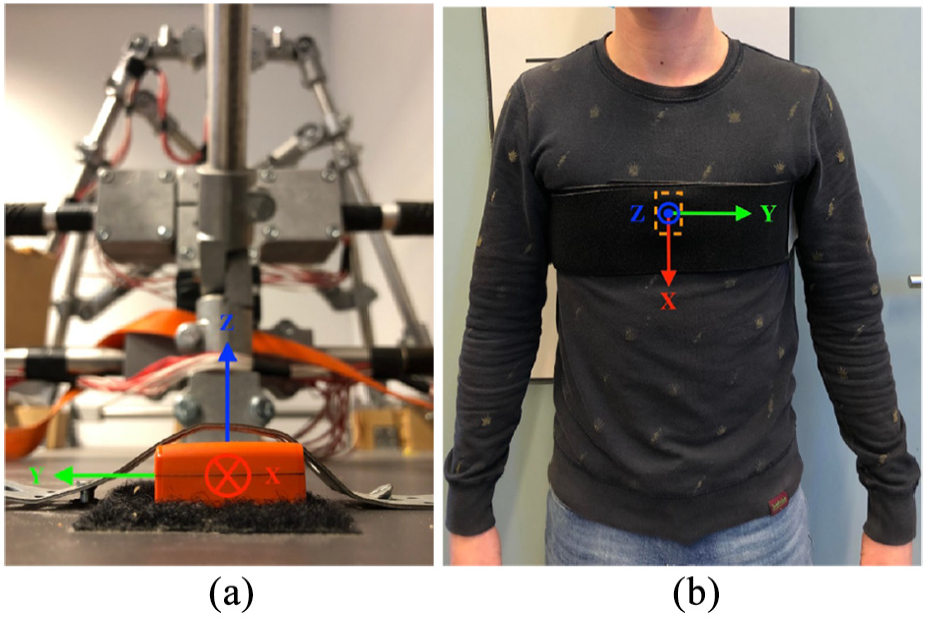
Locations of the IMUs with right-handed Cartesian coordinate system: (a) back view of motion platform and (b) front view of rider’s sternum.
APMS
The measurement of the transmission of forces between the rider’s body and the bicycle interfaces is expressed in terms of APMS. Apparent mass
For all motions, the APMS measurements follow the sign conventions of the right-handed Cartesian coordinate system, see Figure 1(a). This implies that all forces exerted from the bicycle to the rider are positive in the forward (X-axis), left (Y-axis), and upward direction (Z-axis), respectively.
Results
NASA-TLX
Results of the NASA-TLX are summarized in Figure 6. Two clusters can be identified when correlating the performance and effort scale. The first cluster (16 subjects) indicates high performance (>50%) with low effort (<40%). The second cluster (8 subjects) indicates high workload with poor performance. The scores of the second group are indicated with black markers in Figure 6 and also explain the outliers in mental demand and frustration. There were no differences between the groups in the STST and APMS (see Supplementary Material, STST_individual figure). The results of the subjective workload scores show the highest score for performance (83% median), and the lowest score for frustration (8% median). Mental, physical, temporal, and effort demand score between 13% and 25% median reflecting the passive nature of the experiments.
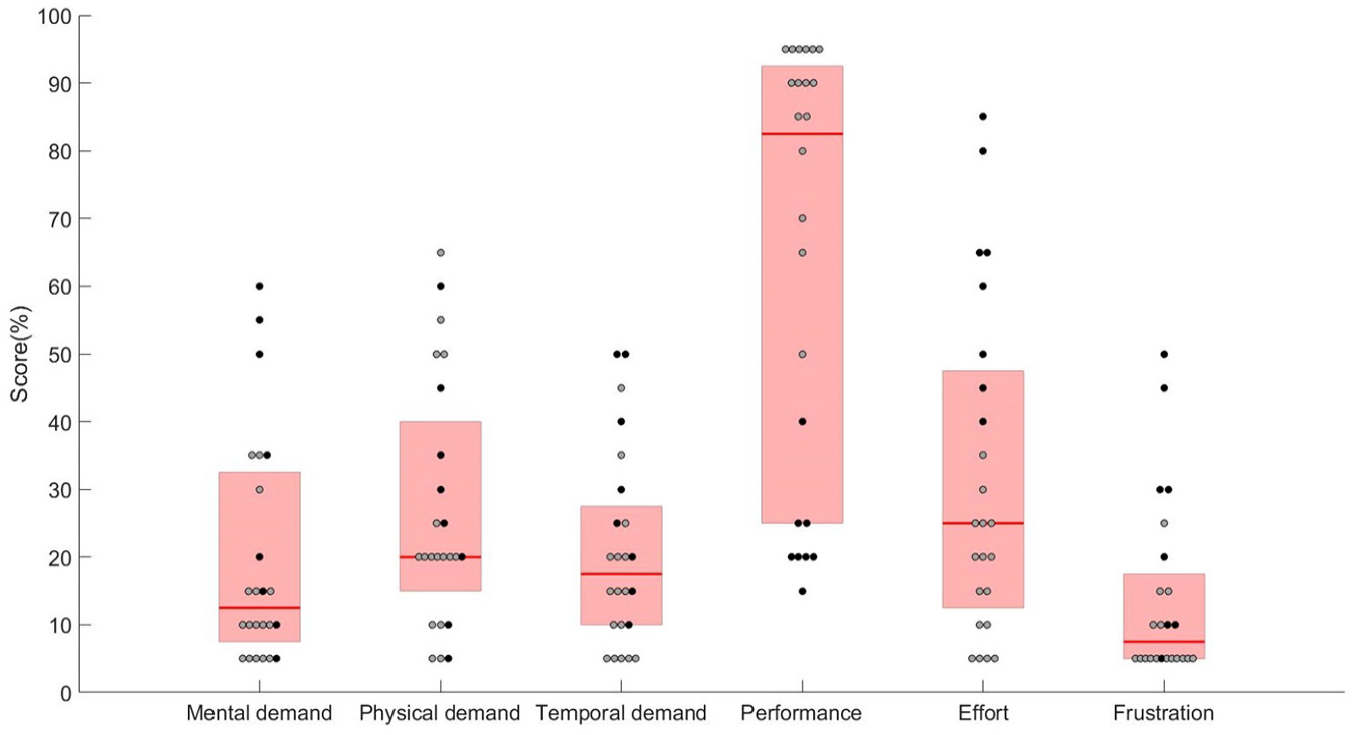
Boxplots of the NASA Task Load Index (TLX) scores for the 24 participants.
Static and dynamic force distribution
Table 2 presents the static and dynamic force distribution at all bicycle interfaces and directions. The large ratio between the static and dynamic forces indicates that the magnitude of the (static) gravitational forces is much larger than the magnitude of the forces resulting from the dynamic perturbations. Due to bicycle geometry and rider posture, symmetry is expected in the dynamic force distribution at the ZX, ZY-plane for all motions. To indicate symmetry, the dynamic force distribution matrix was decomposed into a symmetric and an asymmetric part (see Supplementary Material, Table 3). The symmetric part was calculated by taking the mean of the dynamic force cross-terms (ZX, ZY, XY) for every motion, whereas, the asymmetric part by subtracting the later from the dynamic force part.
For heave and surge, the interactions at the seat (SP) indicated higher correlation in the ZX-plane compared to the ZY-plane, symmetric coefficients were 7.5 and 3.5, respectively. Correlation was also higher in the ZY-plane compared to the XY-plane for the surge and sway motion, coefficients were 3.5 and 2.5 for the former and latter plane. Footpegs (FP) showed perfect symmetry, and handlebars (HB) had a symmetric correlation coefficient of 1.5 for all planes and bicycle motions.
For heave, dynamic forces are mainly observed at the seat (SPZ) followed by the footpegs (FPZ) and the handlebars (HBZ). The forces in the longitudinal direction of the seat (SPX) are mainly due to the bicycle geometry, while the forces in the lateral direction of seat (SPY) are probably due to asymmetry of the human body. The lateral forces in the left (HBLY) and right handlebar (HBRY) might be a result of lateral handlebar deformation induced by the vertical and longitudinal applied forces.
For surge, dynamic forces are generated in the longitudinal (SPX) and vertical (SPZ) direction of the seat, followed by the handlebars (HBX) and (HBZ). Footpegs show similar forces at the longitudinal (FPX) and vertical (FPZ) directions. Forces in the vertical direction are presumably a result of rider posture and anterior/posterior trunk movements.
For sway, dynamic forces are present in the lateral seat direction (SPY) followed by (SPZ) and (SPX). At the footpegs and handlebars, forces are more dominant at the vertical direction. It is evident that the rider co-activates his leg and arm muscles (i.e. vertical foot and handlebar forces) to reduce side-to-side swing of his trunk effectively.
Transmissibility
The STST for all motions are presented in Figure 7. For the heave motion, coherence is significant (p < 0.05) for all frequencies. The magnitude of the STST increases after 1.5 Hz and reaches a resonant peak at 5 Hz. The phase of the trunk leads from 0.17 to 4.8 Hz and lags for all other frequencies.
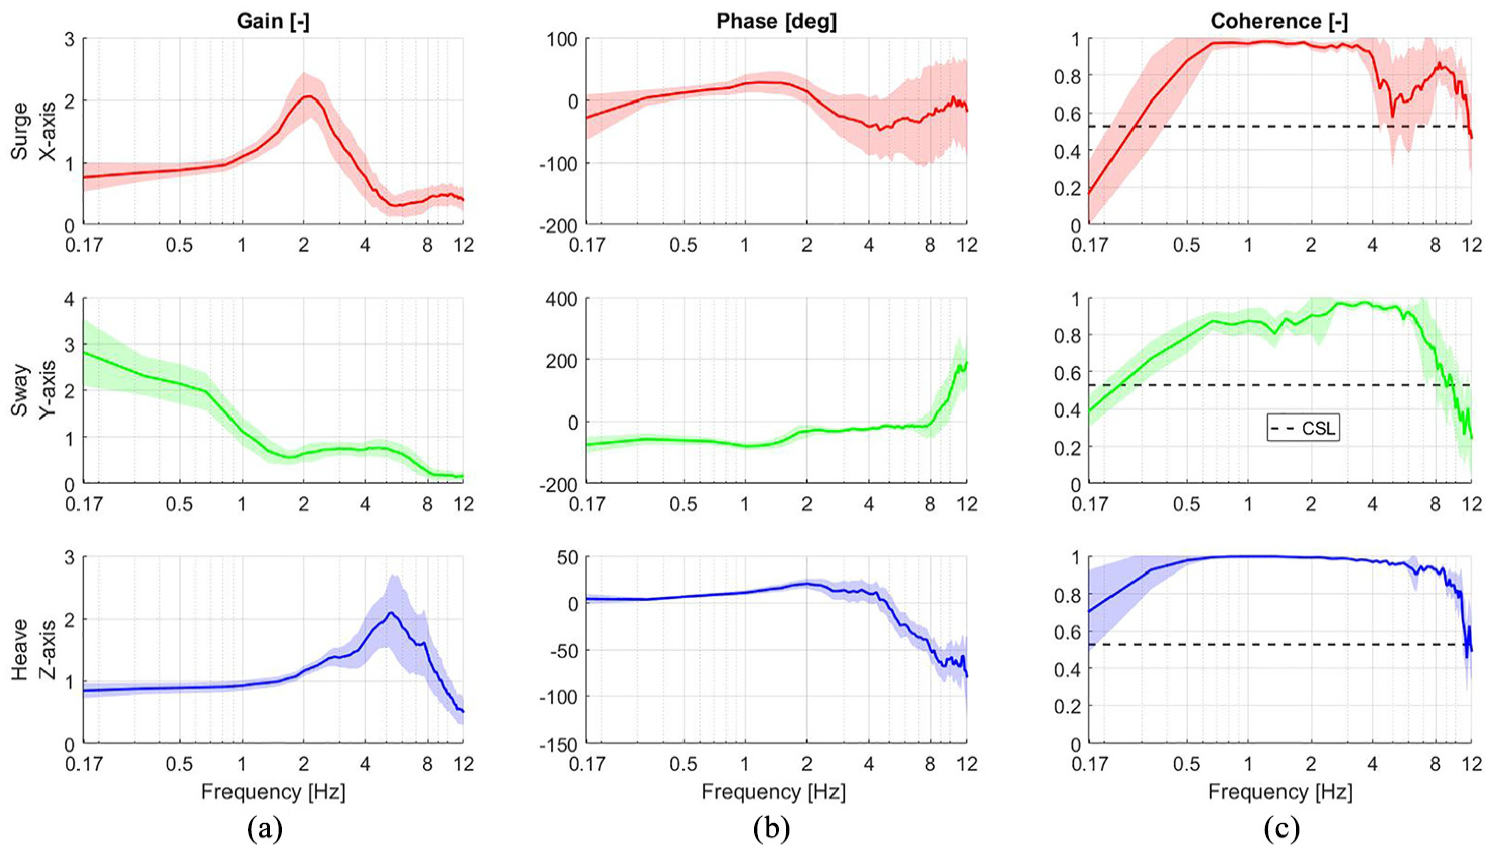
Seat-to-sternum transmissibility (STST) for heave (Z, vertical), surge (X, longitudinal), and sway (Y, lateral) motions as a function frequency (f): (a) magnitude, (b) phase, and (c) coherence, shade = standard deviation over participants, coherence is significant above the dashed line.
For the surge motion, coherence is significant (p < 0.05) between 0.33 and 11.5 Hz. The magnitude of the STST increases after 0.8 Hz and reaches a resonant peak at 2 Hz. The phase of the trunk flips above 0.33 Hz and continues to lead up to 2 Hz, next the phase lags up to 8 Hz. For both motions, the rider’s trunk accelerations exceed seat accelerations by a factor of 2.
For the sway motion, coherence is significant (p < 0.05) between 0.33 and 8 Hz. At 0.33 Hz, the acceleration of the trunk is approximately three times higher (magnitude = 2.8) than the seat. Between 1 and 8 Hz, the acceleration of the trunk is lower (magnitude < 1) than the seat. The phase lag suggests that participants try to restrain the sway of the upper trunk. Participants used postural control to restrain excessive movements and prevent falling off the seat.
APMS
The APMS for the heave motion (Z) are presented in Figure 8. All cross-axes are included in the figure; nevertheless the analysis is mainly focused on the vertical direction (Z-axis), since this is the axis where the most dominant rider forces are present. Coherence is significant (p < 0.05) above 0.2 Hz for all APMS; thus, this frequency is used as a base to interpret the magnitude and phase responses for this motion. At this base frequency of 0.2 Hz, the magnitude is 52.08 kg* (* represents base frequency magnitude) at the seat, 7.13 kg* at each footpeg, and 5.23 kg* at each handlebar. The sum of all magnitudes at the base frequency is 76.8 kg, which is approximately the mean rider’s weight. The vertical and longitudinal APMSs are also close to the static loads, see Table 2. The magnitudes at the seat and handlebars show a resonant peak at 5 Hz, which matches the resonance of the STST, whereas that of the footpegs is 6.3 Hz. All magnitudes above the primary resonance tend to decrease with increasing frequencies. The phase of the seat and footpegs leads between 0.5 and 4.6 Hz, albeit up to 2 Hz, the lead is small and the phase response indicates a mass system. Above 4.6 Hz, the phase of the seat and footpegs lags with a slope of 13.7°/Hz. The phase of the handlebars is almost flat up to 4 Hz, onward the phase lags and flips at 8 Hz (i.e. lag to lead). The magnitude and phase show similar trends for almost all directions and interfaces, except for the handlebars in the longitudinal direction (X-axis) where the phase leads for all frequencies. The large phase lead of the handlebars indicates that the rider exerts forces opposed to the anterior/posterior trunk movements (i.e. provoked due to the vertical motion) to keep his trunk stable in space.
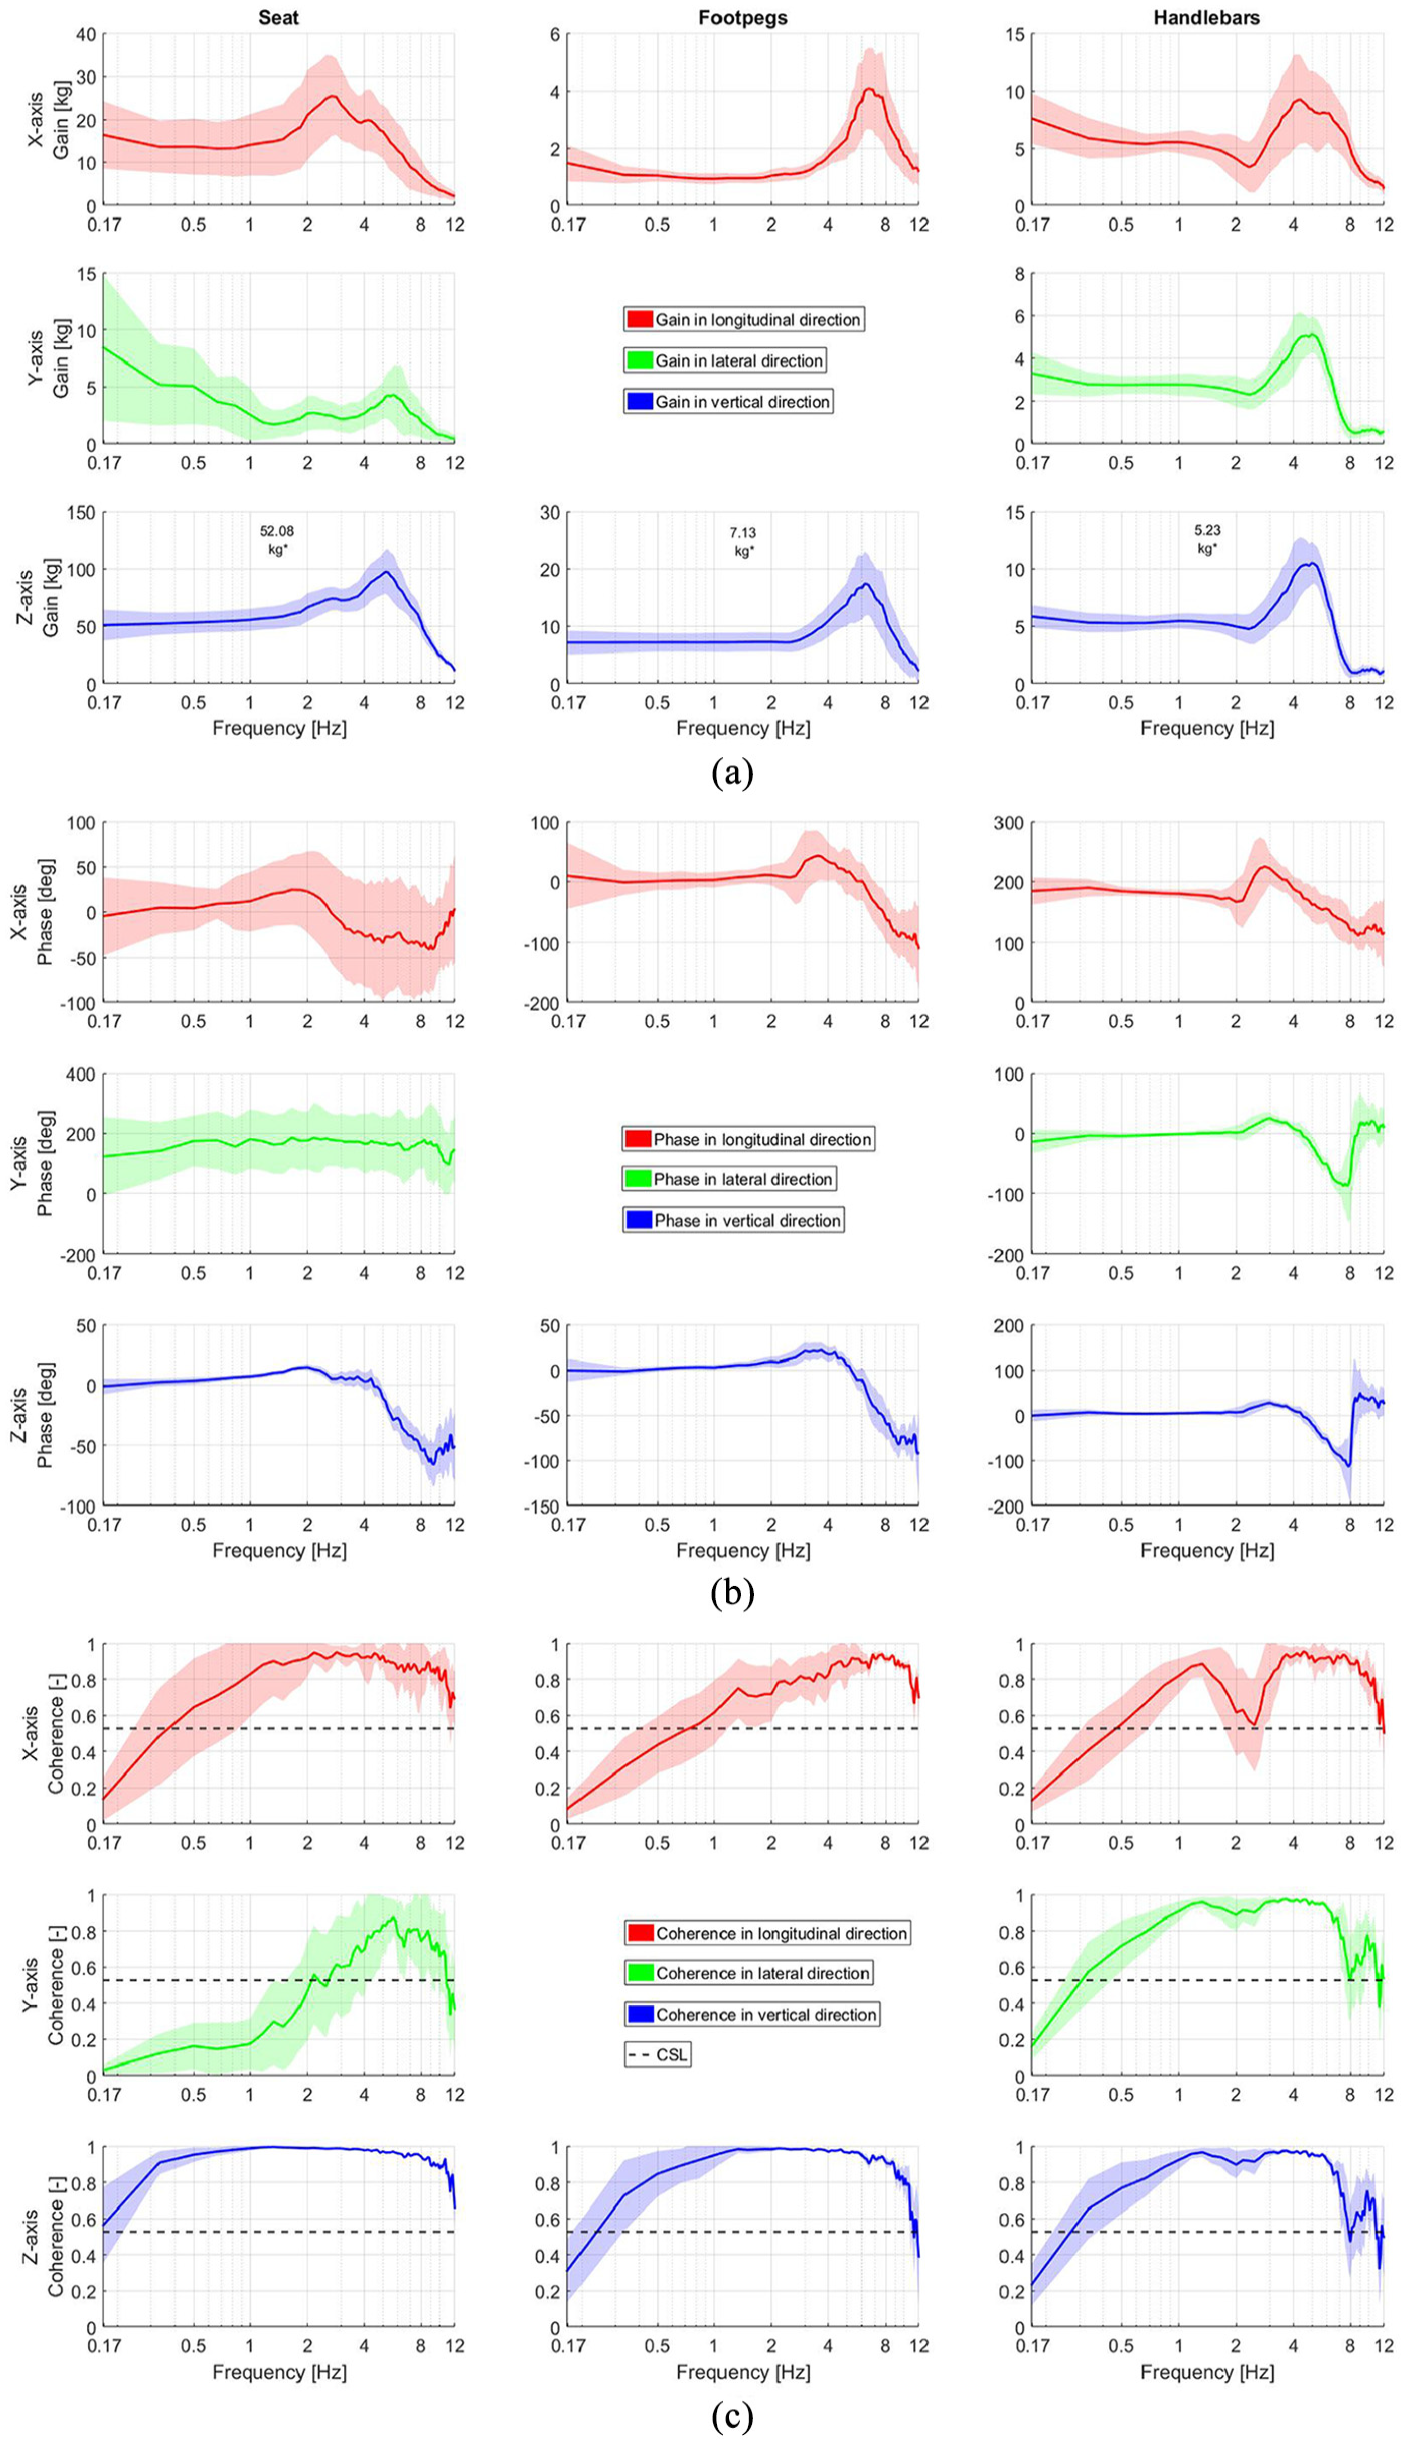
Apparent mass (APMS) for the heave (Z, vertical) motions as a function of the applied frequency (f) at the seat, footpegs, and handlebars: (a) magnitude, (b) phase, and (c) coherence, shade = standard deviation over participants.
The APMS measurements for the surge motion (X) are presented in Figure 9. For surge, most of the dynamic forces are generated in the longitudinal direction (X-axis). Coherence is significant (p < 0.05) above 0.33 Hz for all APMS measurements; thus, this frequency is used as a base to interpret the magnitude and phase responses for this motion. At this reference frequency of 0.33 Hz, the magnitude is 51.2 kg* at the seat, 3.16 kg* at the footpegs, and 24.71 kg* at the handlebars. The magnitudes of all interfaces show a resonant peak at 2 Hz, which is the same as the resonance of the STST. At the footpegs and handlebars, a second resonant peak occurs at 5 and 7 Hz, correspondingly. The sum of all measured magnitudes at the base frequency exceeds the mean rider’s weight, presumably due to phase differences in forces at seat, footpegs, and handlebars. The phase response up to 2 Hz indicates a mass system, but this does not apply for all the other frequencies. Onward, the phase of the seat and handlebars lags up to 7.3 and 10 Hz, respectively. The phase of the footpegs and handlebars flips at 2.8 and at 5.5 Hz, respectively. The phase flips are probably caused due to modulation in the control behavior of the knee and arms. The magnitude and phases show similar trends for almost all directions and interfaces, exception are the footpegs and handlebars in the vertical direction (Z-axis) where the phase leads significantly. Similar to the heave motion, the large phase lead of the footpegs and handlebars implies that the rider applies forces opposite to the anterior/posterior pelvis and trunk movements to keep his body stable in space.
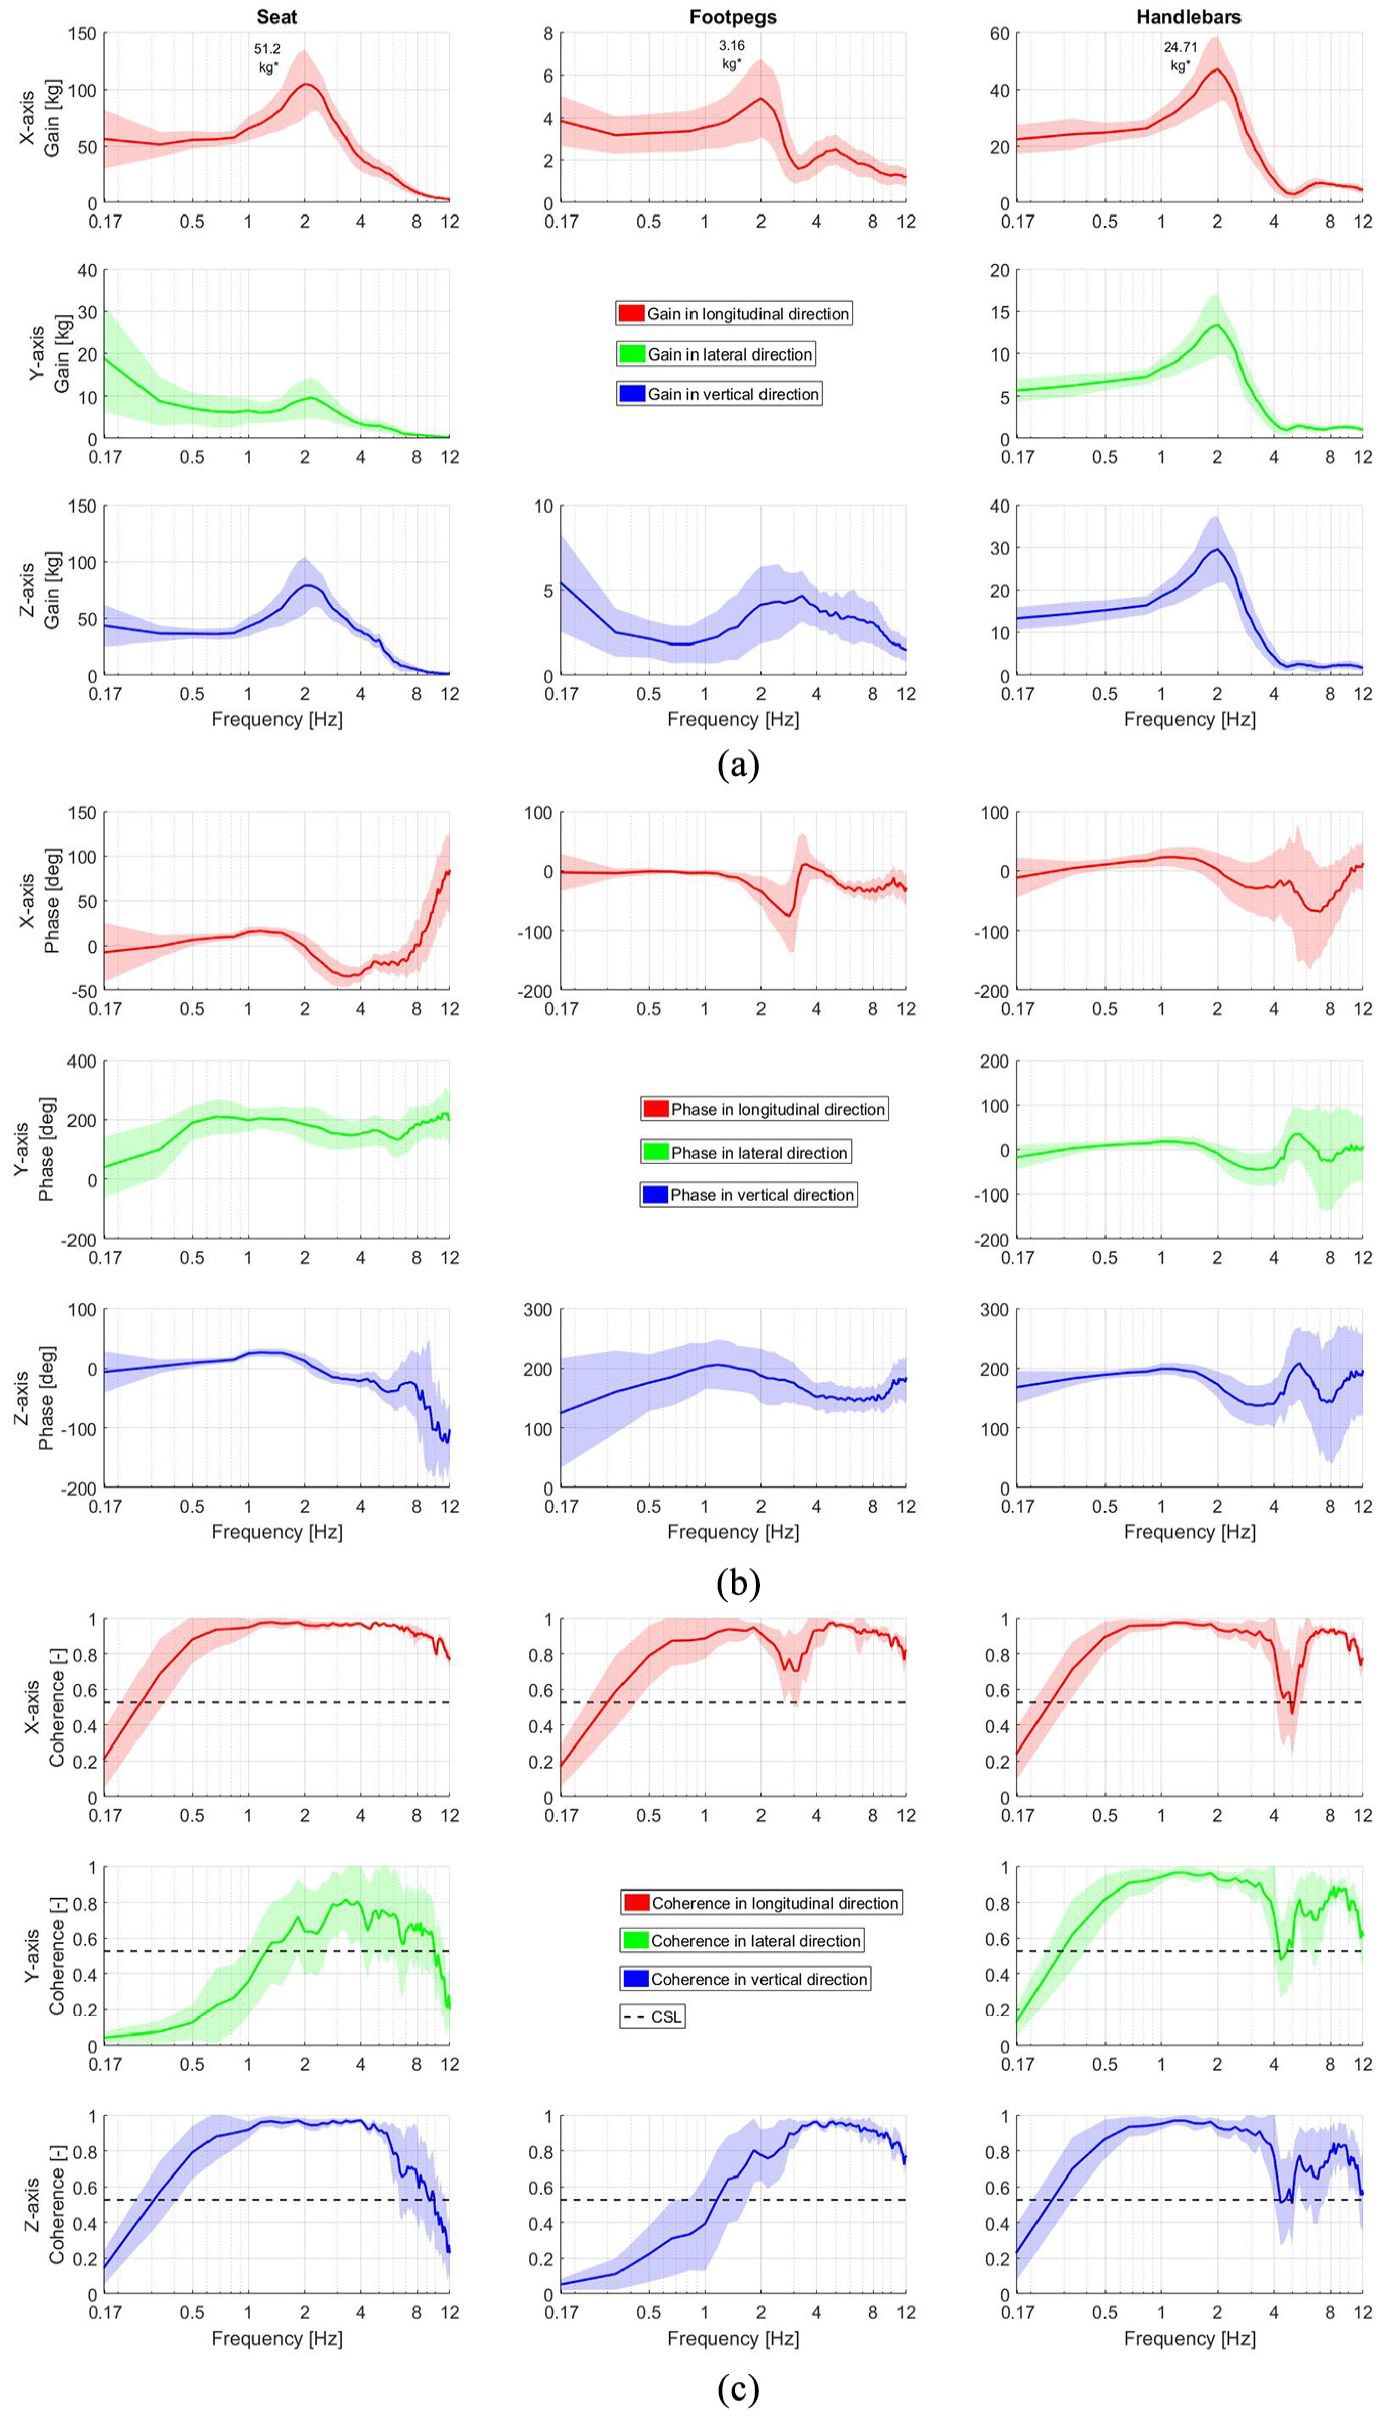
Apparent mass (APMS) for the heave (X, longitudinal) motions as a function of the applied frequency (f) at the seat, footpegs, and handlebars: (a) magnitude, (b) phase, and (c) coherence, shade = standard deviation over participants.
The APMS for the sway (Y) motion are presented in Figure 10. For sway, most of the dominant dynamics are noticed at the seat (Y-axis), footpegs (Z-axis), and handlebars (X, Z-axis). Coherence is significant above 0.5 Hz (p < 0.05) for most of the frequencies. At the base frequency of 0.5 Hz, the magnitude at the seat is 205.3 kg, whereas the magnitude of the footpegs and handlebars in the (X, Z-axis) is 8.86, 30.49, 34.86, and 30.52 kg, respectively. All magnitudes decrease as the frequency increases, and no resonance is observed for sway motion. The phase of the seat, footpegs, and handlebars leads for all frequencies. The vertical and longitudinal directions of the footpegs and handlebar show good coherence, obviously the rider uses his feet and hands to stabilize his pelvis and trunk in space.
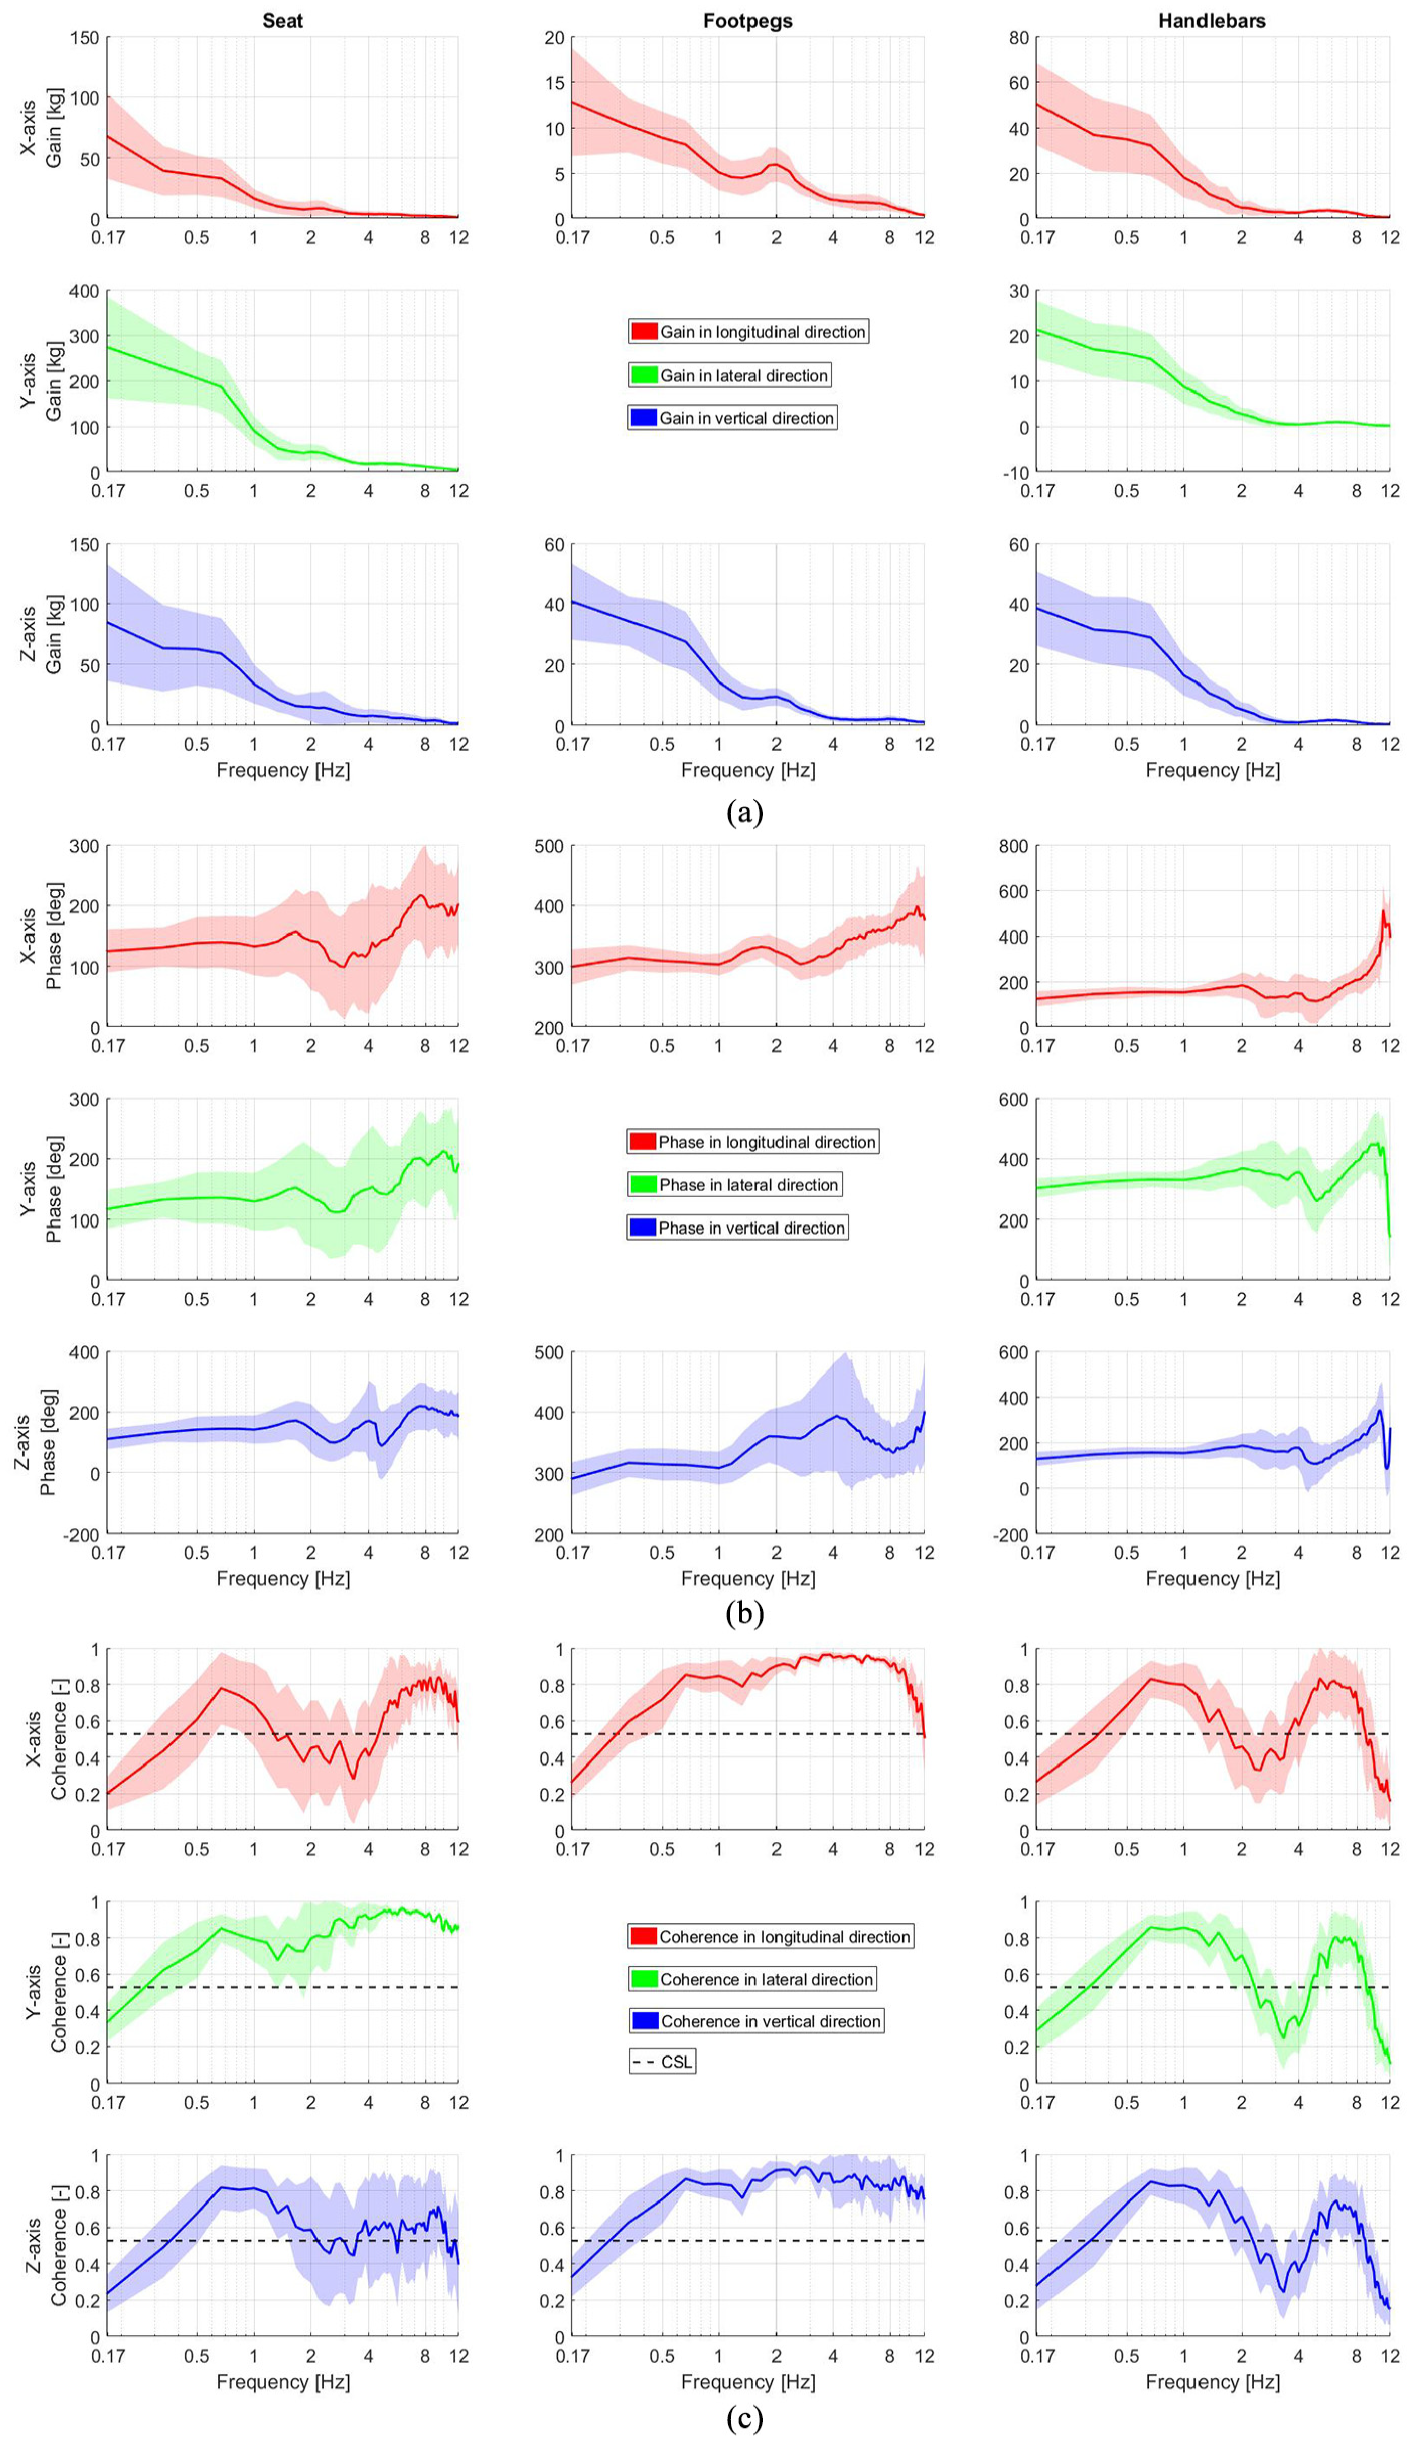
Apparent mass (APMS) for the sway (Y, lateral) motions as a function of frequency (f) at the seat, footpegs and handlebars: (a) magnitude, (b) phase, and (c) coherence, shade = standard deviation over participants.
Discussion
Here, we measured the dynamics (STST and APMS) of a bicycle rider. To the best of our knowledge, such work has not been presented before. The APMS and STST can be used to create a biomechanical rider model. The addition of a human-like model to the Carvallo–Whipple bicycle model 1 is essential to explore unstable oscillatory bicycle modes and improve bicycle safety and comfort. Bicycle comfort could be improved, for example, by designing vibration isolators for the saddle and handlebars, whereas, safety by designing steering stabilizers. The selection of the stiffness and damping properties of these isolators can be obtained by analyzing the eigenvalues and eigenmodes of the combined bicycle-rider system. Comfort, safety, and performance can now be easily evaluated by running multiple simulations for different bicycle types (e.g. city, racing). The methodology described herein is focused on the translational motions, the dynamic responses of the rider for the rotational motions might differ, even with motions that are considered similar (e.g. sway and roll).
All motions resulted in consistent transmissibility and APMS responses over the participants with a relatively high coherence. Therefore, the system identification techniques were justified indicating FRF estimates of high quality. Heave and surge motion interacted with each other and showed similar dynamics (i.e. a result of subject leaning forward). Similar forces were observed in the ZX-plane of the seat (SP), footpegs, and ZX-, ZY-plane of the handlebars (HB), see Table 2. The vertical STST and APMS of the seat and handlebars showed a resonance at 5 Hz, in agreement with the resonance reported by Mansfield and Griffin 29 and Toward and Griffin.6,7 The longitudinal STST and APMS had a resonance at 2 Hz, which is close to the resonance of 2.5 and 2.62 Hz found for male seated subjects without backrest by Fairley and Griffin 3 and Mansfield and Lundström, 4 respectively. The small resonant frequency variations could be attributed to different body masses and postures. For instance, higher body mass can lead to higher magnitudes and lower resonance. 5 , 6 Holding a steering wheel could lead to lower resonance in respect with hands-in-lap posture as suggested by Wang et al., 8 Rakheja et al., 5 and Toward and Griffin. 6 Sway was independent from the other two motions, the lateral STST and APMS showed similar trends: no resonance was observed and postural control was evident in both measurements.
For heave and surge, the rider’s body acted as a rigid mass up to 2 Hz. For sway, the rider’s body behaved like a horizontal mass spring-damper system (pelvis) with a torsional spring inverted pendulum (trunk) on top (see Supplementary Material, Schematic 1) for all frequencies. The high magnitude APMS (>200 kg) for sway motion were perhaps a result of the angular
As proposed by Van Drunen et al., 31 kinematic FRFs could also be interpreted as trunk-in-space (perfectly stationary orientation in space: magnitude of 0 and phase of ±180°) and trunk-on-seat (perfectly moving in line with the seat: magnitude of 1 and phase of 0°). For heave up to 2 Hz and for surge up 1 Hz, the STST magnitude is 1 and the phase is almost 0 indicating a trunk-on-seat moving behavior, see Figure 7 (Z, vertical) and (X, longitudinal). For sway above 1 Hz, the STST magnitude <1 and the phase lags up to 8 Hz indicating that the rider tries to keep his trunk-in-space, see Figure 7 (Y, lateral). The sway APMS magnitude drops further above 1 Hz, see Figure 10 (Y, lateral). This can be explained by the limited STST, whereby the torso does not fully follow the saddle motion, reducing the required forces. The low frequency sway behavior is more complex and may be studied further using models of postural control, capturing how rider’s use propioceptive, vestibular, and visual feedback to generate the required roll moments to stabilize the upper body.
Conclusion
For all translational motions, the bicycle rider applied forces in all three-dimensional directions. Heave and surge motion interacted with each other, sway showed weak interaction with heave and surge. The vertical and longitudinal APMS for almost all bicycle interfaces followed the resonance of the STST measurements. All showed a twice as high magnitude at resonance, albeit a more heavily damped system was apparent in the STST measurements. Resonant frequencies were considerably higher in the vertical direction as compared to the longitudinal direction. Lateral measurements showed no resonance, and trunk postural control was evident in the APMS measurements. For most frequencies and perturbation directions, the response of the rider’s body was not close to a rigid mass; hence, a parametric model is required to understand better the passive dynamic contribution of the rider to the bicycle-rider system.
Footnotes
Appendix 1
Acknowledgements
We would like to thank the following BSc students for their contributions: Tony Prats for his contribution in the design and building of the bicycle mock-up, and Max Greidanus, Robert Rooijmans, Koen Verbruggen, Peter Visser, Marnix van Beem, Frank van Beurden, Christian Drost, Robert Krijnen, and Luc Int Zandt for their preliminary trials using multi-sine perturbations.
Declaration of conflicting interests
The author(s) declared no potential conflicts of interest with respect to the research, authorship, and/or publication of this article.
Funding
The author(s) disclosed receipt of the following financial support for the research, authorship, and/or publication of this article: We gratefully acknowledge the European Commission for their support and the Marie Curie Initial Training Network (ITN) project Nr. 608092 “MOTORIST” (Motorcycle Rider Integrated Safety). Website ![]() (last accessed 31 January 2018).
(last accessed 31 January 2018).