
Abstract
Engine downsizing is desired for modern heavy-duty vehicles to enhance fuel economy and reduce emissions. However, the smaller engines usually cannot overcome the parasitic loads during engine start-up. A new clutch system is designed to disconnect the downsized engine from the parasitic losses prior to the idling speed. A multi-scale, multi-physics model is developed to study the clutch system. Multi-body dynamics is used to study the combined translational–rotational motions of the clutch components. A micro-scale contact model is incorporated to represent the frictional characteristics of the sliding surfaces. Although the clutch is designed for dry contact operation, leakage of actuating hydraulic fluid can affect the interfacial frictional characteristics. These are integrated into the multi-body dynamic analysis through tribometric studies of partially wetted surfaces using fresh and shear-degraded lubricants. Multi-scale simulations include sensitivity analysis of key operating parameters, such as contact pressure. This multi-physics approach is not hitherto reported in the literature. The study shows the importance of adhesion in dry clutch engagement, enabling full torque capacity. The same is also noted for any leakage of significantly shear-degraded lubricant into the clutch interfaces. However, the ingression of fresh lubricant into the contact is found to reduce the clutch torque capacity.
Keywords
Introduction
In recent years, the off-highway vehicle industry has strived to improve fuel economy of its vehicles through engine-downsizing. However, the downsized off-highway engines must overcome the parasitic losses during start-up, particularly due to hydraulic loading. To avoid engine shutdown before idling, the parasitic loads may be disconnected from the engine at the start-up through a clutch mechanism. These loads are then reapplied after the engine has reached its critical speed and load. Thus, the clutch mechanism plays a key role in engine downsizing and vehicle performance. A more thorough analysis of the clutch relies heavily on a combined study of its dynamics and tribology (i.e. Tribodynamics).
Dynamic models for clutch systems can be as simple as a pair of friction discs and pressure plates. 1 These plates come into contact through actuation loading. The transmitted torque in the clutch is determined by assuming either a uniformly applied pressure or uniform wear rate between the contacting surfaces.2,3 The uniform pressure condition is widely applied to the clutch plates with preloaded retraction springs. Dynamic models using multi-body approach with application of clamped load have been used for clutch engagement and study of take-up judder.4–8 The complexity of clutch models can increase with the level of required accuracy from the predictive analysis. For example, a detailed dynamic model is essential for the traction control of a dual clutch transmission9–12 and the study of clutch in driveline vibrations.4,5,13–18 In these scenarios, inertias of other components such as the gearbox, shafts, differential, tyres and vehicle body should also be considered. Clutch dynamic models are also utilised to study other phenomena such as hot spotting, heat transfer and wear. Sfarni et al. 19 investigated the effect of wear on the cushion spring characteristics in dry clutch systems using finite element analysis (FEA). Repeated loading of clutch causes an extreme temperature rise in the contact. This behaviour varies with contact sliding velocity and frictional torque. Pisaturo et al. 20 investigated the thermal behaviour of dry clutches by coupling clutch dynamics with FEA to predict the temperature field of the contacting surfaces. Hot spotting originates from an abrupt increase in the flash temperature at certain areas of the contact, usually caused by uneven loading of the real rough contact or through thermal distortion of the clutch plates. 21 Anderson and Knapp 22 studied this phenomenon in automotive clutches. They categorised hot spotting patterns using three parameters: contact width, temperature and duration of actuation. They showed that asperity flash temperatures are almost independent of contact pressure. Zagrodzki and Trucone 23 investigated this phenomenon in wet clutches during short-term clutch engagement with a varying sliding velocity.
Frictional properties of the mating surfaces play a key role in the dynamic behaviour of clutch systems. For instance, clutch judder is initiated due to the negative gradient of coefficient of friction variation with interfacial slip speed.4,5,13,14,17,21 The frictional behaviour of clutch material varies with contact pressure, sliding velocity and temperature, as well as regime of lubrication (in wet clutches), thermo-mechanical properties of friction materials and the geometry and topography of surfaces.5–7,13,24,25 The sensitivity of coefficient of friction with sliding acceleration has been investigated in Senatore and colleagues.26–28
The physical properties of the lubricant in wet clutches can significantly influence friction and wear. Furthermore, the variation of lubricant viscosity with pressure, shear rate and temperature has a key role in determining the actual frictional behaviour of a wet clutch system. 24 Natsumeda and Miyoshi 29 utilised the Patir and Cheng’s 30 average flow model to study partial hydrodynamic lubrication of paper-based wet clutch facings. The method included modification of Reynolds equation to include the effect of surface roughness. Their model took into account variations of lubricant viscosity combined with a heat conduction model. This method is applicable to an assumed Gaussian distribution of asperity heights. 31 Clutch friction linings can follow a large-scale surface roughness, which deviates from a Gaussian distribution. The wet clutch facings can undergo mixed or boundary regimes of lubrication, particularly at low sliding velocities (e.g. in limit-slip clutches and/or at high normal loads). This type of lubrication is difficult to model due to the strong effect of lubricant additive package and their activation energies to adsorb or bond to the solid contacting surfaces. The activation energy depends on applied pressure, shear rate and temperature.32,33
Experimental measurements are essential for clutches which operate in the boundary regime of lubrication for long periods of time. Standard methods are established, such as the American Standard Test Method (ASTM) for measurement of friction lining characteristics.34,35 The Society of Automotive Engineers (SAE) has also proposed experimental equipment and measurement methods for wet clutches.36,37 Pin-on-disc tribometry is widely used for this purpose, where the effect of larger geometrical features (such as grooves) and bulk flash temperature variations are usually neglected.6,22,28,32,38–40 Others have included the effect of bulk flash temperature of the solid contacting bodies for dry automotive clutches. 41 The reliability of pin-on-disc tribometry has been validated using the results from the SAE-proposed methods.42,43
This study focuses on the tribodynamic analysis of a new clutch mechanism, which is proposed to disconnect the hydraulic parasitic loads during the engine start-up. This new system allows for engine downsizing in small- and medium-sized loaders. The conjunction of paper-based friction material and the counter face steel plate should ideally remain dry. However, since the clutch is actuated using the engine oil, there is usually small leakage through the seals and into the contact domain. This can potentially result in clutch faces being smeared with lubricating oil which is absorbed by the porous friction material surface which can then become saturated. Therefore, the clutch is expected to operate under boundary or mixed regimes of lubrication. The frictional properties of the paper lining-to-steel surface conjunction are studied under three contact conditions: dry, wetted with fresh oil, and wetted with shear-degraded oil. An in-house pin-on-disc tribometer is used to measure the interfacial frictional characteristics at various contact pressures and sliding velocities, representative of clutch operating conditions. Surface topography measurements are carried out for the steel counter face before and after each test to monitor its flatness and account for any wear. The surface properties of a new friction material are measured and utilised to predict the contact loads between the clutch faces. Friction maps for all contact condition are presented. Furthermore, the influence of contact condition on the transmitted torque and clutch performance is explored. The sensitivity of clutch operation to design parameters is also analysed. The combined study of these aspects in a tribodynamic clutch model has not hitherto been reported in the literature. The study includes the following:
A macro-scale clutch multi-body dynamic model, actuated through engine oil pressure (section ‘Multibody dynamics of the proposed clutch system’);
Experimentally measured interfacial frictional characteristics (section ‘Experimental measurements’).
Prediction of contact loads during the mutual convergence of clutch plates using a micro-scale asperity contact model (sections ‘Contact of rough surfaces’ and ‘Analysis of clutch performance’).
The effect of lubricant leakage and accumulated soot upon clutch torque transmissibility (section ‘Analysis of clutch performance’).
Overview of the methodology
The tribodynamic analysis of the clutch system requires a multi-physics multi-scale approach. The analysis comprises development of a system-level multi-body dynamic model and the characterisation of friction torque at the micro-scale interactions of clutch interfacial contacts. It also includes engine input and in situ operational conditions. The multi-scale relationship between these aspects of analyses is shown schematically in Figure 1.
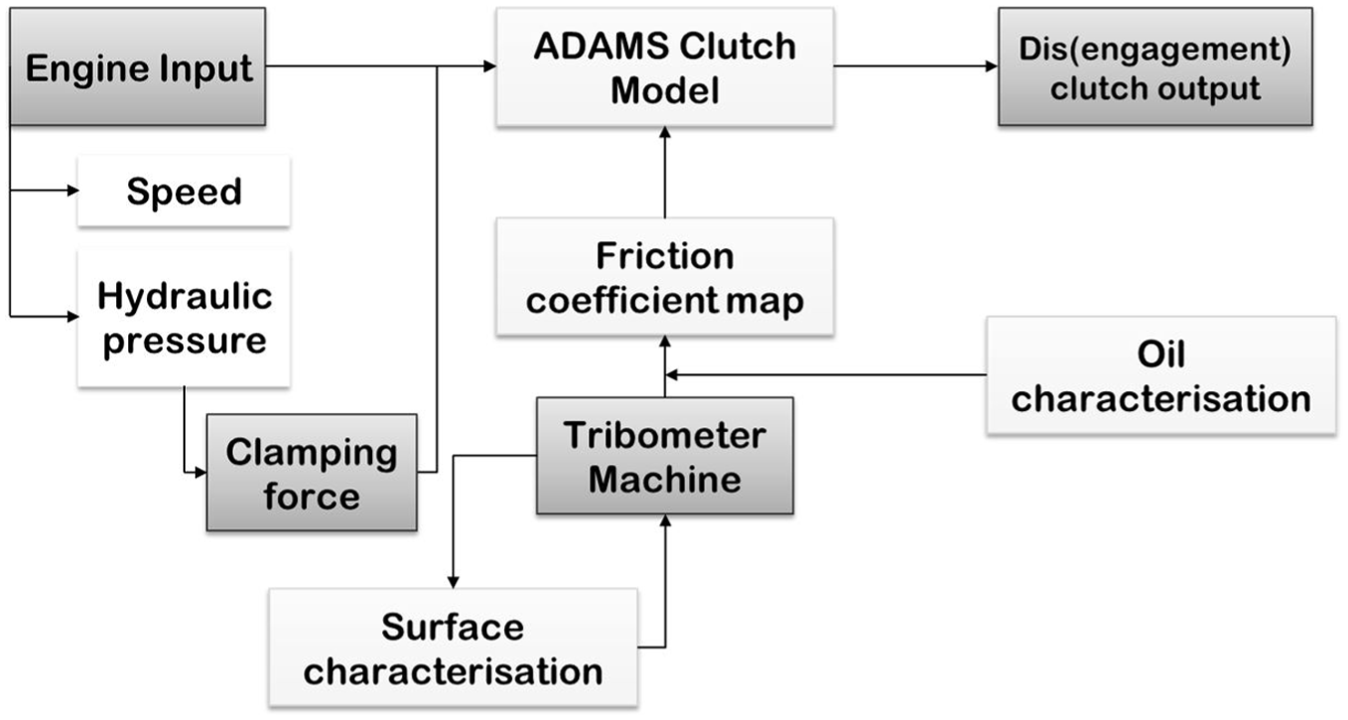
Schematic representation of the multi-scale analysis.
Clutch actuation depends on the engine oil pressure (thus, the applied clamp load) and the crankshaft speed. The engine input is equilibrated by the resistive torque at the clutch output. These parameters are measured and provided by the clutch manufacturer in the form of graphs and tables. The clutch clamp load is calculated using the engine hydraulic pressure and the interfacial surface properties. The transmitted torque relies on the frictional characteristics of the clutch system’s interfacial surfaces. These are mapped for different clamp loads and sliding velocities using pin-on-disc tribometry. Therefore, the characterisation of surface topography and lubricant rheology is essential.
The multi-body dynamic model is developed in the MSC ADAMS environment. The engine data and friction maps are fed into the multi-body dynamic model using appropriately developed subroutines. The clutch performance is evaluated for different operating scenarios.
Multibody dynamics of the proposed clutch system
Clutch engagement should be made in the shortest possible duration under all conditions. The clutch components are divided into the driving and driven parts. Figure 2 shows the corresponding multi-body dynamic model and the schematics of the clutch components (flywheel, pressure piston, pressure plate, separator plate and the end plate). The friction discs, hub and the coupler are driven through friction torque. The mass and inertia of the connectors, such as springs and bolts, are neglected.
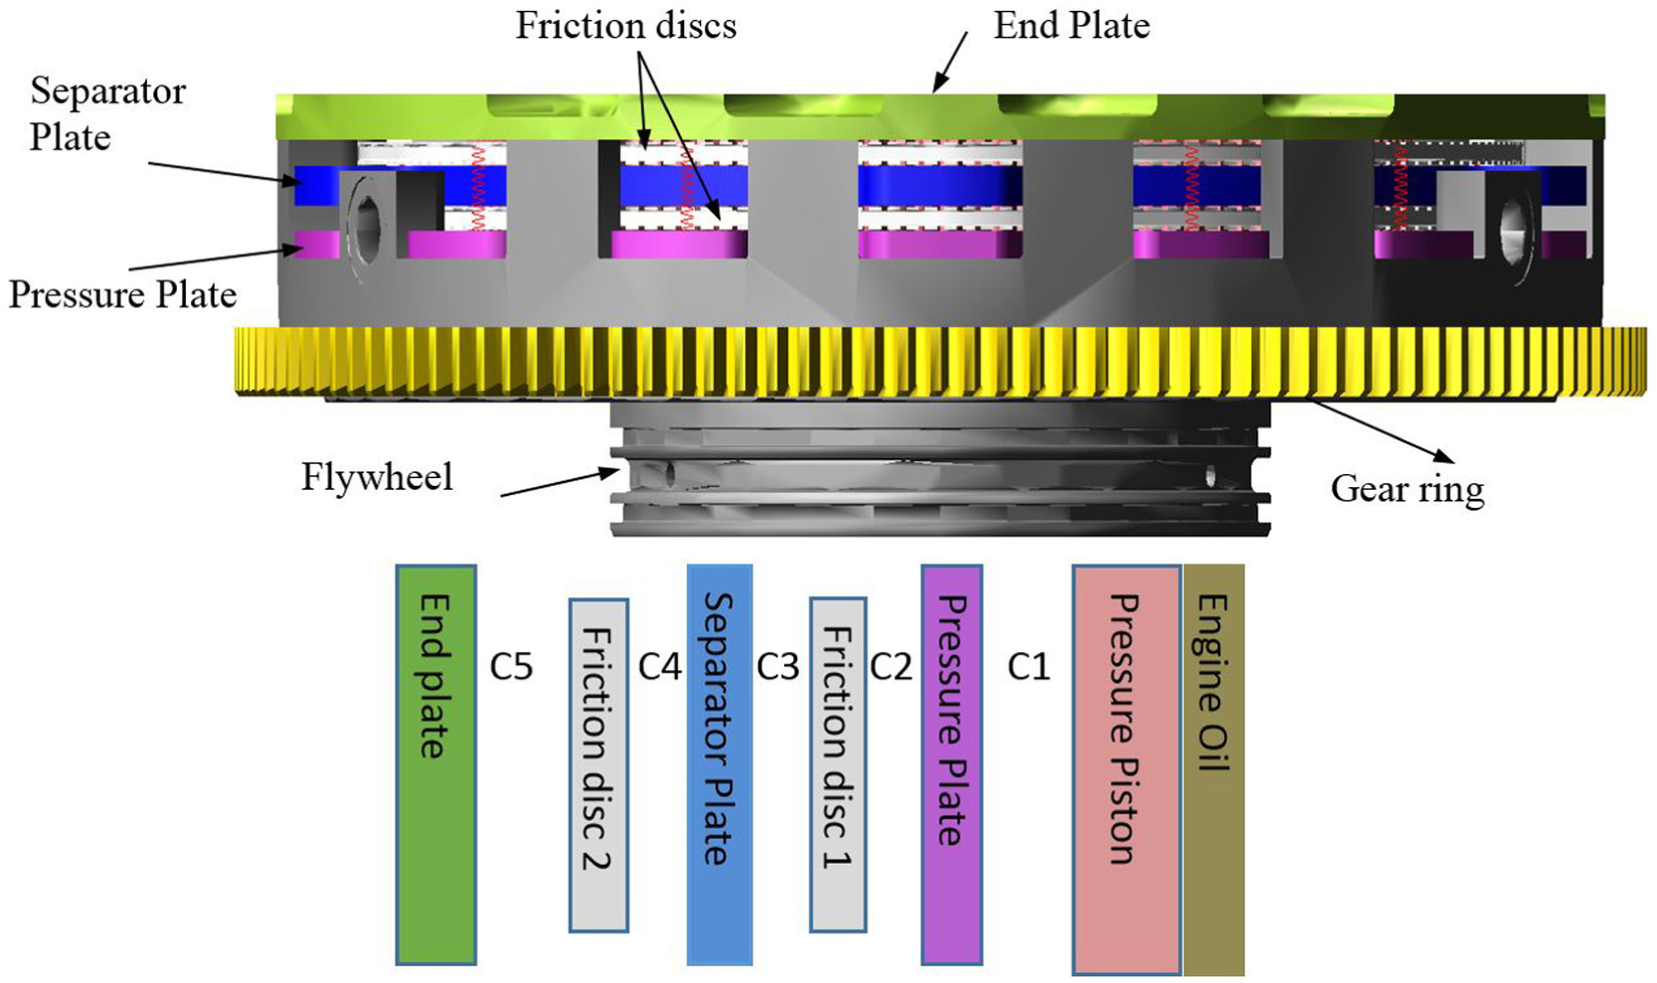
The multi-body model of the clutch (top) and clutch components (bottom).
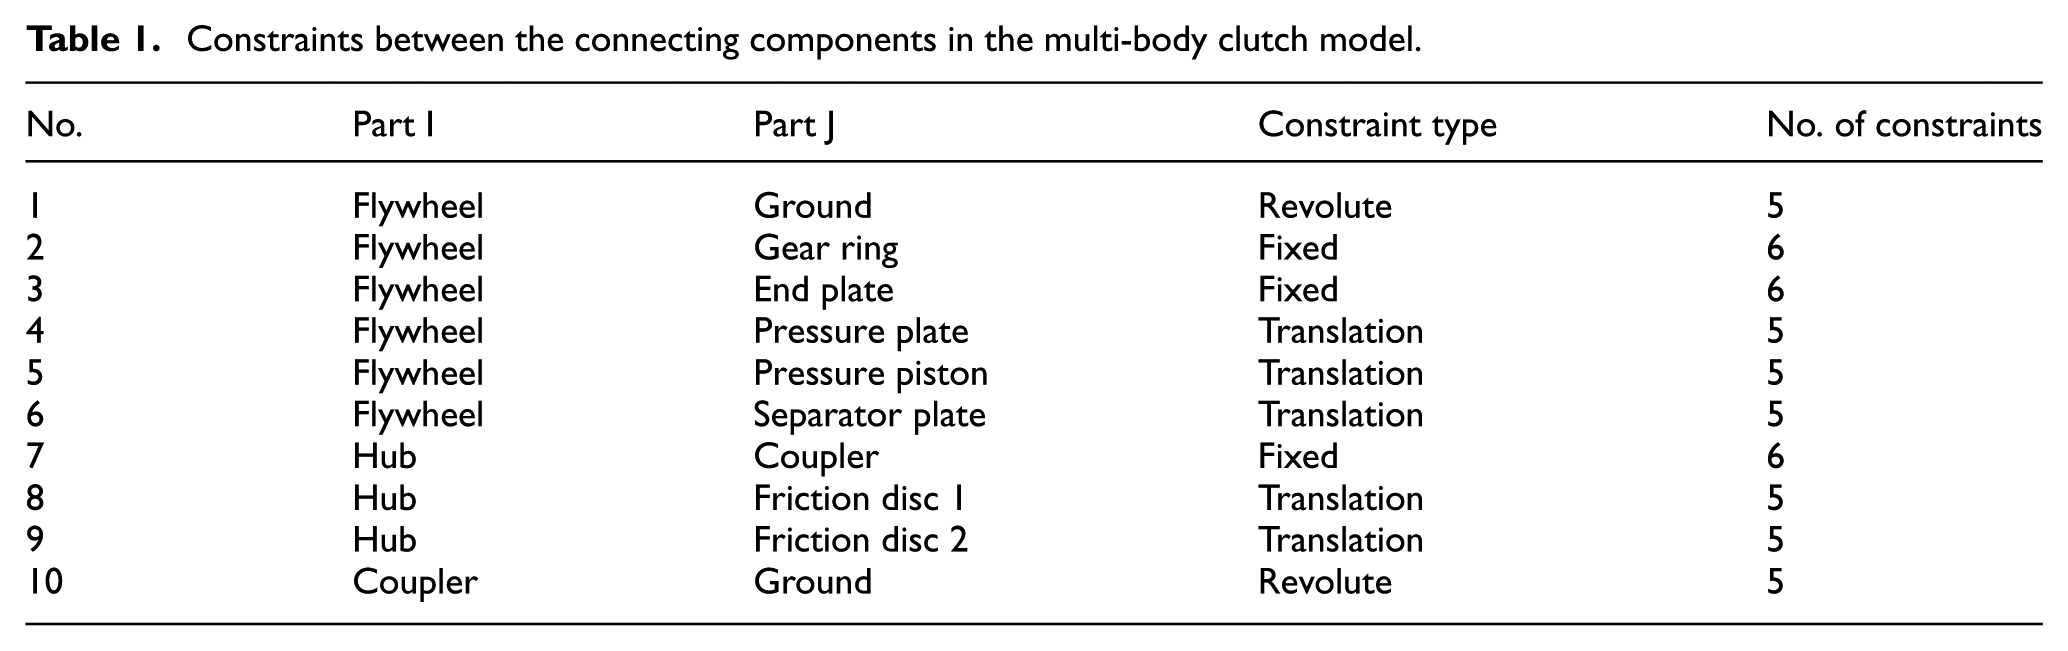
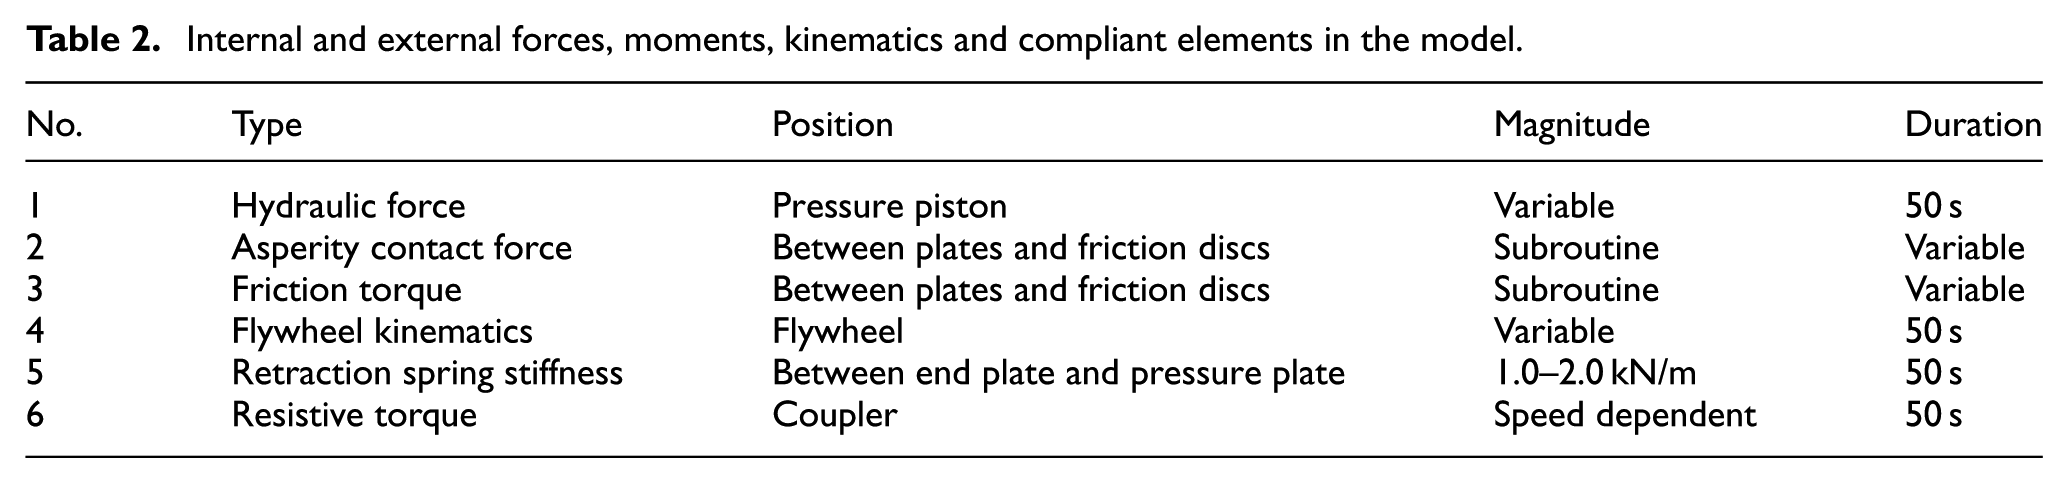
The friction discs and hub are rigidly connected through a set of splines and couplers, fixed to the hub. Thus, the rotational velocity for all the driven components remains the same. C1 to C5 represent the clearances. The pressure and end-plates are connected through retraction springs with the end-plate fixed to the flywheel. The engine oil acts as the medium of actuation through hydraulic action. The clutch components undergo translational motion as the engine oil pressure rises, leading to the fully clamped state. During the clamping action (clutch engagement), the contact pressure increases and the friction discs are synchronised with the velocity of the plates due to generated interfacial friction. The engine oil discharges during the shutdown and the retraction springs remove the load from the contacting surfaces. The parasitic load on the output shaft forces the friction discs to cease sliding. The clutch components are constrained using idealised holonomic constraint functions (see Table 1). The applied internal and external forces are described in Table 2 and detailed later.
Constraints between the connecting components in the multi-body clutch model.
Internal and external forces, moments, kinematics and compliant elements in the model.
The multi-body dynamics approach leads to a set of differential-algebraic equations (DAE) system using Lagrangian dynamics for constrained systems in the generalised Eulerian frame of reference:
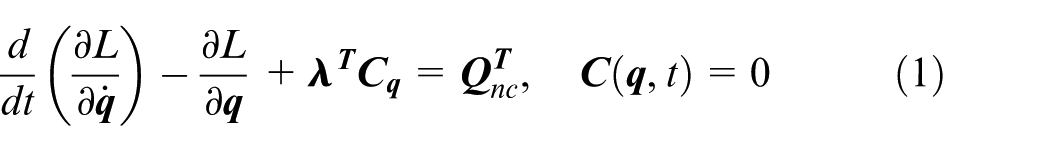
where


Equation (1a) imposes the orientation of the translational joint and equation (1b) constrains the rotation of the position vector of point

where the Jacobian matrix is a sparse matrix of the form 44
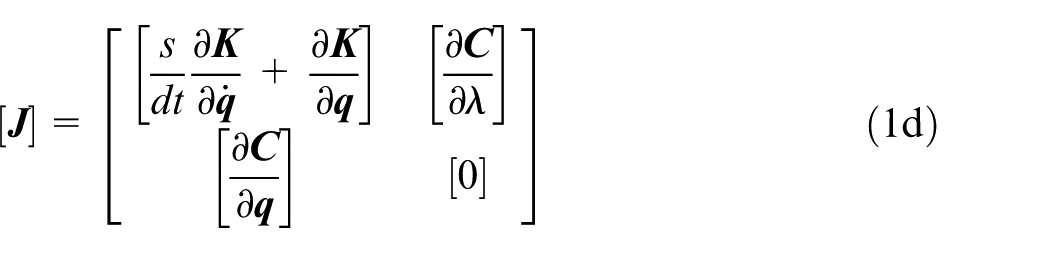
where
Tribology of clutch contact
Contact of rough surfaces
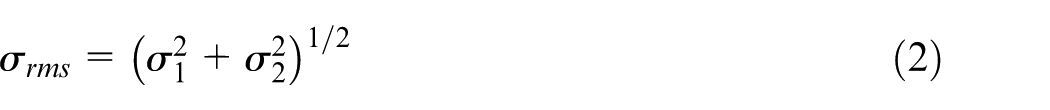
Real surfaces are rough, and the extent of interaction of their asperities determines the regime of lubrication. The composite root mean square (RMS) roughness of the counter face surfaces is obtained as follows 45
The Stribeck lubricant film ratio,
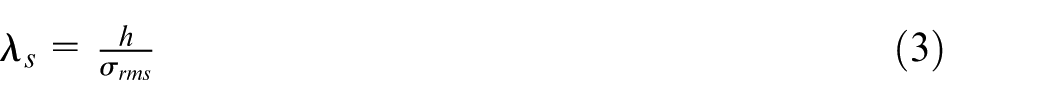
Boundary or mixed regimes of lubrication are assumed to occur, when
Surface topographical measurements is carried out using white light interferometry with the vertical resolution of 10 nm and lateral resolution (along the surface of friction discs and clutch plates) of 0.174 µm. This has shown that asperity height distribution for these surfaces do not follow a Gaussian distribution. The asperity distribution, however, can be approximated instead by an exponential function as the studied clutch surfaces have a kurtosis,

where the parameters
In addition,

where
Frictional torque
The sprung clutch discs generate uniform pressure, necessary to attain the maximum transmitted torque. The friction torque for clutches with uniform pressure distribution is given as follows

where
where
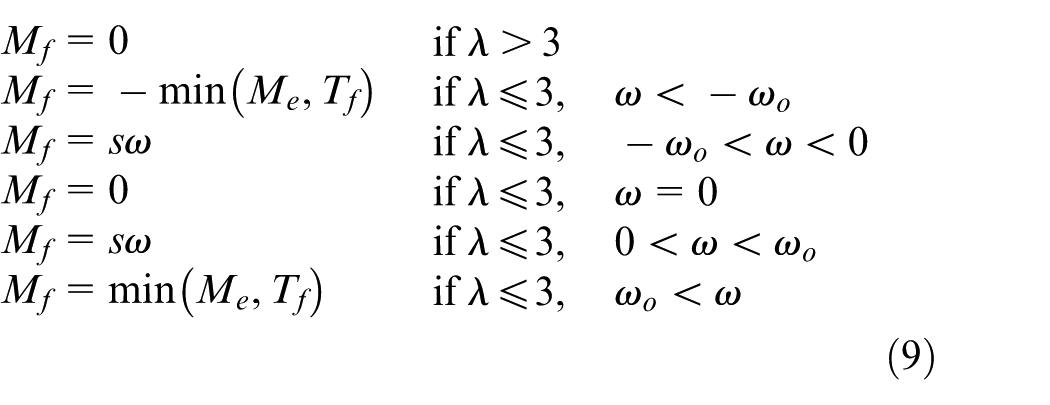
The friction torque is normally defined as a step function depending on the angular velocity. The Karnopp friction model is employed to overcome the integration error due to this abrupt transition.
13
Karnopp
47
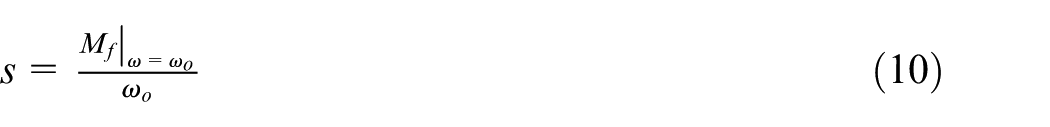
defined a slope parameter (s), which corresponds to this transition region and is restricted to a low angular velocity
and the slope
Clutch data
The clutch data comprise the flywheel angular velocity and the hydraulic oil pressure at the pressure piston (Figure 2). The relevant data are measured and provided by the clutch manufacturer (Figure 3). As the oil pressure is supplied through the engine oil gallery, the clutch performance relies heavily on the engine speed. Thus, the engine start-up and shut-down processes are quite important. In a clutch actuation cycle, the engine speed ramps up from stationary to its idling angular velocity of 870 r/min. The engine continues idling until the oil pressure is adequately built up. Thereafter, the engine shuts down and the oil pressure reduces until the clutch output ceases. The pressure profile in Figure 3 represents the absolute pressure behind the piston area. Thus, the gauge pressure is the real activation pressure in the clutch.
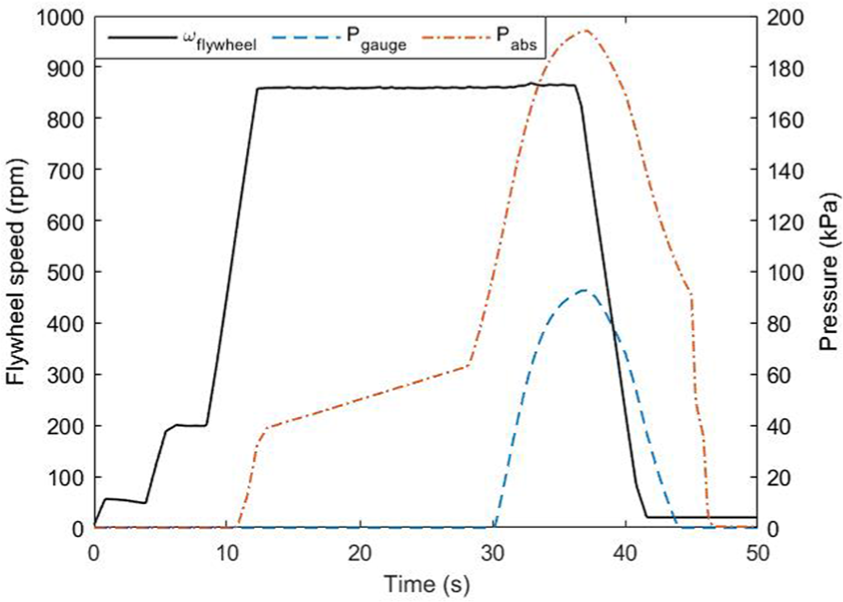
Absolute and gauge pressures behind the pressure piston in comparison with the flywheel (engine) speed.
The inertial components at the clutch output are resisted by the parasitic loads as shown in Figure 4. These data are provided by the clutch manufacturer at certain rotational speeds. A cubic spline function is used to interpolate the data points for the continuity of simulation studies. To determine a suitable integration time step of analysis, simulations are carried out for very fine, fine and coarse time steps. The former two (20 and 100 µs) have shown consistent results, while the coarser time step led to numerical instabilities due to a loss of time history.
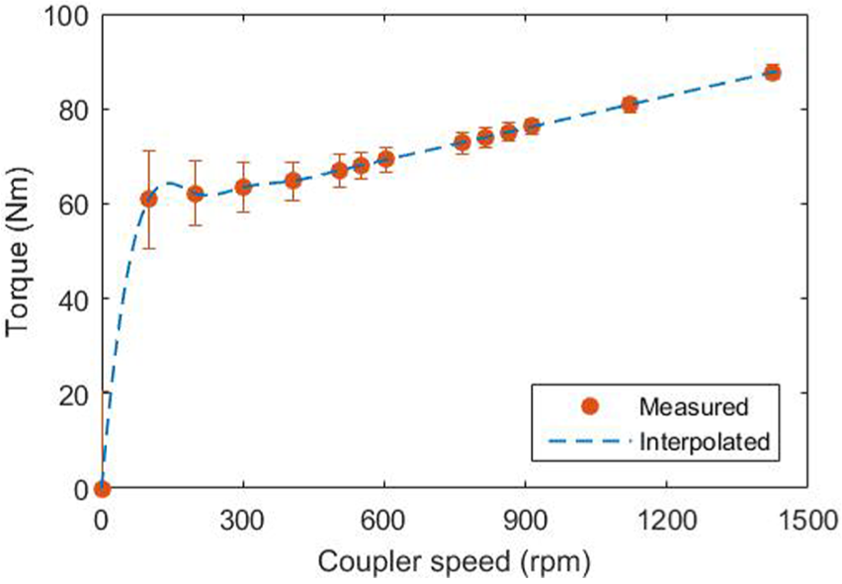
Resistive torque (measured and interpolated) at the clutch output (coupler).
Experimental measurements
The clutch interfacial frictional characteristics in boundary regime of lubrication can be influenced by various parameters from macro-scale to nano-scale. These include the nature of contact between the tip of asperities in the presence of a lubricant, and the concentration of the additive package and the associated complex physio-chemical processes in the formation of a tribo-film. In the absence of a comprehensive model for describing friction in the boundary regime of lubrication, experimental measurements are necessary to map the frictional characteristics of different lubricant–surface combinations. The most inexpensive and time-efficient method is through the use of pin-on-disc tribometry. 6 However, the conditions, such as contact pressure, sliding speed, temperature and topography, in the pin-on-disc experiment should replicate the actual operating clutch contact conditions.
Interfacial clutch frictional characteristics
Experiments with pin-on-disc tribometers must comply with the operating conditions of the real clutch. The maximum sliding velocity in clutch can occur during engine idling at approximately 870 r/min, which corresponds to the relative interfacial slip speed of 14 m/s. Torque transfer is possible through application of pressure (clamp loading), which in the examined mechanism is provided through hydraulic pressure supplied from the engine gallery directly onto the pressure piston. The gallery pressure rises to 575 kPa as the maximum attainable. The pressure losses in the pipes between the engine gallery and pressure piston are neglected in calculating the required contact pressure for the experiments on the pin-on-disc apparatus.
Friction discs are made of a substrate steel plate with hardened internal spline teeth, covered with a paper-based friction material with a waffle groove pattern (Figure 5). Friction materials are graded using their heat absorption capacity. The high-energy friction material can resist high levels of friction generated heat. The pressure, separator and end-plates (counterpart plates to the friction discs) are made of steel with a specified surface roughness advised by the manufacturer. These plates are ground to the maximum RMS surface roughness,
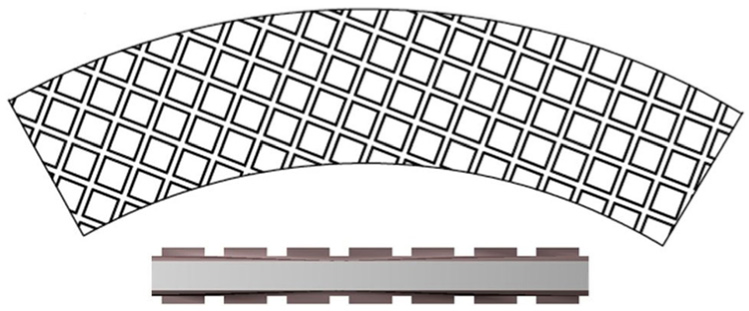
Schematic representation of paper-based friction disc with waffle pattern (spline teeth are not shown).
Characterisation of engine lubricant
The pressure piston is sealed to prevent any oil leakage onto the clutch housing. Thus, it is unlikely that the clutch contact undergoes full film hydrodynamic regime of lubrication. A small lubricant leakage, however, can occur due to the manufacturing and assembly tolerances, wear and structural compliance under applied dynamic loads. This leaked lubricant is expected to be absorbed by the porous friction lining material. The trapped oil in the material can form micro-bearings in the vicinity of any pores, leading to local mixed regime of lubrication. Lubricant rheology can provide important information regarding frictional properties under such conditions.
In addition to a fresh SAE 15W40 engine lubricant, variously shear-degraded samples from a six-cylinder Caterpillar engines are also used. The lubricant samples are characterised by their age in terms of working hours (i.e. 353 and 500 h). The rheological properties of shear-degraded lubricants are different from the fresh sample due to accumulation of soot and other forms of contamination. For all three oil samples, the viscosity was measured at three temperatures (18°C, 36°C and 67°C) using a Viscolite 700 portable viscometer. The oil temperature was raised in a bath of water until thermal equilibrium was reached for each reading. Results were repeatable within 1% standard deviation. The Vogel equation is used to describe the viscosity variations of the various lubricant samples with temperature 45 as

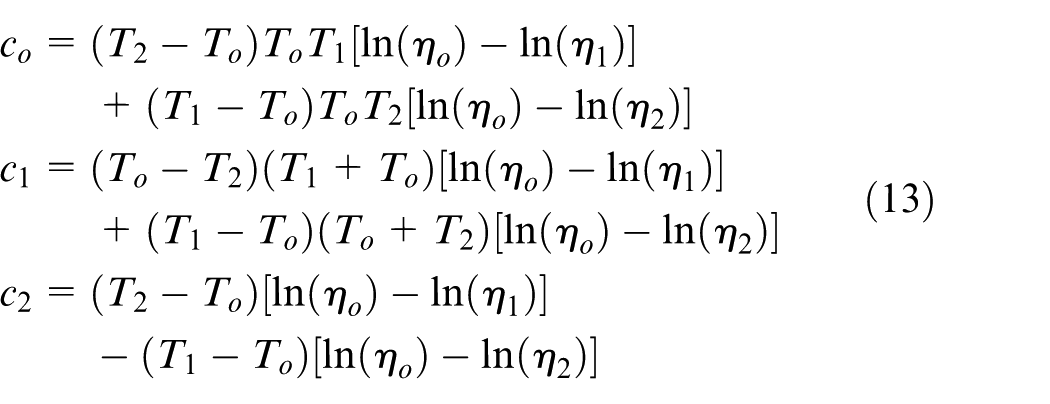
This model is accurate for interpolated and reasonably extrapolated temperatures. The constants
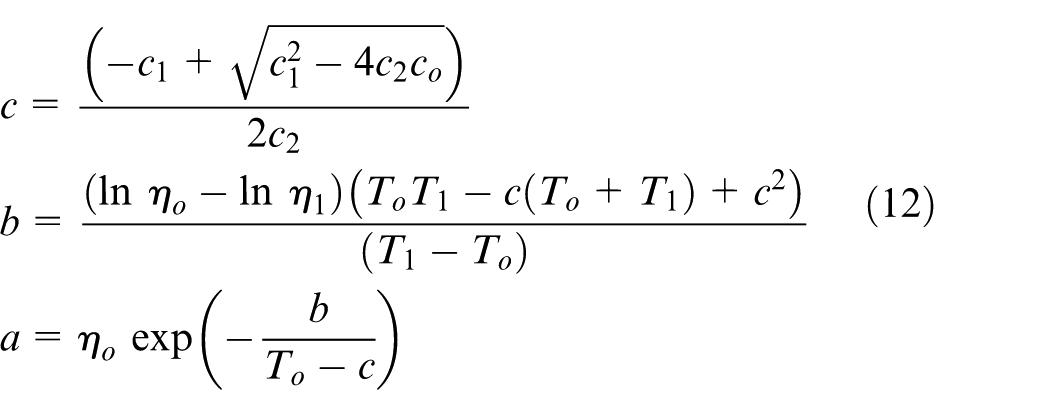
in which
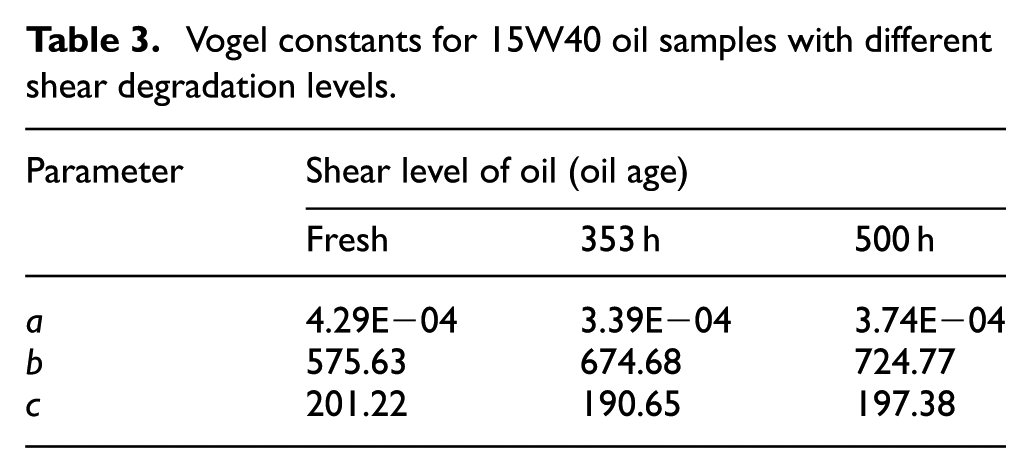
The obtained values for these constants are presented in Table 3 for all the three lubricant samples.
Vogel constants for 15W40 oil samples with different shear degradation levels.
The Vogel estimations and the measured viscosities are presented in Figure 6. The viscosity variations are very similar for the fresh and 353 h shear-degraded oils. However, the 500-h shear-degraded oil shows significant differences at lower temperatures due to high levels of soot contamination. A fresh oil sample and a highly shear-degraded one would suffice for the purpose of this study. Thus, the SAE 15W40 fresh and 500 h shear-degraded oil samples are used.
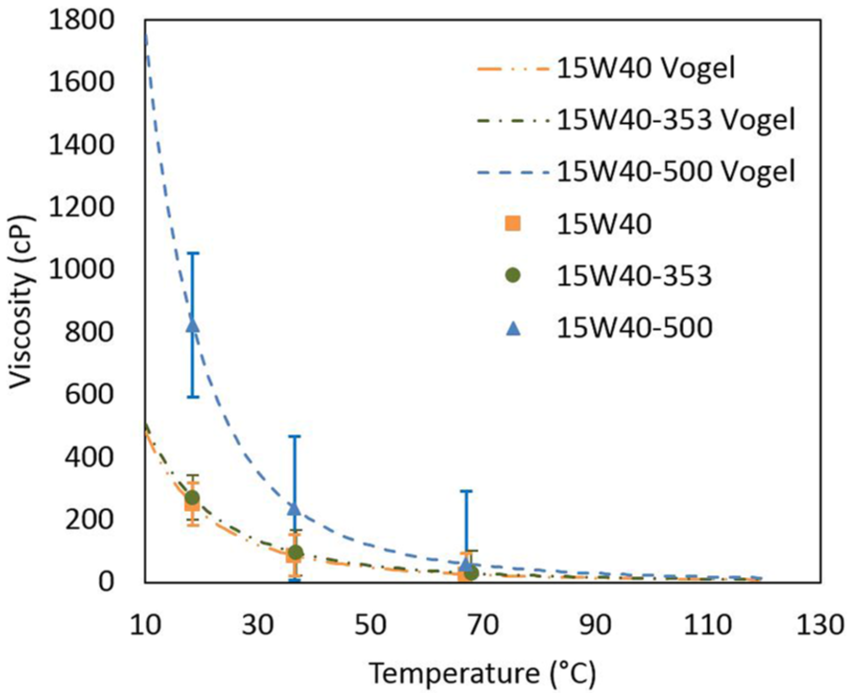
Measured oil viscosity at different temperatures and the corresponding Vogel curve-fits.
Friction characteristics obtained by pin-on-disc tribometry
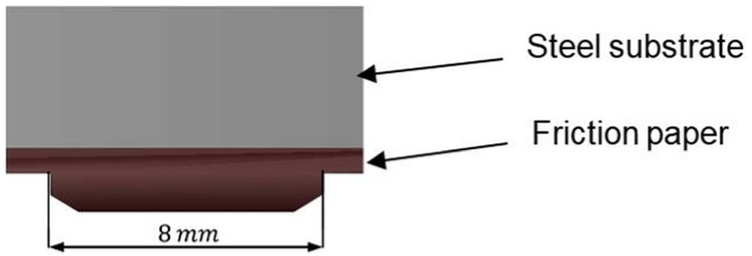
To produce similar contact pressures to that of the actual clutch contact, friction disc flat samples of 8 × 8 mm2 are made and firmly stuck to a flat cross-sectional pin. The edges of the pin were also chamfered to avoid any adverse effects from the untreated edges of the sample and to provide uniform surface contact pressure distribution between the pin and the rotating disc (Figure 7).
Pin sample (cut-out from the friction disc).
The tribometric arrangement is shown in Figure 8. A signal generator supplies a constant DC voltage to the electric motor through a controller. The motor has a maximum speed of 2860 r/min. Thus, a pulley ratio of 1:2 is used to increase the rotational speed of the disc. Attainable sliding speeds are confined to the range 0.1–12 m/s. The pin is loaded up to 55 N. This load is equivalent to an average (Pascal) pressure of 840 kPa. The Wheatstone-bridge strain gauge rosettes on the pin holder arm are calibrated and the bridge offset error is kept below 1%. The voltage signal is monitored by LabVIEW using a National Instruments NI-9237 data acquisition system. The strain gauges generate voltage signal due to bending of the arm. Thus, the relationship between the arm’s lateral force and strain gauge voltage is incrementally measured using a force gauge and voltmeter. This relation is applied to the LabVIEW interface to interpret the generated friction at the location of pin contact as a function of the measured arm’s strain.
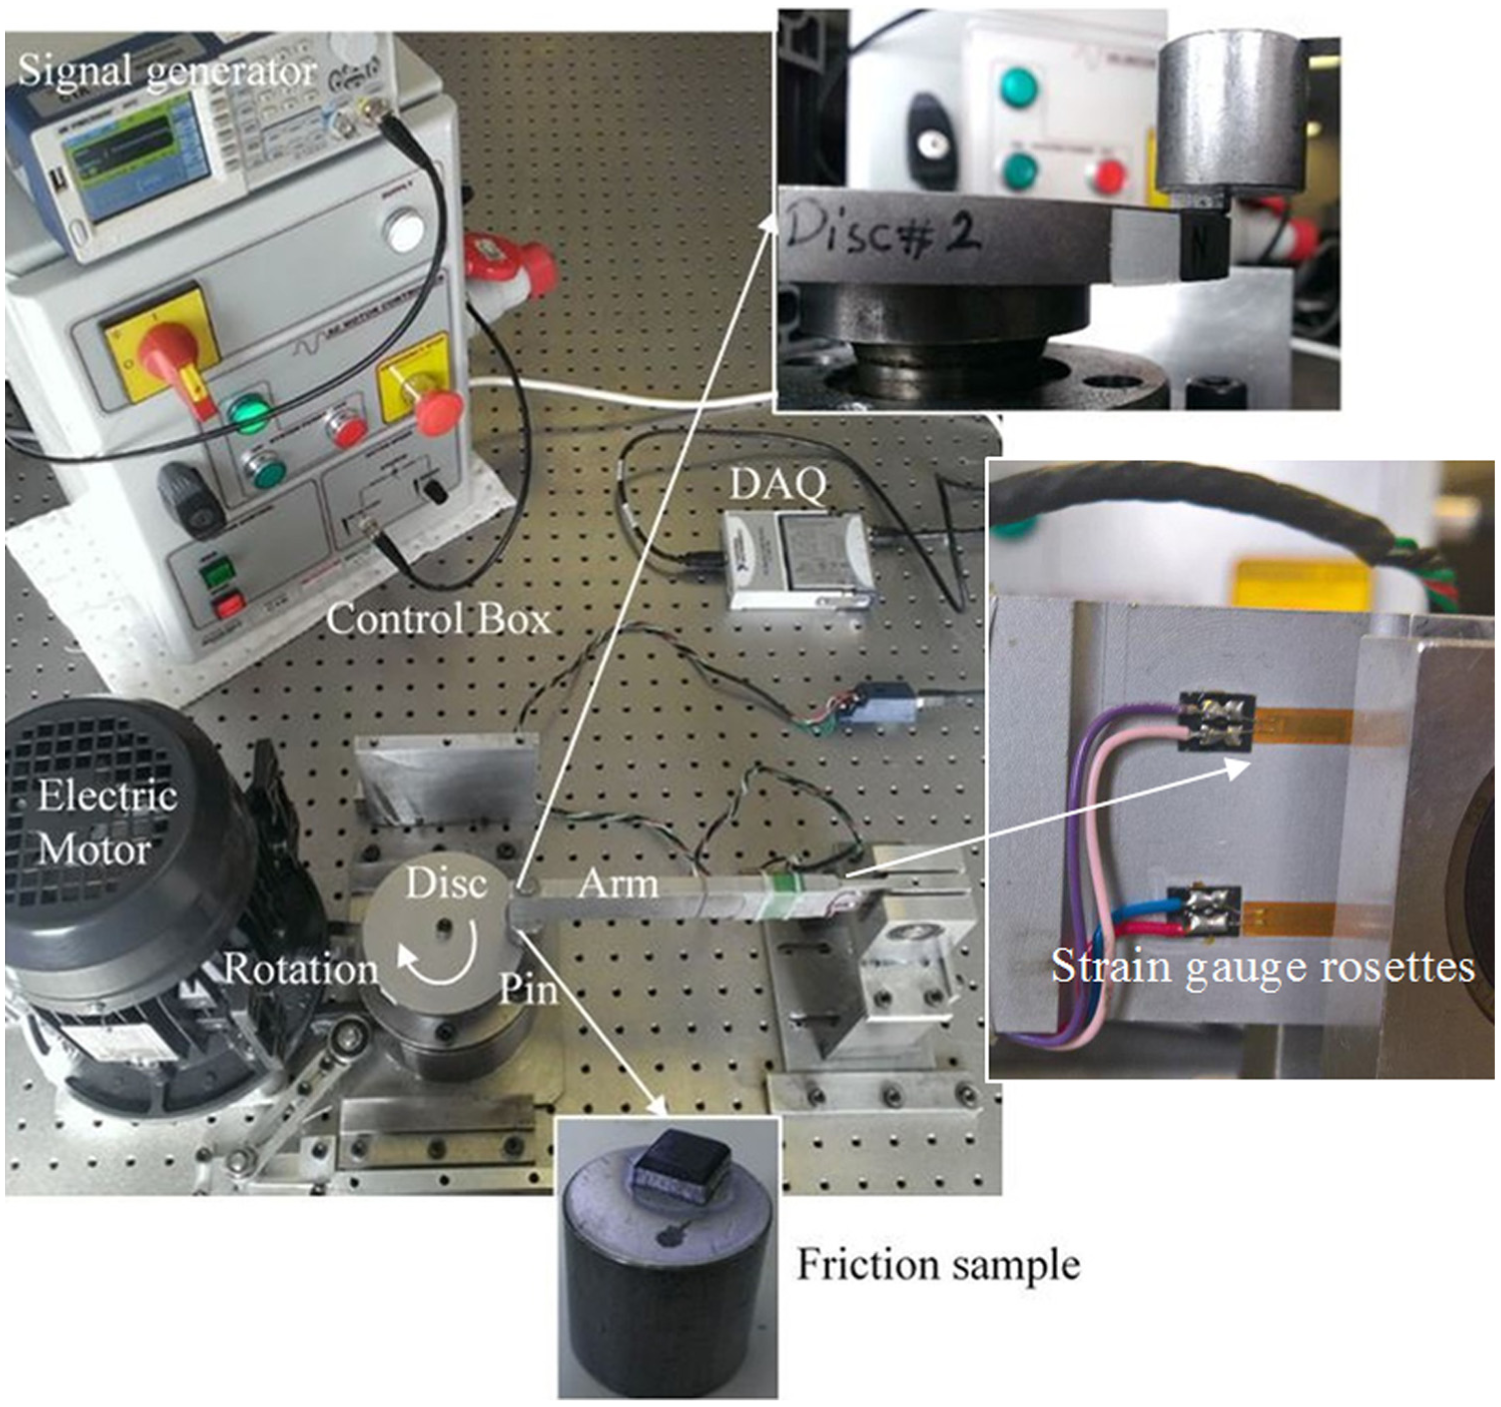
A view of experimental set up.
Topographical characterisation of the contacting surfaces
Surface topography can significantly influence the frictional properties in mixed and boundary regimes of lubrication. As already noted, the RMS roughness of the interfacial contact is specified not to exceed 0.81 µm. Thus, any deviations during the experimental work were monitored and discs were reground as necessary. Friction measurements were carried out on four circular tracks with radii 15, 25, 35 and 45 mm to achieve the required interfacial slip speeds which occur during engagement in a real clutch. The surface roughness is measured at four locations on each track, namely, North, West, East and South (see Figure 9).
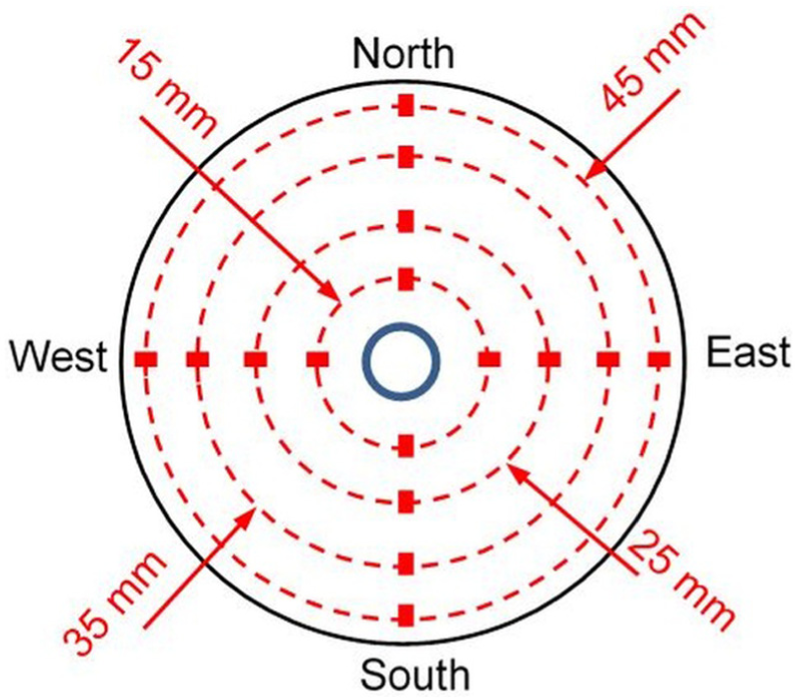
The sliding tracks and the locations of surface interferometric measurements (small rectangular areas at North, West, South and East).
The ALICONA white light interferometer is used with a vertical (height) resolution of 10 nm for three-dimensional (3D) surface interferometry and lateral resolution of 0.174 µm. The scanned surface is post-processed in TalyMap software for removal of large topographical forms and waviness.47,48 Figure 10 shows the characteristics of profile form, waviness and roughness. The surface form is estimated by polynomial functions in the TalyMap software. Different orders of polynomials are examined and the best fit is selected. The surface form is then removed using a fifth order polynomial. The waviness profile is filtered using a Gaussian filter of 0.5 mm. The cut-off threshold is selected such that the roughness profile remains intact. After filtering the form and any waviness, the remaining topography is considered to be the surface roughness. This profile is then used to statistically extract surface roughness characteristics such as the RMS roughness, skewness and kurtosis. 46
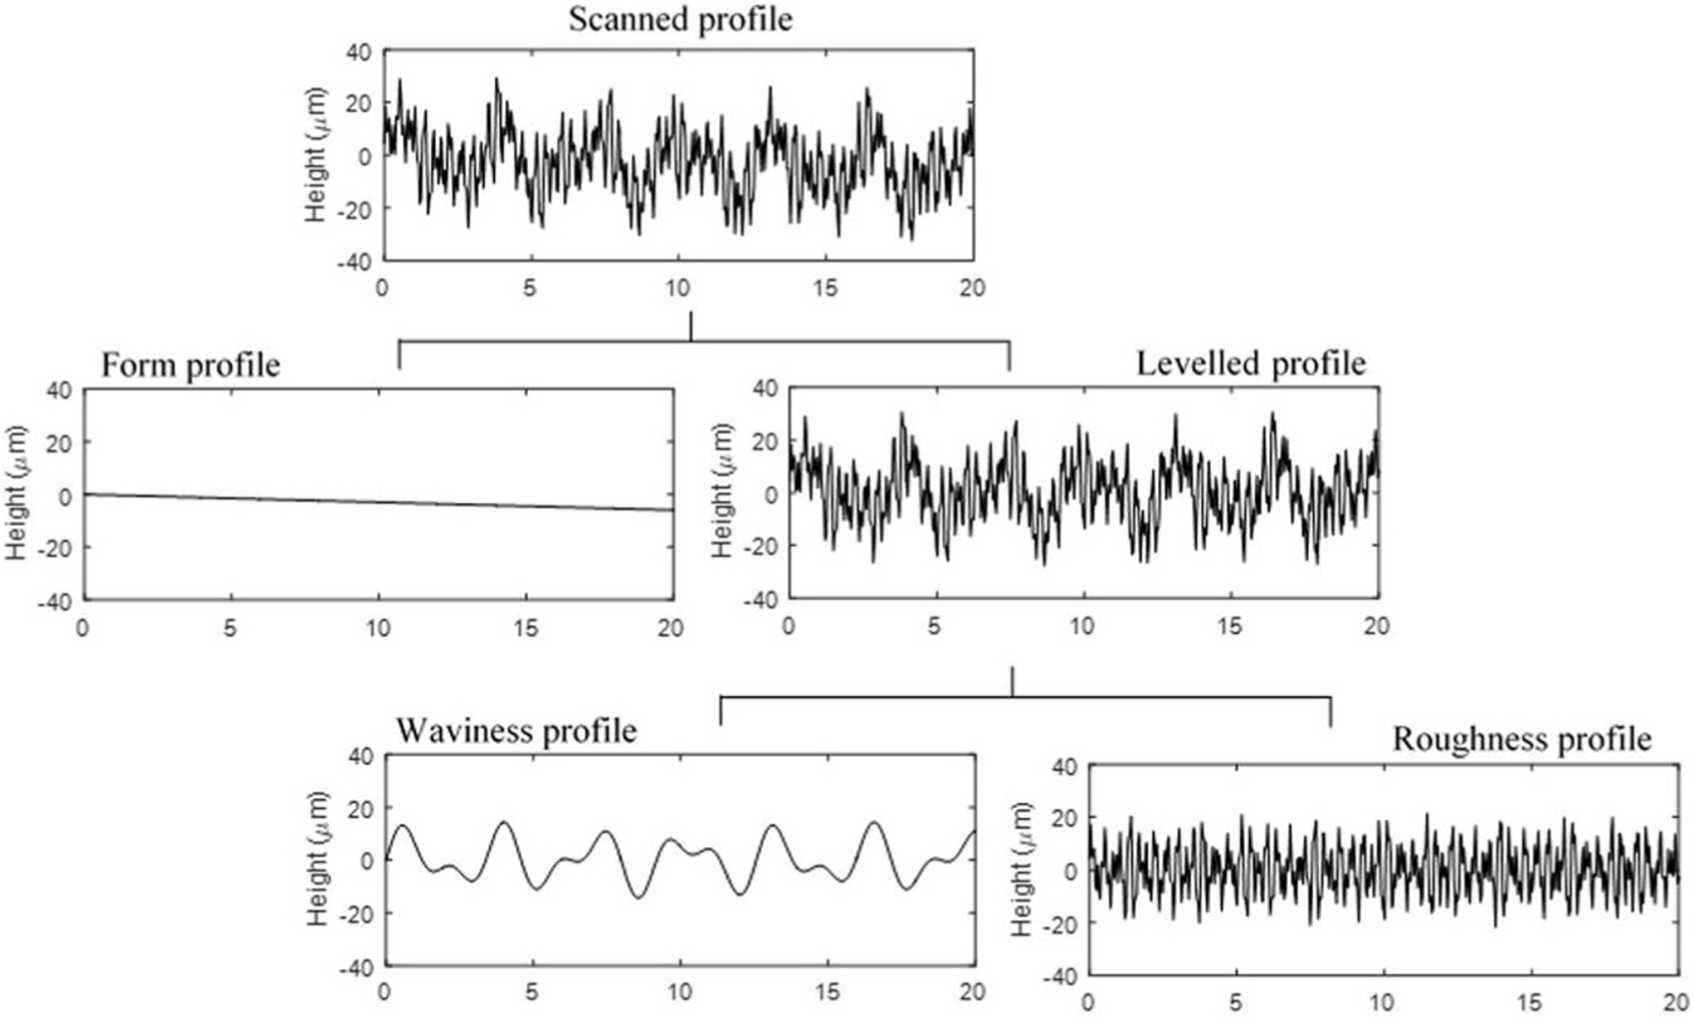
A schematic representation of the topographic filtration procedure.
Test procedure
The coefficient of friction varies with contact pressure, sliding velocity, contact temperature, lubricant shear behaviour and surface roughness. Engine oil temperature is the same as the ambient temperature at engine start-up and parasitic loads are at their maximum due to high lubricant viscosity. Thus, experiments are carried out at ambient temperature (18–22°C). The temperature rise during the experiments is limited to 3–8°C. Therefore, the main variables are contact pressure, sliding velocity and the lubricant quality (sheared state). The contact pressures examined are 31.2, 114.8, 198.4 and 574.4 kPa, with variations in sliding velocities of 0.1, 0.2, 1.45, 3.8, 9.0 and 12.0 m/s at each loading condition. All experiments are reported for three interfacial conditions: dry contact, lubricated with fresh lubricant and also with a 500-h shear-degraded lubricant. The following test protocol is used:
Friction lining samples are mounted onto the pins, chamfered and glued to the sample holder. Two droplets of engine oil are applied onto the friction material surface and allowed to be fully absorbed.
The surface roughness of disc is measured at four locations on each track, and both disc and pin are then mounted onto the tribometer.
The rotational speed of the disc is adjusted so that the desired sliding velocity is reached. Normal load is applied to produce the required contact pressure. All experiments are run for a fixed sliding distance of 300 m. This sliding distance allows the coefficient of friction to settle after a short period of running-in. Thus, the duration of tests varies between 30 and 2990 s. The real-time and average friction coefficients are then recorded.
The disc is cleaned between successive experiments using petroleum ether, methanol and acetone. The surface characteristics are then measured at the same locations, thus ensuring repeatability of experimental work.
Results and discussion
The results of surface topography measurement and pin-on-disc tribometer are used to extract the necessary information for asperity contact and friction torque models to be used in the clutch tribo-multibody dynamic model. The simulation results are used for analysis of clutch performance and its sensitivity to variations in the coefficient of friction.
Measured surface topography
Typical contour plots from white light interferometry are shown for both the disc and the pin sample materials in Figure 11, after removal of form and waviness. The essential parameters for the asperity contact model are RMS asperity height, arithmetic mean summit radius of curvature of asperities, area density of summits, bulk modulus of elasticity and Poisson’s ratio. These parameters are statistically extracted from surface contours and listed in Table 4. The absolute values of skewness,
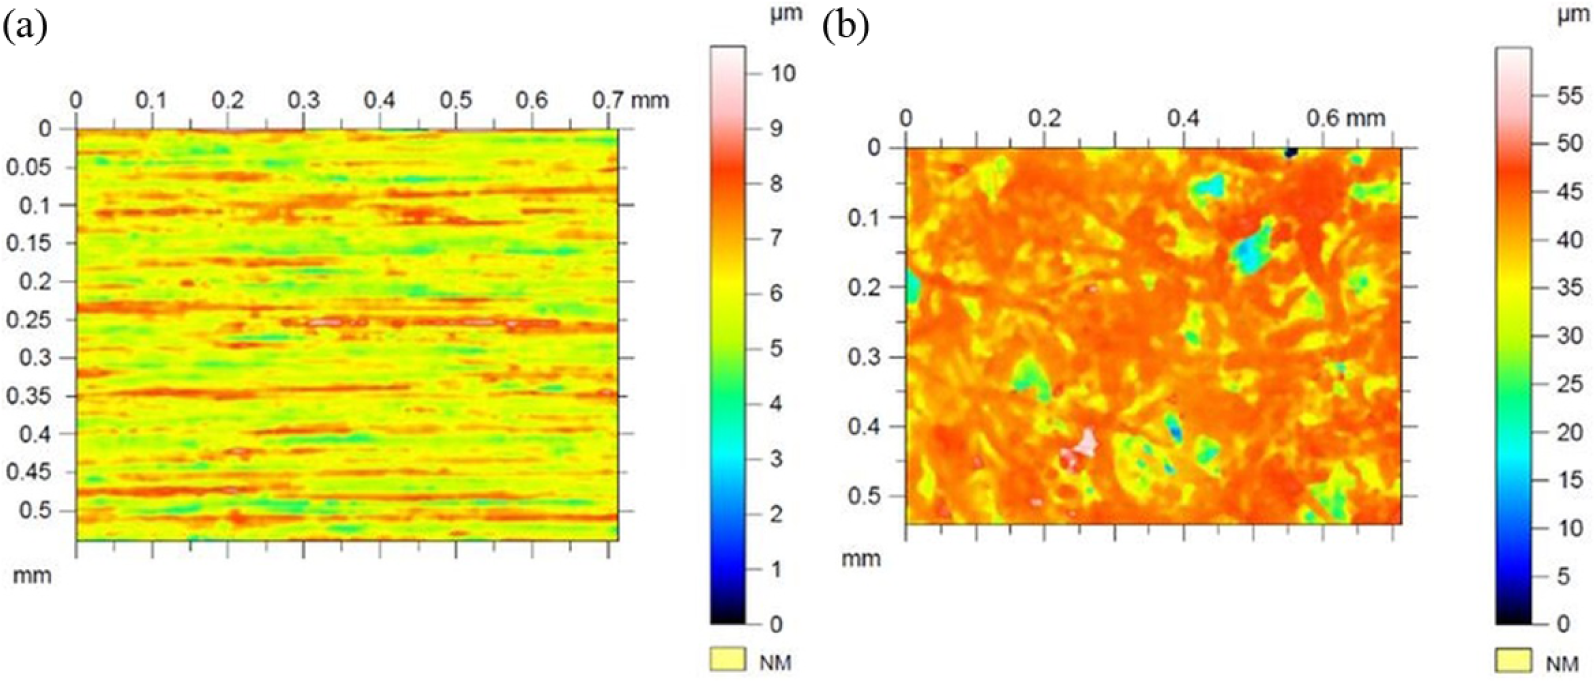
Filtered surface roughness for (a) disc (pressure plate) and (b) pin (friction lining material).
Evaluation of the asperity contact parameters.
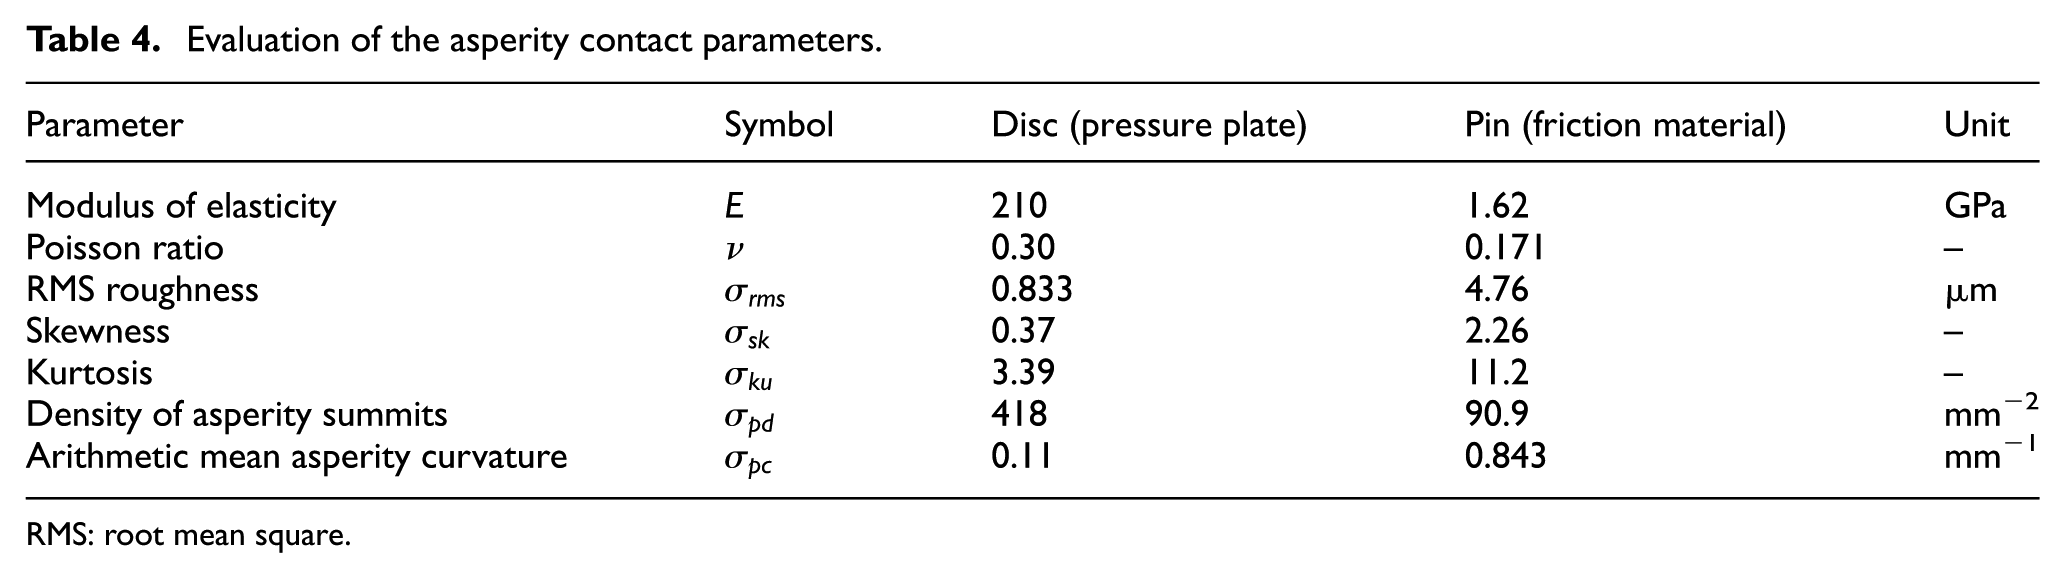
RMS: root mean square.
Although the disc is comparatively flat, its flatness must be monitored during experiments. Surface roughness parameters are measured at four locations on each track of the disc (Figure 9). The total roughness is considered to be the average RMS of the local roughness values,
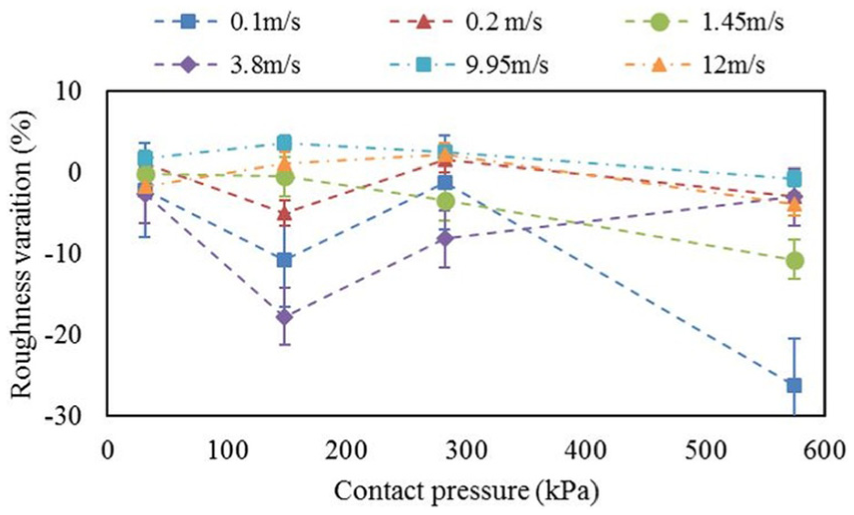
Percentage of variation in disc roughness after each test with a specified contact pressure and sliding velocity for dry contact condition.
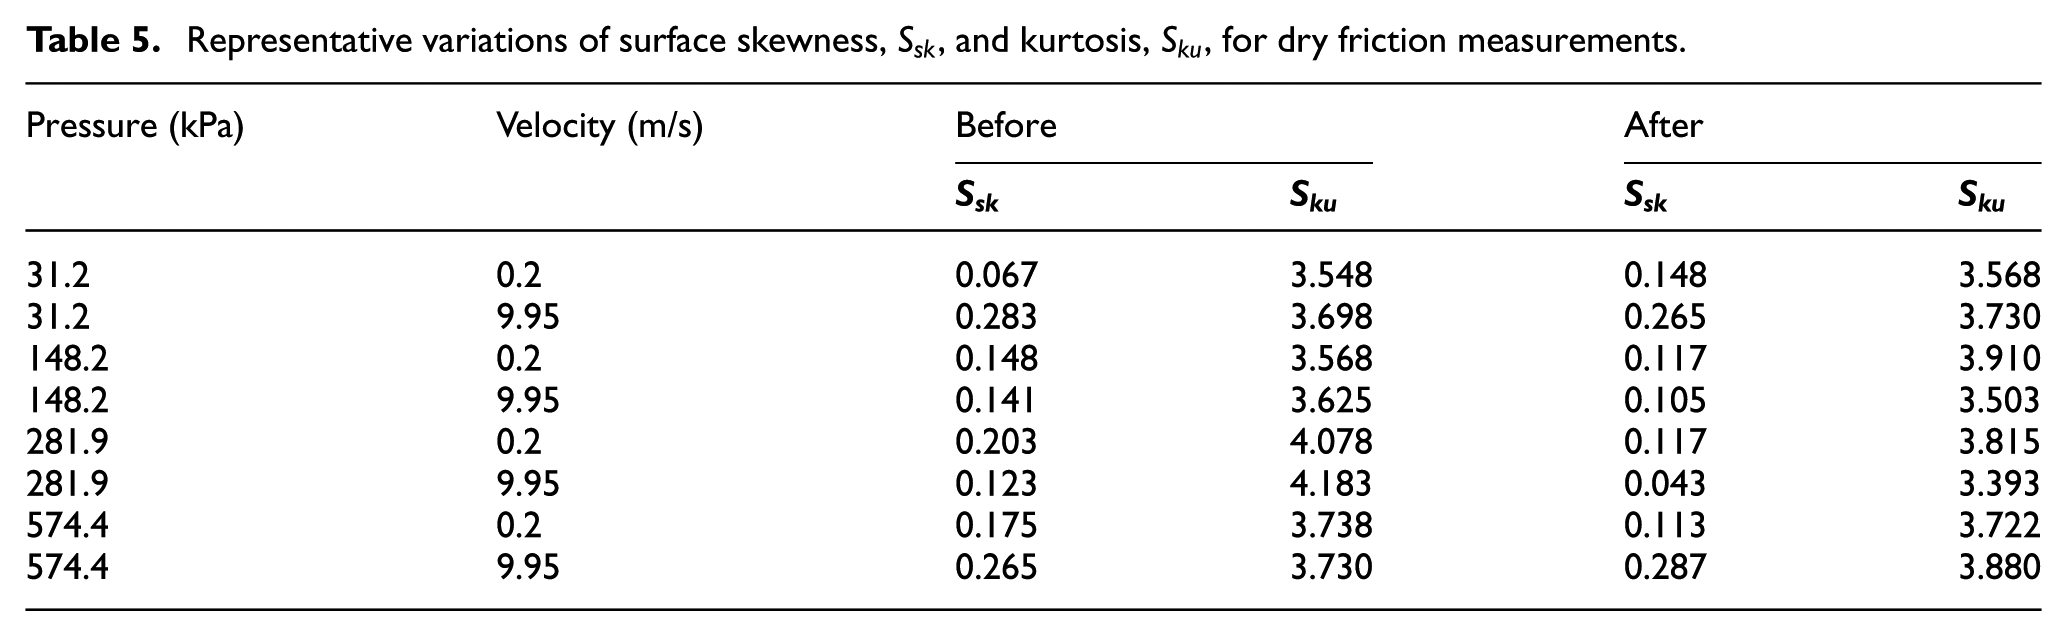
The total roughness values are limited to 0.7–0.83 µm before the measurements. Roughness variations are generally negligible during the experiments. The roughness noticeably reduces during two experiments: (a) 148.2 kPa and 3.8 m/s and (b) 574.4 kPa and 0.1 m/s. The disc surface was reground after these experiments. The asperity distribution and height are monitored through skewness,
Representative variations of surface skewness,
Pin-on-disc friction measurements
A fully instrumented precision in-house pin-on-disc tribometer is used to study the effect of sliding velocity, contact pressure and lubricant state on frictional characteristics. Friction maps are categorised using different lubricant conditions. Thus, three friction maps are obtained for contacts with dry, fresh and shear-degraded lubricants as shown in Figure 13. Each friction map comprises 24 data points, representing different velocity-pressure combinations. Generally, friction increases with contact pressure. Although all graphs exhibit similar trends, lubricated contacts show lower friction values as would be expected. The lowest friction results with application of fresh lubricant (Figure 13(b)). Dry friction is less sensitive to sliding velocity for values greater than 0.2 m/s (Figure 13(a)). This is also expected as the main mode of friction, dependent on sliding velocity in dry contacts, is due to the ploughing of asperities on the softer of the contacting counter faces. 45 At higher sliding velocities, the ensuing wear affects friction and there is direct dependence on pressure and sliding velocity. At lower sliding velocities, friction is driven by surface condition as also discussed in Lim et al. 49 Friction exhibits an opposite trend in dry and lubricated conditions for the sliding velocities below 0.2 m/s. This is due to stiction at low slip speed with increased adhesion, as also noted by Karnopp. 47 Friction sharply increases at 0.1 m/s and high contact pressures are noted in dry contact (Figure 13(a)). Asperities have more time to form adhesive junctures. For the lubricated contacts, boundary active lubricant molecules are bonded or adsorbed to the surfaces, thus reducing the chance of adhesion. At low sliding velocities, the surface active molecular layers support the contact load 30 (Figure 13(b) and (c)).
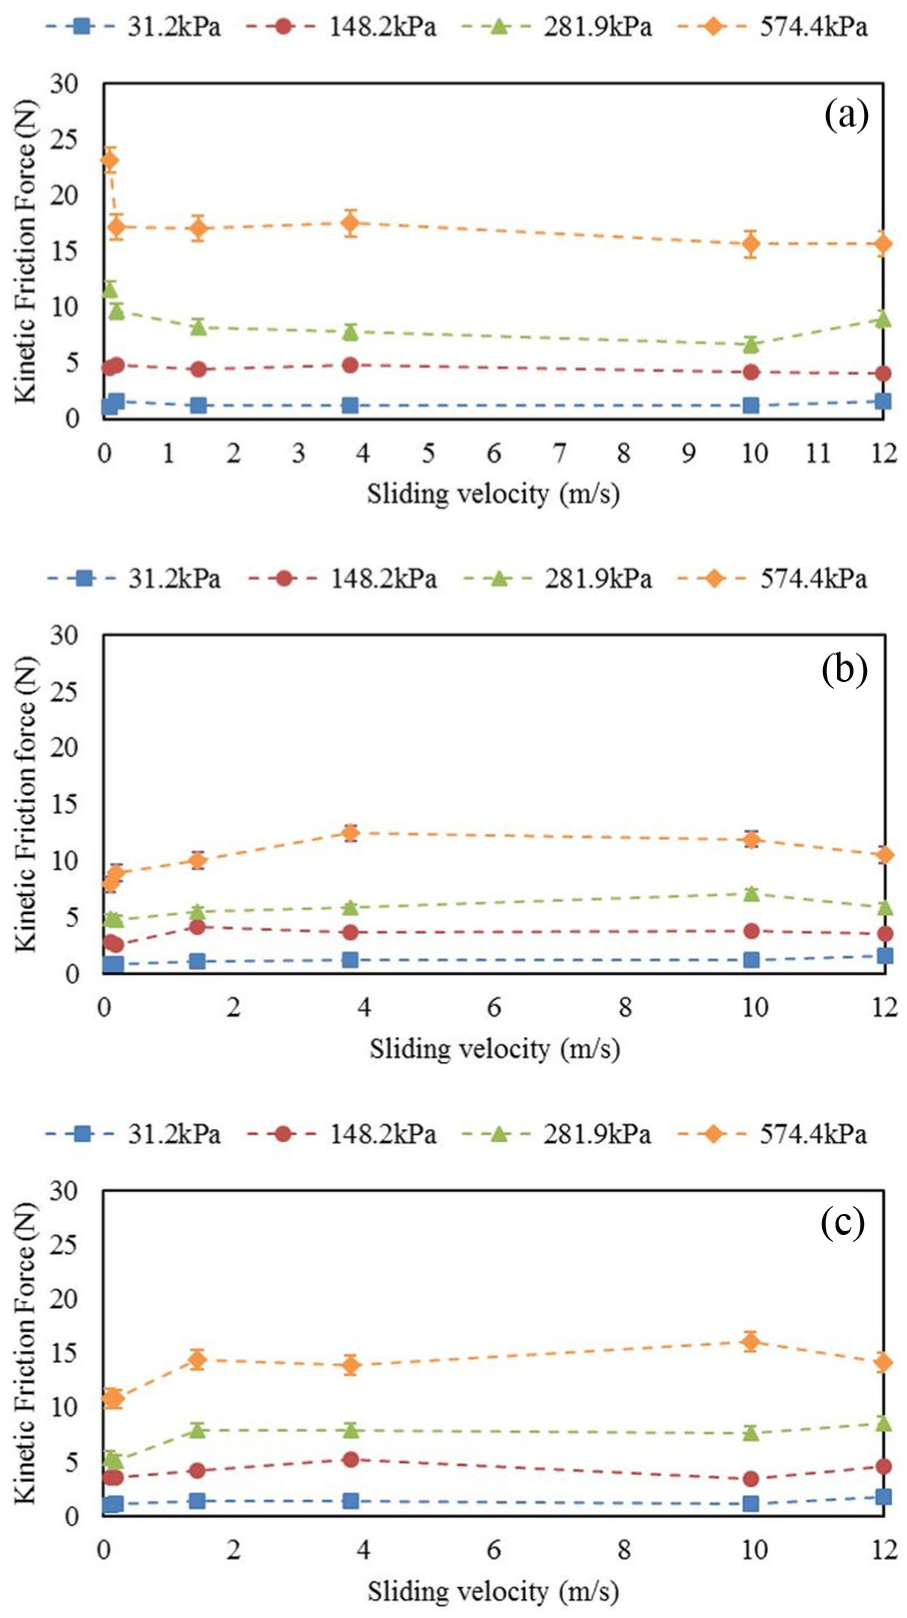
Measure friction with pin-on-disc tribometry for different contact pressures and sliding velocities: (a) dry contact, (b) 15W40 fresh lubricant and (c) 15W40 shear-degraded lubricant.
The output from the pin-on-disc tribometer is friction, which is presented in Figure 13. Coefficient of friction is evaluated from these measurements and the applied normal loads on the pin. The evolution of coefficient of friction with sliding distance is presented in Figure 14. For sake of brevity of discussion, only one scenario is presented. All measurements are carried out over a 300-m sliding distance. Fluctuations in the coefficient of friction are less at lower sliding velocities and loads. In all cases, there are transient oscillations at the beginning of the measurements. This transience is neglected in determination of coefficient of friction.
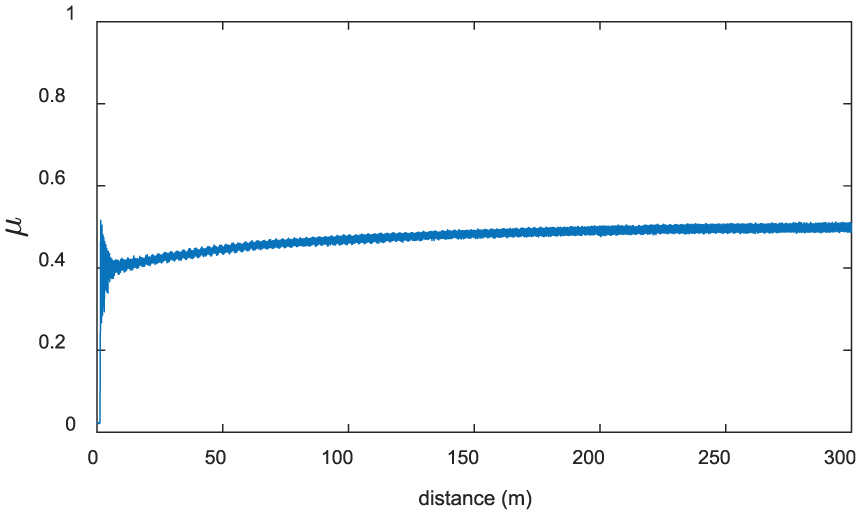
Evolution of coefficient of friction over the tested sliding distance: 574 kPa load and 3.8 m/s sliding velocity (with standard deviation of 0.0209) under dry contact conditions.
Analysis of clutch performance
The asperity contact model, surface topography and friction maps are imported into the multi-body dynamic analysis to investigate the performance of the clutch system. The flywheel speed,
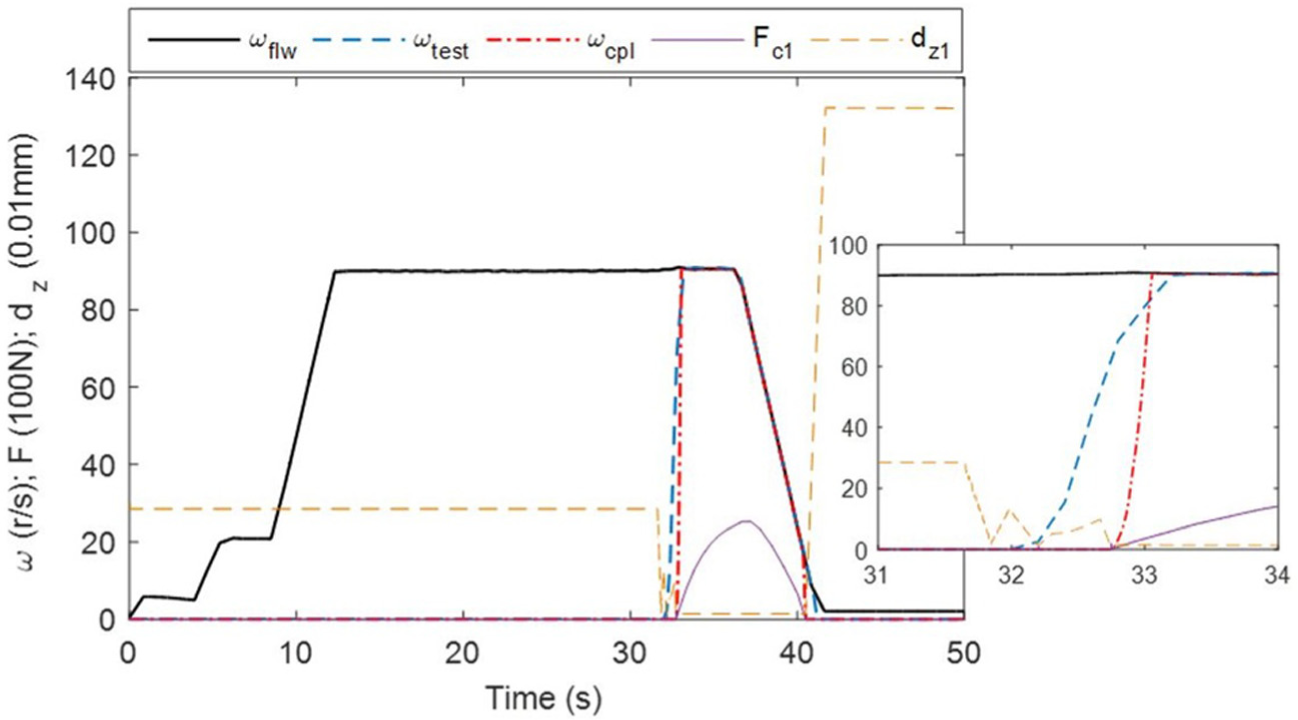
Validation of the clutch tribodynamic model against experimental measurements.
The flywheel accelerates during the first 12 s until it reaches the idling speed (~90 rad/s). The oil pump supplies the clutch with engine oil, which activates the pressure piston. The latter transfers the same force to the pressure plate since these are always in contact. The pressure plate is preloaded by the retraction springs and should initially overcome this applied force. Thus, the pressure plate does not move until about 31.6 s into the simulation time. At around 31.8 s, the first contact occurs between the pressure plate and the first friction disc. There is a clearance between the friction disc and the separator plate. Therefore, the friction disc moves towards the separator plate. The friction disc is stopped by the separator plate around 32 s into the simulation. During this process, impacts between the pressure plate and the friction disc can occur. At this instant, the separator plate and the second friction disc still remain unengaged and the clamp force,
Figures 16–18 outline clutch performance based on the three obtained friction maps (Figure 13). These friction maps are separately investigated, since the focus here is on the effect of lubricant leakage rather than the transition process from the idealised dry contact state. The variations of coefficient of friction with contact force,
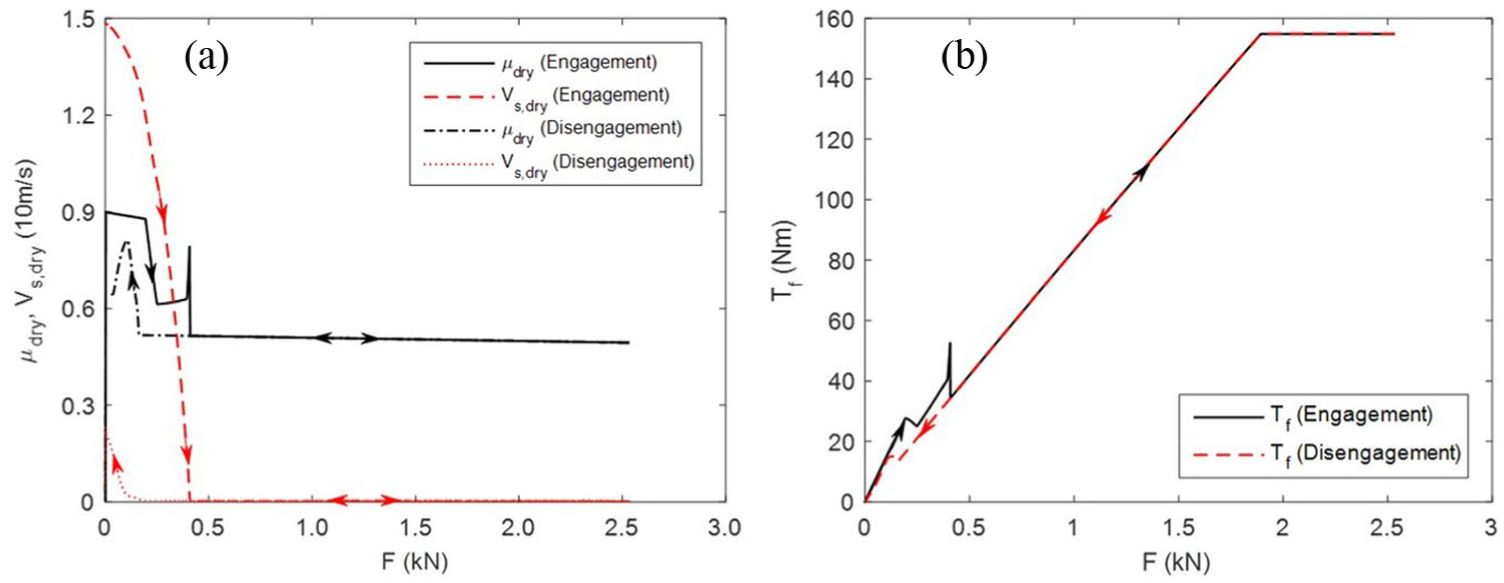
Clutch performance for dry contact conditions: (a) friction coefficient–sliding velocity variations and (b) friction torque during engagement (solid line) and disengagement (dashed line) processes.
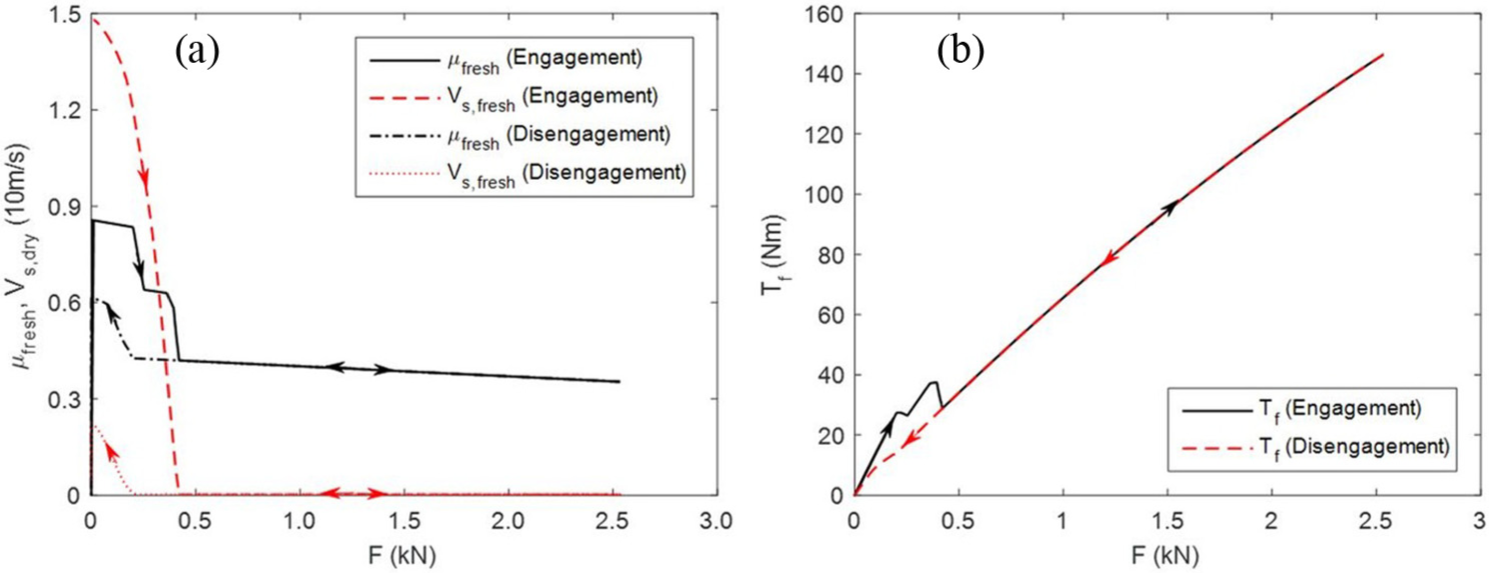
Clutch performance for fresh lubricant contact conditions: (a) friction coefficient–sliding velocity variations and (b) friction torque during engagement (solid line) and disengagement (dashed line) processes.
Clutch performance for shear-degraded oil contact condition: (a) friction coefficient variations and (b) friction torque during engagement (solid line) and disengagement (dashed line) processes.
As the lubricant leaks into the contact, the frictional behaviour of the clutch system may vary depending on the lubricant rheological state. Figure 17 shows the clutch performance with a fresh lubricant. The clutch behaviour is very similar to the dry contact condition, except for lower values of coefficient of friction (Figure 17(a)). The spike in the coefficient of friction disappears since the surface-adsorbed/bonded lubricant molecules cover the asperities through formation of a tribo-film. The coefficient of friction reduces with a larger slope between 0.5 and 2.5 kN. The friction torque variation with contact force contains some nonlinearity (Figure 17(b)) due to the variations of the contact force and friction coefficient. The maximum transferred torque is 145 N m at 2.5 kN load. Thus, clutch requires a greater contact force to reach its full torque capacity. Hence, the presence of leaked lubricant into the interface reduces its tractive performance.
The actuation oil is supplied from the engine with possible soot contamination. Shear-degraded oil contact condition is shown in Figure 18. Despite similar trends as in the previous case, the coefficient of friction coefficient is greater than with the fresh oil and lower than the dry contact condition (Figure 18(a)). This is an intuitive outcome. The dependency of coefficient of friction on contact force is larger than the previous scenarios, between: 0.5 and 2.5 kN. The maximum clutch torque is achieved at 2.0 kN contact force. Therefore, the clutch can reach its full capacity for dry and shear-degraded contact conditions. However, the maximum clutch capacity is not achieved with leaked fresh lubricant owing to its superior lubricity.
Sensitivity analysis
Deviations in the clutch design parameters can affect its performance. Certain design parameters impose larger effects than others. It is important to identify these parameters and carry out a sensitivity analysis. The clutch performance during (dis)engagement relies on factors including the engine idling speed, wear level, contact load, preloaded retraction springs and the interfacial coefficient of friction. A series of case studies are undertaken using these parameters. The factors with the highest sensitivity are presented. These parameters are the contact load (pressure) and the coefficient of friction. Pressure profile variations are applied in two ways: (a) the magnitude effect (Figure 19(a)) and (b) the pressure rise rate (Figure 19(b)). The pressure magnitude and rise rate are varied by
Variations in (a) magnitude and (b) slope of the pressure profile (sensitivity analysis).
Clutch sensitivity to design parameters (pressure magnitude, pressure rise rate and coefficient of friction): (a, b) percentage of variation in engagement/disengagement duration, (c) engagement initiation time and (d) disengagement termination time.
Conclusion
A multi-scale, multi-physics model of a clutch is developed for engine downsizing for heavy-duty off-highway vehicles. The multi-body dynamic model predicts the rotational and axial motions of the clutch system inertial components. The friction dependency on contact load and sliding velocity is experimentally obtained through pin-on-disc tribometry. The surface roughness is monitored for all the experiments, and surface properties of the plates and friction discs are used to develop a micro-scale contact model. Three contact conditions are examined: (a) dry interfacial contact, (b) contact contaminated by leakage of a fresh lubricant and (c) that contaminated by a shear-degraded lubricant. Since the 500-h shear-degraded lubricant has a higher viscosity at low temperatures, it is included in the tribometric and simulation studies. It is shown that dry friction is governed by the surface properties at low sliding velocities, leading to a spike in the coefficient of friction during the transition from sliding to stick state, due to adhesion. This spike disappears in the presence of any leaked engine lubricant into the contact interface. This is most likely due to reduced adhesion in the presence of a fluid in the interfacial rough contact of surface asperities.
The clutch reaches its full torque capacity with dry contact and in the presence of any leaked shear-degraded lubricant. Despite full engagement in the presence of a fresh lubricant, the full torque capacity is not achieved, clearly due to incessant slippage. A few discrepancies are observed between the simulated and measured (dis)engagement initiation time, indicating that the real system engages before all the plates and friction discs are fully clamped. In the simulation, drag force and translational resistance on the contact surfaces are neglected. These phenomena can lead to torque transfer before fully clamped position.
Three design parameters are identified as the most effective upon clutch performance: (a) pressure magnitude, (b) pressure rise rate (slope) and (c) the mean coefficient of friction. It is shown that duration of clutch engagement is mainly affected by the magnitude of pressure profile. Initiation of clutch engagement is merely affected by the coefficient of friction. The clutch can overcome parasitic loads during the engine start-up. Detailed study of clutch performance is required under engine operating conditions other than at idling, reported here.
Footnotes
Appendix 1
Acknowledgements
The authors wish to express their gratitude to the Innovate UK for the financial support extended to Engine Based Driveline Disconnect for Downsizing (EBD3) Declutch programme Grant (TSB reference: 102249), under which this research was carried out. Thanks are also due to the consortium of industrial partners of the EBD3 project, particularly to Perkins Engines Co Ltd (a Subsidiary of Caterpillar) in this instance. Research data for this paper are available on request from the corresponding author.
Declaration of conflicting interests
The author(s) declared no potential conflicts of interest with respect to the research, authorship and/or publication of this article.
Funding
The author(s) disclosed receipt of the following financial support for the research, authorship, and/or publication of this article: This work received financial support from Innovate UK (TSB, grant number 102249) and Caterpillar.