
Abstract
Lattice structures have gained significant attention in orthopaedic endoprosthesis design due to their ability to reduce stiffness mismatch, enhance osseointegration and improve longevity. However, optimising lattice structures for mechanical performance, manufacturability, and patient-specific requirements remains computationally intensive and time-consuming using traditional topology optimisation or generative design approaches. This study presents an ML-based design tool that predicts the optimal unit cell type and cell orientation of open-pore Ti-6Al-4V lattice structures based on predefined inputs, including the patient’s weight, bone porosity and mechanical constraints. A dataset of 40,960 finite element (FE) simulation results was used to train an Extra-Trees machine learning (ML) model, which achieved a classification accuracy of 100% and an F1-score of 0.996 in selecting the optimal lattice configuration. The model was integrated into a low-code design environment (Synera), enabling rapid generation of lattice structures without manual iteration. Compared to conventional methods, the proposed Artificial Intelligence (AI) approach could significantly reduce design time while maintaining high fidelity in achieving target performance. This tool enhances scalability and supports future clinical customisation by integrating patient-specific parameters. The study demonstrates the potential of ML to transform the lattice design process and lays the groundwork for faster, more adaptive, and more individualised orthopaedic endoprosthesis solutions.
Introduction
Implant loosening was identified as one of the causes for the revision surgery of the total hip arthroplasty (THA), where stress shielding was reported as a significant influence on it. 1 Stress shielding occurs when high-stiffness implants are used in joint replacements.2,3 While these implants stabilise the area and support mobility, their stiffness differences in comparison with the natural bone reduce the bone load, leading to bone loss over time. 4 Open-pore lattice structures present immense potential across diverse applications, 5 offering versatility and adaptability in design control, such as stiffness. Consequently, the medical sector frequently incorporates open-pored lattice structures into prosthesis design, 6 a practice significantly advanced by additive manufacturing (AM) technology’s capability to provide diverse lattice structures suitable for personalised implant design and porous bone screw fabrication. 7
However, selecting the optimal configuration for lattice structures presents a formidable challenge. It involves navigating through a myriad of interdependent design parameters such as lattice geometry, pore size, strut thickness and interconnectivity. 8 Researchers have explored various strategies to optimise lattice designs, including methods to refine material distribution 9 and enhance mechanical compatibility. 10 Studies highlight the computational complexity of fine-tuning these parameters to balance stiffness, strength and manufacturability, 11 particularly for biomedical applications. 12 In healthcare, such designs must align with biological tissues, ensuring compatibility without compromising the implant’s structural performance. These intricate requirements underscore the need for advanced computational tools and modelling strategies to streamline lattice structure design.
Numerous studies have examined methods to facilitate the process of designing lattice structures that meet the design requirements. For instance, Sufiiarov et al. 13 have explored graded density structures to mimic natural bone properties, addressing issues such as stress concentration and stiffness mismatch. Other studies focus on the inclusion of fillets to reduce stress points, thereby enhancing the structural integrity of lattice designs. 14 Computational limitations, such as large CAD file sizes and high memory demands, remain a bottleneck in lattice optimisation for additive manufacturing. 15 Advances in optimisation techniques, including genetic algorithms, have demonstrated potential for achieving multi-criteria design goals. 16 Paquette-Rufiange 17 critiques the conventional use of bar models in lattice topology optimisation, identifying that such models are often insufficient for the adaptive design needed in endoprosthesis applications. This study highlights the need for advanced simulation techniques to predict lattice behaviour under physiological loads accurately.
While these traditional methods, like topology optimisation and parametric generative design, have contributed valuable insights, they are limited by their reliance on human judgement and computational inefficiencies.18,19 Moreover, existing studies often overlook the intricacies of lattice customisation and fail to achieve optimal designs across multiple criteria simultaneously. These studies collectively illustrate the need for automated, computationally efficient methods in selecting the best optimised lattice structures, as manual adjustments, computational resource demands and incomplete design frameworks for multi-criteria optimisation often limit current approaches.
ML has shown immense potential in overcoming these limitations. It excels at processing vast datasets, identifying patterns and providing optimised solutions that surpass the capabilities of manual approaches. 20 In implant design, ML has been applied to tasks ranging from implant selection 21 and stress analysis 22 to postoperative monitoring. 23 For instance, AI-driven systems have successfully identified stem types from X-ray images, aiding in preoperative planning for THA. 24 While these applications primarily utilise 2D imaging through convolutional neural networks, integrating CT-driven models offers a more comprehensive understanding of bone structure and biomechanical properties. 25
Personalised endoprosthesis designs often begin with commercial stem models, refined using advanced computational techniques to align with individual anatomical features. Compared with traditional methods, ML-based methods learn from large datasets and can rapidly predict optimal lattice configurations based on performance requirements. This enables faster design generation, easier integration of multiple objectives (e.g. porosity and manufacturability) and greater adaptability to patient-specific anatomical or mechanical inputs. ML enables scalable solutions for this customisation, detecting intricate biomechanical patterns and expediting design processes. This reduces reliance on manual input while maintaining the accuracy required for clinical validation. ML algorithms further enhance the customisation process, offering robust solutions that address the limitations of traditional methods.
In response to these challenges, this study adopts a data-driven approach that leverages ML to overcome the limitations of traditional lattice design methods. The objective is to develop an ML-based design tool that accurately predicts the optimal lattice unit cell type and orientation for patient-specific endoprosthesis implants, based on mechanical constraints and clinical inputs and integrate it into a low-code design platform for rapid and scalable implementation. This tool, also referred to as an AI tool, is applied to the design of open-pore Ti-6Al-4V endoprostheses, offering enhanced customizability and supporting key functional improvements such as promoting bone ingrowth and achieving more natural load distribution between bone and endoprosthesis.
Unit cell and lattice generation
In this section, the requirement for lattice design in arthroplasty applications, the process of generating lattice structures from unit cells, and the selection of suitable unit cells for the dataset are described. First, the requirements of lattice design for arthroplasty applications are discussed. This is to ensure the created lattice design is suitable for the intended purpose. Then, several distinct unit cell designs were created, each offering unique structural properties. The unit cells were organised into three design groups: bio-inspired, hybrid, and software-ready unit cells. All unit cells were designed using Synera software (Synera-v22.10, Synera GmbH, Bremen, Germany) and nTop software (nTop-v3.38.4, nTopology Inc., New York, USA), which allowed the design and development of complex lattice structures. Then, the unit cells that meet the requirement are selected to generate a variety of lattice structures for the dataset.
Requirements of lattice structure for arthroplasty applications
Establishing a comprehensive list of requirements to guide the development and optimisation of lattice structures for arthroplasty applications is crucial, as this will allow the AI tool to perform towards a much more specific target. The requirements were formulated based on literature about the use of lattice structures in arthroplasty applications, the relevant loads and the manufacturability of lattice structures.
To simplify the lattice design, all of the lattice structures should be regular, uniform, and cubic unit cell-based. Only open-porous unit cells are to be considered, as they have shown the capability to improve the bone ingrowth26,27 and allow a cement-free fixation of an endoprosthesis.
28
In clinical practice, the success of endoprostheses is significantly influenced by patient-specific factors such as bone density, anatomical variation, and the severity of osteoarthritis. For example, lattice designs optimised for individual osteoarthritis severity, such as porous tibial trays in unicompartmental knee arthroplasty, have demonstrated improved load transfer and reduced stress shielding compared to conventional solid implants.
29
These variations necessitate endoprosthesis designs that are tailored to the individual, especially in load-bearing regions of the skeleton. In this study, the pore size should range from 200 to 1500 µm, which is favourable for facilitating bone cell ingrowth and vascularisation.30,31 Additionally, the target porosity range is set between 50% and 85% to achieve a balance between structural integrity and promoting bone ingrowth.
32
The percentage of porosity
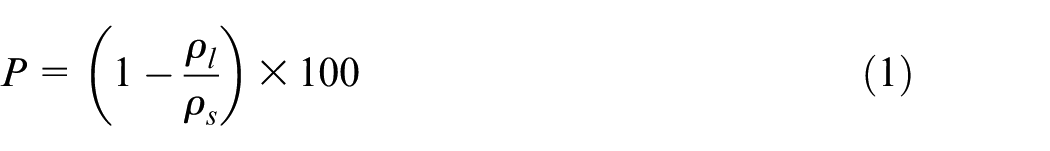
where
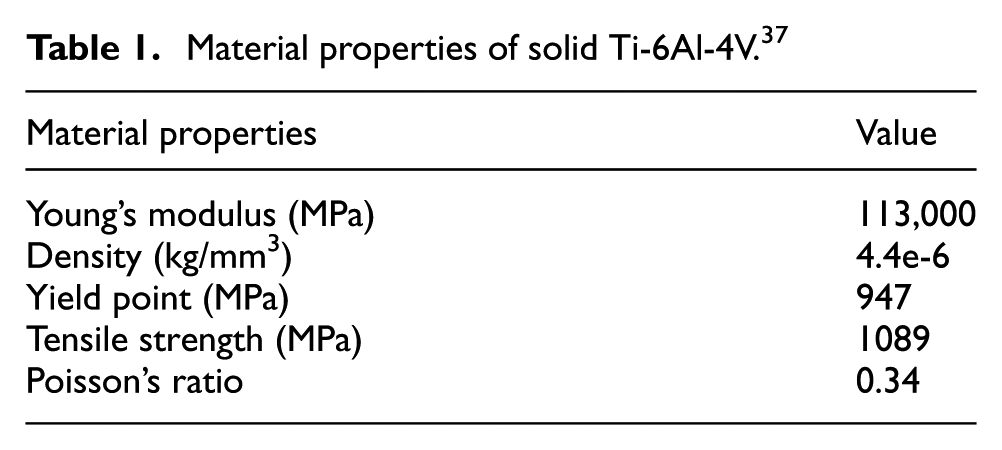
Material properties considered for the lattice structures should be identical to those of titanium alloy (Ti-6Al-4V). This alloy is widely used in the medical field for endoprosthesis applications and is recommended for its biocompatibility, 34 mechanical strength. 34 When processed using AM technologies, it can be tailored into a biomimetic tool that helps minimise stress shielding. 35 In addition, the material is suitable for additive manufacturing, a process that enables the manufacturing of complex designs such as open-porous lattice structures. 36 Although Ti-6Al-4V was chosen due to its favourable properties for orthopaedic applications, the current framework could be extended to accommodate other biocompatible materials, such as bioresorbable polymers or ceramics, to meet the needs of different anatomical sites or patient groups. The material properties are shown in Table 1.
Material properties of solid Ti-6Al-4V. 37
To improve the manufacturability of the endoprosthesis, it is crucial to ensure that no overhangs exceed 45° in the lattice structure so that the need for additional support structures is minimised. The minimum material thickness should be set at 0.7 mm to ensure adequate structural stability and repeatable part quality with the available laser powder bed fusion machine (SLM®125 HL, Nikon SLM solutions) for the subsequent study in the project. These design constraints, aimed at optimising the manufacturing process, are directly informed by the successful manufacturing outcomes observed in the initial samples. The feasibility of producing complex geometries using laser powder bed fusion, even with these limitations, is visually demonstrated in the overview image provided in Figure 1.
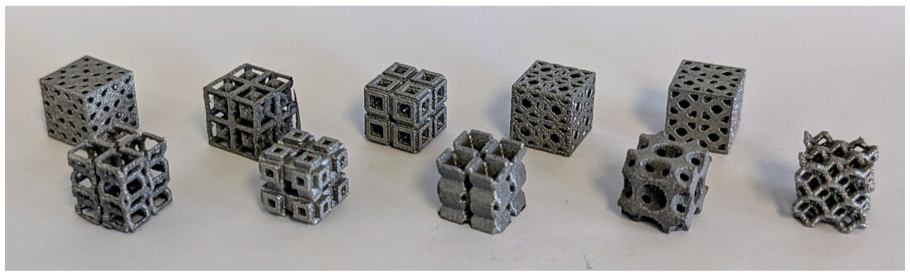
Examples of 3D-printed lattice structures fabricated using SLM®125 HL by our project partner, Leibniz-IWT, Bremen. The specimens demonstrate the feasibility of manufacturing various lattice designs, supporting the practical implementation of the AI-generated structures in this study. © Leibniz-IWT Bremen, used with permission.
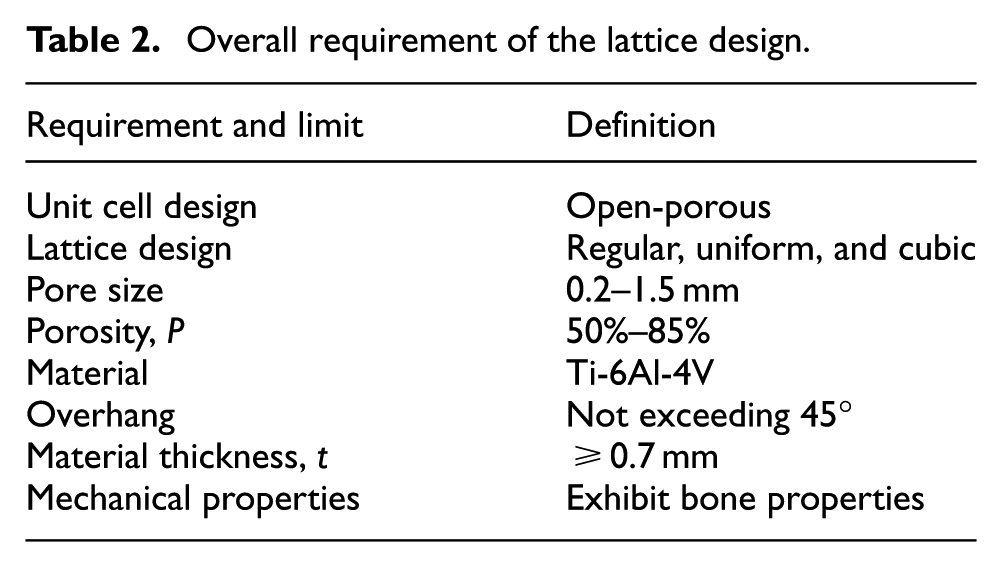
Mechanical properties were another critical consideration. The mechanical properties of the lattice should be comparable to the mechanical properties of the bone to avoid stress shielding. 28 Table 2 summarises the overall requirements of the lattice designs.
Overall requirement of the lattice design.
Unit cell designs and lattice sizing
Unit cells were created in a cubic design space so that they could be repeated in three dimensions to form a uniform periodic grid. All created unit cells can be broadly classified as either surface-based or strut-based, depending on their underlying structural topology.
As shown in Figure 2, a grid of 4 × 4 × 4 unit cells was chosen as a design space for the lattice structures in the dataset. The lattice grid size was chosen to balance computational cost with the accuracy requirements of the FE simulations. The lattice was standardised to a volume of 20 × 20 × 20 mm3 with each of the unit cells measuring 5 × 5 × 5 mm3, so that a total of 64 unit cells are required to fill the design space of the lattice structure.
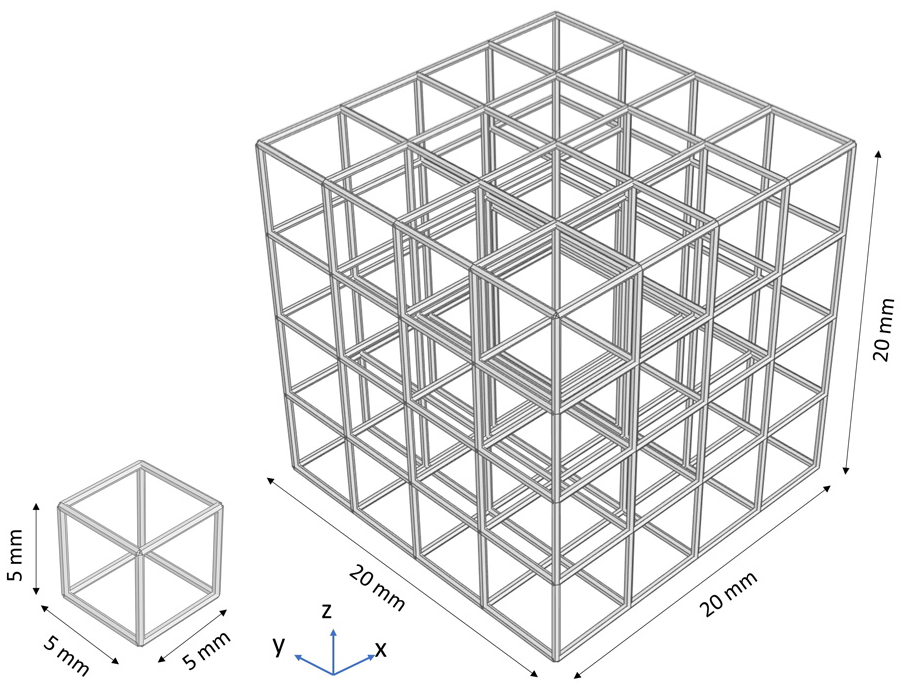
Unit cell (left) and the lattice (right), strut-based.
To increase the variations of lattice structures in the dataset, the porosity of each unit cell created in this study was controlled by adjusting the material thickness, which remains consistent throughout each unit cell of the lattice structure. Depending on the grid cell type, the material thickness manifests either as surface thickness or strut diameter. Given the distinct structure of each unit cell, the correlation between material thickness and porosity is unique to each configuration. Additionally, the structures within a unit cell can be rotated by up to 45° around any axis to form varying lattice designs.
Bio-inspired unit cells
This section focuses on developing a series of bio-inspired unit cells for lattice structures, each reflecting geometric principles observed in nature. Several natural inspirations, such as marine microorganisms and natural bone, have been observed and identified as suitable to provide innovative geometries that could offer unique mechanical properties and structural benefits.
Based on the nature-inspired structures depicted in Figure 3, such as Euplectella,38,39 Radiolaria40,41, Rhopalodia, Surirella42,43 and other biologically derived patterns such as Honeycomb,44,45 Voronoi46,47 and Trabecular,48,49 10 bio-inspired unit cells were modelled in Synera. Apart from the Euplectella design, which inherently exhibits a cubic-like structure, the other designs were initially developed as surface-based structures and subsequently applied to each face of the unit cell. Where feasible, adjacent surfaces of neighbouring cells are made identical to facilitate the formation of a regular lattice. However, this approach does not apply to the trabecular unit cell, as its top and bottom surfaces differ. Figure 4 shows the created bio-inspired unit cells.
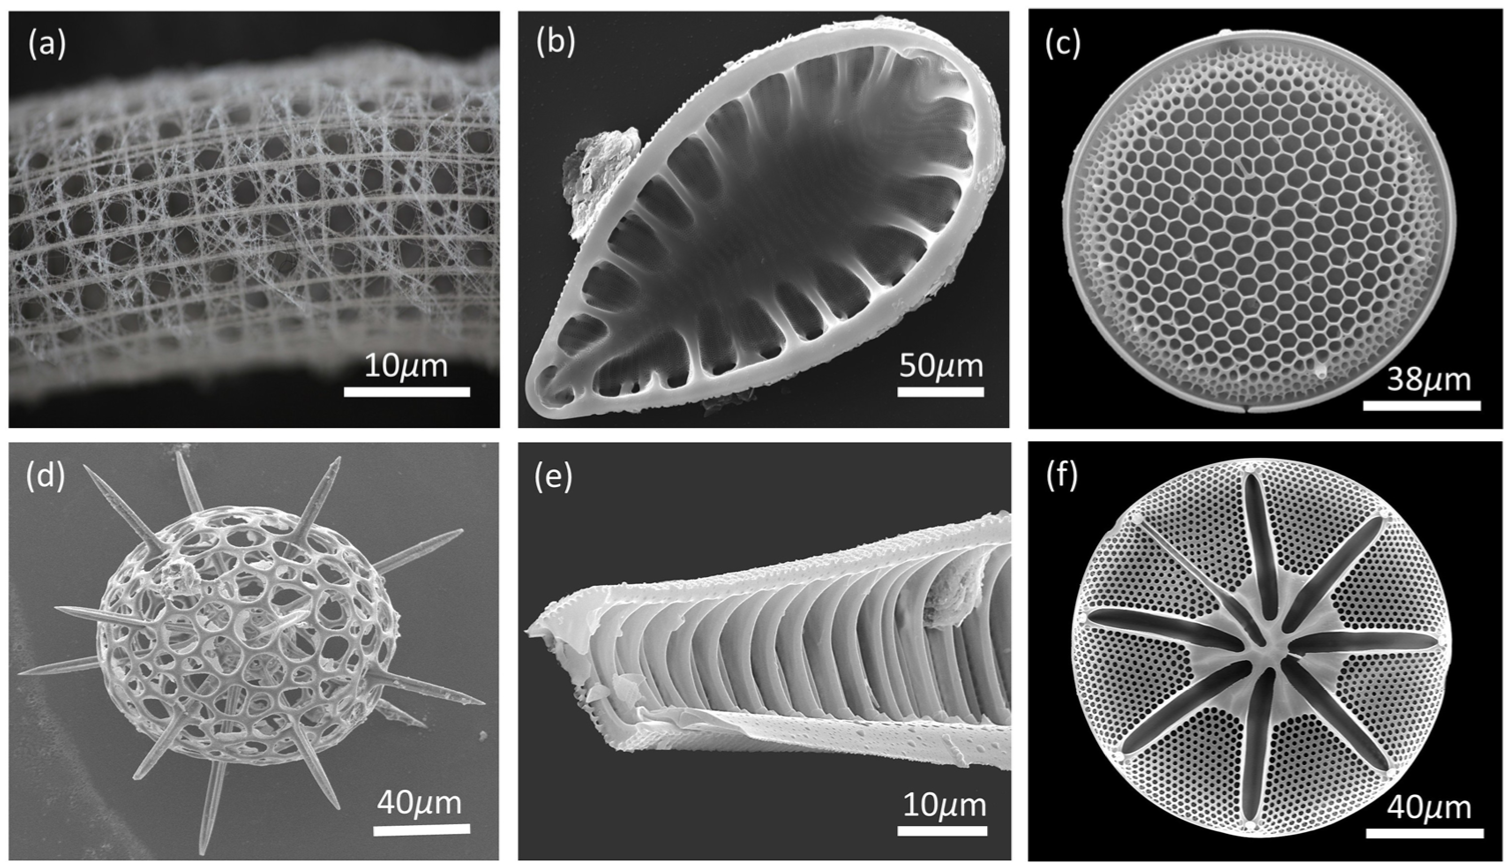
Inspiration of nature (© Alfred Wegener Institute Bremerhaven, used with permission). (a) Euplectella, (b) Surirella, (c) Thalassiosira, (d) Radiolaria, (e) Rhopalodia and (f) Asteromphalus.
Bio-inspired unit cells. (a) Honeycomb, (b) Asteromphalus, (c) Euplectella V1, (d) Euplectella V2, (e) Voronoi comb, (f) Voronoi rounded, (g) Radiolaria, (h) Rhopalodia (i) Surirella and (j) Trabecular.
Literature-driven and hybrid unit cells
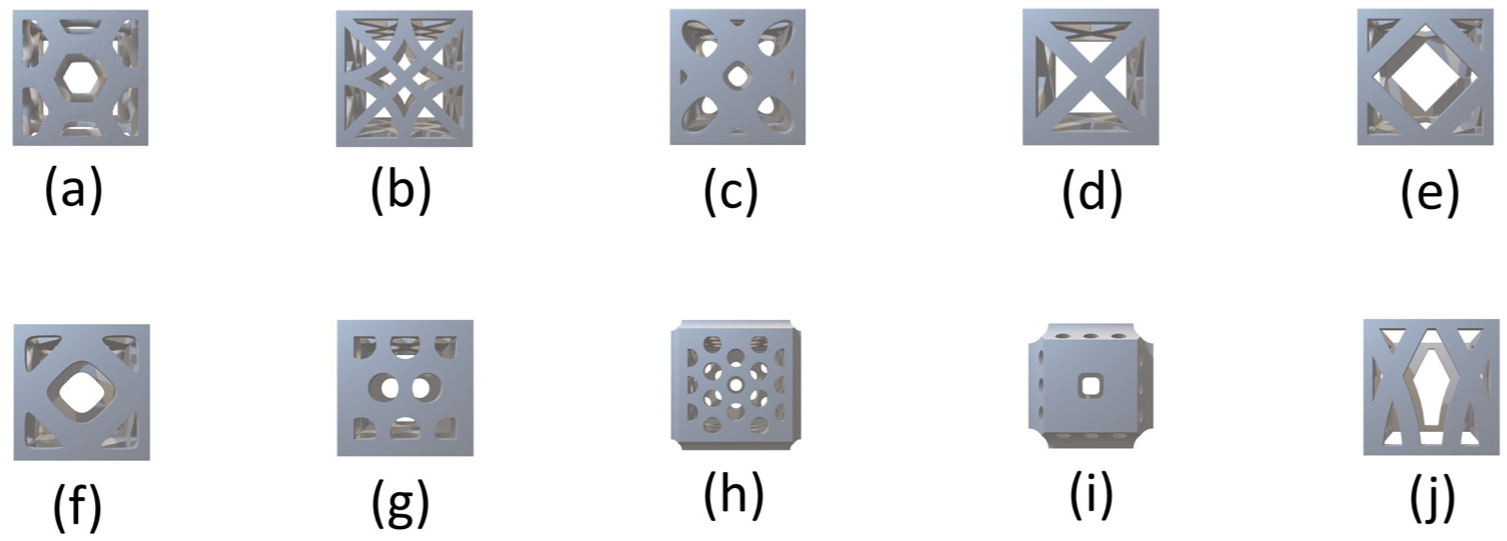
Apart from the 10 bio-inspired unit cells developed in Section Bio-inspired unit cells, additional custom unit cells were developed through modifications and combinations of bio-inspired unit cells, as well as insights drawn from existing literature. Applying and combining design principles of the Dodecahedron, 50 Polygon, 51 Prism, 52 Vintiles, 53 Octahedron 54 and Tesseract, 55 15 additional custom unit cells were built. For some unit cells, the areas between the struts were replaced by thickened surfaces (an additional ‘surface’ term was added at the end of the name for reference). Figure 5 shows the 15 unit cells.
Custom unit cells. (a) Dodecahedron V1, (b) Dodecahedron V2, (c) Polygon V1, (d) Polygon V2, (e) Prism V1, (f) Prism V2, (g) Prism V3, (h) Vintiles, (i) Rhombic dodecahedron, (j) Octahedron, (k) Tesseract, (l) Glass sponge V3, (m) Vintiles surface, (n) Tesseract surface V2 and (o) Tesseract surface V1.
All of the custom unit cells were developed using Synera. For the surface-based cells, the design approach was similar to that described for the bio-inspired unit cells. The strut-based unit cells are realised by a network of straight lines that are converted into struts with a constant diameter. The design is adapted by having continuous struts along the outer surfaces of the unit cell and/or ending at an outer surface of the unit cell so that adjacent surfaces of neighbouring cells are again identical and allow the creation of a regular lattice.
NTopology unit cells
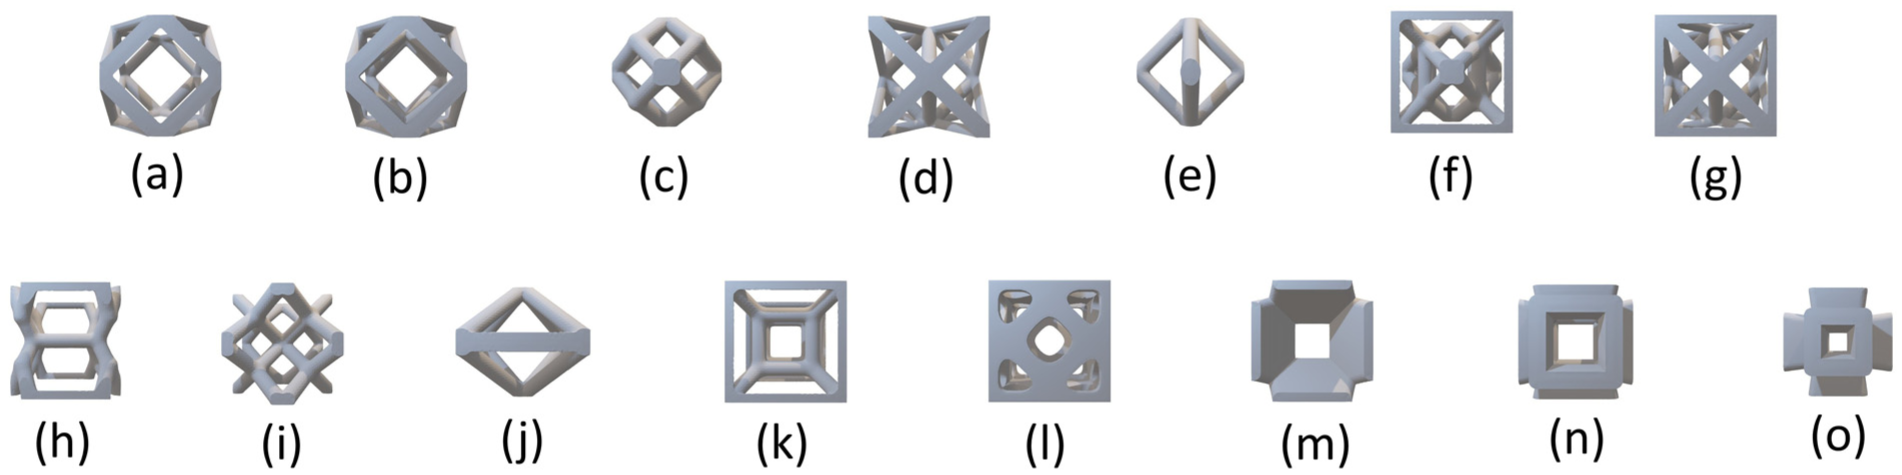
Sixteen unit cells were created using selected geometries available in nTop, aiming to enhance design diversity within the dataset. Here, the surface-based cells are Triply Periodic Minimal Surfaces (TPMS), and the strut-based unit cells are composed of rod-like elements interconnected in various orientations to form distinct lattice structures. Figure 6 shows the unit cells.
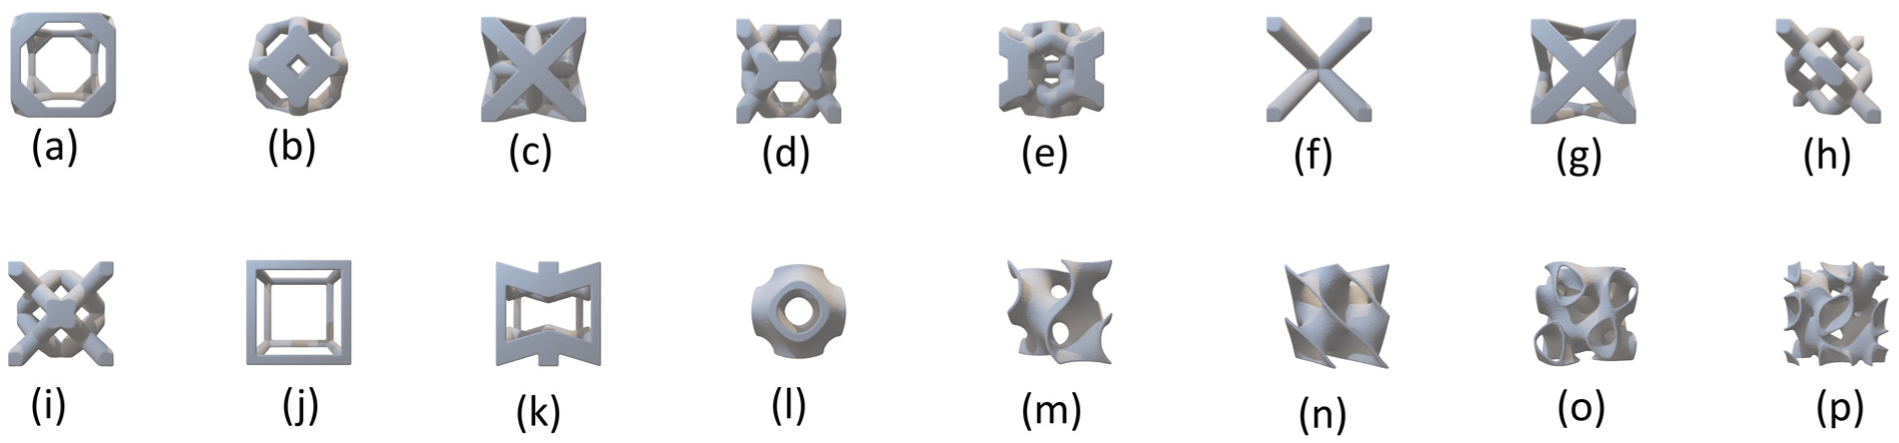
Pre-existing unit cells in nTopology. (a–k) belong to the strut-based unit cells and (l–p) belong to the TPMS unit cells. (a) Truncated cube, (b) Truncated octahedron, (c) Octet, (d) Kelvin cell, (e) Weaire-phelan, (f) Body centred cubic, (g) Face centred cubic, (h) Diamond, (i) Fluorite, (j) Simple cubic, (k) Re-entrant, (l) Schwarz TPMS, (m) Gyroid TPMS, (n) Diamond TPMS, (o) SplitP TPMS and (p) Lidinoid TPMS.
Selection of unit cells
In total, 41 distinct unit cells were constructed to serve as prospective data for the dataset generation. However, these unit cells are initially assessed by the requirements specified in Section Requirements of lattice structure for arthroplasty application. To check whether the constructed unit cells conform to the requirements of porosity, pore size and material thickness, the dependencies among the three properties were analysed.
Figure 7 shows the change in porosity and pore size over the material thickness exemplary for Honeycomb, Octahedron and Gyroid unit cells. Based on the plots in Figure 7, an individual relationship exists between the material thickness and both the porosity and pore size for each unit cell. The target range for porosity (right y-axis, green area) and pore size (left y-axis, blue area) is highlighted, while the minimum material thickness is marked by the black dashed line (parallel to the y-axis). The relationship plots for the rest of the unit cells can be found in the Supplemental Material (Subsection A.1). The relationship between porosity and material thickness can be mathematically described by a function, which is defined as follows
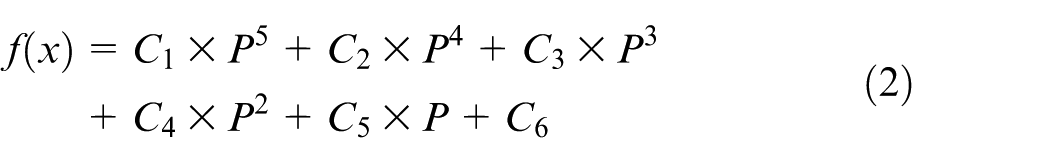
where
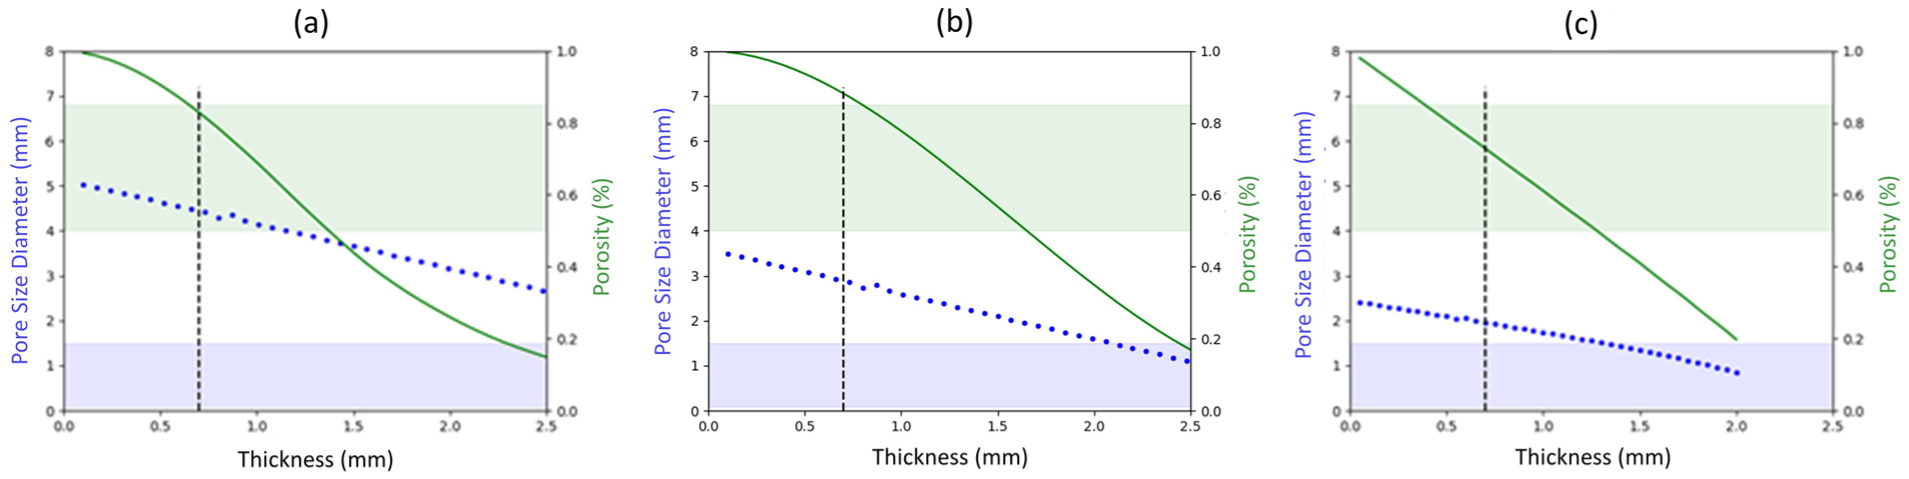
Relationship between material thickness, porosity and pore size for exemplary three different unit cells: (a) Honeycomb, (b) octahedron and (c) gyroid.
Ideally, a unit cell with its properties falling in both the target ranges of a porosity between 50% and 85% and a pore size between 0.2 and 1.5 mm would be the best option. However, none of the three unit cells referred to in Figure 7 can fulfil the pore size requirement for the given material thickness, especially at the lower thickness range. This is also applicable to most of the designed unit cells. Therefore, since porosity is more pertinent to the current approach, and pore size rarely falls within the desired target range, the focus was placed on conforming to the porosity requirements.
Further, manufacturability is also an important aspect. A unit cell design lacking internal structure is generally not recommended. During the additive manufacturing process, the internal structure prevents deformation and ensures the structural integrity of the lattice during printing. Without such internal structure, there is a higher risk of defects such as warping, collapse, or incomplete fusion of the material, which can compromise the quality and reliability of the final product.
However, most of the bio-inspired unit cells consist only of an outer frame. At the same time, many bio-inspired design features could only be transferred to unit cells to a limited extent due to the combination of their size and the manufacturing-related constraints, such as a minimum material thickness
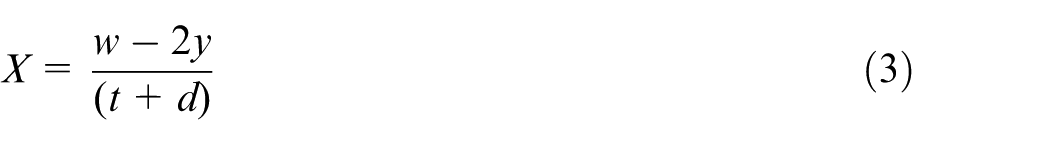
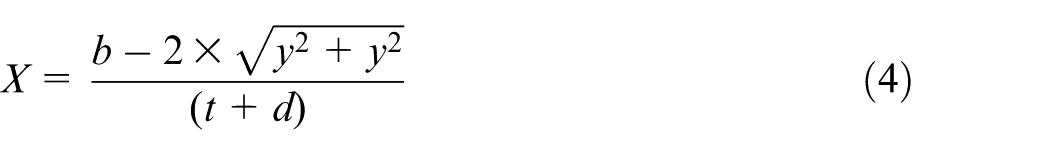
where the minimum size of a design feature
Schematic diagram for determining the maximum number with design features per unit cell side for the arrangement along a (a) side edge or a (b) side diagonal.
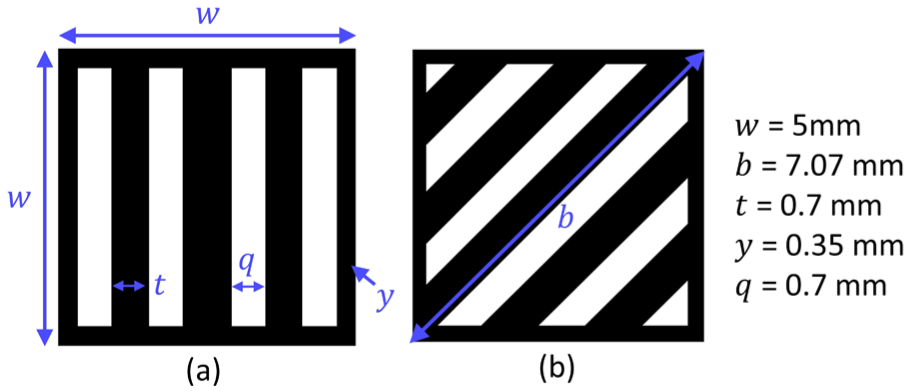
Following the evaluation of each unit cell against the defined porosity and manufacturability requirements, a total of 16 unit cells were selected, as illustrated in Figure 9.
Selected 16 lattice structures used for the database.
Dataset generation
The AI tool required a substantial dataset for practical training, prompting the generation of numerous data points that captured a range of lattice structures and their corresponding performance metrics. Based on the chosen unit cells, an extensive dataset was subsequently created.
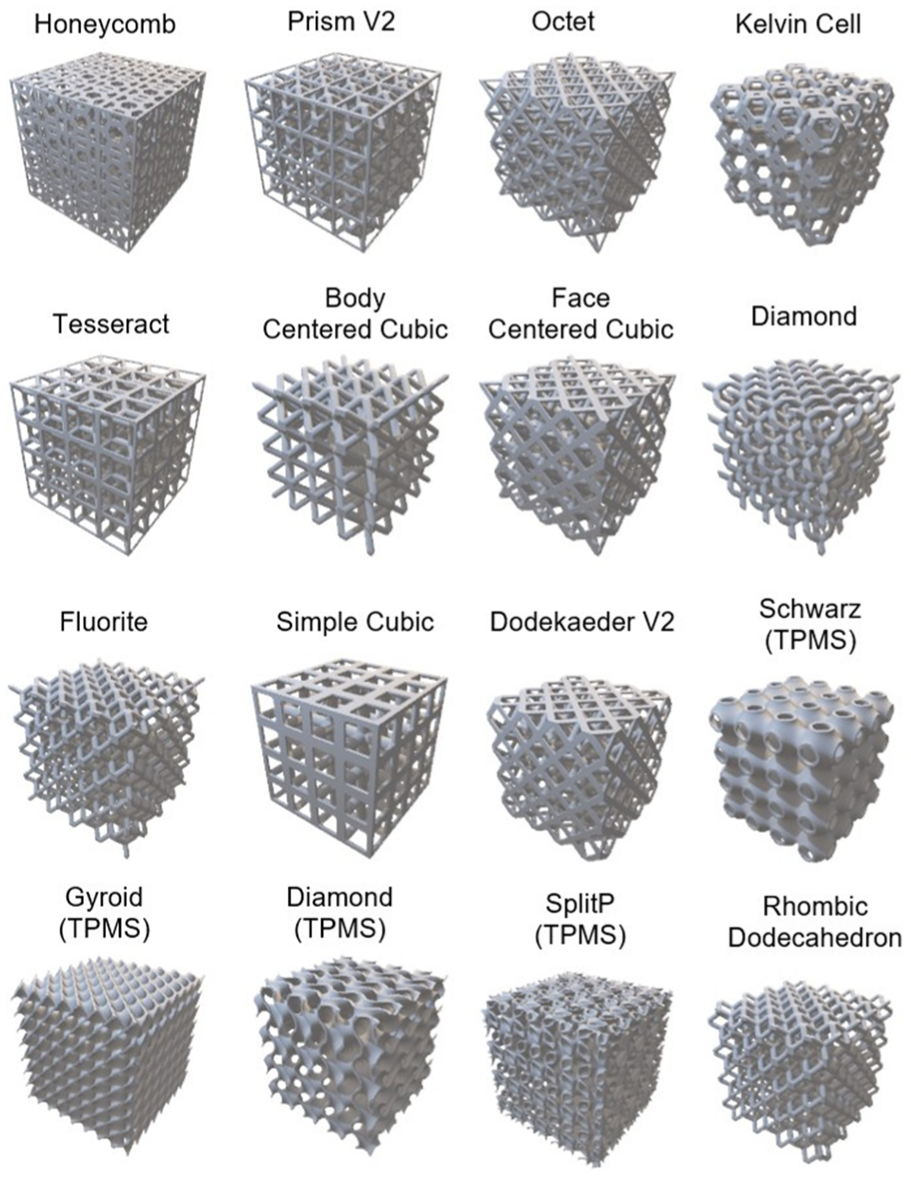
As mentioned in Section Selection of unit cells, 16 unit cells were selected to create lattice structures for the dataset. Each lattice structure is composed of a single unit cell and can be modified through four variables: porosity and rotations around the x-axis, y-axis and z- axis, as outlined in Table 3. These variations were further extended by incorporating boundary conditions corresponding to different body weights. As a result, around 2560 variants were generated for each unit cell, leading to a total of 40,960 data points.
Overview of the variables to create lattice variants.
Lattice designs
In this study, each lattice structure was generated by modifying a single unit cell across a defined range of porosities and spatial orientations. As stated in Table 3, porosity varied from 52% to 80% in steps of 4%, producing eight distinct porosity levels. Additionally, the unit cells were rotated around the x-axis, y-axis and z-axis in 15° steps from 0° to 45°, yielding four rotational states per axis. These variations in porosity and three-dimensional orientation significantly influence the mechanical properties and behaviour of the lattice structures. This systematic approach resulted in 512 unique configurations per unit cell, capturing a broad spectrum of structural responses for subsequent analysis.
Load case
Variations in patient body weight impose differing loads on the hip endoprosthesis, influencing the performance and behaviour of the integrated lattice structure in distinct ways. To accurately assess these effects, it is essential first to determine the forces and moments acting on the lattice structure. This step is critical for conducting FE analysis. Consequently, the scope and limitations of the study must be defined beforehand.
The load scenarios considered in this study are derived from the standardised conditions described by Bergmann et al. 56 Specifically, only the walking load case was addressed, where the AVER75 load profile was utilised in place of the HIGH100 loads. AVER75 load represents a patient of 75 kg body weight with average load levels, and HIGH100 represents a linear extrapolation of AVER75 for 100 kg body weight. Due to the dynamic nature of the forces during a gait cycle, the maximum force magnitude is simplified to correspond to the maximum possible static load. Additionally, any values retrieved from Ref. 56 are converted to ensure that the loads applied to the femoral head in the femur-based coordinate system are appropriately mapped to the endoprosthesis-based coordinate system, as these forces will influence the integrated lattice structures. The conversion process involves the following steps, each of which is detailed in the subsequent subsections:
Calculation of load factors independent of body weight
Transformation of loads from the femur-based coordinate system to the endoprosthesis-based coordinate system
Determination of the position of the endoprosthesis within the femur and the corresponding region of the lattice structure within the endoprosthesis
Evaluation of the internal forces at the uppermost contact plane of the solid part of the endoprosthesis and the lattice region within it
Scaling of load factors based on the ratio of cross-section areas of the femur and the integrated lattice structure at the contact plane
Load factors independent of the body weight
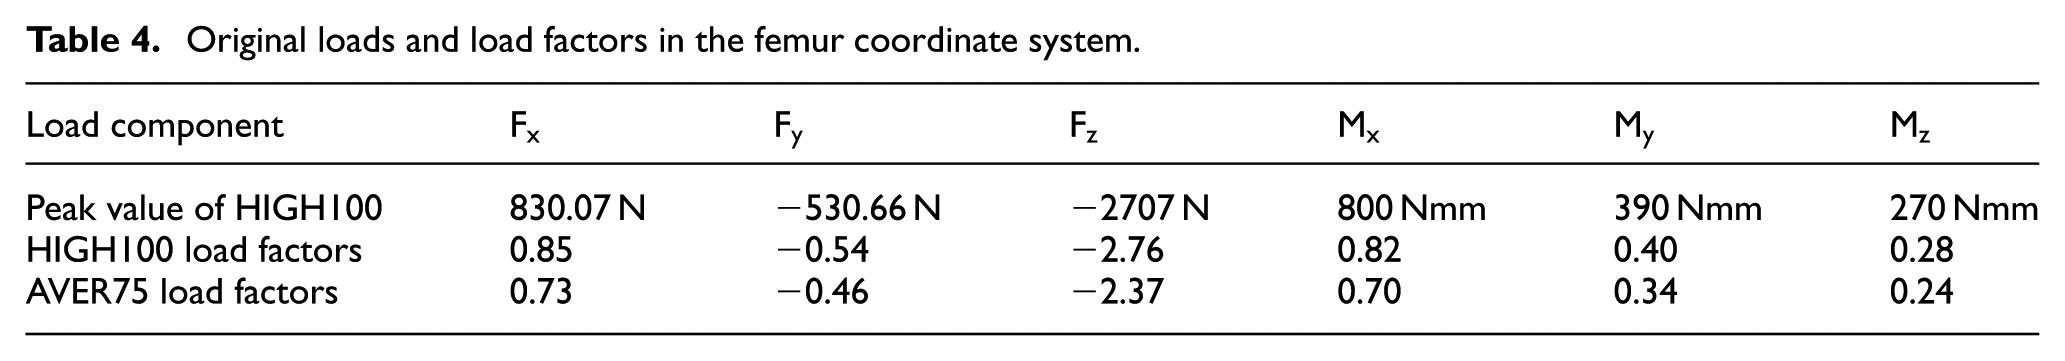
The maximum value of HIGH100 shown in the first row of Table 4 was divided by the body weight of 100 kg and the acceleration due to gravity (9.81 kg/m2) to calculate HIGH100 load factors given in the second row. These load factors were further multiplied by a factor
Original loads and load factors in the femur coordinate system.
Transformation of loads
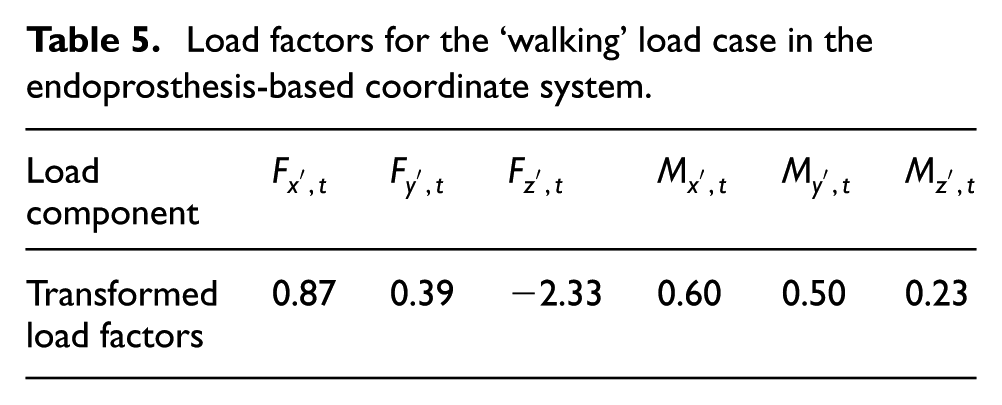
Then, the loads were transferred from the femur-based coordinate system into the endoprosthesis-based coordinate system. Comparing the femur and endoprosthesis shaft axis used in this study results in the angles α x = 2.5°, α y = 1.5°, and α z = −13.19°. The transformation is performed according to the transformation explained in Ref. 56 This transformation leads to the transformed load factors shown in Table 5. Also, a boundary condition similar to that of Refs13,57 was implemented in this study, where the lower part of the femur bone was clamped as shown in Figure 10(b).
Load factors for the ‘walking’ load case in the endoprosthesis-based coordinate system.
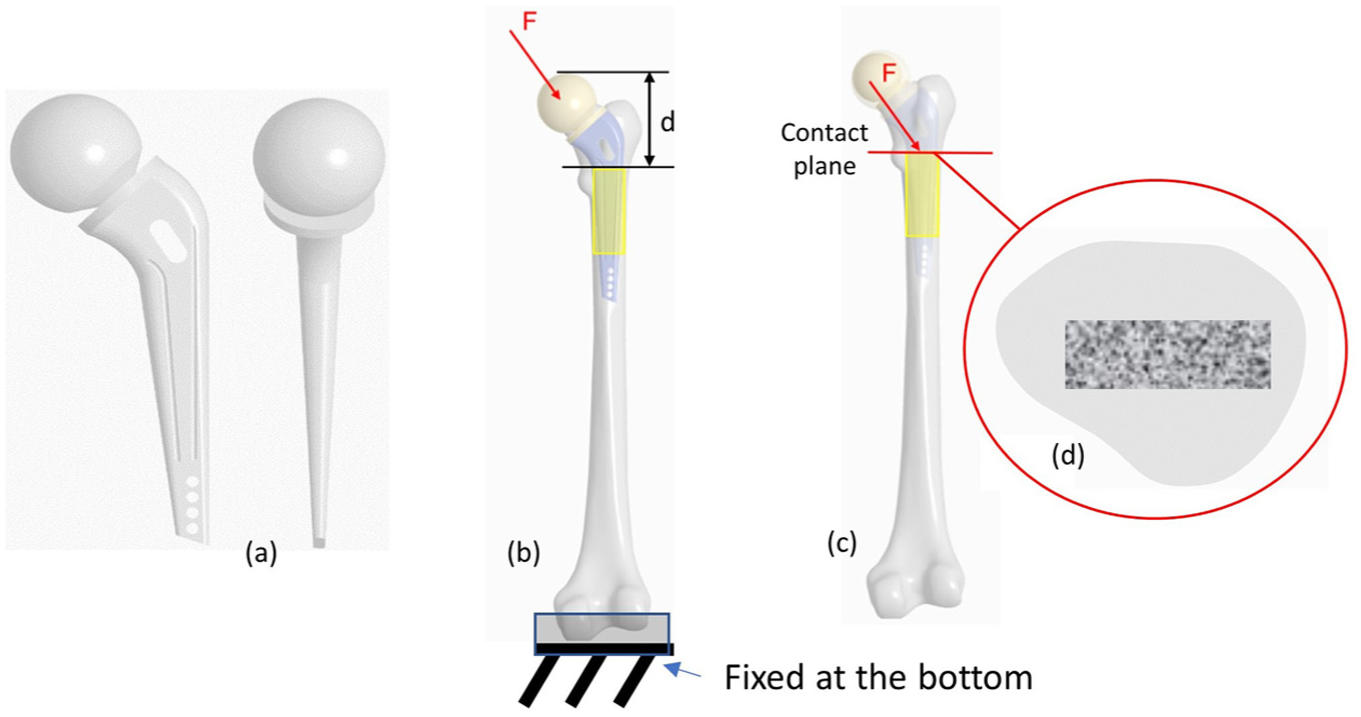
(a) Endoprosthesis model, (b) load application point for the initial load case applied to the entire bone, (c) illustration of the contact plane where the transformed loads are applied and (d) cross section of the femur with integrated endoprosthesis at the contact plane.
Position of the endoprosthesis in the bone
For the length of the femur, it is assumed that the bone takes up about 27% of the total body height. 58 Since the average height of a person in Germany is 1733 mm (women 1662 mm and men 1803 mm 59 ), this results in a femur length of just under 465 mm. For the endoprosthesis, it is assumed that it takes up one-third of the total femur length and at the same time has a prosthetic head similar to the femoral head. This results in a height of 154 mm for the endoprosthesis and a maximum width and depth of 61 and 41 mm, respectively. Figure 10(a) shows the simplified endoprosthesis model used in this study.
The endoprosthesis was aligned with the femoral head and then rotated by the angles
Loads at the contact plane
To obtain the applied loads on the lattice structure, the loads acting on the uppermost contact plane shown in Figure 10(c) must be calculated. The internal forces and moments acting on the endoprosthesis play an important role in the calculation of loads at the contact plane. These internal forces and moments are illustrated in Figure 11.
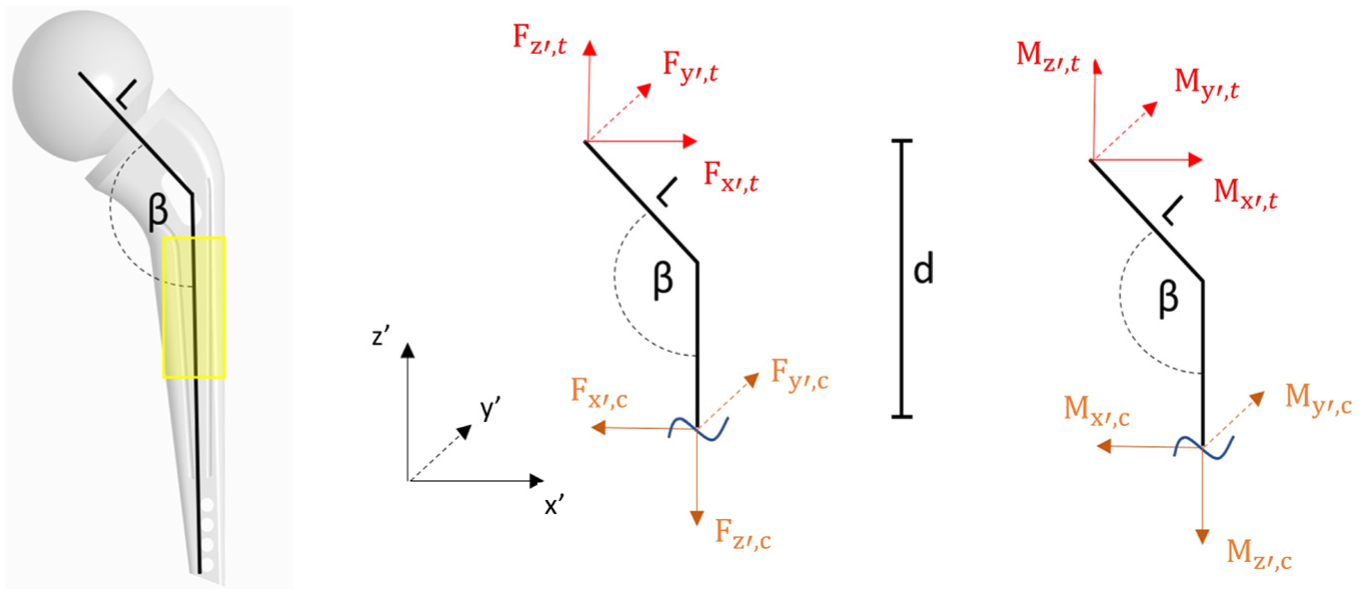
Illustration of the internal forces and moments acting on the endoprosthesis.
Further,


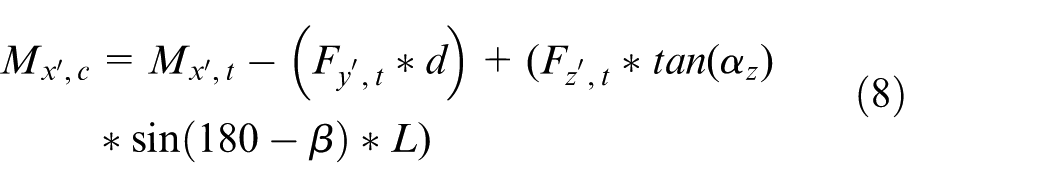
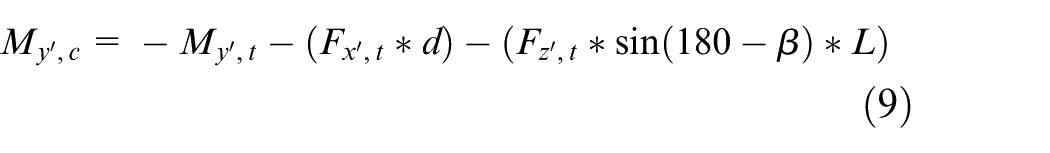
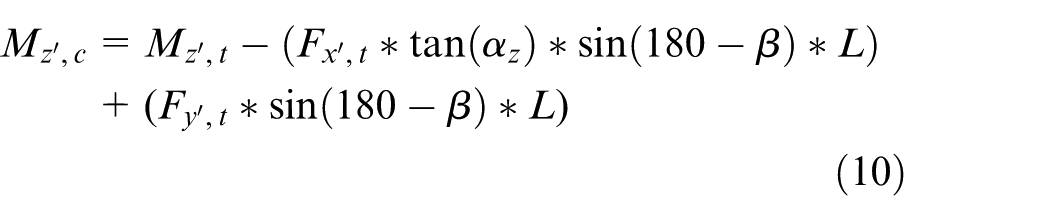
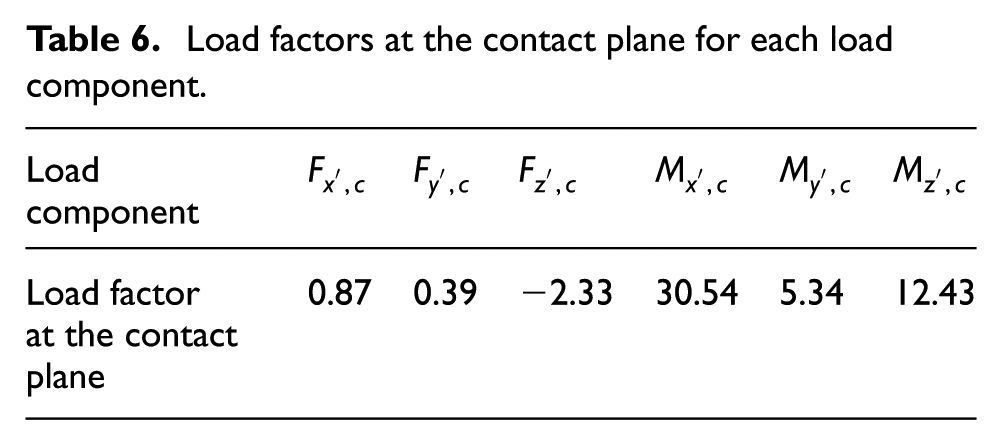
where L and β have the values of 43.86 mm and 134.21°, respectively. The calculated load factors at the contact plane for each load component are presented in Table 6.
Load factors at the contact plane for each load component.
Scaled loads based on the cross-section
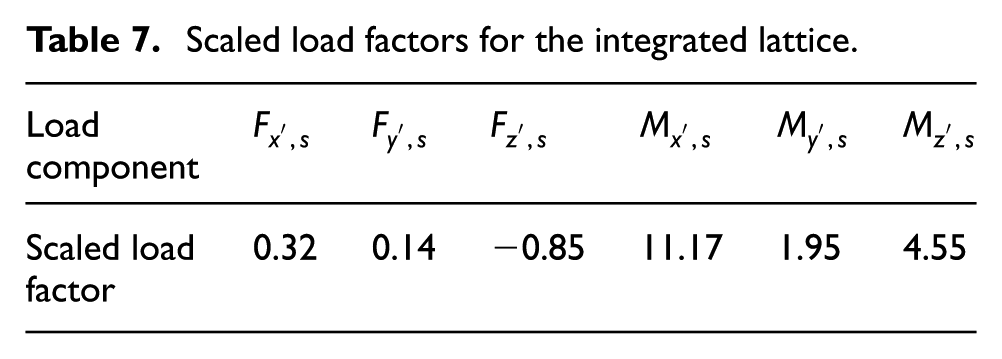
The loads acting at the contact plane are then scaled to the cross-section of the lattice structure integrated within the endoprosthesis. At the contact plane, the cross-sectional area of the femur and the cross-sectional area of the integrated lattice structure are 1081 and 400 mm2, respectively. This results in a scaling factor of 0.37. Finally, the scaled load factors are multiplied by the body weight and acceleration due to gravity to determine the loads for a given body weight (represented with subscript s). The scaled load factors are given in Table 7.
Scaled load factors for the integrated lattice.
FE analysis and homogenisation
FE analysis was performed to calculate the maximum displacement and maximum stress of each lattice structure variant of each unit cell based on the walking load case presented in Section Load case and to estimate the lattice structure’s performance. Figure 12 shows the schematic diagram of the loads and boundary conditions applied to the lattice structure.
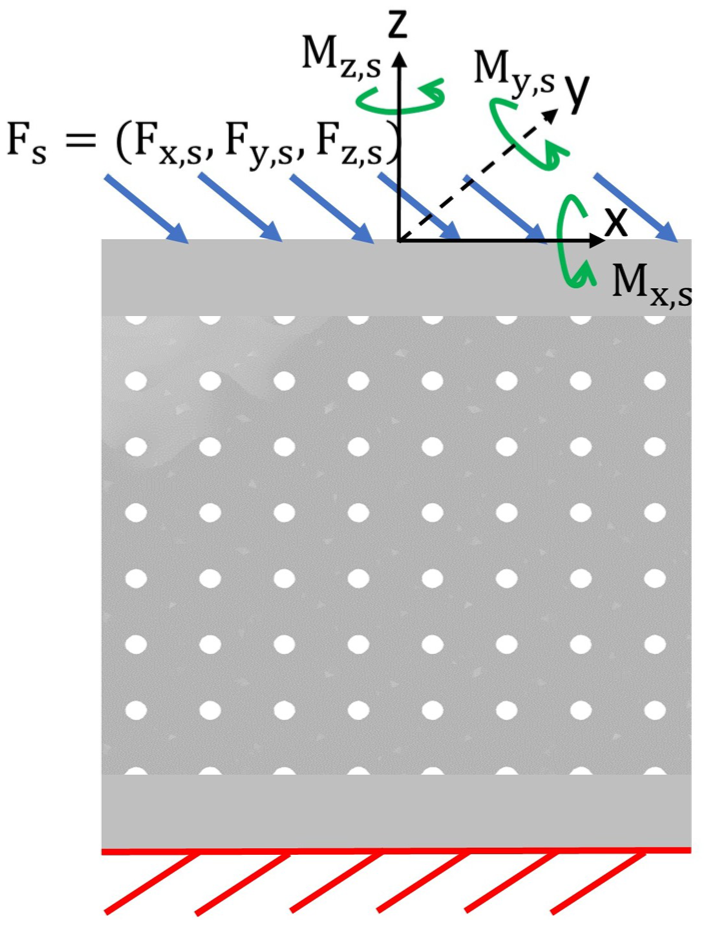
Schematic of the FEM setup.
The loads were distributed on the top surface of the lattice structure, while the bottom surface was constrained entirely. The lattice structure was loaded with scaled force
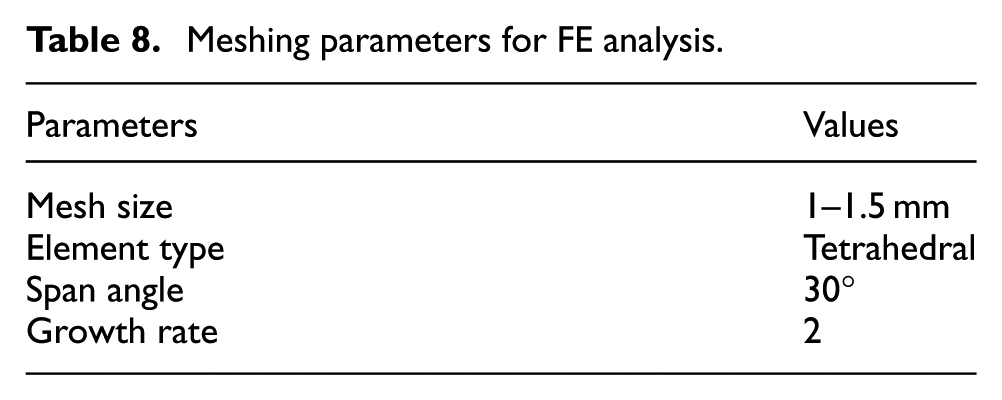
Given that nTop software supports end-to-end FE analysis, the mesh was generated within the same environment, utilising its advanced meshing capabilities to achieve an optimal balance between simulation accuracy and computational efficiency. Key meshing parameters were systematically adjusted to ensure high-quality results. The mesh size ranged from 1 to 1.5 mm, depending on the complexity of the geometry. Lattice structures with higher intricacy require finer mesh sizes to capture detailed features more accurately. Tetrahedral elements were employed for their suitability in meshing 3D geometries. The span angle was set to 30° to enhance refinement along curved surfaces, ensuring the preservation of geometric details. Additionally, a growth rate of 2 was selected to control the transition between adjacent element sizes, promoting mesh uniformity while avoiding unnecessary computational overhead. This thoughtful configuration enabled robust and efficient simulations, with a detailed overview of the selected meshing parameters summarised in Table 8.
Meshing parameters for FE analysis.
Further, the homogenisation method was used to calculate the homogenised elasticity tensor of lattice structures. To find the components of the homogenised elasticity tensor using the periodic boundary conditions, six load cases are required. In each load case, one strain component is prescribed while the others are set to zero.60,61 The elastic constitutive law for a homogeneous material is shown in equation (11) 62
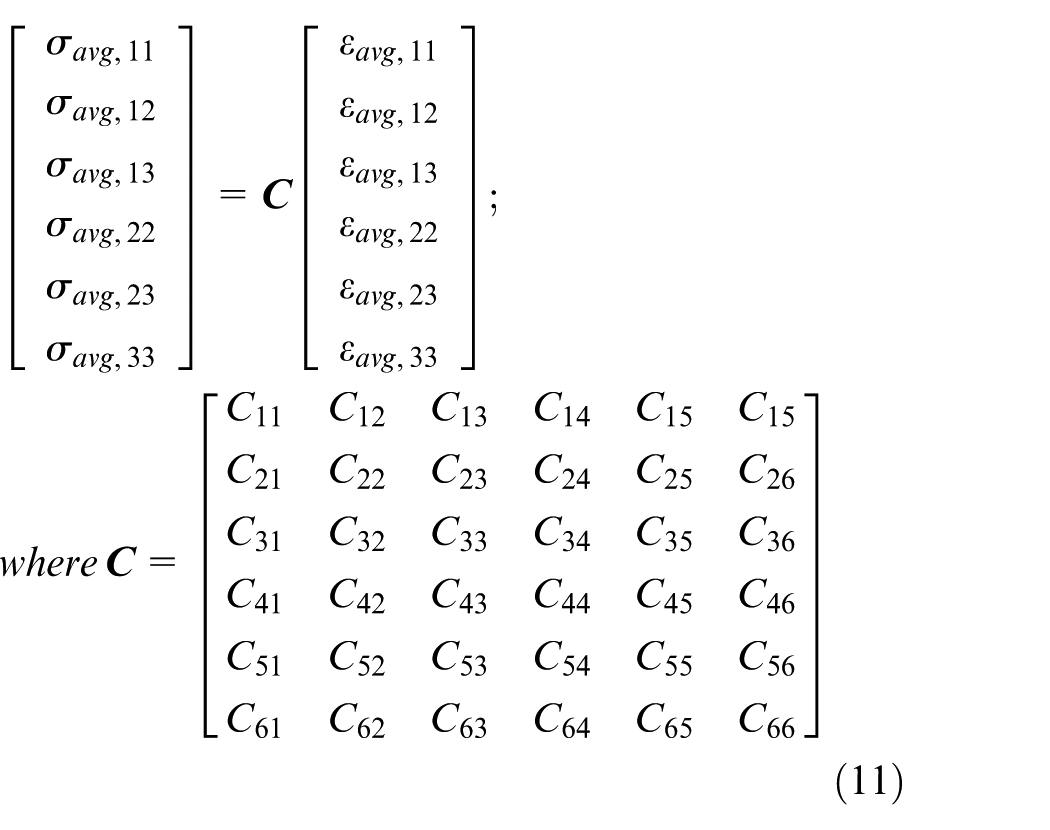
where
Upon further analysis, nine key material constants defining the components of the orthotropic material tensor are identified, capturing the macroscopic mechanical properties of the lattice structure. These constants:
Printability
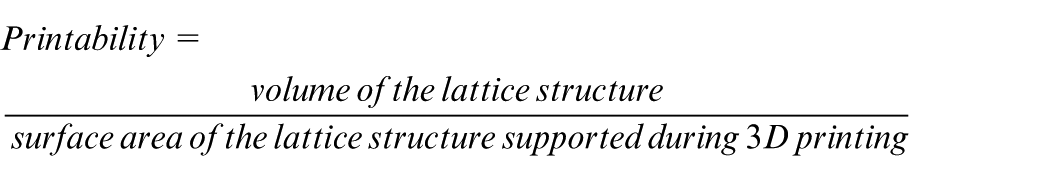
Lattice structures differ in pore and strut sizes, leading to varying amounts of support needed during 3D printing. As the cost of manufacturing rises with increased support requirements and design complexity, it becomes essential to assess the manufacturing efficiency of these structures. This efficiency was quantified by their printability, which considers both the material usage and structural feasibility of fabrication. Printability is defined as the ratio of the lattice structure’s volume to the surface area requiring support, providing insight into how efficiently a lattice can be produced with minimal support structures. A higher printability value indicates a design that is more self-supporting, reducing material waste and post-processing efforts. In comparison, a lower value suggests increased dependence on external supports, leading to higher costs and potential geometric inaccuracies.
This metric was calculated using nTop software, which enabled precise evaluation of support requirements based on predefined process parameters. The printability, as expressed in equation (12), serves as a key factor in optimising lattice designs for cost-effective and structurally viable additive manufacturing.
Finalised dataset structure
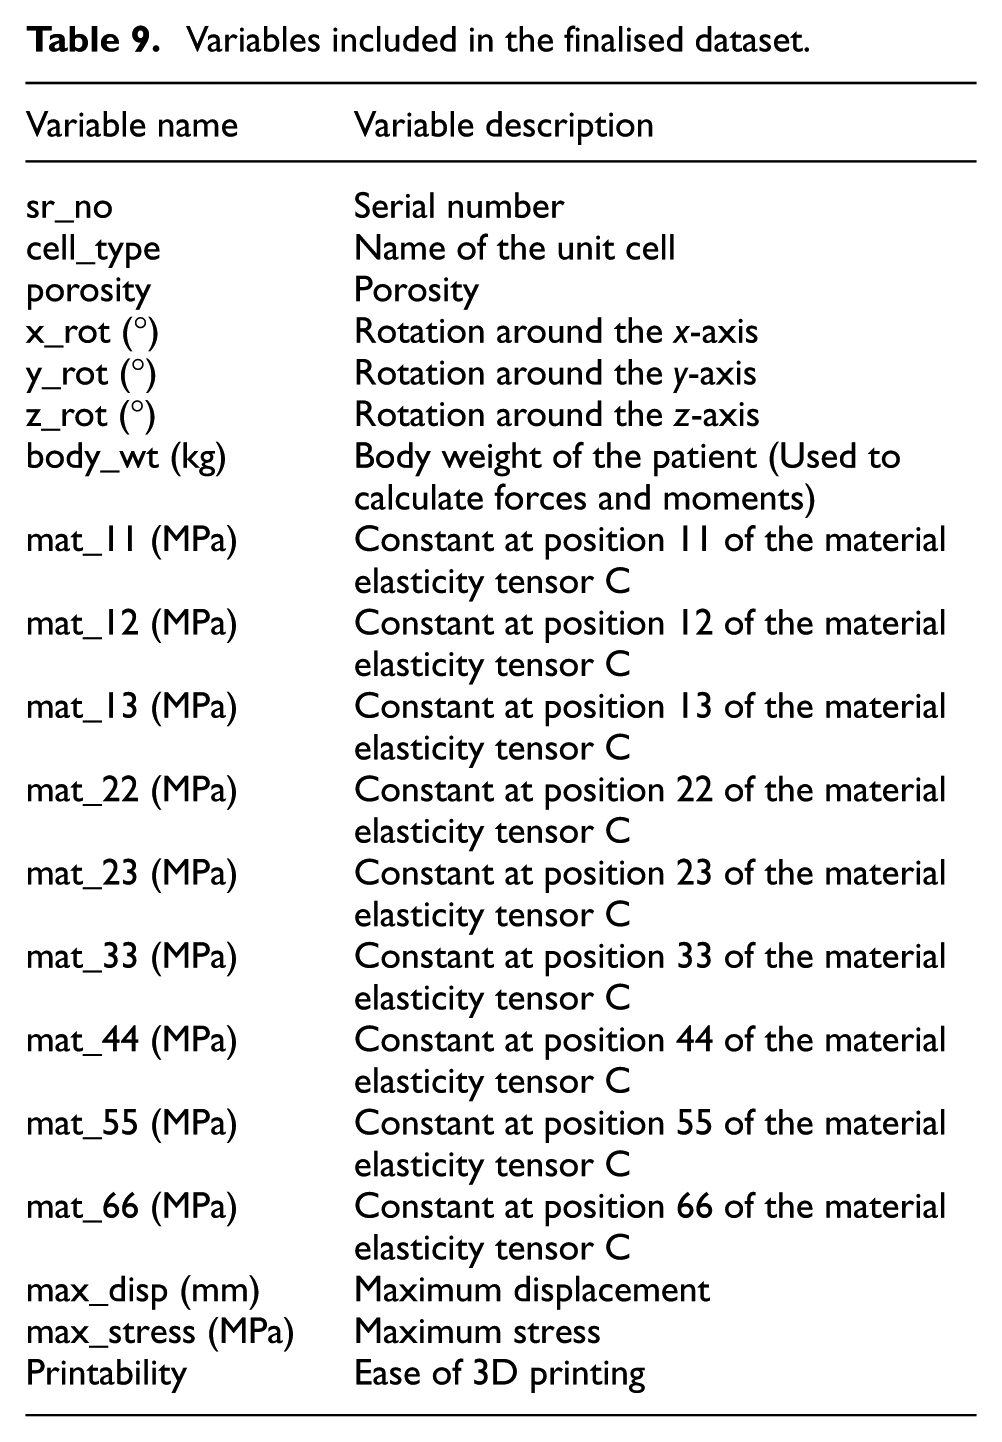
The dataset contains data points, each corresponding to a distinct lattice structure variant, capturing design, medical and other relevant variables. The design variables include unit cell type and orientation, specifically rotations around the x-axis, y-axis and z-axis. The medical variables comprise factors such as porosity and patient body weight as described in Section Load case. To assess mechanical performance, the resulting maximum stress and displacement values were used in combination with the elasticity tensor as described in Section FE analysis and homogenisation. Additionally, each lattice variant, as discussed in Section Printability, was assigned a ‘printability’ variable, reflecting the ease with which that specific configuration can be manufactured via 3D printing. Table 9 shows all the variables included in the dataset.
Variables included in the finalised dataset.
To generate this comprehensive dataset, the computational process was carried out using two high-performance computing systems, each equipped with AMD EPYC 7302 16-Core Processors (3.00 GHz, two processors) and 256 GB RAM. Python scripts were developed and executed in VS Code IDE, requiring 160 man-hours for setup. A total of 112 computational routines were run to generate 40,960 data points. The entire process consumed 1350 computing hours on the specified systems, ensuring efficient and robust dataset generation to support the subsequent training of ML models.
While the dataset incorporates a range of relevant parameters, it is important to note that the AI tool currently relies on generalised inputs such as body weight and target porosity. The direct integration of patient-specific imaging data, such as CT-based bone morphology and density distribution, remains a key area for future development to achieve full personalisation. Furthermore, validating computational outcomes against experimental data is essential to establish the robustness and reliability of computational models. As this study is based entirely on artificially generated data, physical experiments were not conducted at this stage. Therefore, direct experimental validation lies beyond the current scope. Future work will focus on integrating experimental testing data to enable a more comprehensive evaluation of the proposed approach under real-world conditions. These efforts will form a critical foundation for translating the digital design methodology into clinically viable applications.
Development of the AI tool
This section outlines the development of an AI tool designed to recommend optimal lattice structures for endoprostheses. The tool is built upon ML models, beginning with the definition of relevant input and output variables. Multiple ML models were developed and systematically evaluated to assess their performance. The most effective model, based on these evaluations, was selected and integrated into the final AI tool. Furthermore, the entire design process was automated and hosted within the Synera software, enabling streamlined endoprosthesis design.
Definition of input and output variables
The ML models were developed to recommend the most appropriate unit cell type and cell orientation for generating a lattice structure that fulfils specific user requirements. In this study, 14 variables were used as inputs to the ML model, including patient’s body weight (body_wt), porosity of unit cell (porosity), mechanical performance metrics such as maximum stress (max_stress) and maximum displacement (max_disp), printability of unit cell (printability), and material properties of lattice structure, represented by nine material constants (mat_11, mat_12, mat_13, mat_22, mat_23, mat_33, mat_44, mat_55 and mat_66). The model outputs consist of four variables essential for generating an optimal lattice structure: the unit cell type (cell_type) and its orientation in the design space, defined by rotations around the x-axis (x_rot), y-axis (y_rot) and z-axis (z_rot). The required material thickness for constructing the corresponding lattice structure can be determined using the porosity value and the appropriate formula based on the predicted unit cell type.
To effectively train an ML model, the raw dataset was first transformed into a structured format suitable for algorithmic interpretation. This pre-processing involved normalisation of all numerical variables to ensure uniform scaling, which promotes stable and efficient model learning. Categorical variables were encoded, and input and output variables were organised accordingly. Following pre-processing, 90% of the data was reserved for training, while the remaining 10% was reserved for model validation. After pre-processing, the training dataset is represented as:

where
Exploration of ML models
As the orientation of the unit cell is defined by three numerical variables and its type by one categorical variable, the ML model is required to handle both regression and classification tasks. Neural Networks (NN) are well-suited for modelling complex, non-linear relationships among input variables and can be adapted to a variety of tasks with appropriate tuning. Decision Tree (DT) is also a strong choice, particularly for structured data, as it naturally handles both numerical and categorical variables with minimal pre-processing. In contrast, supervised ML models like linear regression and support vector machine (SVM) with linear kernels are often less effective for structured datasets with variables having non-linear relationships. 63 Therefore, to ensure optimal performance, only NN-based and DT-based models were explored in this study.
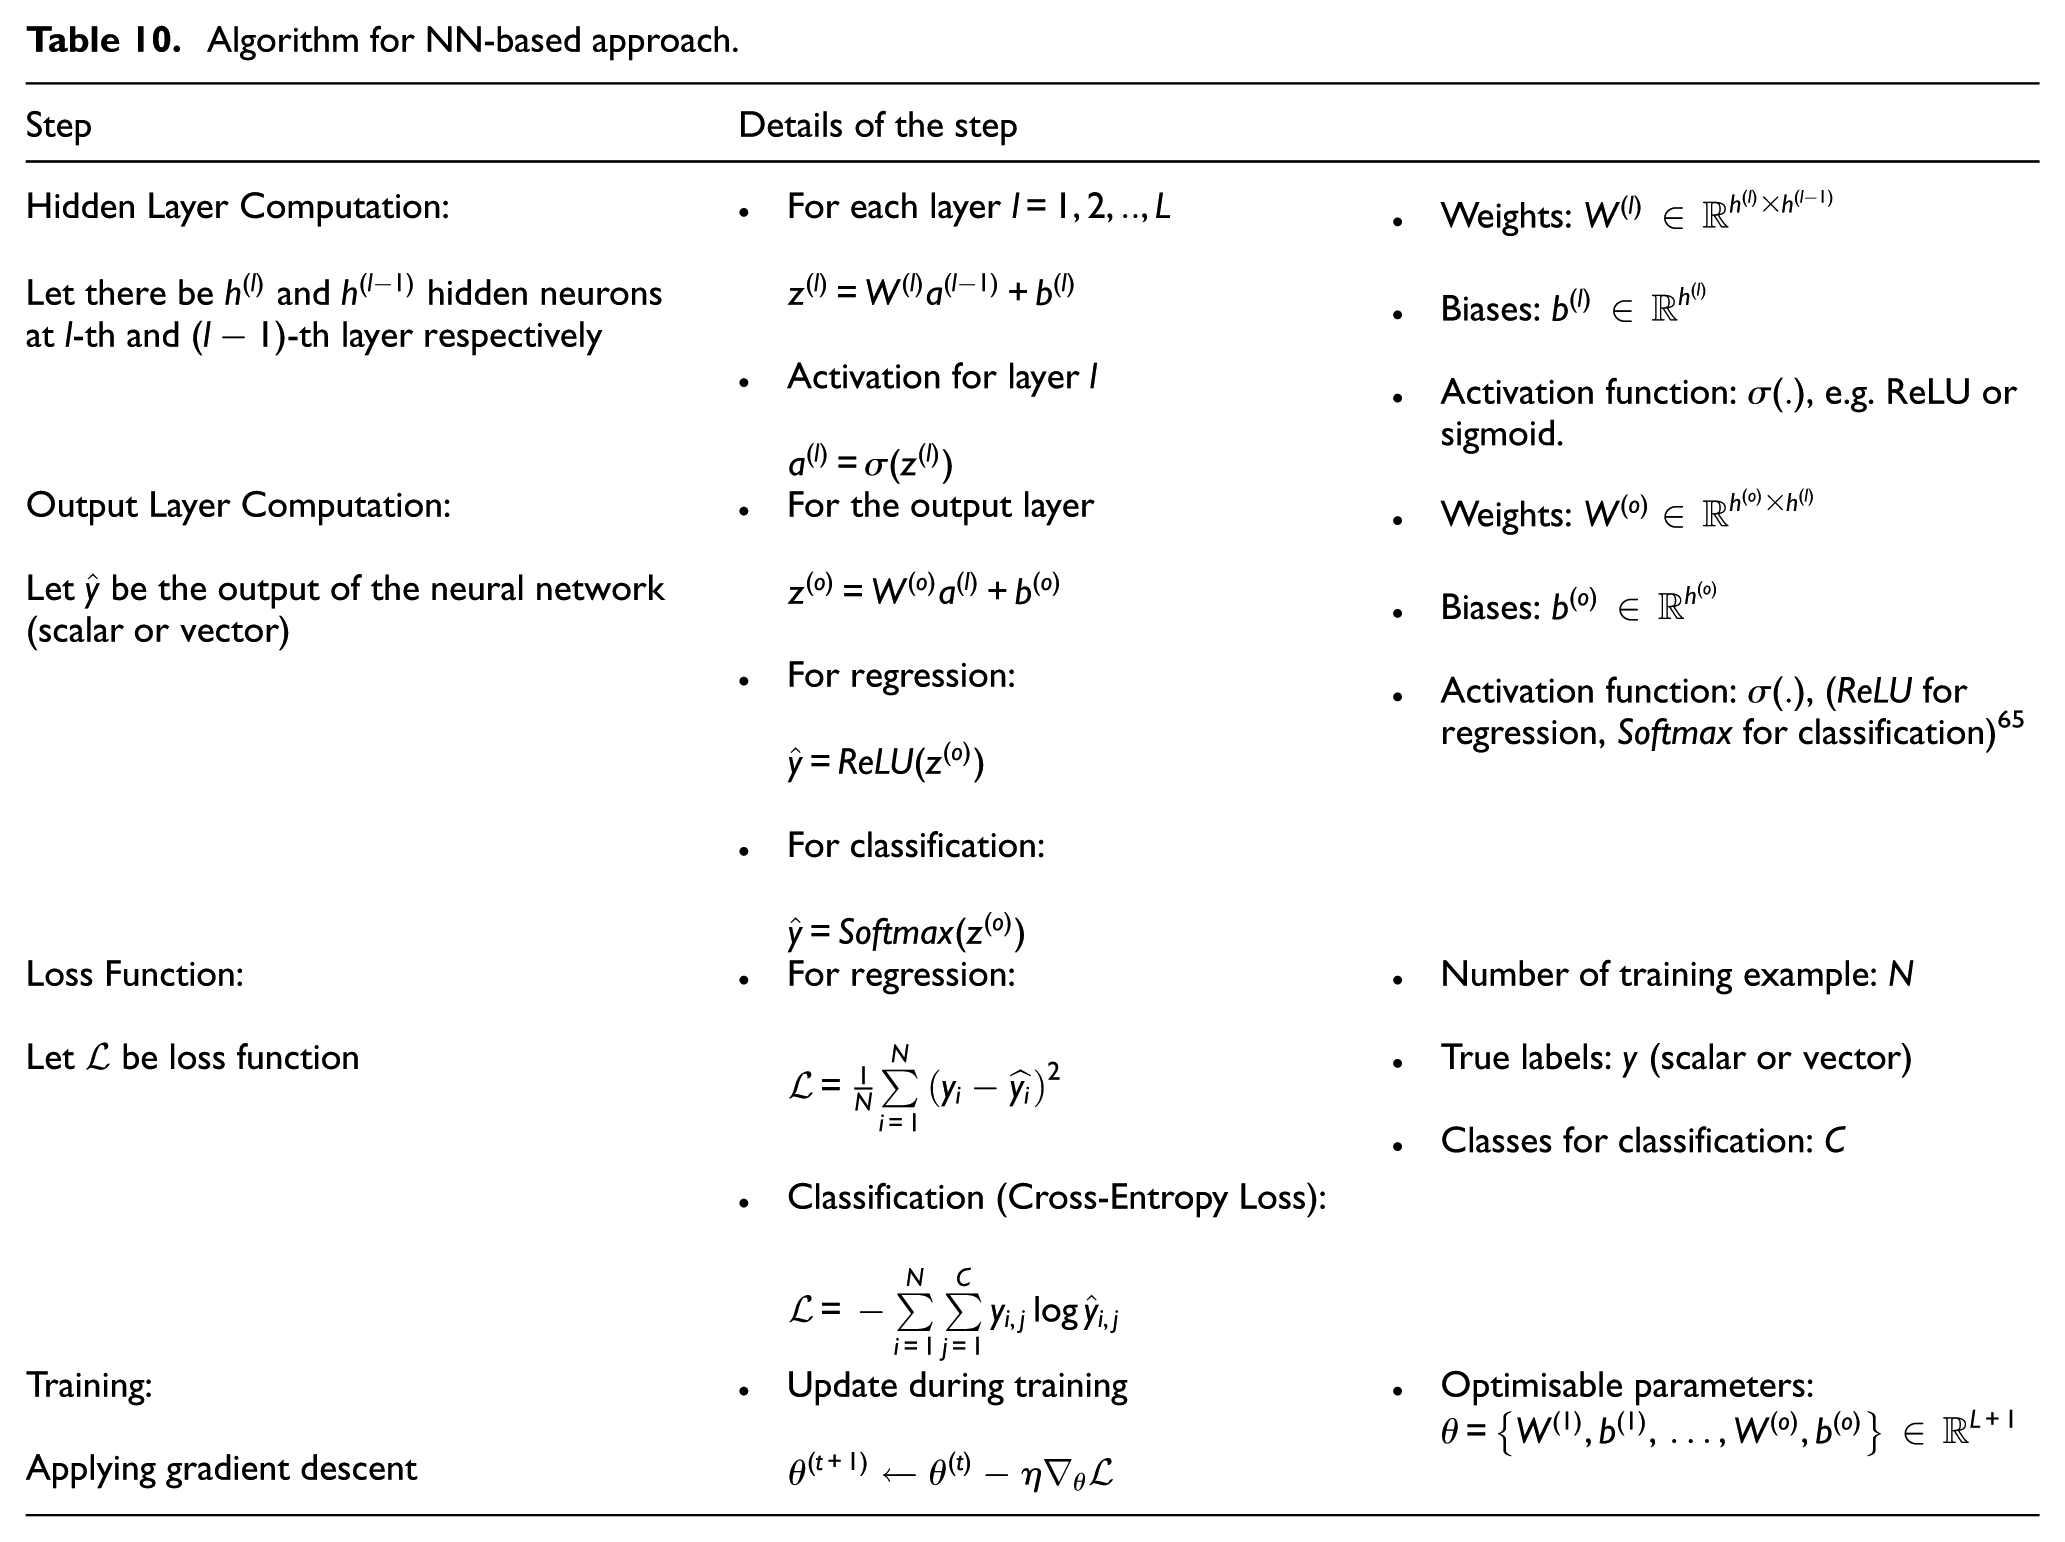
Table 10 provides a streamlined overview of the NN-based approach implemented in this study. They summarise the key stages involved in model development, including the implementation of hidden and output layers, selection of appropriate loss functions and the overall training strategy. 64 A simple neural network model, referred to as NN1, was initially developed using only dense layers. As illustrated in Figure 13(a), the architecture comprises one input layer, five hidden layers with 64, 128, 256, 128, and 64 neurons, respectively, and a single output layer. This single output layer was configured to perform both regression and classification tasks. To enable classification, the categorical cell type variable in the dataset was one-hot encoded, replacing it with 16 new columns, each representing a distinct unit cell type.
Algorithm for NN-based approach.
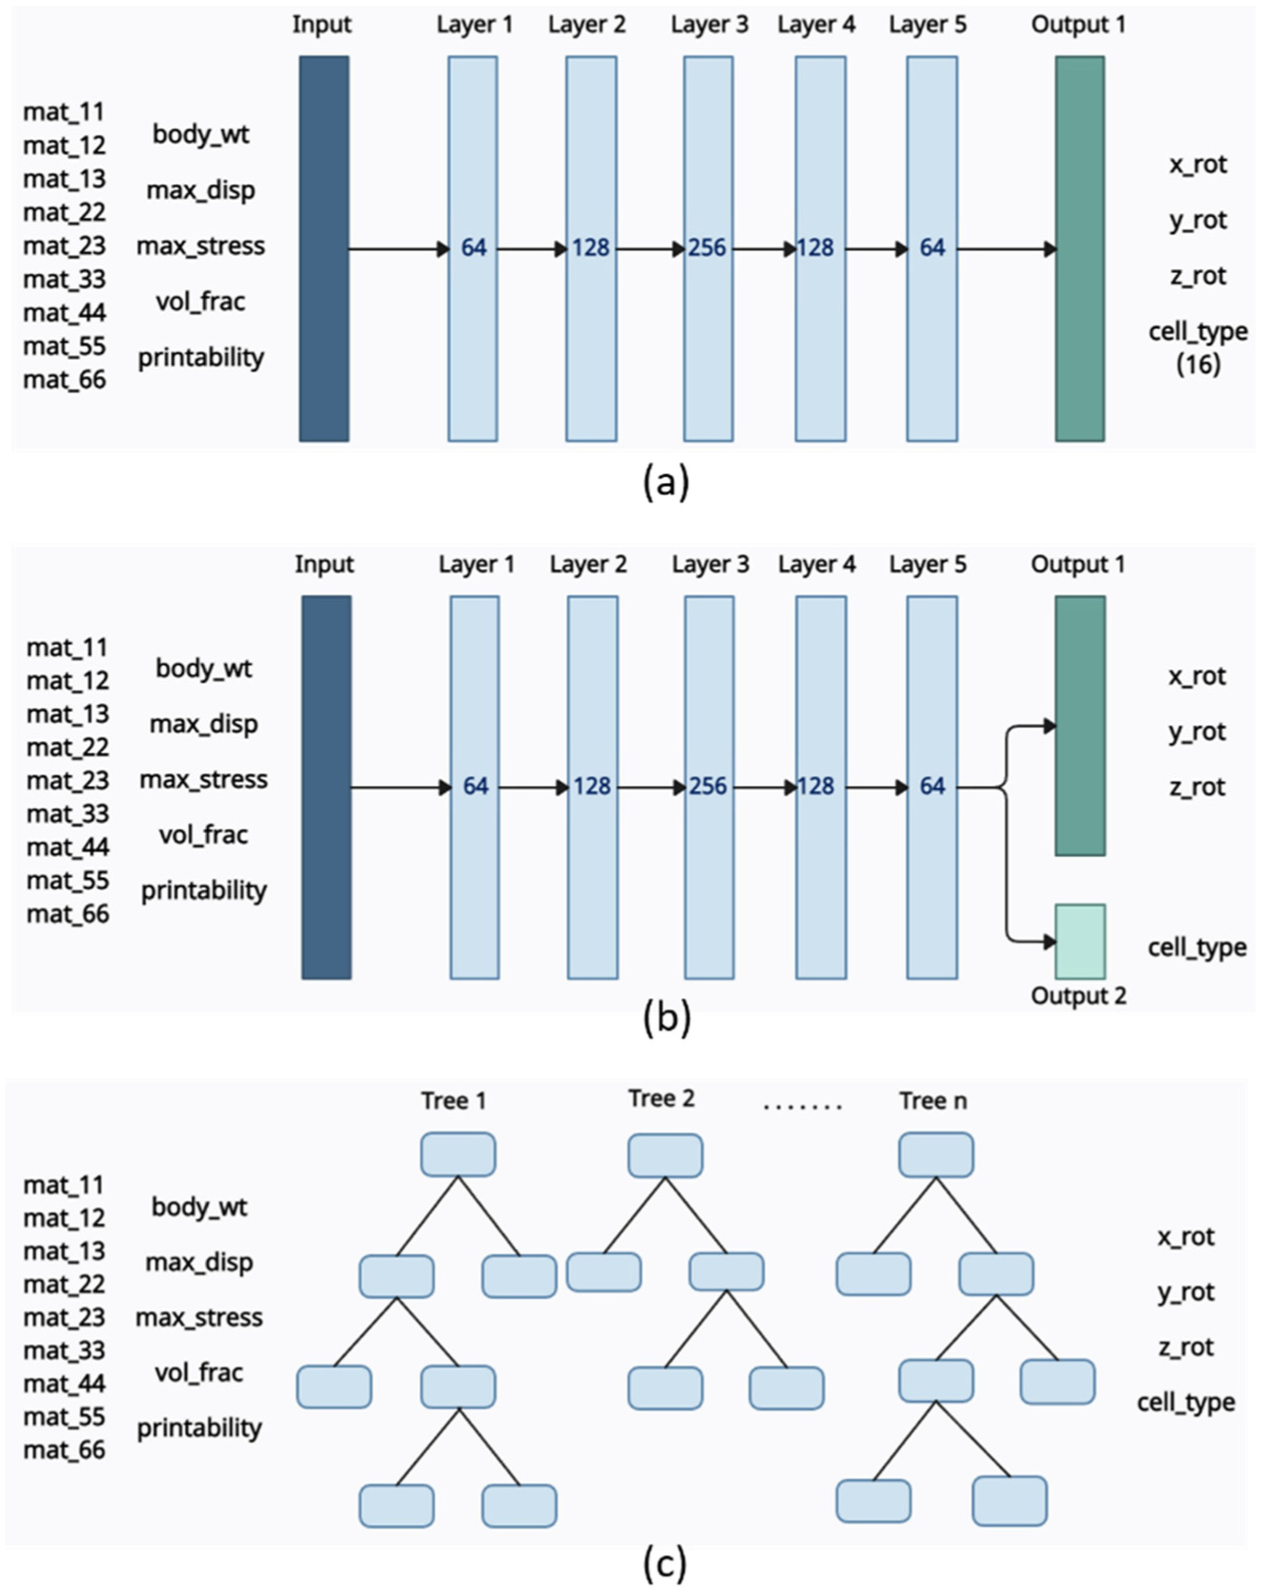
ML models – (a) NN1 model with a single output layer, (b) NN2 model with two output layers (combined regression and classification) and (c) extremely Random Trees model with decision trees.
For each data point, the column corresponding to the correct unit cell type was assigned a value of one, while all other columns were set to zero. Consequently, the input and output layers were configured with 14 and 19 variables, respectively. The Rectified Linear Unit (ReLU) was employed as the activation function, while Mean Squared Error (MSE) was chosen as the loss function to guide model optimisation. The first three variables in the output layer represent cell orientation in the design space, while the remaining 16 variables are used to identify the unit cell type.
To avoid the need for converting the categorical output variable into numerical, as done in NN1, a slightly modified model, NN2, was developed with two separate output layers. As shown in Figure 13(b), the NN2 model consists of one input layer, five hidden layers, and two output layers. The first output layer with three variables was designed for regression, predicting the cell orientation in the design space. The second output layer with 16 variables was used for classification, predicting the unit cell type. The hidden layers were structured with 64, 128, 256, 128 and 64 neurons from the first to the fifth layer, respectively. MSE was chosen as the loss function for the regression task, while sparse categorical cross-entropy was selected for the classification task.
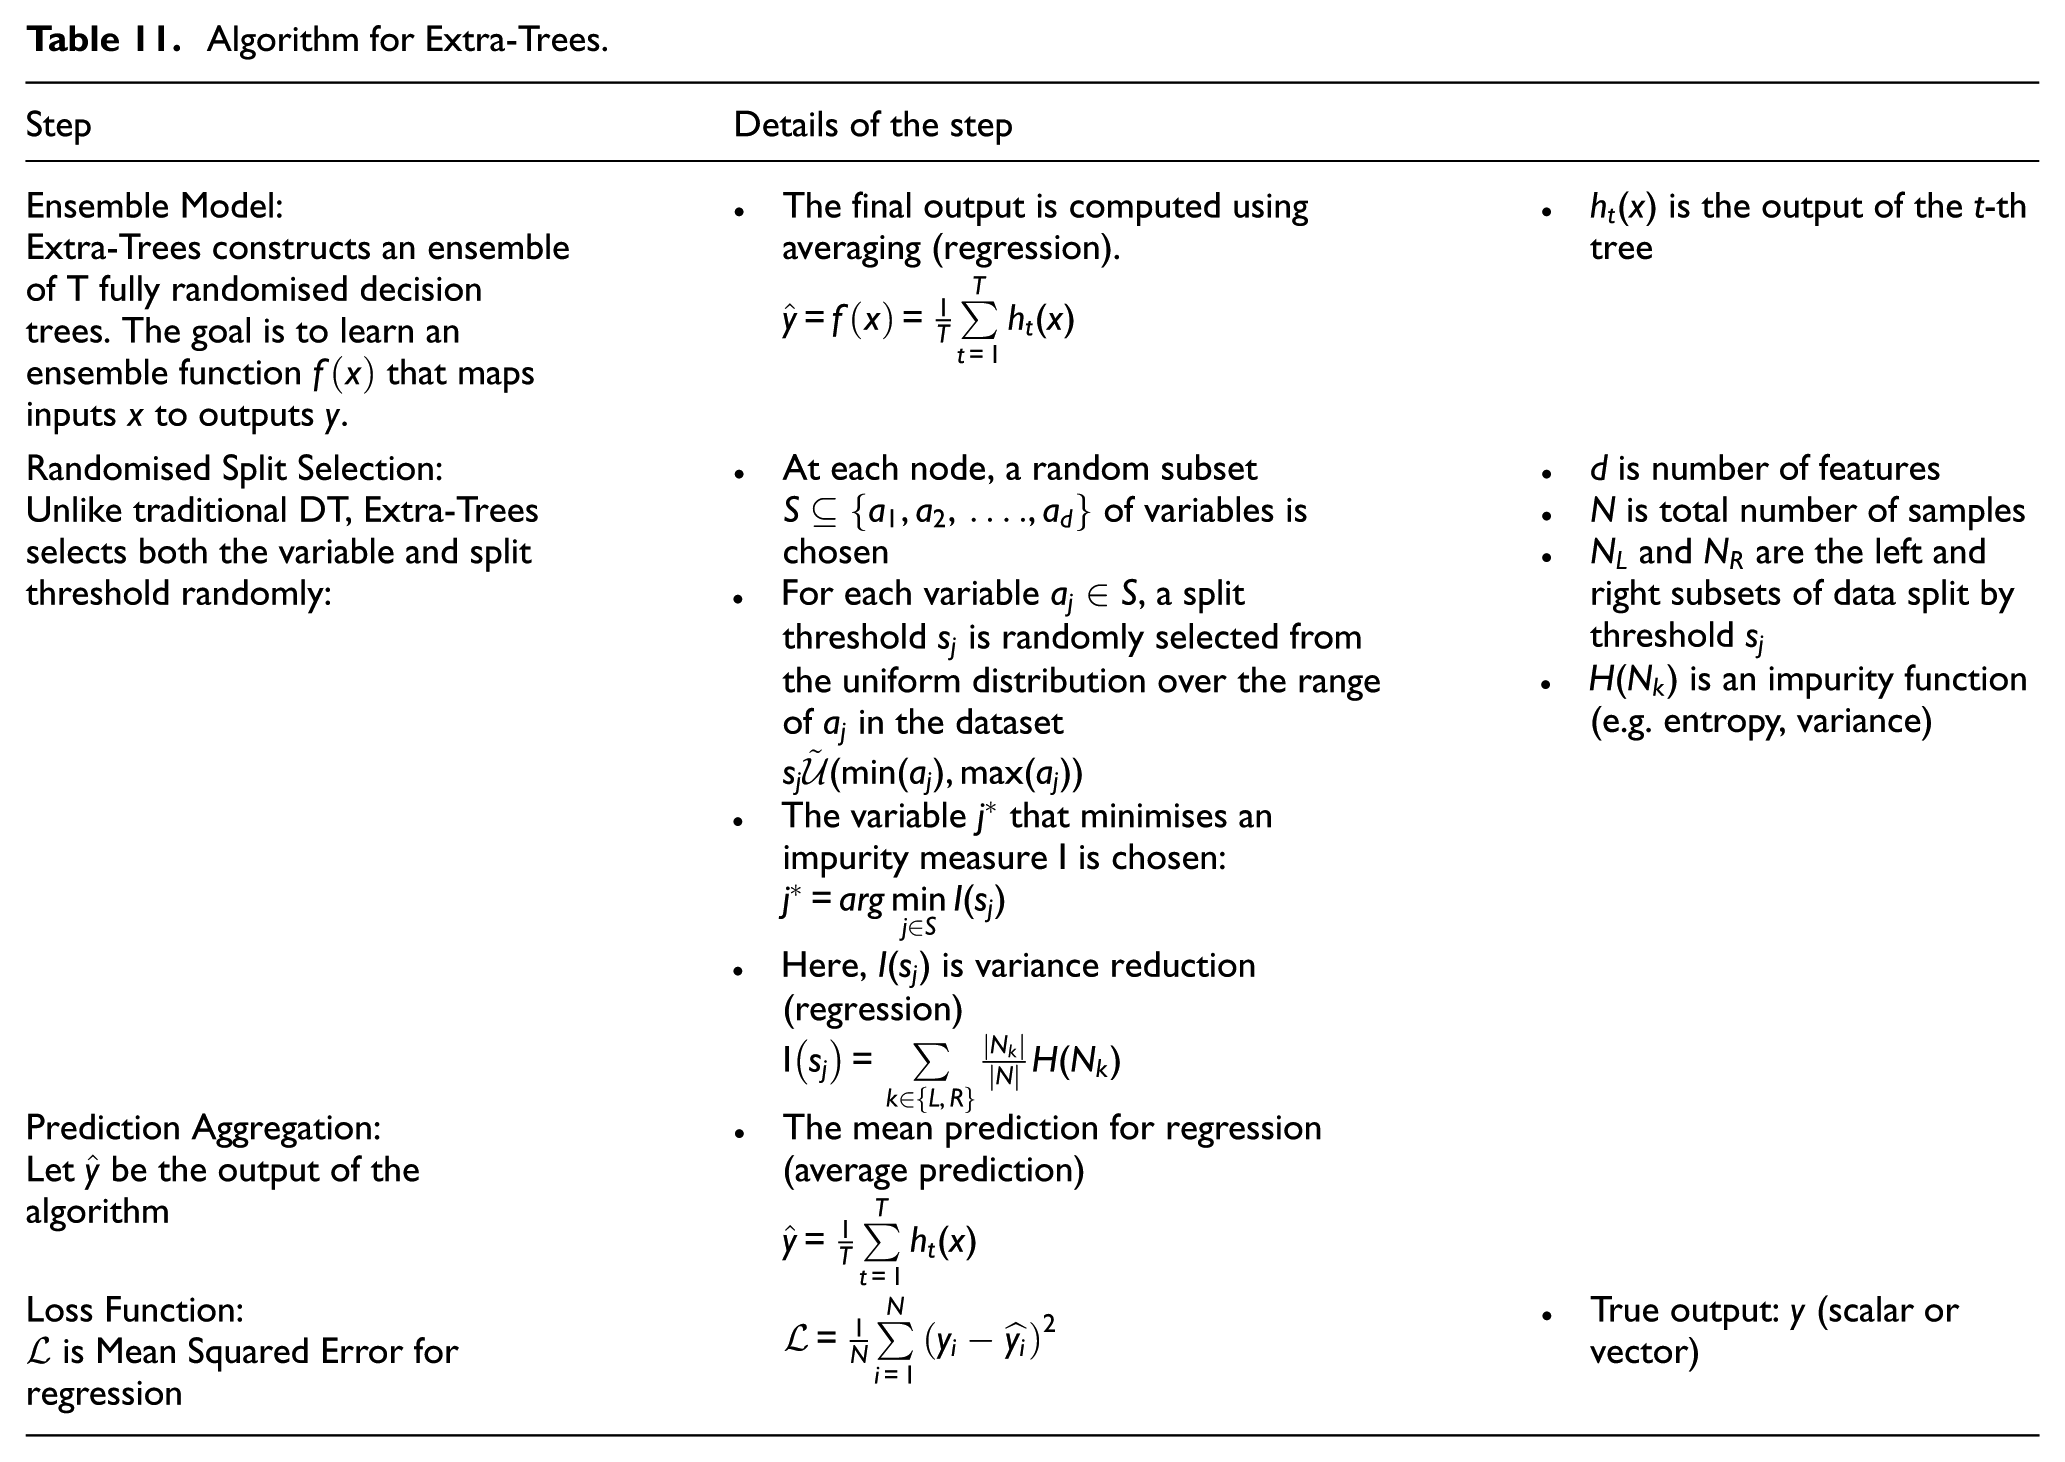
Lastly, an Extremely Randomised Trees (Extra-Trees) model was developed to complement the NN-based approaches. Extra-Trees is an ensemble learning method for both classification and regression, which builds multiple decision trees with added randomness by selecting splits from random subsets of thresholds. In classification tasks, predictions are made via majority voting, while regression outputs are obtained by averaging predictions from all trees. 66 Figure 13(c) illustrates the overall model architecture, configured with 14 input variables and 19 output variables. The step-by-step process involved in developing the Extra-Trees model, such as ensembling, randomised split selection, prediction aggregation and the applied loss function, is outlined in Table 11, 67 providing a clear overview of the model’s operational workflow.
Algorithm for Extra-Trees.
Libraries such as Scikit-Learn and TensorFlow were used to implement these models, initially documented as Jupyter notebooks and subsequently saved as Python scripts for integration into the low-code software, Synera.
Performance evaluation of ML models
The ML models were trained using the dataset developed in this research, which forms the foundation for the predictive capabilities of the models. A detailed description of the dataset can be found in Section Finalised dataset structure.
The predictive performance of NN1 and NN2 was assessed in accurately determining both unit cell type and cell orientation. Both models were trained using the Adam optimiser, with NN1 trained for 60 epochs using a batch size of 32 and a learning rate of 0.001, while NN2 was trained for 100 epochs with a batch size of 32 and a learning rate of 0.0005. As depicted in Figure 14(a) and (b), both models exhibited stable convergence, as indicated by the steady decline in training and validation loss curves. NN1 achieved a mean squared error (MSE) of 0.0086 on the training dataset and 0.0051 on the validation dataset, with a cell orientation deviation of ±5.13° and a unit cell classification accuracy of 99.56%. In comparison, NN2 reported a training MSE of 0.114 and a validation MSE of 0.06, along with a cell orientation deviation of ±7.58°. NN2 achieved a slightly higher unit cell classification accuracy of 99.78%, compared to 99.56% by NN1. To prevent overfitting, dropout was applied in the third and fourth hidden layers, and early stopping was utilised to halt training when validation performance began to degrade, ensuring better generalisation and model robustness.
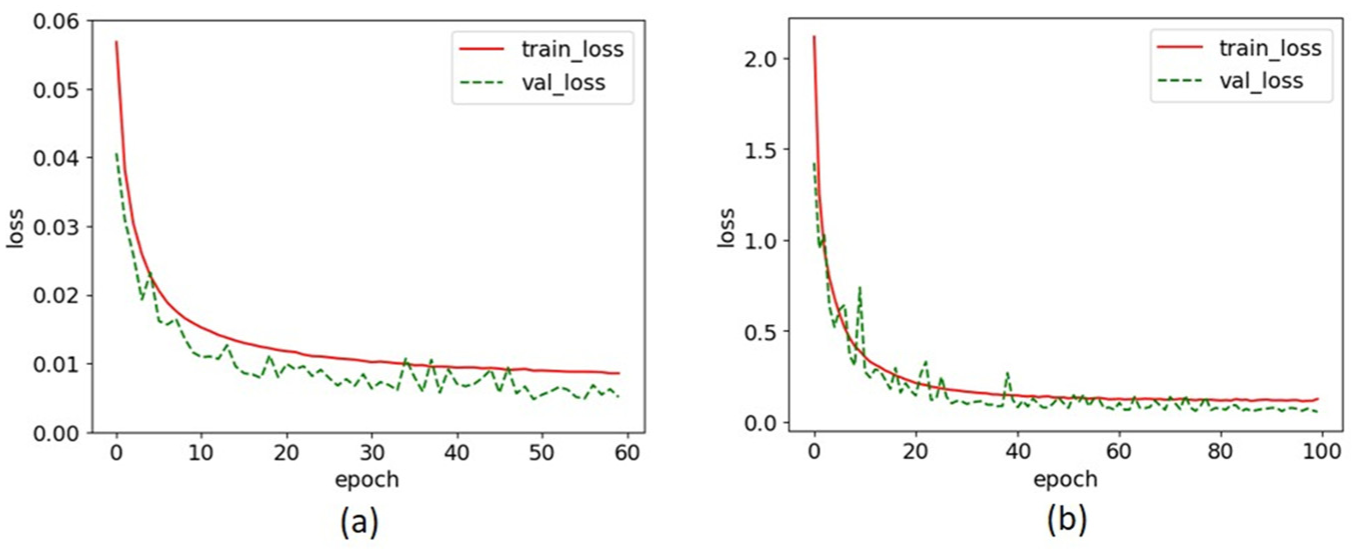
(a) Loss versus epoch for NN1 model and (b) for NN2 model.
The Extra-Trees model was trained with 100 estimators and a maximum depth of 50, yielding an R2 score of 0.996, indicating strong generalisation capabilities. The evaluation showed that the Extra-Trees model accurately predicted the unit cell type with 100% accuracy and achieved a cell orientation deviation of ±0.75°. By introducing randomness in both feature selection and split thresholds, Extra-Trees reduces variance across individual trees, leading to a more robust ensemble. This randomness, combined with ensembling, helps mitigate overfitting by preventing the model from relying too heavily on specific data patterns or noise.
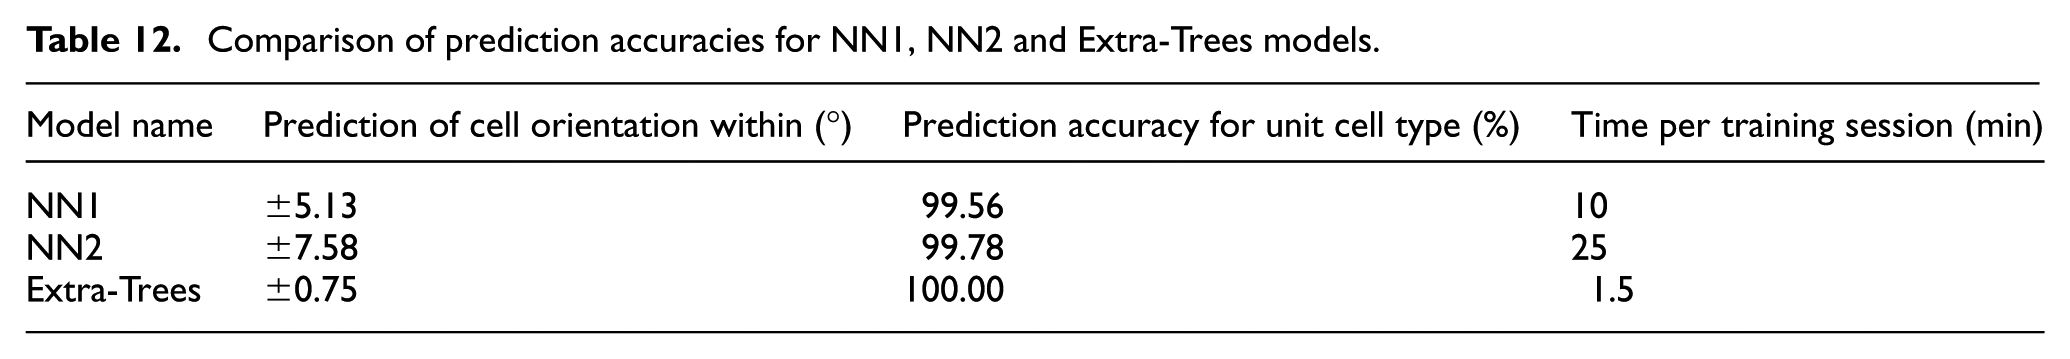
Table 12 presents the prediction accuracies for both unit cell type and cell orientation within the design space. Extra-Trees achieved perfect predictive accuracy (100%) in determining the optimal unit cell type based on input parameters. For cell orientation, Extra-Trees outperformed NN1 and NN2, with a prediction deviation of only ±0.75°, indicating superior precision. In addition to its accuracy, the Extra-Trees model required the shortest training time for a single instance, completing in just 1.5 min, compared to 10 min for NN1 and 25 min for NN2. These computations were performed on an Intel® Xeon® W-2245 CPU with 128 GB RAM and an NVIDIA RTX A5000 GPU, within a JupyterLab TensorFlow environment. The combination of high predictive accuracy and significantly lower computational cost made Extra-Trees the most efficient and practical choice for integration into the AI tool under development in this study.
Comparison of prediction accuracies for NN1, NN2 and Extra-Trees models.
Integration of the AI tool into low-code software
An initial prototype of the AI tool was created using the Synera platform. Figure 15 shows the workflow of the finalised AI tool, outlining the sequential workflow for designing an endoprosthesis model with an integrated open-pore lattice structure. It begins with the input of boundary conditions (see Figure 15(a)), where users specify values for variables such as body weight, maximum displacement, maximum stress and porosity, along with material characteristics set as orthotropic (in the yellow group shown in Figure 15(a)). In the AI-supported design definition section, the input data undergoes pre-processing and is then analysed by the trained ML model (see Figure 15(b)), which recommends an optimal unit cell type and cell orientation in the design space. These outputs are crucial for defining the lattice structure in subsequent steps.
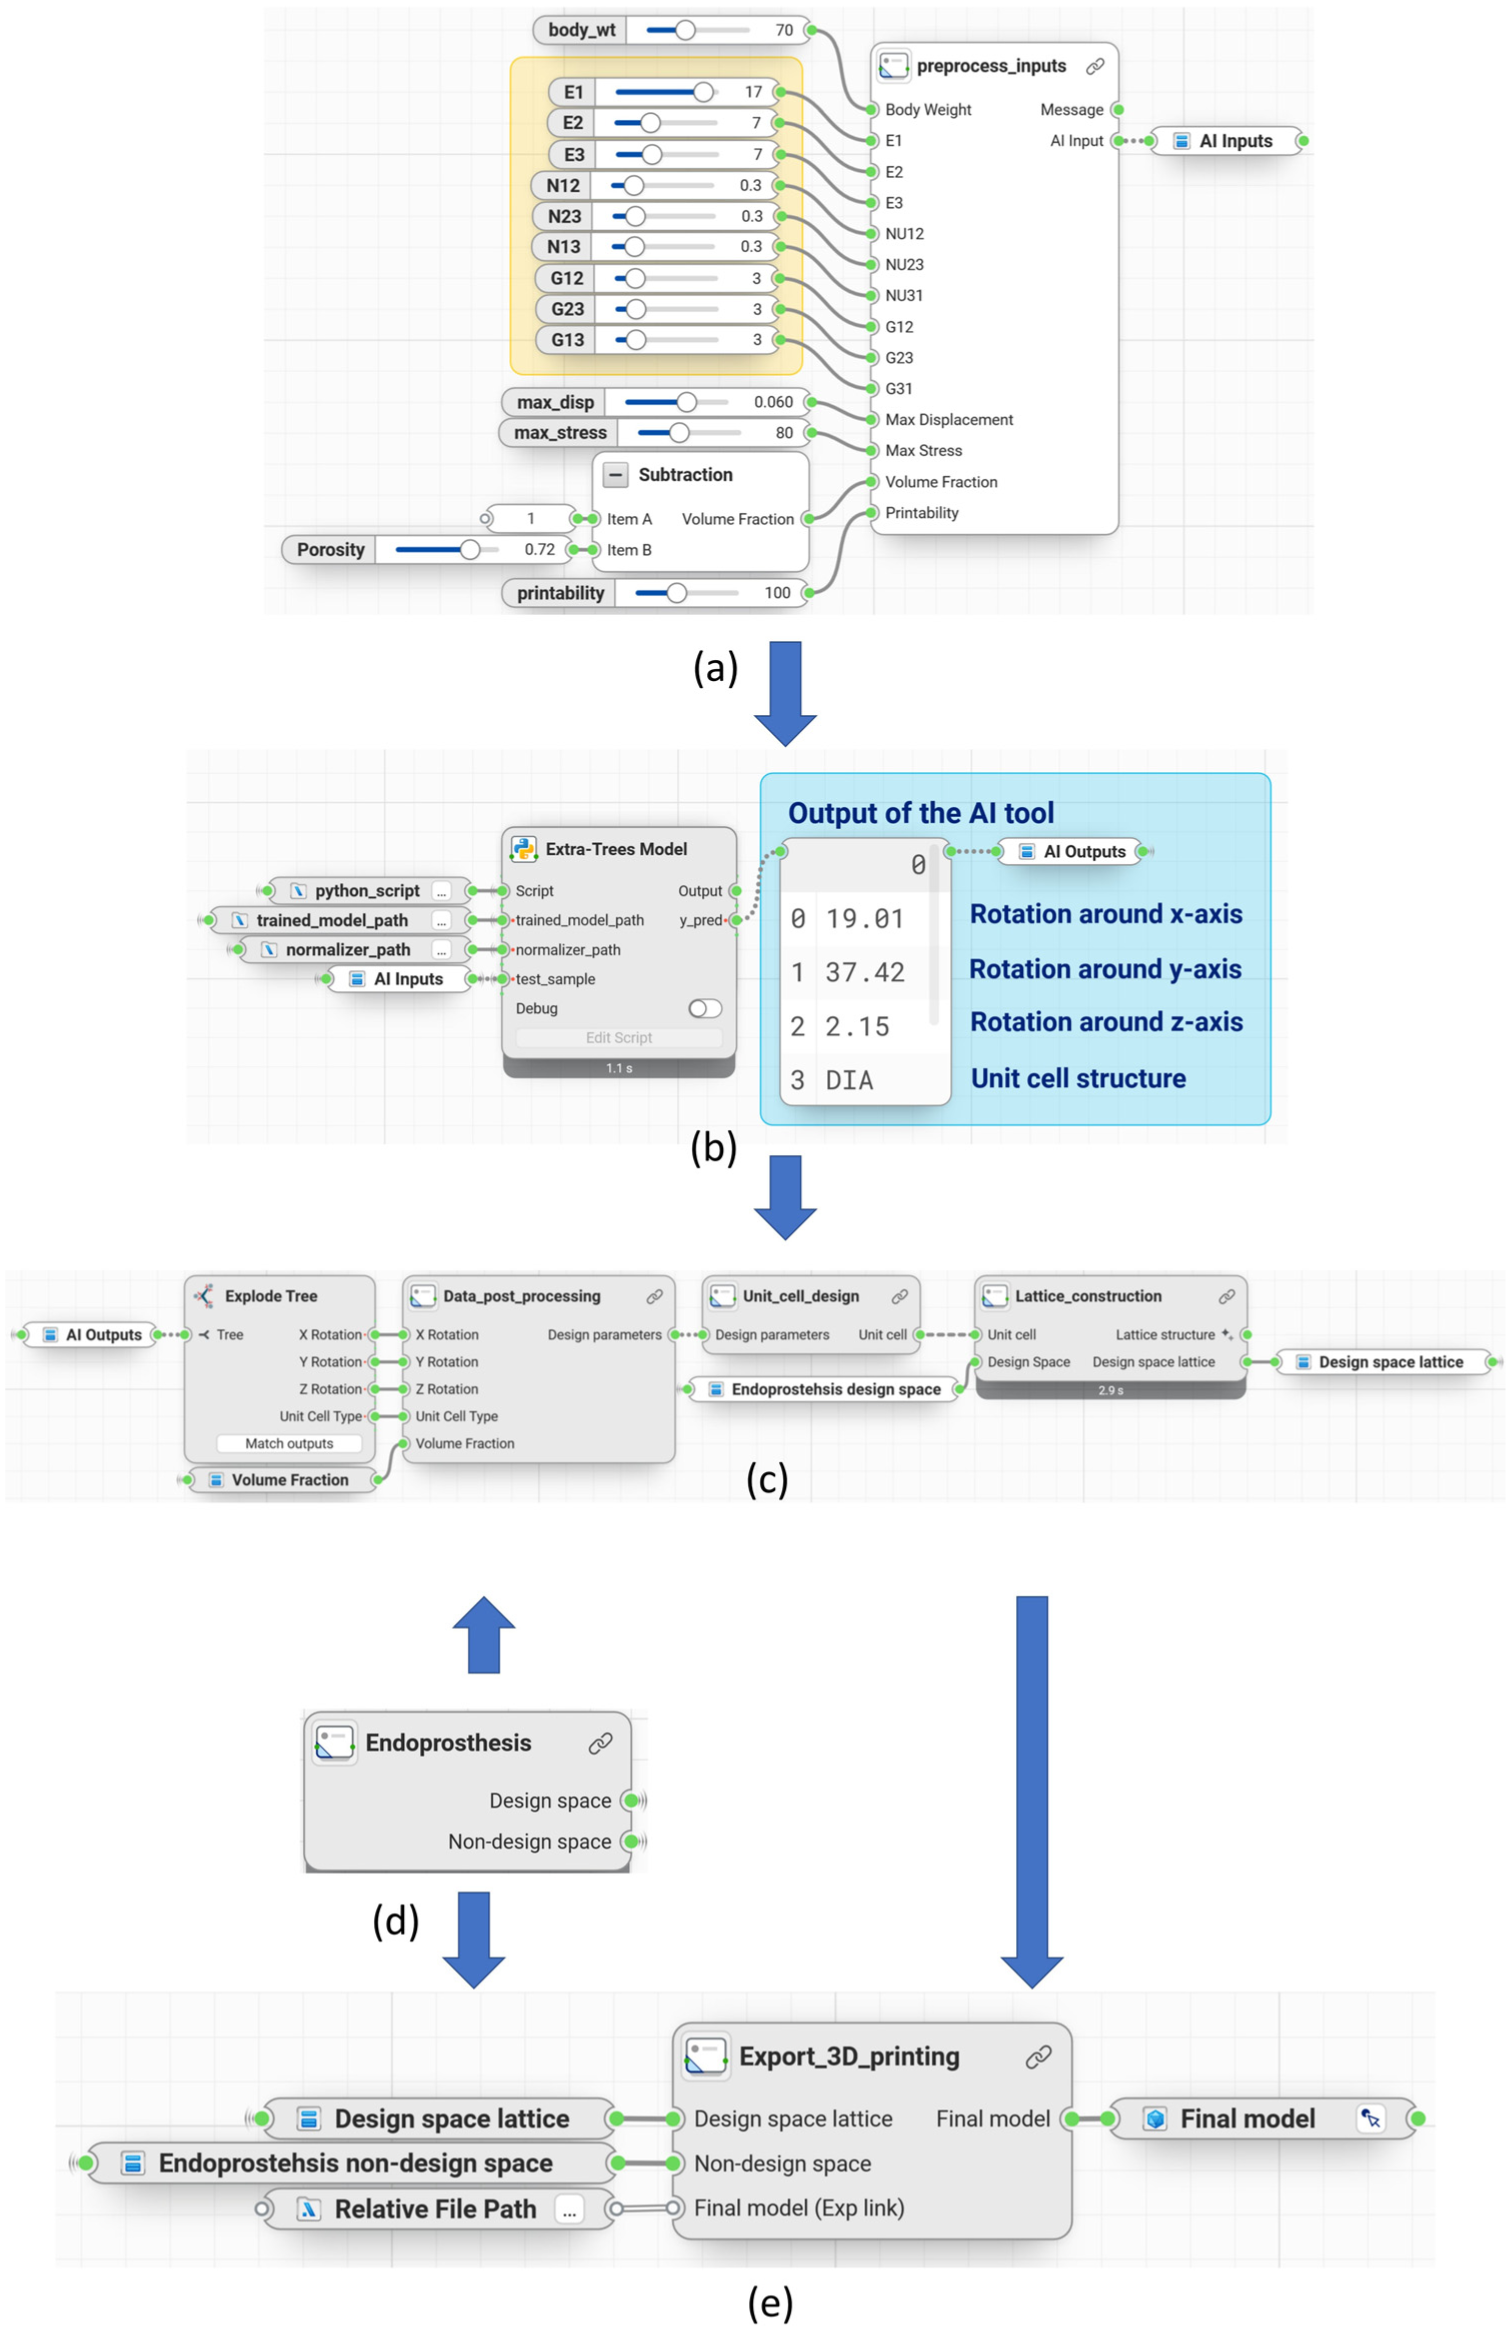
Complete workflow of the open-pore lattice endoprosthesis creation in Synera. (a) Input parameters and pre-processing; (b) AI estimation; (c) AI output post-processing and lattice generation; (d) Customisation of design and non-design space and (e) export and final model preparation such as 3D printing.
Next, the lattice structure generation section utilises the values of output variables suggested by the ML model to construct the unit cell design (see Figure 15(c)), which is subsequently reconstructed into a lattice structure that meets the predefined criteria. The lattice structure is constructed based on the user-defined endoprosthesis design and non-design space (see Figure 15(d)). This will give flexibility to the user in exchanging their endoprosthesis design. Finally, in the post-processing section (see Figure 15(e)), the lattice structure generated for the design space is combined with the non-design space part to produce the final open-pore integrated endoprosthesis. Users will have the option to export the final model as an STL file for 3D printing, perform FE simulation or process the design in CAD format (STEP file), facilitating the transition to physical or digital prototyping.
Figure 16(a) presents a representative gyroid lattice structure, illustrating the outcome of the AI tool’s recommendations. The seamless integration of this lattice into the endoprosthesis, shown in Figure 16(b), demonstrates how the AI tool’s workflow transforms user inputs into an expected functional, real-world design. Open-source (MIT/X11 licence) reference implementations in Python for the ML models used to create the AI tool discussed in this project are provided on GitLab. The corresponding link can be found in the Supplemental Material (Subsection A.2).
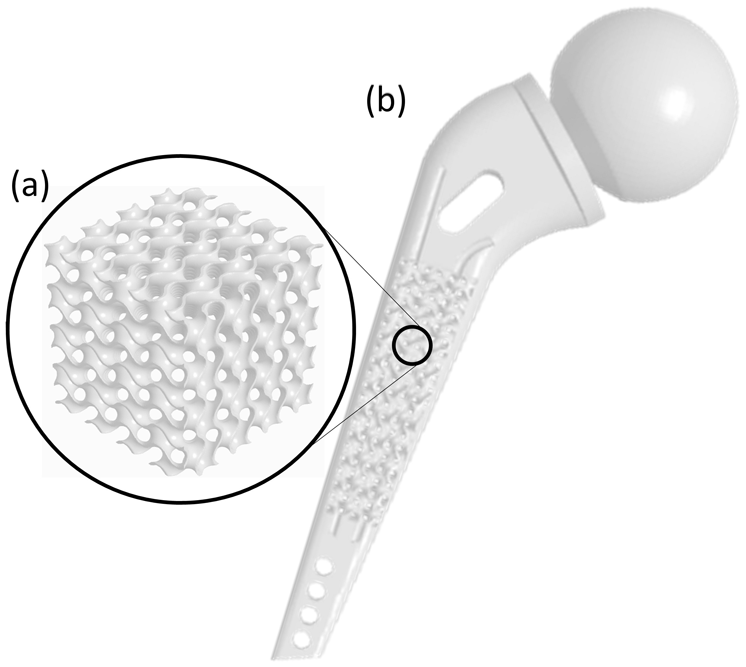
Example of (b) created endoprosthesis based on the (a) AI tool’s recommended Gyroid lattice structure.
Compared to conventional optimisation techniques, such as topology optimisation or response surface-based methods,68,69 the AI-driven workflow presented in this study enables rapid, multi-objective design generation without exhaustive trial-and-error. This should align with recent advances in ML-based scaffold and endoprosthesis design, where predictive models are used to reduce simulation time while maintaining design fidelity drastically.70,71 Importantly, the developed AI tool can be directly integrated into the orthopaedic implant design workflow to assist engineers and designers in rapidly identifying the optimal lattice configuration tailored for specific patients. By inputting patient-specific parameters, the tool predicts the most suitable unit cell type and orientation, significantly reducing the need for manual iteration and time-consuming simulations.
However, adoption in surgical practice will require overcoming several key challenges, including building trust in AI-generated outputs, securing regulatory approval, and ensuring compatibility with existing clinical imaging and planning systems. The current tool also relies on biomechanical input data (e.g. displacement or stress constraints), which may not always be readily available in clinical settings. To enable broader clinical use, future development should focus on improving usability, automating imaging integration, and validating the approach across real patient cases. Clinical translation will also require robust validation, including biocompatibility assessments, fatigue testing and preclinical studies. Commercialisation strategies such as software licencing to implant manufacturers can further support adoption, while ongoing advances in additive manufacturing are expected to enable the production of complex, high-performance lattice designs. With these advances, AI-driven tools for creating lattice structures could become reliable and practical instruments for developing patient-specific endoprostheses that enhance long-term outcomes.
Conclusion
This study introduces an AI-driven workflow for designing open-pore Ti-6Al-4V lattice structures tailored for orthopaedic endoprostheses. Leveraging a dataset of 40,960 finite element simulations, an Extra-Trees ML model was trained and validated to accurately predict the optimal unit cell type and orientation, informed by patient-specific parameters such as body weight, bone porosity and mechanical performance requirements. The model achieved 100% accuracy in cell type classification and a cell orientation deviation within ±0.75°, demonstrating strong performance and reliability.
Integrated into a low-code platform called Synera, the AI tool streamlines the design process by reducing manual iterations and enabling rapid, personalised lattice generation. This significantly shortens development time while maintaining biomechanical fidelity, manufacturability and customisation. However, the ML models were trained on a predefined set of lattice structures. Expanding the dataset to include more biologically inspired geometries and alternative biocompatible materials could enhance its versatility. Furthermore, integrating imaging-derived data, such as CT-based bone density distributions, would enable anatomically precise and clinically meaningful personalisation, thereby aligning the design tool more closely with the principles of precision medicine.
Overall, the proposed AI tool offers a scalable and adaptable framework for next-generation endoprosthesis design, advancing the transition towards faster, patient-specific, and clinically optimised orthopaedic implant solutions.
Supplemental Material
sj-pdf-1-pic-10.1177_09544062251367618 – Supplemental material for Development of an ML-based design tool for predicting optimal lattice configurations for patient-specific endoprostheses
Supplemental material, sj-pdf-1-pic-10.1177_09544062251367618 for Development of an ML-based design tool for predicting optimal lattice configurations for patient-specific endoprostheses by Aniket Angre, Nils Kaiser, Christian Hamm and Ahmad Burhani Ahmad Basri in Proceedings of the Institution of Mechanical Engineers, Part C: Journal of Mechanical Engineering Science
Footnotes
Acknowledgements
The authors thank U Bremen Research Alliance/AI Centre for Health Care for their invaluable support and contributions to this work. Their assistance has been instrumental in completing this research.
We acknowledge support by the Open Access publication fund of Alfred-Wegener-Institut Helmholtz-Zentrum für Polar- und Meeresforschung.
Declaration of conflicting interests
The authors declared no potential conflicts of interest with respect to the research, authorship, and/or publication of this article.
Funding
The authors disclosed receipt of the following financial support for the research, authorship, and/or publication of this article: We received grant money from the U Bremen Research Alliance/AI Centre for Health Care, financially supported by the Federal State of Bremen, Germany.
Ethical considerations
There are no human or animal participants in this article, and informed consent is not required.
Consent to participate
Not applicable.
Consent for publication
Not applicable.
Supplemental material
Supplemental material for this article is available online.
References
Supplementary Material
Please find the following supplemental material available below.
For Open Access articles published under a Creative Commons License, all supplemental material carries the same license as the article it is associated with.
For non-Open Access articles published, all supplemental material carries a non-exclusive license, and permission requests for re-use of supplemental material or any part of supplemental material shall be sent directly to the copyright owner as specified in the copyright notice associated with the article.