
Abstract
Chrome plating is one of many surface engineering techniques used for corrosion resistance, as well as a protective coating against surface damage in load bearing applications, with surface hardness in the region of 1000 Hv. Laser cladding is an alternative hardfacing technique often chosen for corrosion resistance and for increasing the surface hardness of components, through thick clad coatings. The application of chrome plating and other similar surface engineering techniques for thick coatings can be inefficient and costly with practical process limitations. The objective of this case study was to investigate the feasibility of replacing the chrome plated layer of a rod mill pinion, made of forged steel, with a Nickel-based Tungsten-Carbide (Ni-WC) composite layer and an intermediate layer of Inconel 625. Mechanical properties were obtained using microhardness and nanoindentation techniques. Three-point bend tests were performed on test specimens from a pinion sample, in order to observe crack propagation resistance, a challenging task due to the curved geometry of the pinion sample and the difference in thickness between the existing and proposed coating layers. Crack development was captured, and plastic deformation was quantified with the use of Digital Image Correlation (DIC). In bending it was found that the bond between the composite coating, Inconel 625 and the steel substrate provided improved resistance to axial crack propagation, where the composite coating could withstand more than twice the bending tool displacement than the chrome electroplating.
Keywords
Introduction
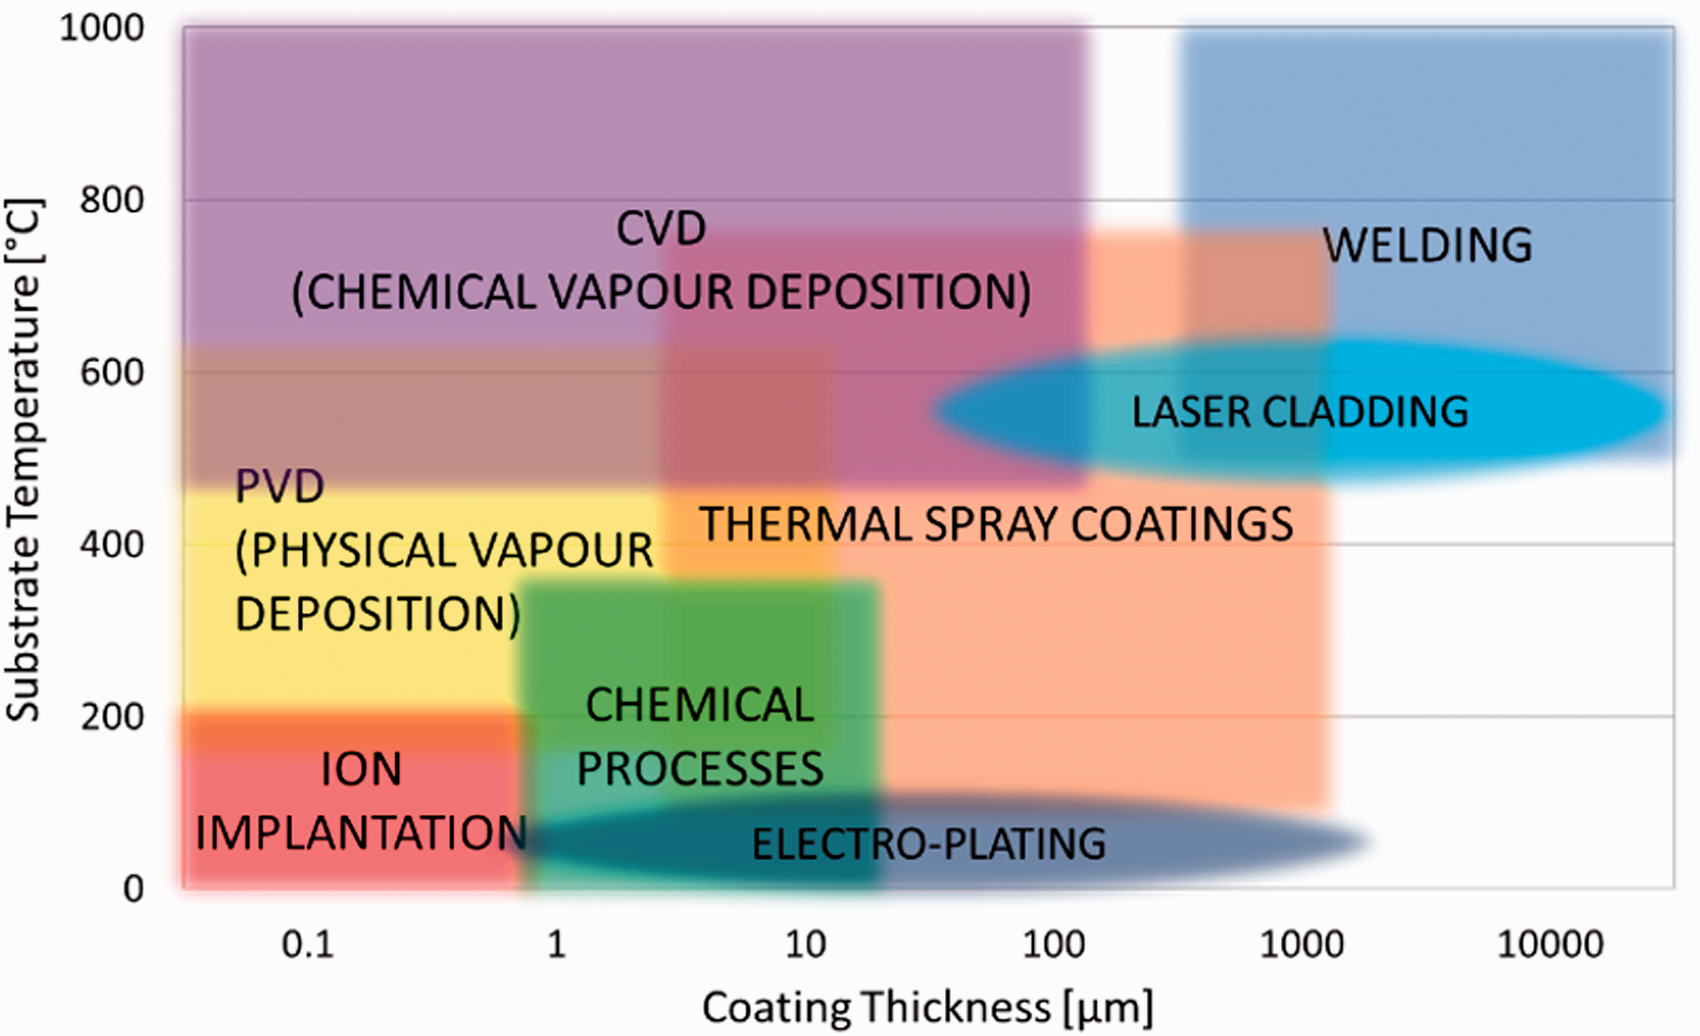
Surface engineering techniques are widely used for the protection of steel surfaces, 1 especially against damage at tribological interfaces which are subject to operational and environmental conditions or process influence, i.e. physical (wear, extreme temperature, humidity, fracture, creep), chemical and biological interactions. The main surface damage of rotational components in the steel industry is caused by wear, corrosion and fracture. Protection is achieved by increasing the material’s resistance to corrosion and mechanical strength near the surface by improving its mechanical properties, i.e. hardness and ductility, or by the application of coatings, which are made from alloys that contain corrosive resistant elements such as Chrome, Nickel, Manganese and Molybdenum.2,3 Figure 1 shows a comparison map of the various coating processes and their corresponding parameters of process temperature and typical coating thickness. 4 Laser cladding and chrome electroplating information has been added to the graph, to show roughly their thickness position relative to the other processes.1,5–8 Most niche coating techniques produce relatively thin coatings, with thermal spray coatings in the mid-range in terms of thickness, while welding/hardfacing techniques generally produce thicker coatings.1,9 Thinner laser clad coatings with 30 µm minimum thickness can be produced, 6 with Extreme High-speed Laser Application (EHLA). 10 Although very thin coatings may not be applicable to the load bearing applications discussed here, as they need to be deeper than the depth of maximum Hertzian or other stress that they may experience in service.8,11,12
A forged steel “rod mill” pinion from the steel industry was chosen as a case study for this work. This currently has a chrome coating produced with the electroplating method for surface protection. With the chrome electroplating technique, a limited coating thickness can be achieved, due to process limitations. This has implications in load bearing applications where in-service surface stresses extend deeper into the substrate material. In such cases, alternative coating techniques, also referred to as hardfacing techniques can encapsulate surface stresses within the coating, thus protecting the substrate. Typical hardfacing techniques include different types of welding such as oxy-acetylene, powder, metal arc, tungsten inert gas (TIG), submerged arc, plasma, spray fusing and metallising, with various combinations of alloy materials such as Carbon steel, High Speed steel, Austenitic and Martensitic steel, nonferrous (i.e. Co-Cr-Mo-W) and Carbides (i.e. Tungsten Carbide granules). 13
Laser cladding is an alternative hardfacing technique which is often chosen for corrosion resistance and for increasing the surface hardness of components.6,7,14,15 It can achieve re-producible thick coatings from various alloys. Depending on process parameters and clad material choice thick coatings can be achieved by depositing one layer or multiple layers. It is a refined welding process that gives a good bond with the substrate and low heat affected zone, which places it in the same category as coating techniques in terms of quality, as opposed to hardfacing techniques. A large selection of alloys suitable for laser cladding means that coatings can be customised to suit the operating conditions and environments to provide the necessary protection. Research has shown that laser clad coatings with Cr-17.5 wt% and Ni-10.5 wt% increased the component’s fracture strength and resistance to fatigue crack propagation due to their higher microhardness, which resulted from higher cooling speed during the cladding process and fine dendrite in the clad layers. 16
The aim of the work described was to make a direct comparison between an in-service component with a chrome plated surface and a laser clad version of the same component. The curved geometry of the in-service component, along with the difference in thickness between the chrome and proposed coatings, proved to be challenging. A novel approach was adopted where the strength and performance of the coatings and substrate was tested by applying damaging forces under three-point bending in a Scanning Electron Microscope (SEM) and Universal Testing Machine (UTM). Evaluation and comparisons were undertaken using Digital Image Correlation (DIC) techniques. This work was targeted at understanding the load bearing capability of the different materials as influenced by their properties and microstructure. It is a first attempt for direct replacement of the coating material and the results can be used in planning and implementation of laser cladding on a pinion for in-situ pilot trials in the future.
Rod mill pinion
A pinion is a critical component used in the rolling of long products. Pinions drive the mill roll (see Figure 2(b)), which is used to shape steel products such as round bar. The mill roll has grooves machined into the running face and when two mill rolls are positioned close to each other and parallel to their rotational axis, together they form oval or round patterns from which the steel products can be shaped accordingly. Multiple pairs can be arranged in a production line, as shown in Figure 2(a). The pinion is supported by two hydrodynamic bearings (eccentric cartridge in Figure 2(b)) and it is driven by a spiral gear in the middle. Typical product temperatures exceed 750 °C in order to provide thermo-mechanical rolling, with a typical round bar diameter of 5.5–28 mm and at a maximum rolling speed of 120 m/s. In addition, the rolling force (mill roll separating force) can be up to 394 kN, 17 but typically in hot rolling the separating force can be lower. The mill rolls require replacing from time to time and production line downtime must be kept to a minimum. A taper sleeve is used to mount the mill rolls onto the pinion, with the use of a hydraulic tool that slides the sleeve into position by “wedging” it between mill roll and roll pinion to create an interference fit. This enables a quick removal, thus reducing downtime of the production line. However, the quick removal method of the taper sleeve causes mild wear and often sever damage is cause by particle pick up. Chrome electroplating of the pinion’s surface has been successful for extending the pinion’s life, by providing a new, harder surface. Although the chrome layer can be repaired repeatedly, it is not a sustainable process with a limited number of possible repairs.
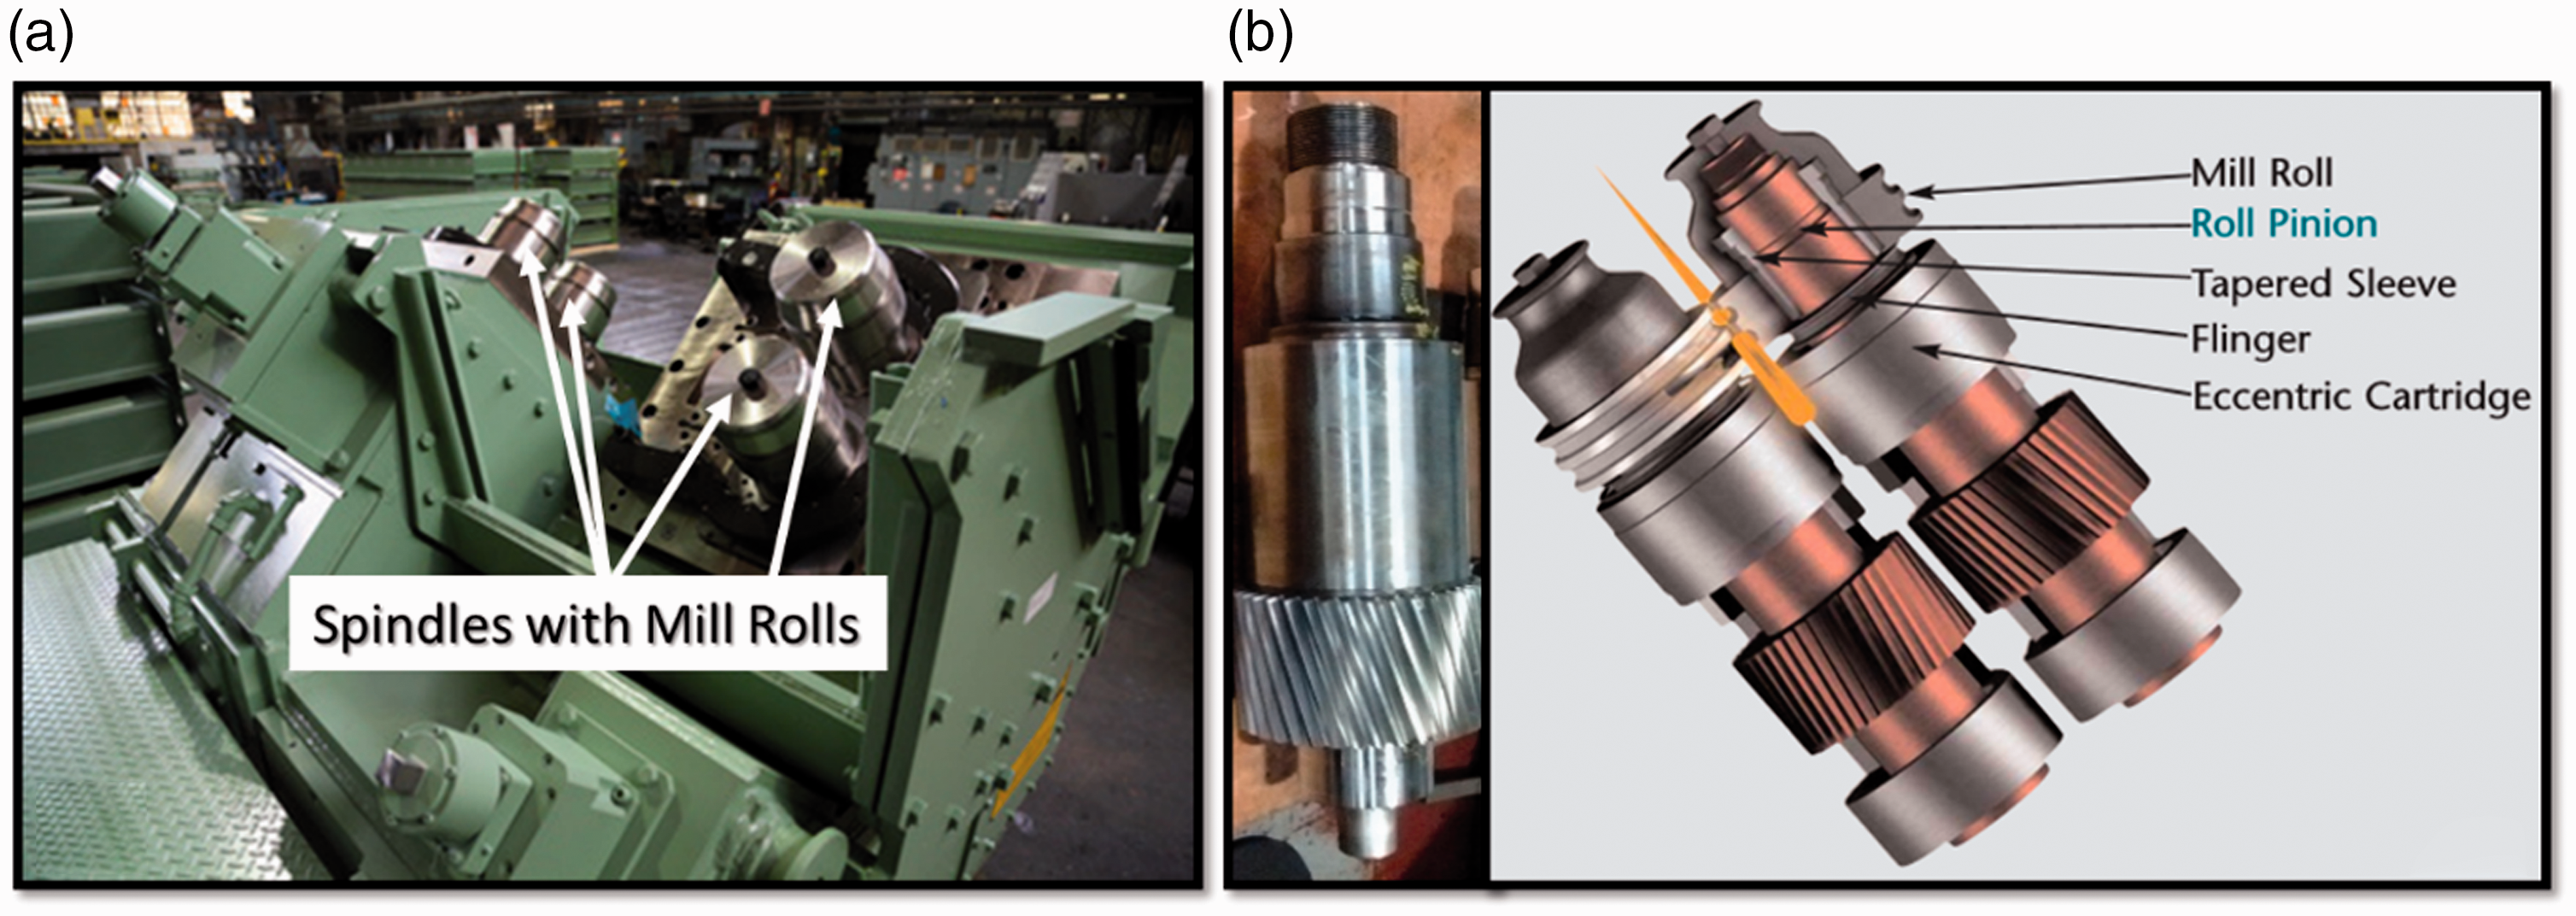
Images courtesy of Primetals Technologies© (a) Pinions lined up for inspection; (b) rod mill pinion and assembly diagram. 17
Chrome electroplating
Chrome electroplating is used for decorative purposes with deposits below 0.80 µm, typically plated over nickel and for functional purposes when deposits exceed 0.80 µm for engineering coatings. The use for functional purposes is chosen for the special properties of chromium such as resistance to heat, hardness, wear, non-gelling, non-wetting qualities, high melting point (around 1900 °C), corrosion, erosion and a low coefficient of friction. 5 It provides a surface that resists galling, abrasive and lubricated wear, and corrosion with typical thicknesses ranging from 2.5 to 500 µm and for certain applications to considerably greater thicknesses. 1 Products such as piston rings, shock absorbers, struts, brake pistons, engine valve stems, cylinder liners, and hydraulic rods benefit from chromium coatings, as well as aircraft landing gears, textile and gravure rolls, plastic rolls, dies and moulds. 1 The process involves the electrodeposition from a solution containing chromium trioxide (CrO3) and a catalytic anion (sulfate or fluoride) in proper proportion in specially designed baths. There can be many disadvantages such as “throwing power” of chromium (coating distribution over the part’s current density range) compared to other metals, low efficiency in maintaining plating bath conditions throughout the process and custom tank designs are required, limited coating thickness and environmental pollution and health hazards from the chemicals used during the electroplating process. Chromium deposits below 0.5 µm are normally crack free, but porous, while thicker deposits may contain micro-cracks. 5 The micro-crack density can be in the region of 200–1500 cracks/cm.18,19 Elastic Modulus and Ultimate Tensile Strength values range from 103 GPa to 248 GPa and 103 MPa to 482 MPa respectively, depending on the electroplating process. 20 The accurate control of the electroplating process is paramount to achieving the desired properties. Due to its carcinogenic properties a ban from industrial applications is in place in the European Union from September 2017 under the REACH regulation and an EU project initiative was investigating alternatives to the use of chrome in the steel industry.21,22
Laser cladding alternatives
Lasers have been used extensively to improve wear and corrosion resistance of mechanical components, either by laser hardening (post-heating, stress-releasing) or alloying of different powders as a coating on existing components. Similar to welding, laser cladding is a manufacturing process which metallurgically bonds materials or alloys onto a base material, but with a laser beam as a heat source which creates a melt pool with minimal heat affected zone (HAZ) due to the precise control of the heating parameters. Figure 3 is a schematic of the laser cladding blown powder method used for producing clad test specimens used in this study.
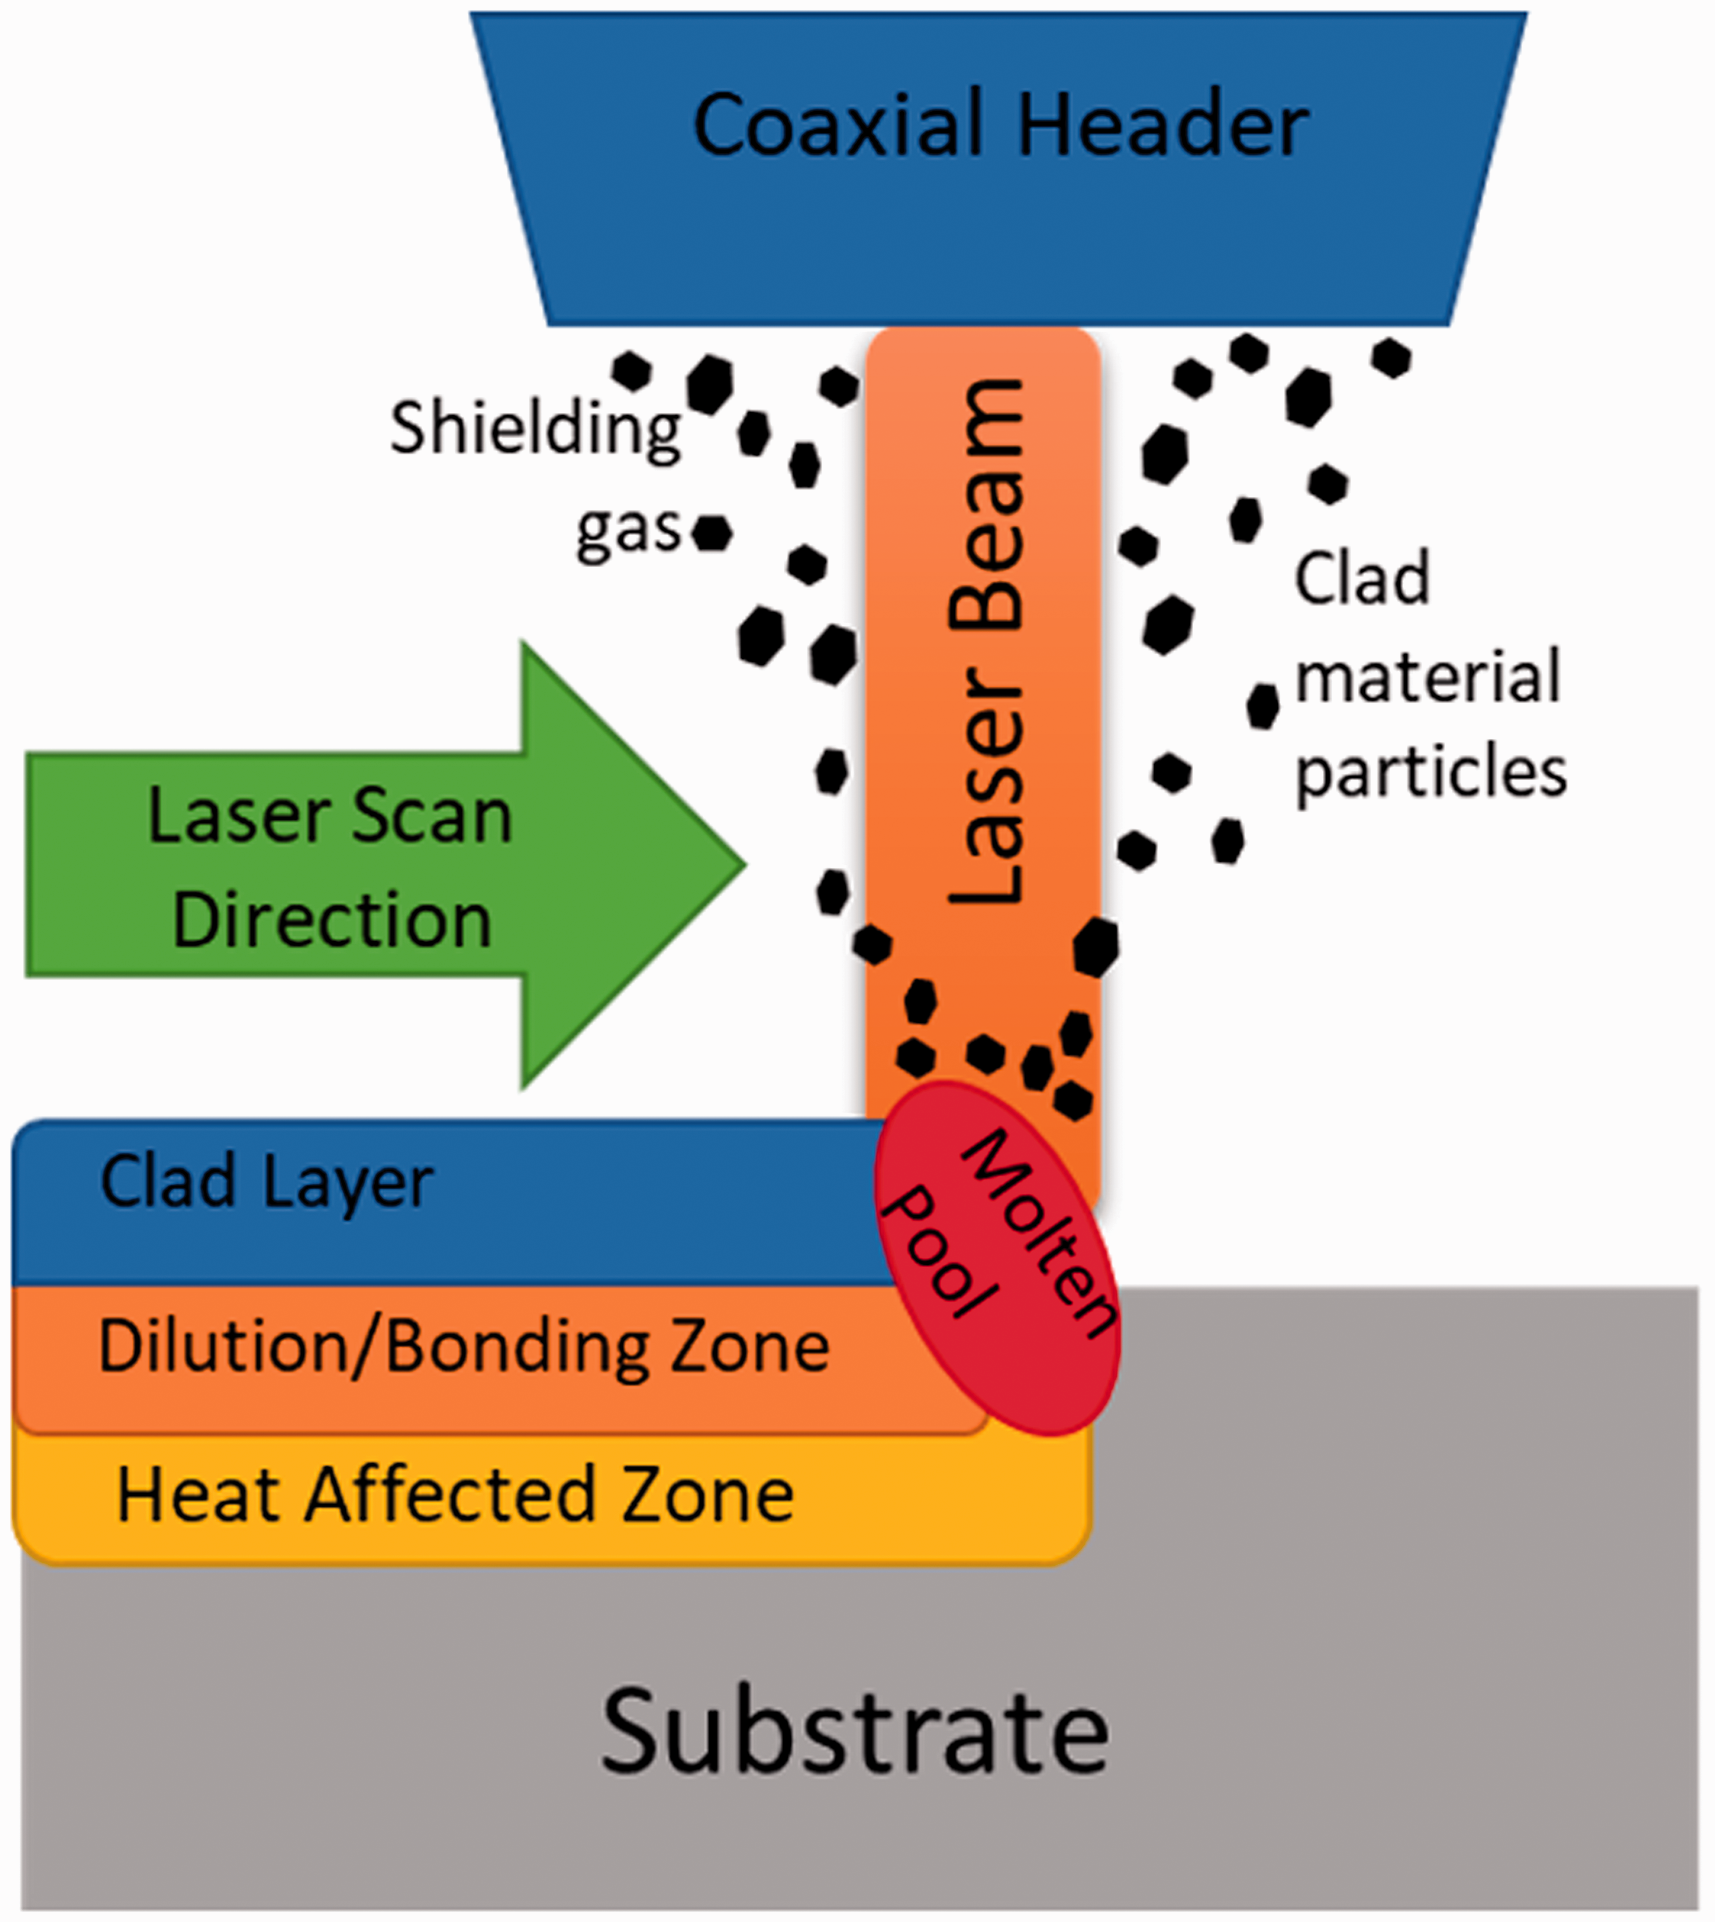
Laser cladding blown powder method.
The well-established method of blowing the powder to the melt pool most commonly uses an inert carrier gas that shields the melt pool to prevent oxidation, for example argon, nitrogen or helium. Overall, injecting powder gives better control over coating adherence, clad dilution and reproducibility. 8 Typically, the laser traverses in a straight line and then in a “serpentine” motion to cover a flat area. Lathes can be modified to clad cylindrical faces and bespoke systems can be designed to enable repair on asymmetrical profiles along the axis of cylindrical components, for example for crankshaft repairs. 23
Once a layer is deposited onto a substrate, more layers can be fused on top, creating a thicker coating and typically overlapping takes place to ensure continuity in each deposited layer, where overlap in the region of 50% to 60% can result in low surface roughness, thus avoiding or reducing post-cladding surface machining. 8 It is important to achieve non-porous microstructure and to maintain the desired material properties through all the layers with a good metallurgical bond with each layer and the interface with the substrate. The substrate interface consists of two distinctive zones, the dilution and the HAZ. The dilution region is made of a mixture of the melted substrate and the coating material with the microstructure typically similar to the coating, while the heat affected zone lies in the substrate and its microstructure is different from the substrate due to the heat transfer from the melt pool. 24 Dilution is the ratio of the substrate diluted in a coating and it is considered as a percentage of diluted thickness over the clad coating thickness. 7 Kaierle et al. 6 refers to technologies where 2% dilution has been achieved with the use of plasma-transfer-arc for pre-heating the substrate and clad material and also concludes that dilution levels below 5% of the clad thickness lead to high quality coatings. The maximum thickness of the coating that can be achieved depends on the set-up, but mostly on the clad material powders available. Outside of research, typical production clad layer thicknesses range from 0.5 mm to 2 mm or even thicker can be achieved.
The performance of clad materials, for example mechanical response, cannot be deduced from similar materials or materials of the same grade produced by other methods. The use of multi-layer coatings of different materials is common in coating practices and the use of multiple layers of the same material grade is common in laser cladding. The two-layer combination of thick coatings as proposed in this research has not been found in published literature. The softer intermediate layer acts as a crack propagation barrier between the harder outer coating and the substrate. The outer coating of Ni-WC was chosen as it sustains WC hard particles in a hard, yet malleable coating of Ni, shown to achieve high hardness and wear resistance as used in other research.25–27 The experimental procedure chosen here was aimed at understanding the relationship between the mechanical response of the two-layer clad materials and the mechanisms operating at the microscopic scale in the clad layer. This has been achieved by not only static analysis of the clad materials using microscopy and nanoindentation, but also by dynamic analysis, using three-point bend tests at macro and micro levels, in order to capture the mechanical response in each layer under extreme bending conditions.
Experimental procedure
For testing laser clad alternatives, suitable materials were identified and preliminary analysis was performed to obtain their hardness, surface roughness and mechanical properties via nanoindentation. SEM images contributed to characterising the quality of the coatings in terms of porosity, particle size and inherent micro-cracks from the laser clad process. This preliminary work is described in this section, followed by the test specimen preparation method, including the speckle pattern for DIC identification, and the three-point bending test method in the SEM and UTM.
Materials
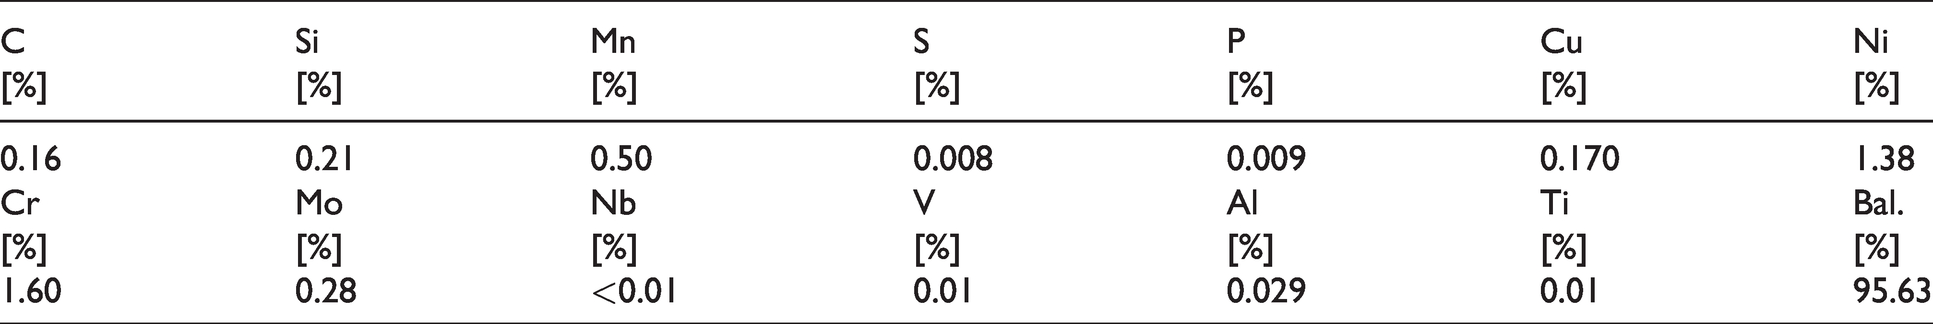
A composite laser clad coating was chosen for this work, to provide a hard-wearing outer surface and a ductile intermediate layer to interface with the pinion forged steel. The coating was composed of two layers, the outer layer was a matrix of Ni-based alloy with spherical fused Tungsten Carbide (WC) particles and the intermediate layer was Inconel 625. The pinion, referred to as the substrate, is made of a forged steel material. The chemical composition of the forged steel material was obtained with Optical Emission Spectroscopy (OES) and is shown in Table 1.
Chemical composition of the substrate material (forged steel).
Samples taken from test specimens were sectioned and mounted for optical and SEM analysis. The procedure for obtaining the test specimens is described in the test specimen preparation section. The substrate and intermediate layer were etched with 2% Nital solution, however the Ni-WC layer was more challenging to etch due to its composition. After trial and error, a solution of 4.76% Nitric acid, 47.62% hydrochloric acid and 47.62% water was used to successfully etch it. A downside to using a stronger etchant was that the substrate and intermediate layers were overetched. Grinding pads of up to 1200 density and polishing with diamond suspension of 6 µm, 3 µm and 1 µm were used in subsequent preparation processes. It was extremely difficult to apply even pressure on composite surfaces during polishing, due to the very hard carbides that reside in the software alloy, resulting in scratch marks and a slightly uneven surface. SEM images of mounted samples revealed the morphology of the clad layers. In Figure 4 the substrate and two clad layers are clearly visible, where the Ni-WC material is identified by the WC spherical particles. The concentration of the spherical particles is low near the surface of the outer layer, perhaps this is due to the particles sinking during the solidification of the molten pool. Furthermore, the WC particles are spherical due to proprietary manufacturing process 27 and some of the WC particles have not maintained their spherical shape, probably a result of the cladding process Figure 4(b). Some particles remain near the surface, of which have either been ground successfully (Figure 4(b)) or they have popped out of the surface, thus leaving a cavity, which resulted in a pitted surface, see Figure 4(c).
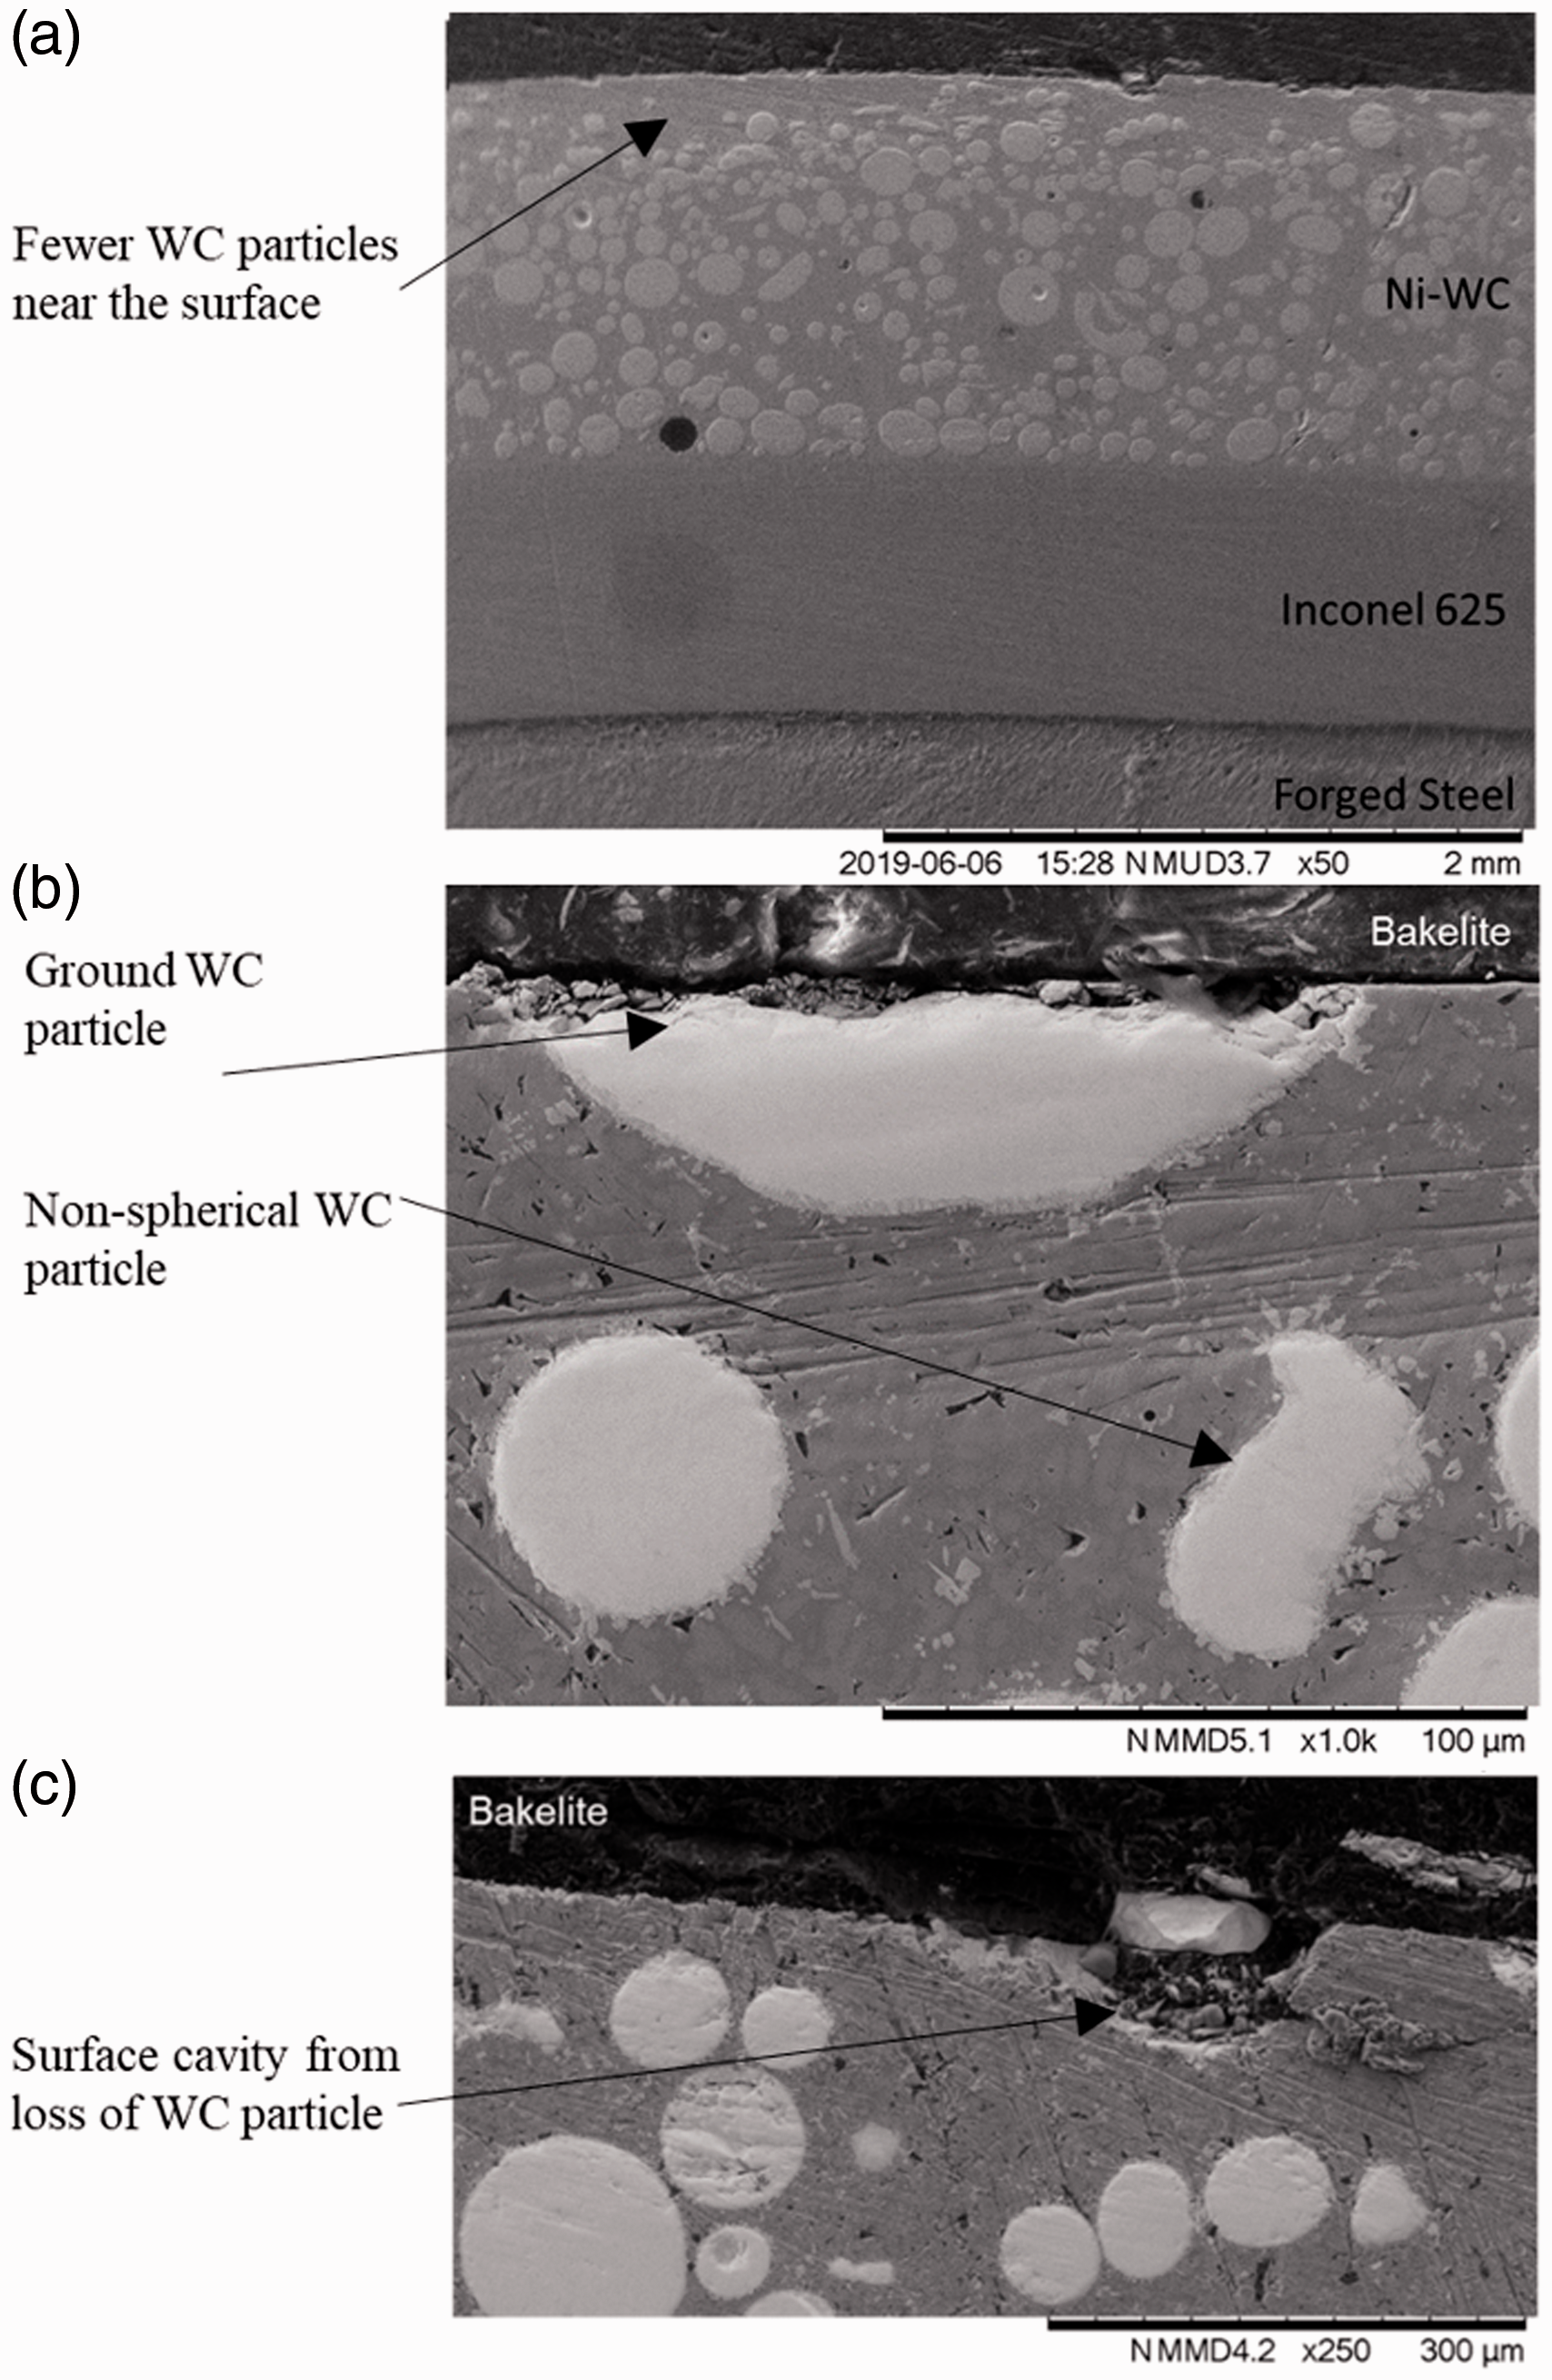
(a) Cross-section image of the clad layers taken with SEM Hitachi TM3030Plus at 50×; (b) ground WC particle in Ni-WC matrix coating; (c) post grinding WC particle cavity in Ni-WC matrix coating.
Surface analysis and characterisation
Roughness measurements were obtained with the Alicona InfiniteFocusSL. Microhardness measurements were obtained with the Struers Durascan automated tester, using a Vickers indenter with 0.3 kg load. Nanoindentation tests were performed using the Hysitron Ti-Premier and with a Berkovich diamond indenter with an Elastic Modulus of 1140 GPa and Poisson’s Ratio of 0.07. The equipment was calibrated with fused quartz and polycarbonate calibration samples prior to testing. A load of 8 mN was applied and held for 5 seconds while the load and displacement of the indenter was recorded. The reduced elastic modulus and hardness were calculated as a function of contact depth using the Oliver and Pharr methodology. 28
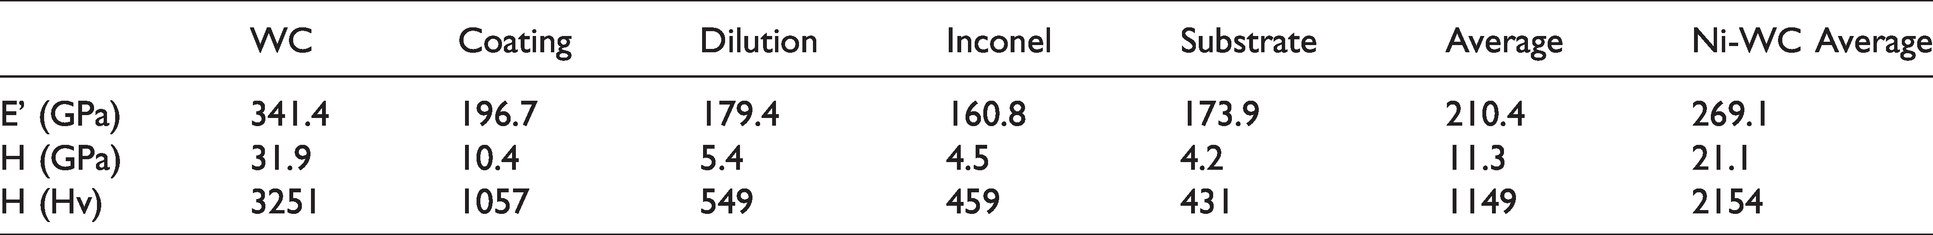
Four nanoindentation measurement sets were obtained from five regions. The regions included the WC spherical particle centre, the surrounding Nickel alloy material (excluding the WC particles), the dilution zone between the Ni-WC and Inconel 625, the middle of the Inconel 625 layer and the substrate (pinion forged steel). The results are summarised in Table 2. The reduced elastic modulus and hardness of the substrate and Inconel 625 is similar, while the Ni-WC average reduced elastic modulus is significantly higher. This is due to the WC particles which have a value of 341 GPa and their surrounding alloy which has a value of 196.7 GPa as opposed to 160–174 GPa for the Inconel and substrate. The hardness of the WC particles exceeds 3000 Hv which makes it ideal for abrasive applications. The hardness of the surrounding material is around 1000 Hv which results in an average coating hardness of around 2000 Hv, significantly higher than the chrome plating hardness. The force versus displacement graphs shown in Figure 5 were illustrated using different colours for each repeat nanoindentation measurement taken. The spread of the result indicates the variation of properties in each coating, which is significant for understanding the role of the materials used in the coatings, especially when these results are used in modelling and computer simulations. For example, in Figure 5(a) the material includes WC particles, and the indentation may have been taken in the centre of the WC particle, near the edge of the particle or in the surrounding material, which will exhibit significantly different stiffness. In Figure 5(c) there is a transition from one material to another, so the large spread shown here is directly linked to material’s behaviour, where a large spread may translate to unpredictable and/or inhomogeneous behaviour.
Material properties from nanoindentation.
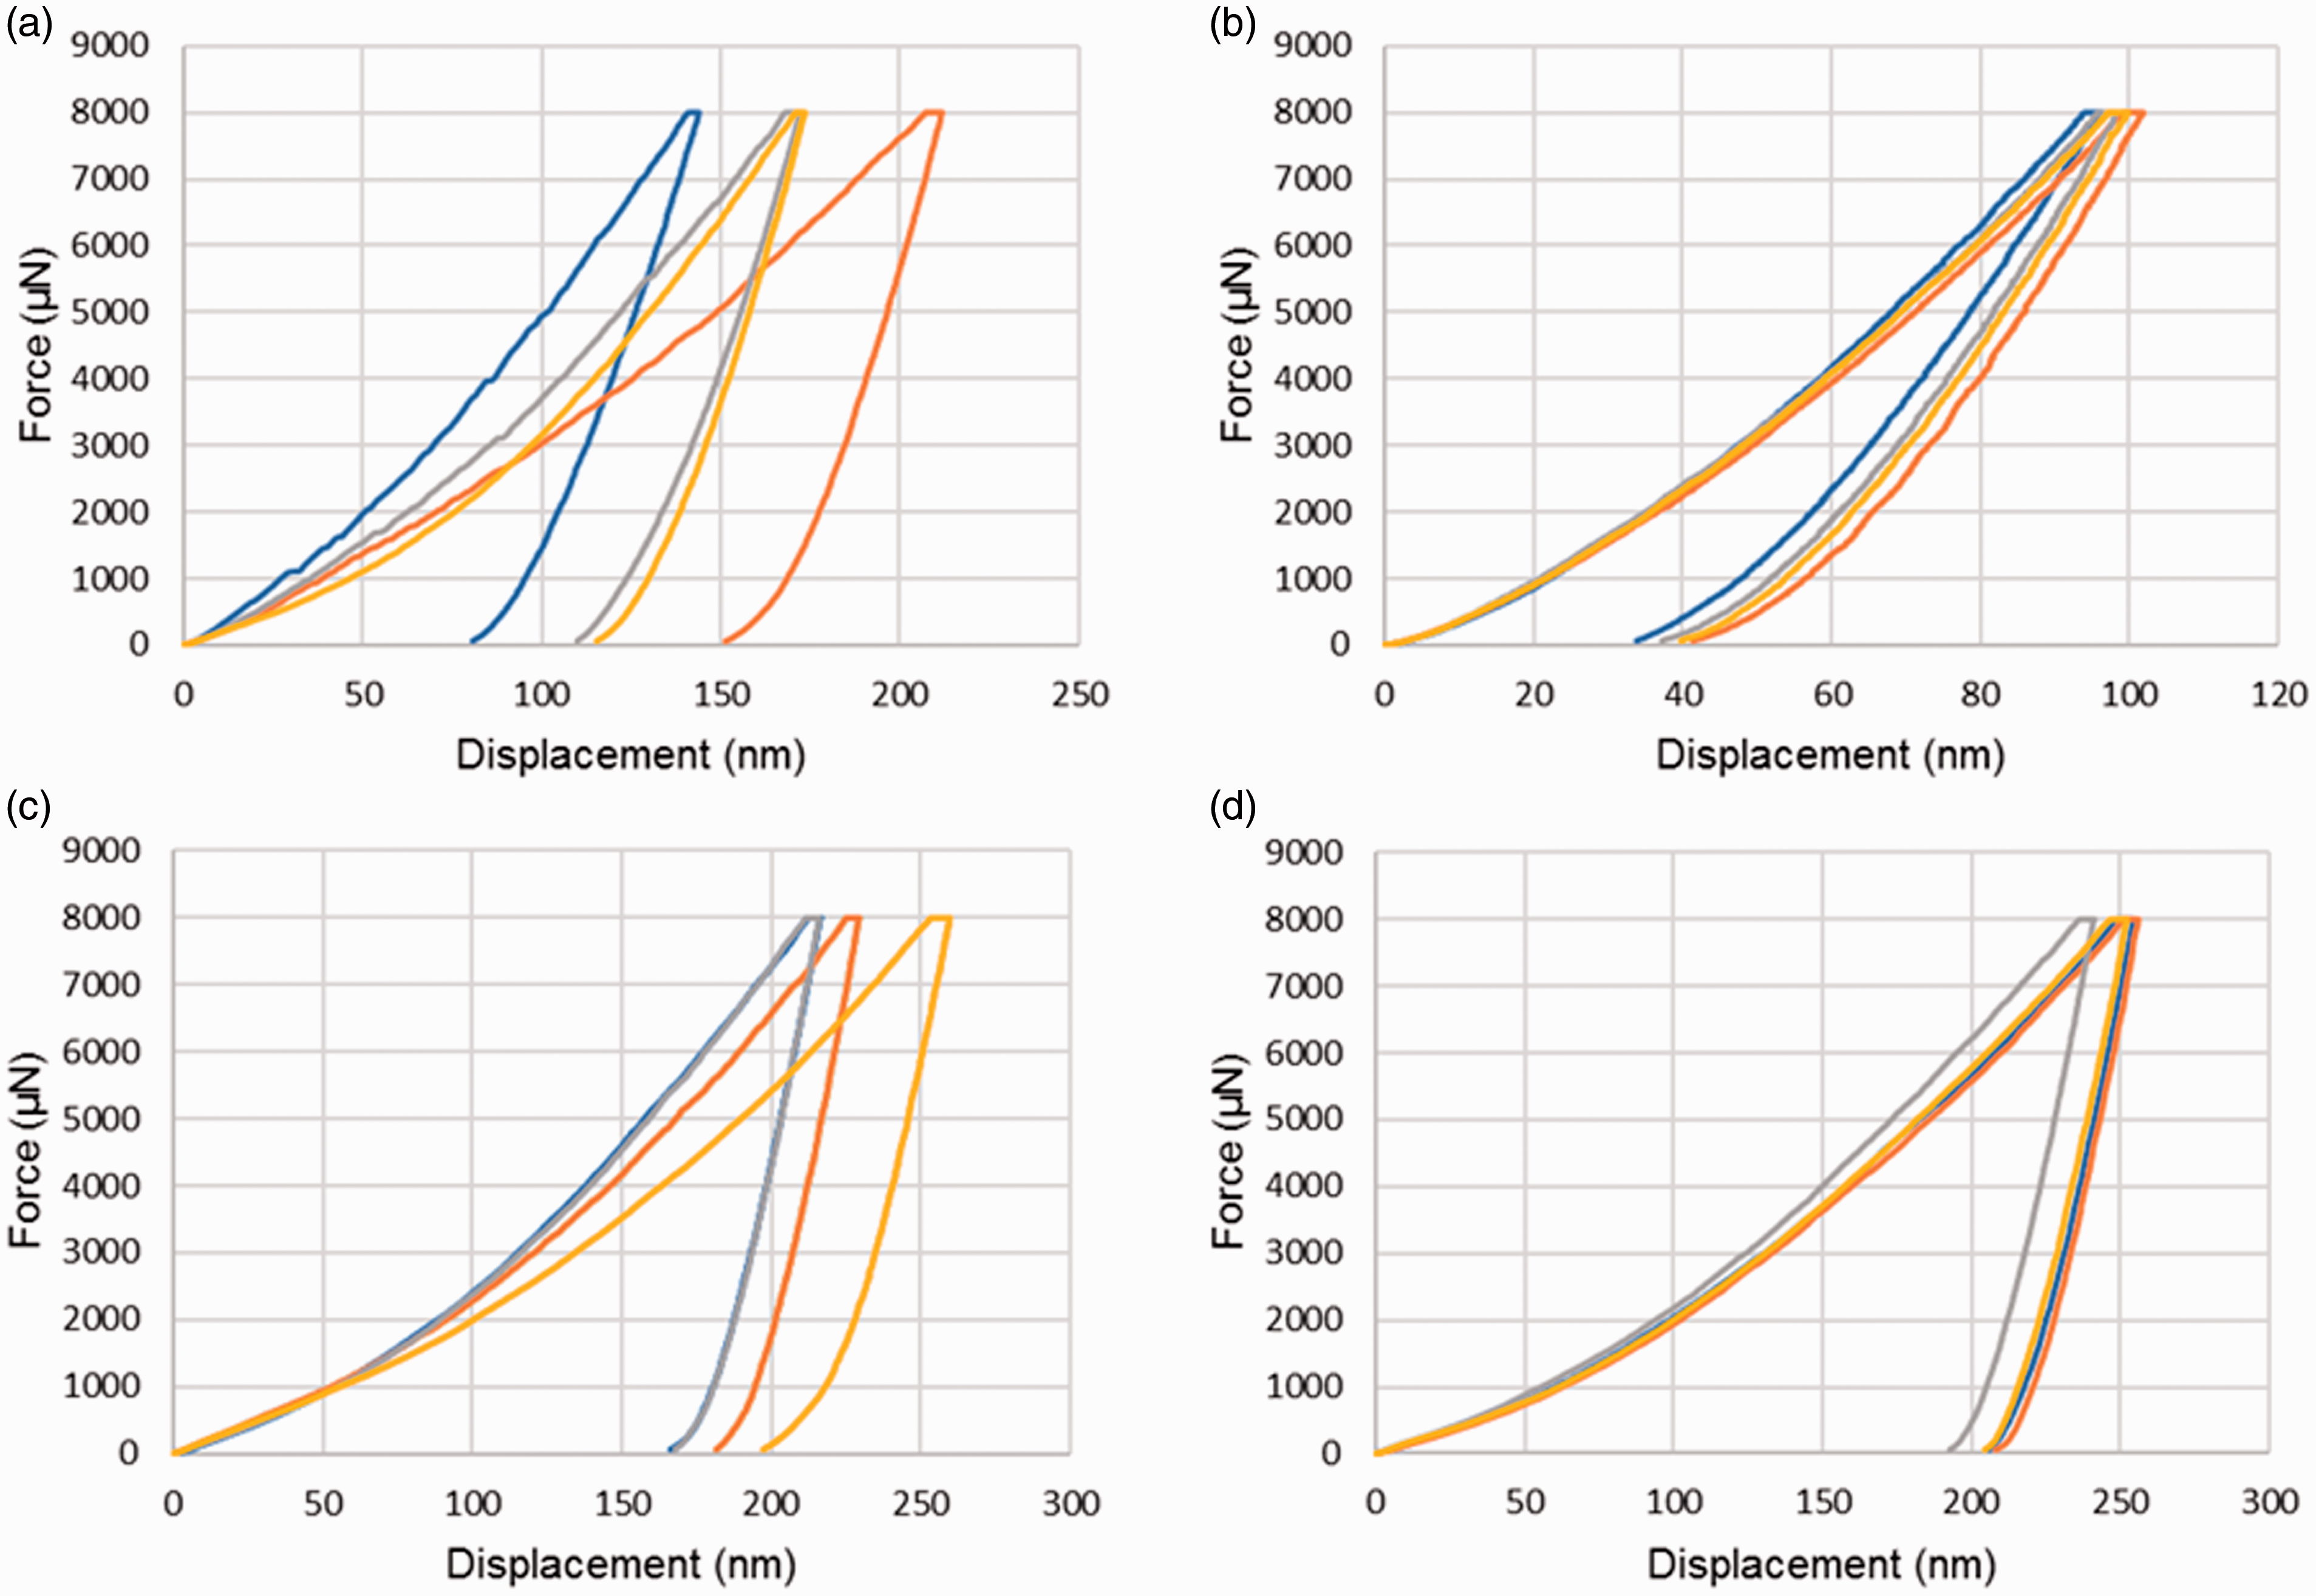
Force vs displacement graphs for different regions in the clad material: (a) Ni-WC matrix; (b) WC particles; (c) dilution zone between Ni-WC and Inconel 625; (d) Inconel 625.
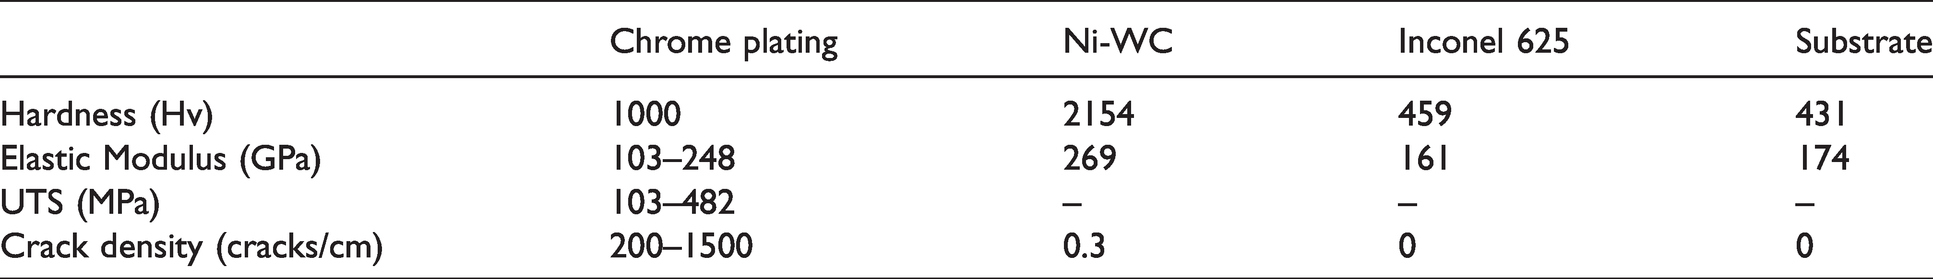
Table 3 shows a comparison of the coatings and substrate, where the chrome properties were obtained from literature,18–20 while the remaining properties were obtained via nanoindentation, with the detailed measurements listed in Table 2. Crack density of the Ni-WC was observed with an optical microscope.
Mechanical properties for coatings and substrate.
The Ni-WC matrix can be applied via laser cladding as a hard facing, the WC grains are not affected by the laser and maintain their intrinsic properties, such as hardness up to 3000 Hv ± 500 Hv. This was achieved with the Lasercarb® process, which was specifically developed to slightly melt the clad material in order to produce a metallurgical bond with the substrate, without affecting the grain structure of the powder. Amado et al. 27 studied the microstructure and hardness of spherical fused Tungsten Carbide (WC) particles and concluded that the average hardness was about 1000-1500 Hv. A 1 mm layer of Inconel 625 was applied onto the substrate prior to applying the Ni-WC coating of 1 mm, to create a multilayer coating comprising of a softer, more ductile Inconel 625 and a harder, more brittle Ni-WC as the interface coating. The purpose of the softer intermediate layer is to interrupt the propagation of cracks generated on the outer layer towards the substrate. In addition, residual stresses can be generated during the laser cladding process due to the thermal expansion of the substrate and coating material, and an intermediate layer can help reduce these stresses. 29 The layers of each material were typically cladded thicker and ground back with a cylindrical grinding machine. The resultant coating thickness is about 0.8 mm for the intermediate layer and 1.2 mm for the outer layer. Preheating was applied to the substrate prior to the cladding process and substrate target temperature was maintained. Other clad parameters such as feed rate, laser power, traverse speed, overlap and so on were critically chosen by the operator based on their experience and knowledge and were paramount in achieving dense coating with low dilution, minimal micro-cracks and with excellent bonding between coatings and substrate.
The through thickness hardness of the two coatings and substrate was captured with a hardness test as shown in Figure 6. The graph is split into three distinct regions, the first is the Ni-WC coating where the average hardness is 550 Hv. The WC spherical particles hardness measurements were excluded from this graph and shown in Figure 7. The middle region in Figure 6 is the intermediate coating layer of Inconel 625, with an average hardness of 272 Hv and the region on the right belongs to the substrate material with an average hardness of 325 Hv. Two regions have been highlighted, which indicate a transition from one coating to the next, these are the dilution zones. They are characterised by either a sharp rise in hardness or a sharp drop, followed a sharp rise. The laser clad coatings (Ni-WC matrix and Inconel 625) exhibit the desired hardness of a harder outer coating with a softer intermediate coating and their dilution zones are in the region of 5% of the coating thickness.
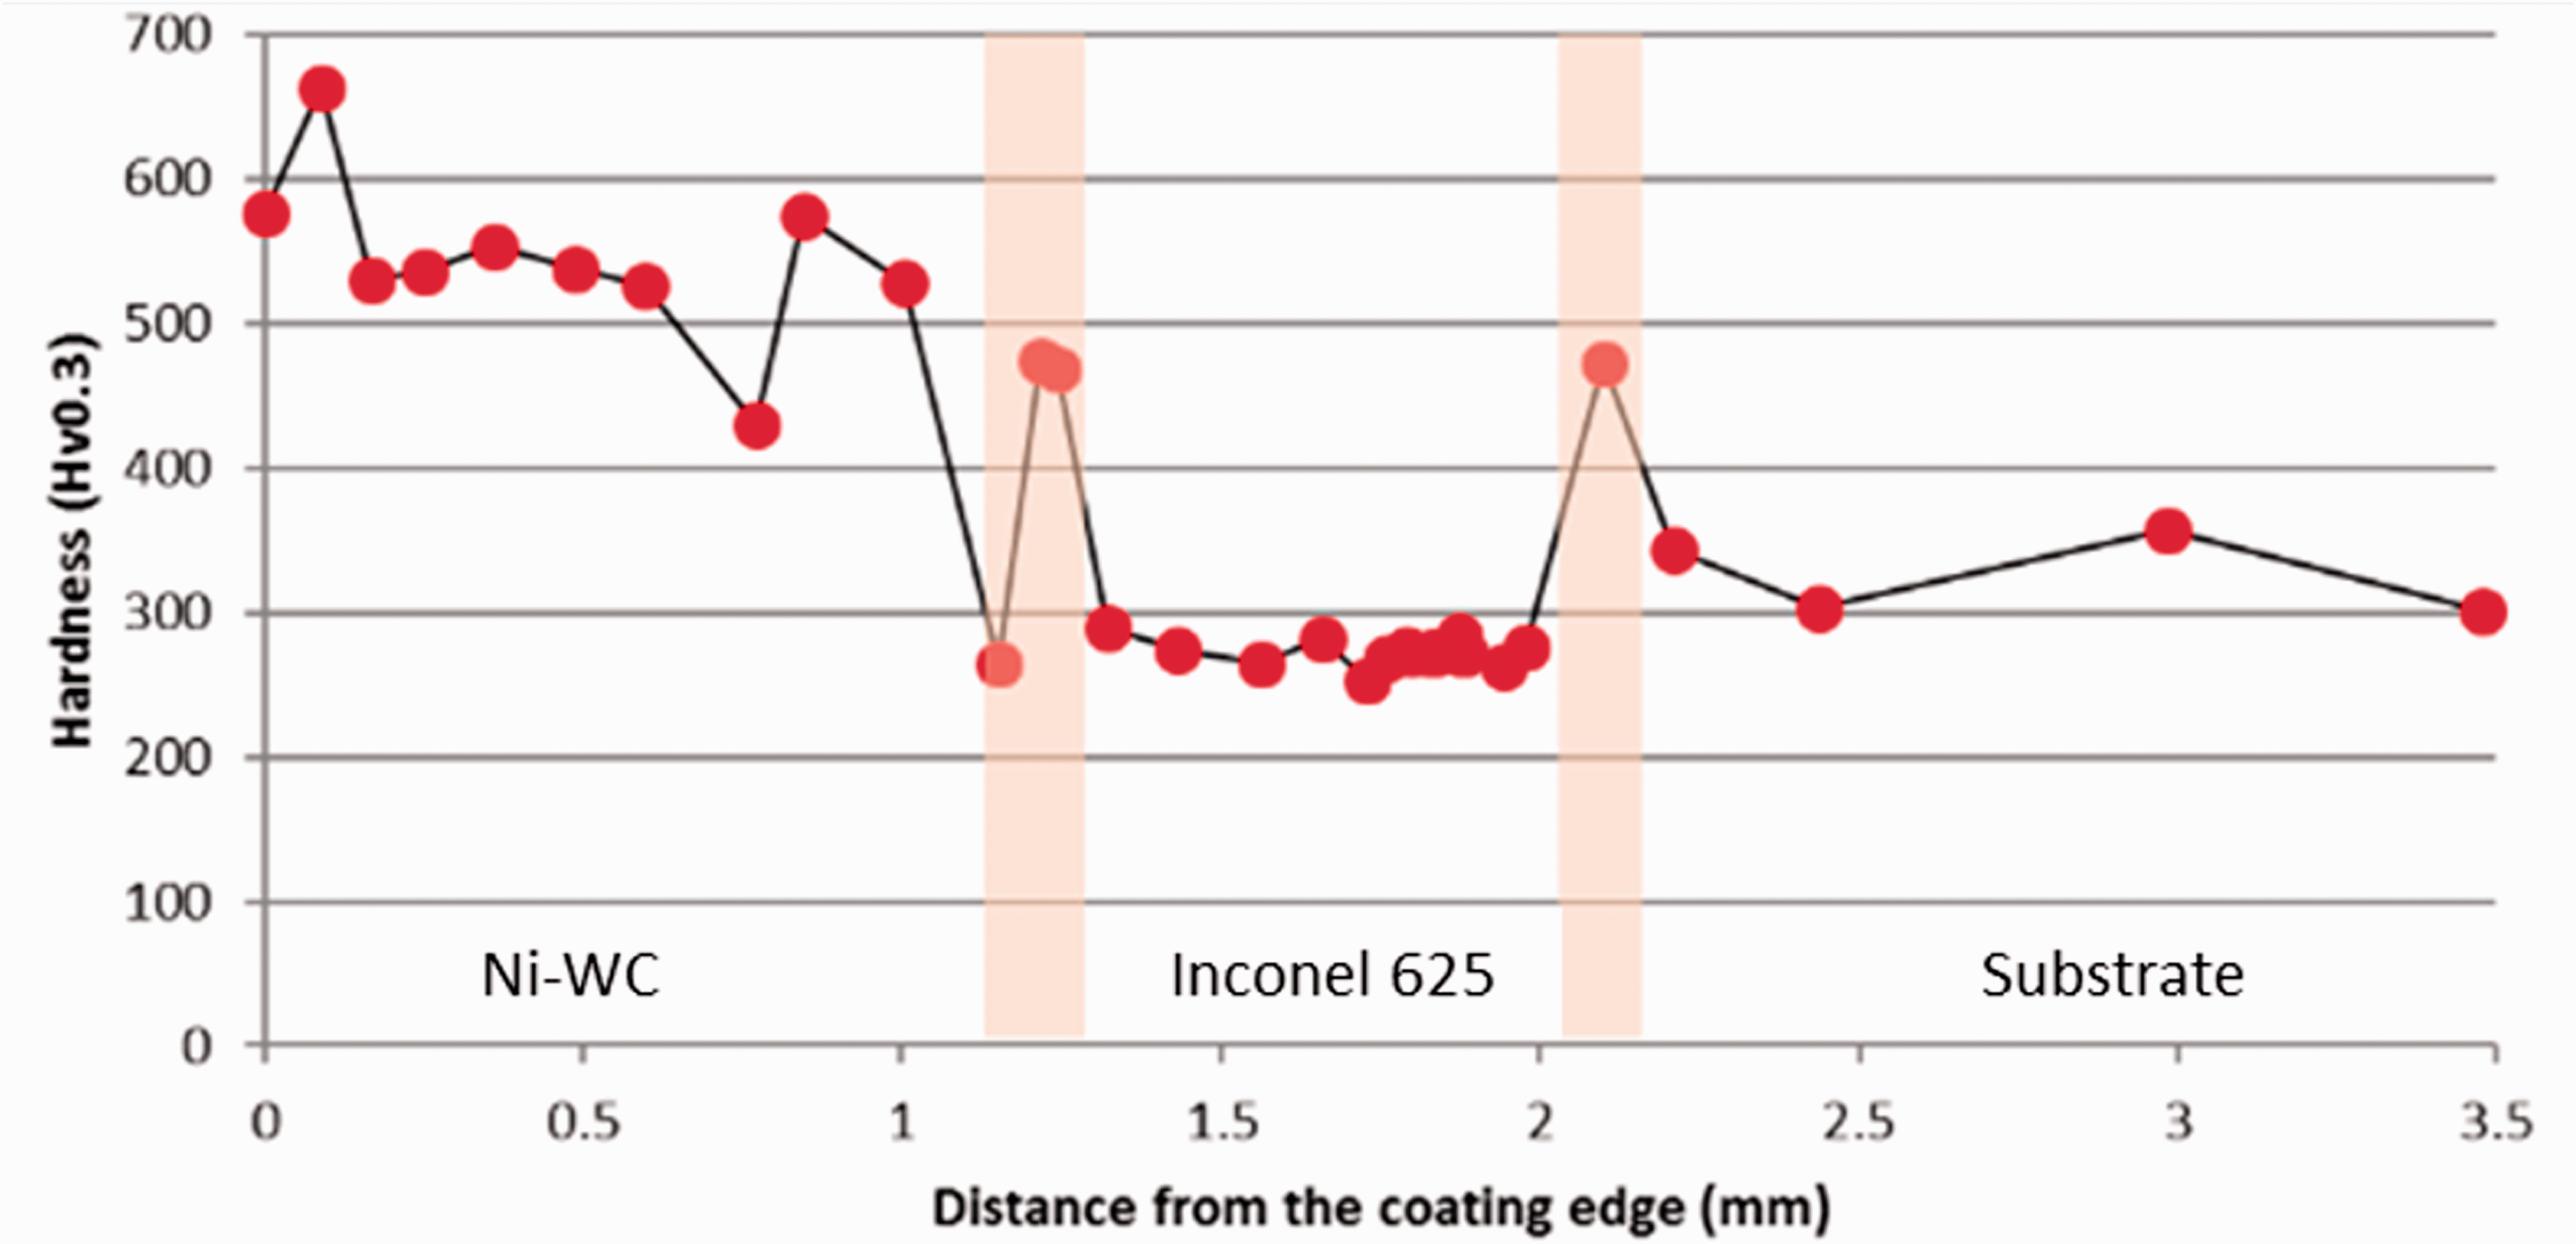
Microhardness through the coating layer section (WC regions excluded).
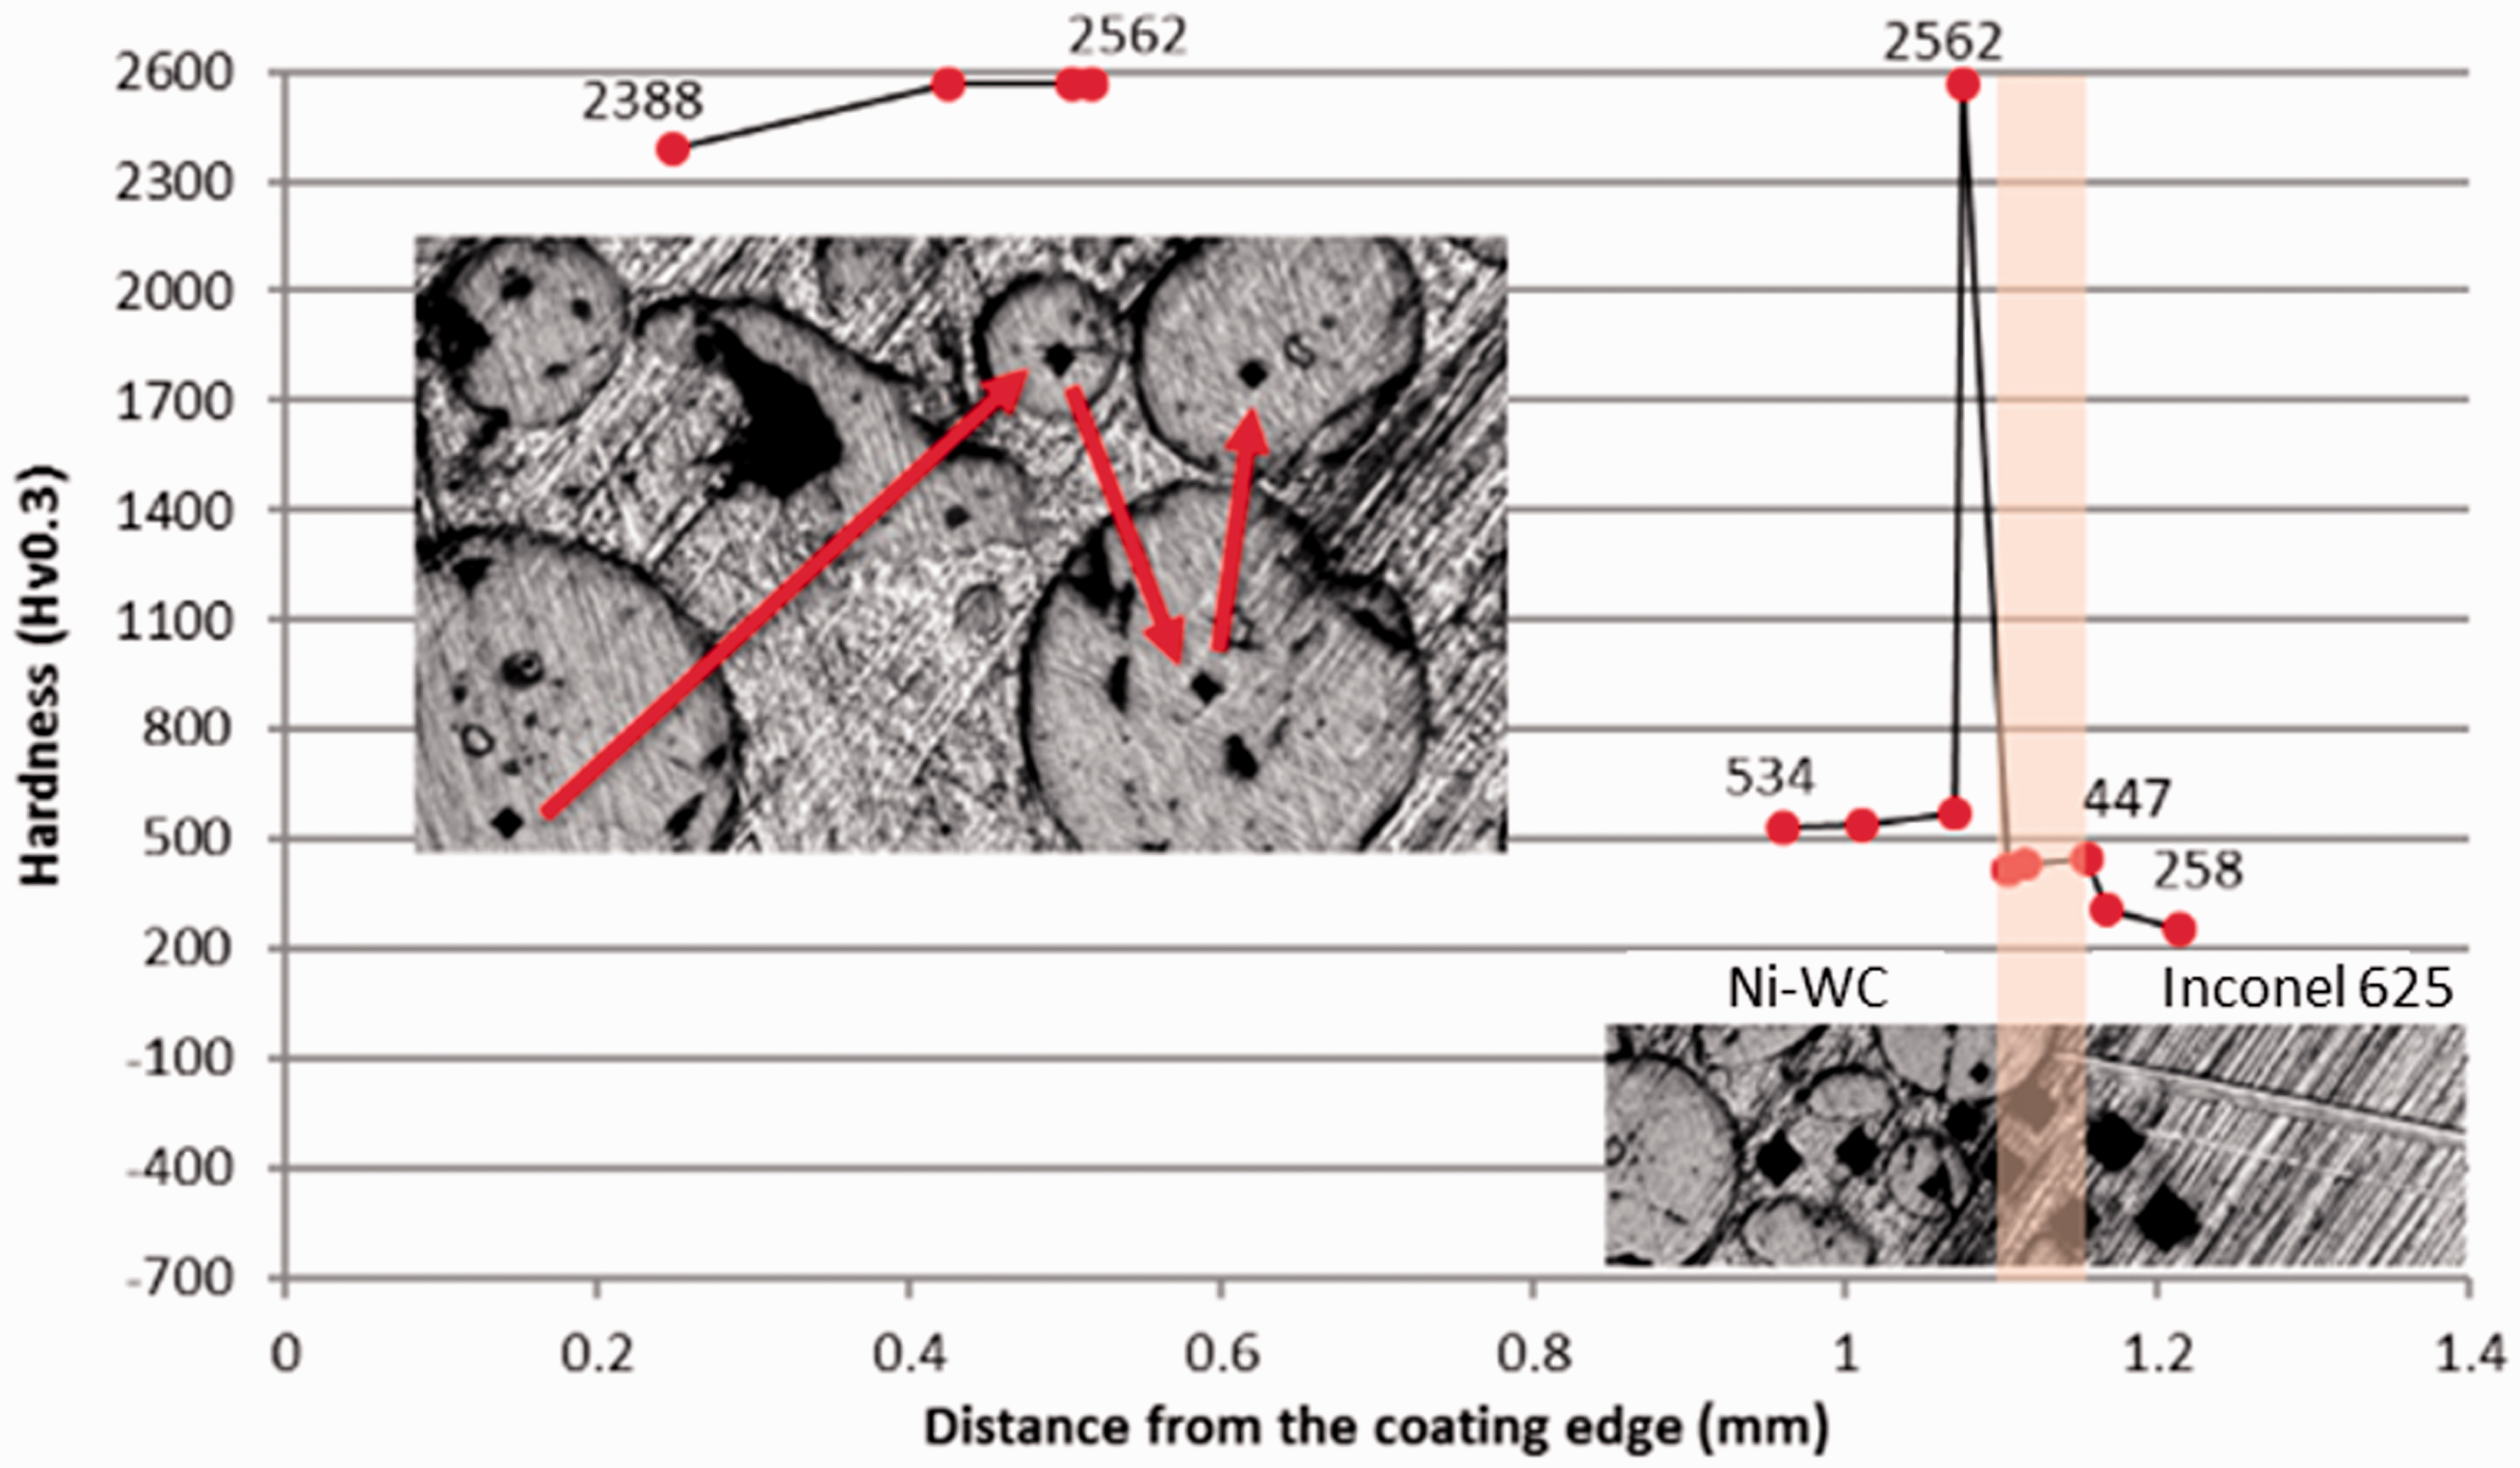
Microhardness on WC (left) and dilution zone (right).
The hardness measurements on WC spherical particles are shown in Figure 7, with an average hardness of 2500 Hv. On the same graph the dilution zone hardness between the two clad layers and the corresponding image is shown. The spike is a measurement on a WC particle. The hardness in the dilution zone changes in stages, with values exceeding 500 Hv on the Ni-WC, in the region of 450 Hv on the dilution zone (highlighted area) and below 300 Hv on the Inconel 625.
SEM optical microscope images were obtained for surface analysis. Figure 8 is an SEM image in the BSE mode, showing the WC particles and surrounding Nickel-based alloy. The WC particle contains multiple micro-cracks (indicated by black arrows) due to its brittle nature and there is a sharp transition with the surrounding alloy (indicated by white arrows).
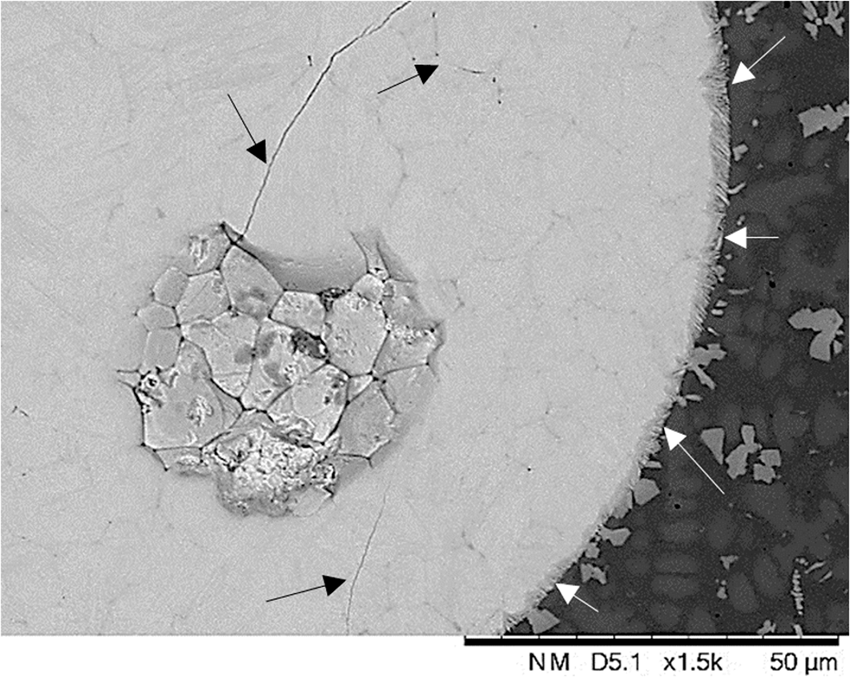
WC particle: detail of microstructure formation.
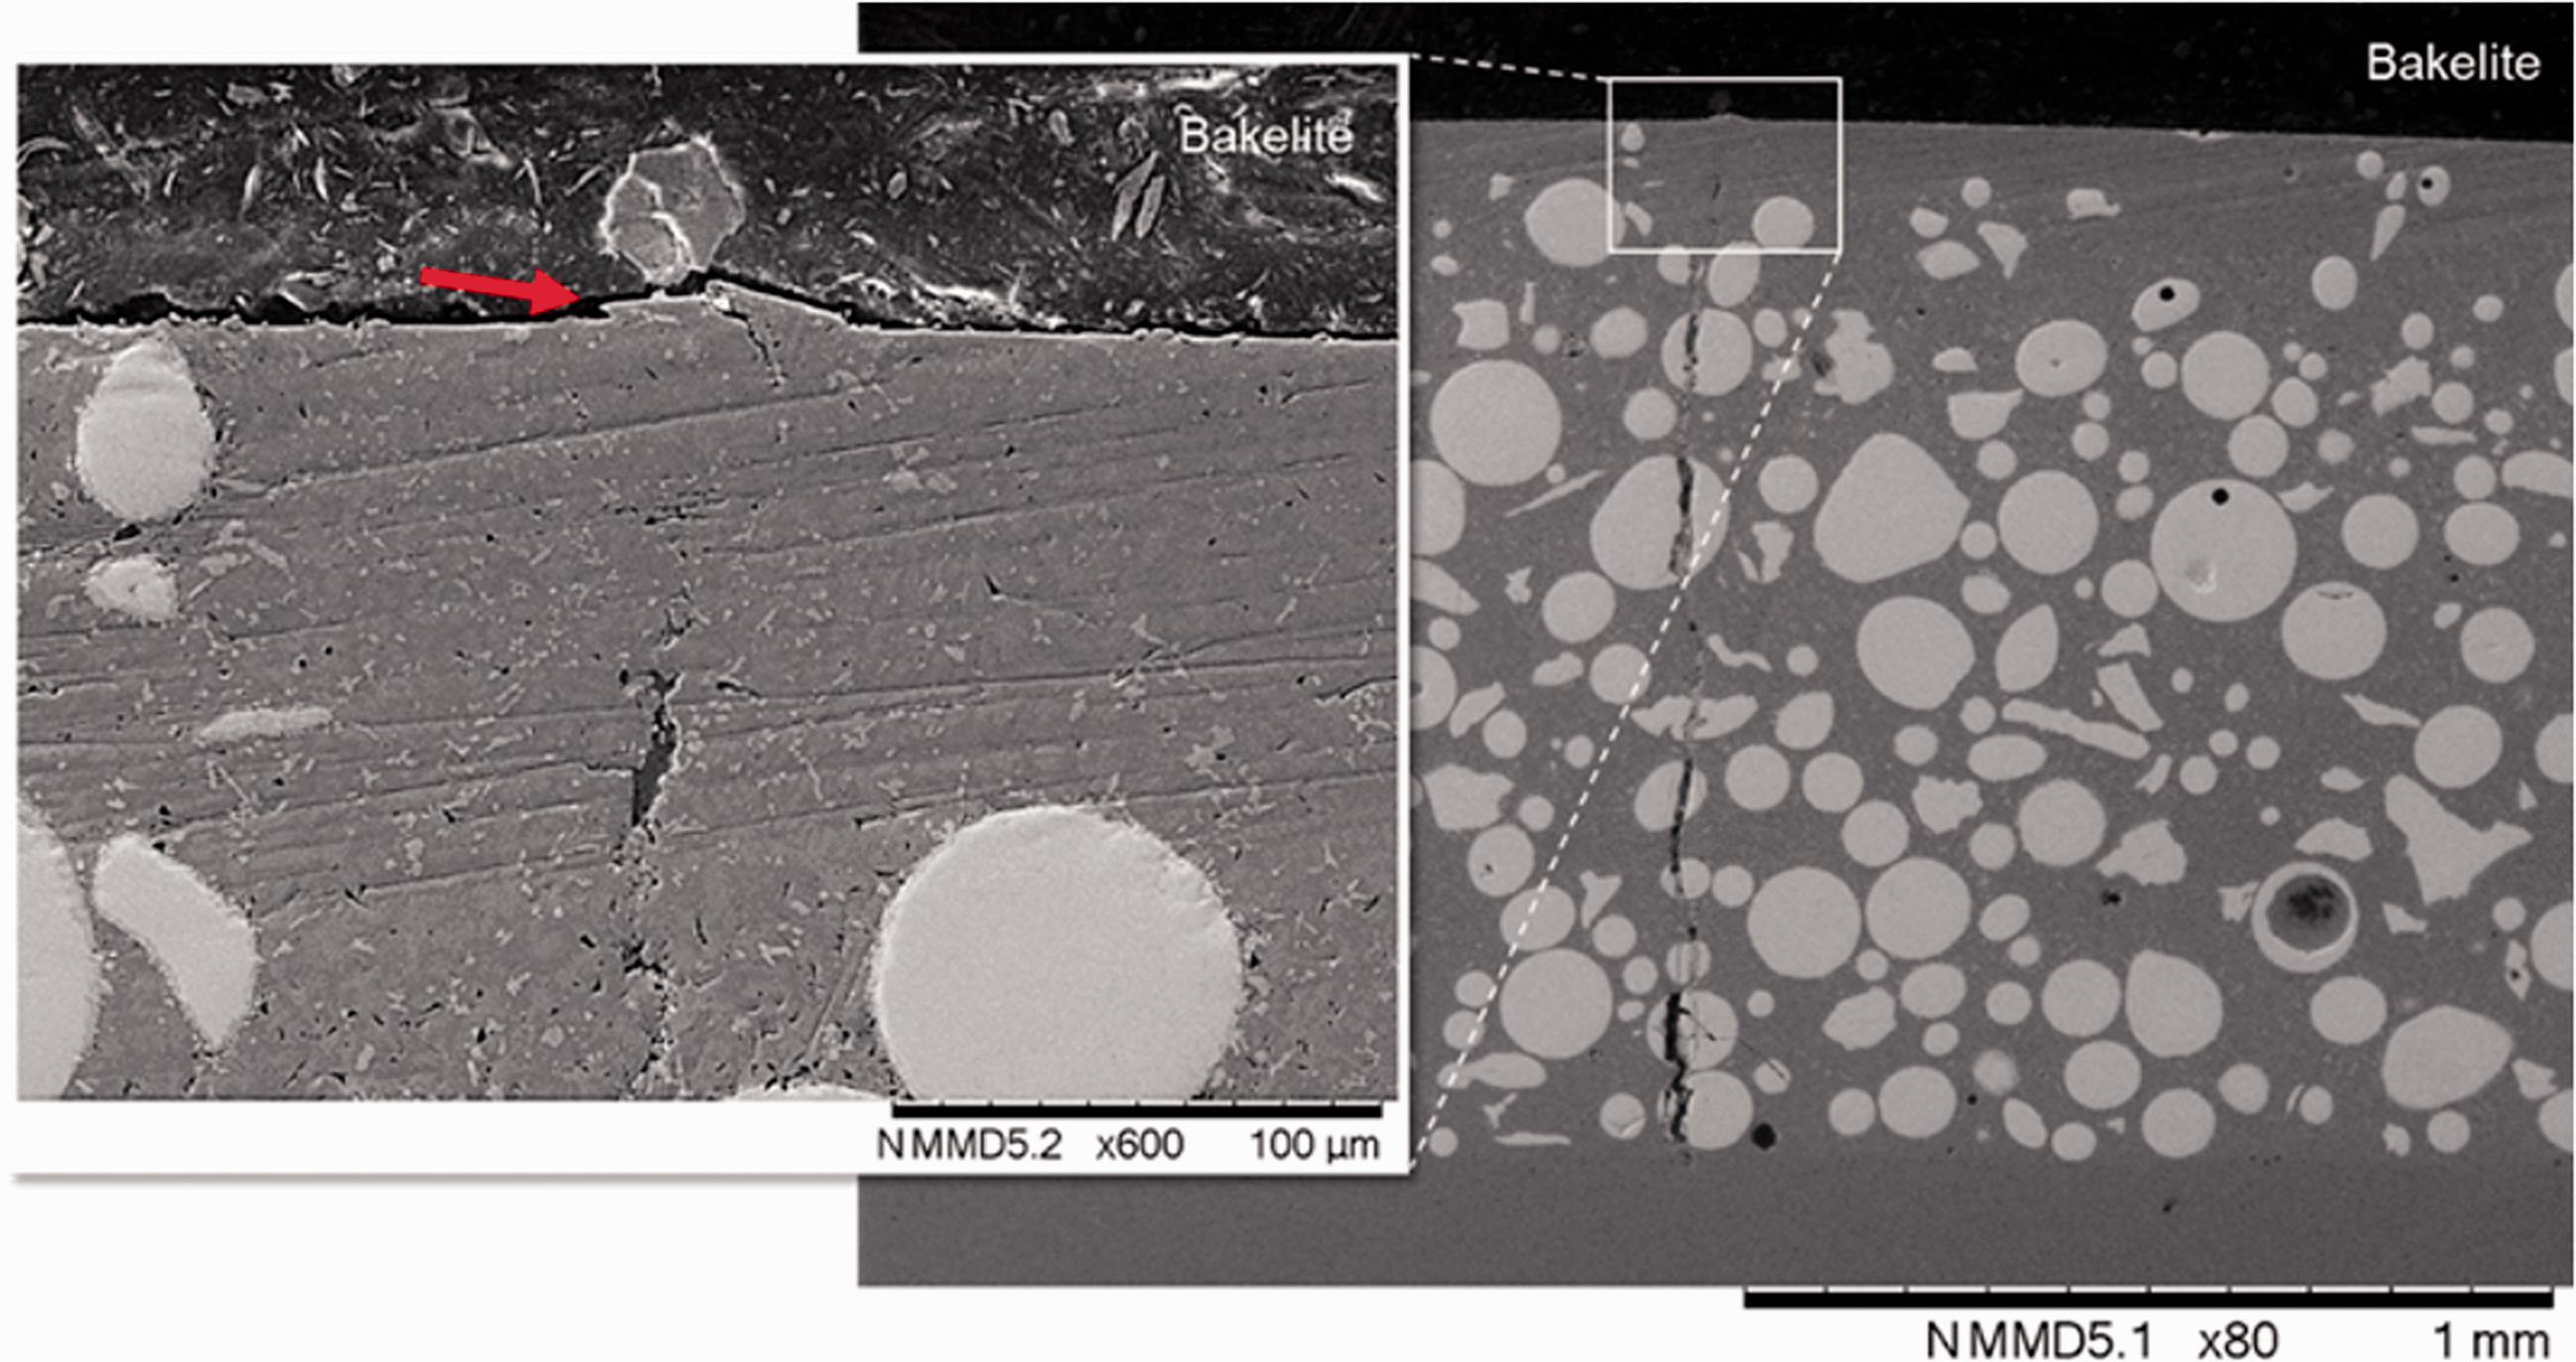
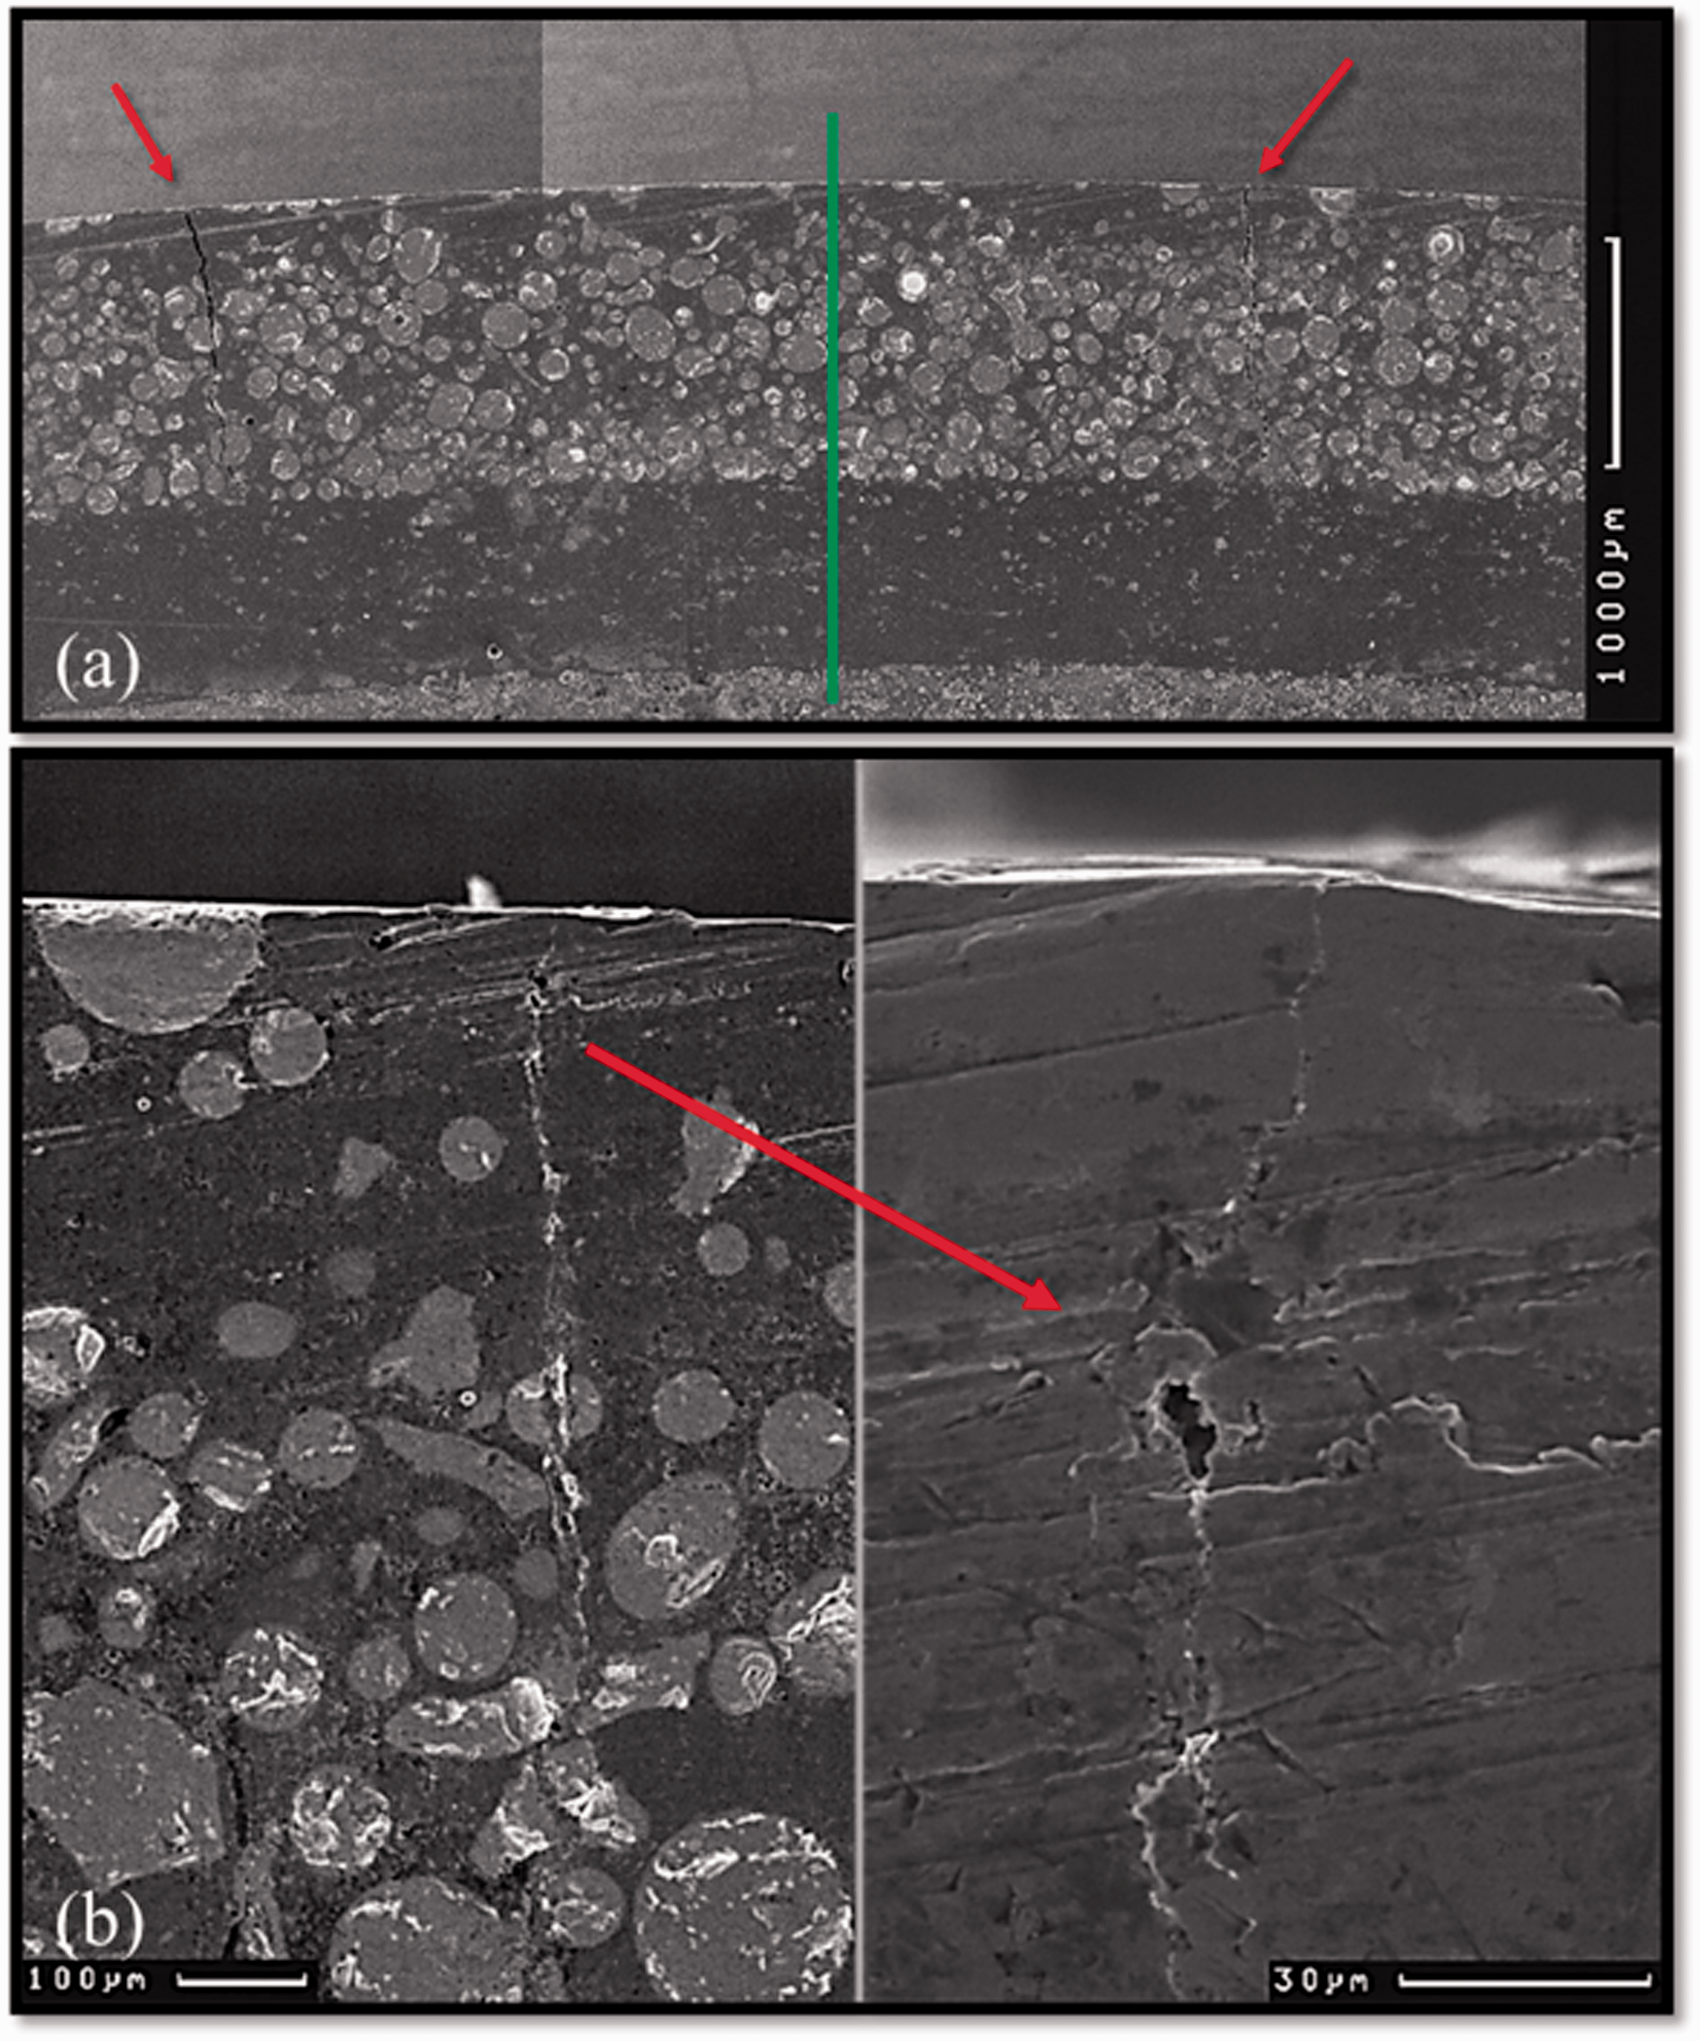
Both coating techniques are expected to contain micro cracks. This might be a result of the brittleness of the chrome or because of the rapid cooling of the laser clad process. Surface cracks were present in the chrome plated pinion, which is the reason it was taken out of service in the first place. Micro-cracks on the chrome layer have been identified with SEM at various locations and with large distance between the cracks in comparison to the crack length. Some cracks extend through the thickness of the chrome layer and it is unclear how much the Electrical Discharge Machining (EDM) process, which was used to produce the test specimens, has contributed to cracking. An example is shown in Figure 9(a). Although the clad coating had no surface cracks after the cladding process, new cracks appeared on the test specimens after machining using the EDM. Figure 9(b) is a close view of a surface crack in the clad test specimen, where arrows point out individual surface cracks. The gap distance between the surface cracks was measured using a micrometre and was found to be around 3.5 mm–5 mm. The cracks seem to be superficial and when observed carefully, the crack path is parallel to the pinion’s axial direction. It is also influenced by the nearest surface pitting cavities. Very few cracks extend through the thickness of the top clad layer. A clad mounted sample was identified that had a crack through the top clad layer, as shown in Figure 10. It can be observed here that a small fraction of the surface is raised while the crack is closed, which is one of the factors that make the cracks visible from the surface, as opposed to an open crack that would generate a surface groove. Hydrodynamic lubrication forces are exerted on this surface during service and a raised surface is preferable to an open crack since the hydrodynamic forces may contribute to crack propagation of the open crack tip.
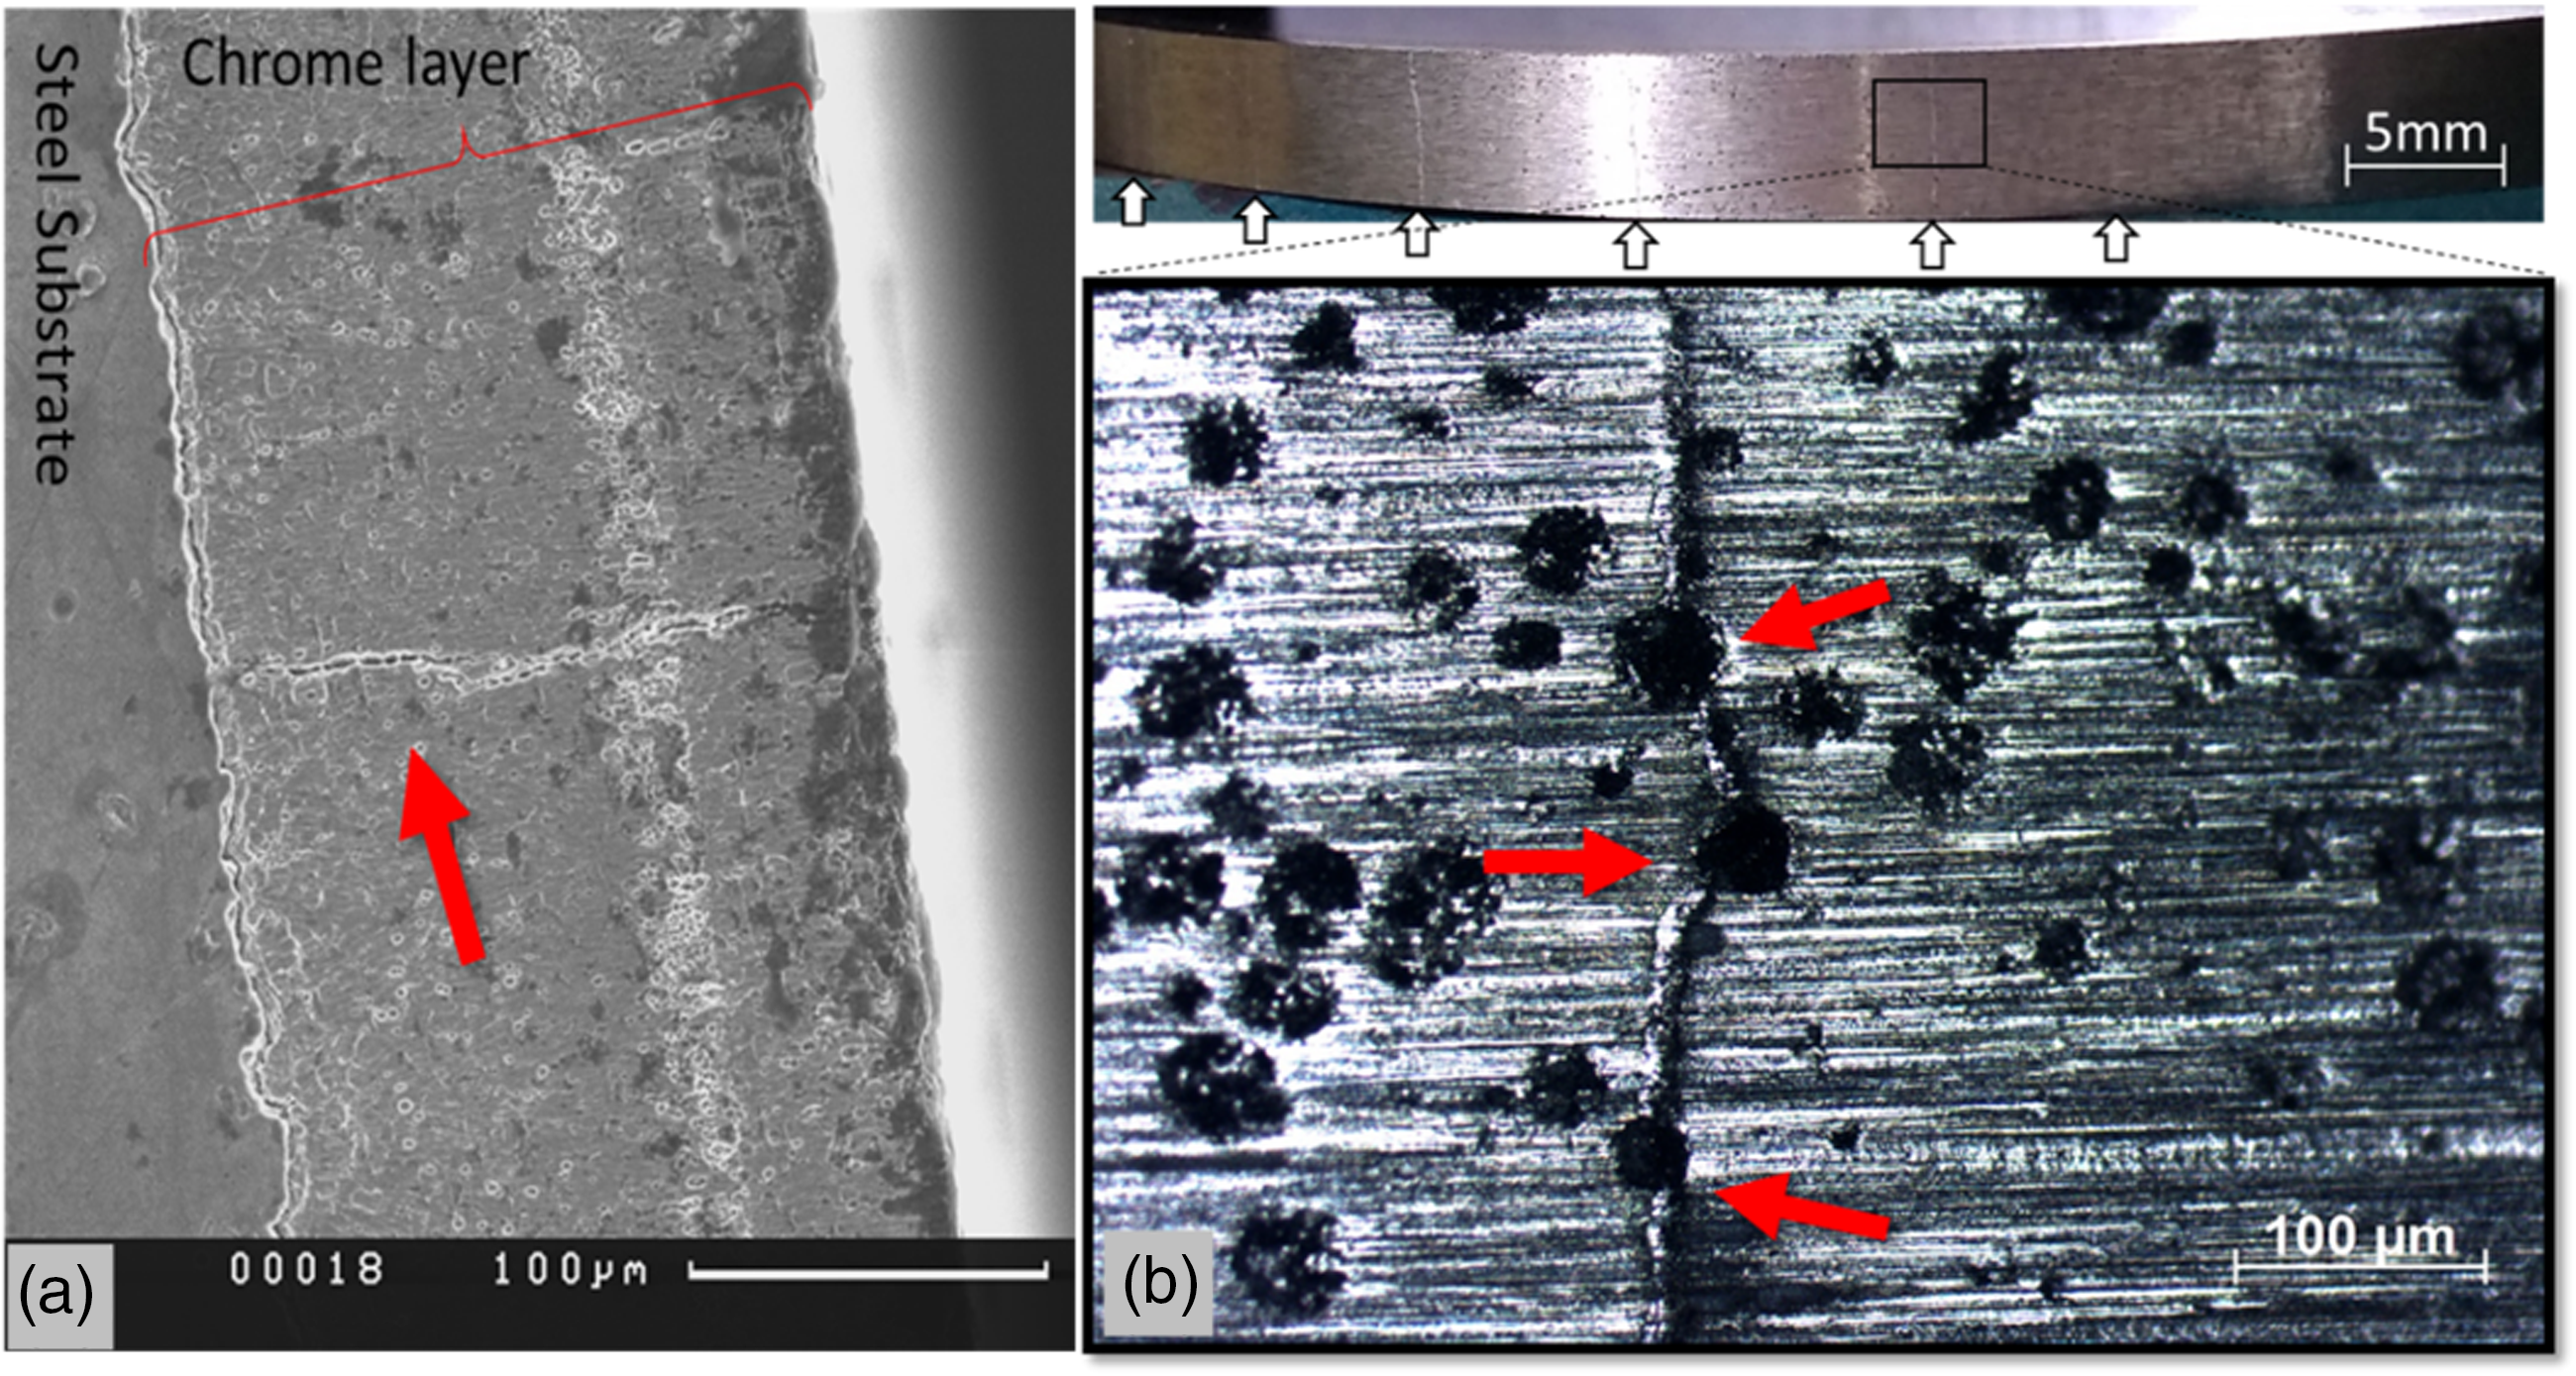
(a) Micro-cracks on the chrome layer prior to testing; (b) Clad surface crack, as found in multiple locations on the surface.
Crack through the Ni-WC matrix.
The laser clad pinion sample is shown in Figure 11. An area of 20 mm × 10 mm was scanned for surface roughness using the Alicona InfiniteFocusSL, see reference surface scan in Figure 11(a) and top view of the scan in Figure 11(b). Test specimens from area 2 of the pinion sample were used for roughness and micro-hardness measurements. The corresponding 3 D scan image on the top right is taken from this scan. The 2 D image of the scan is shown at the bottom of the figure. Surface A is the Ni-WC matrix layer, surface B is the Inconel 625 intermediate layer and surface C is the substrate. All three surfaces were ground on a cylindrical grinding machine, using a diamond grinding disc. The stepped surfaces between A–B and B–C in Figure 11 are the untreated clad surfaces and hence they have a rough texture. The horizontal lines in Figure 11 indicate the measurements parallel to the pinion’s central axis (in red) while the vertical lines are measurements parallel to the circumference/perpendicular to the pinion’s central axis (in green). The results are shown in Figure 12 in Rz (peak height), Rq (root-mean-square) and Ra (average) roughness of profile in µm. The “Work roll material” figures are roughness measurements taken from cylindrical specimens of ø45mm from parallel tests of Ni-WC matrix applied on work roll material used in the steel industry. The surface on these cylindrical specimens was ground using a ceramic grinding discs as opposed to a diamond disc. The surface finish was found to be significantly smoother in the axial and circumferential direction, which is preferable for the interaction of the surface with the bearings during industrial operation.
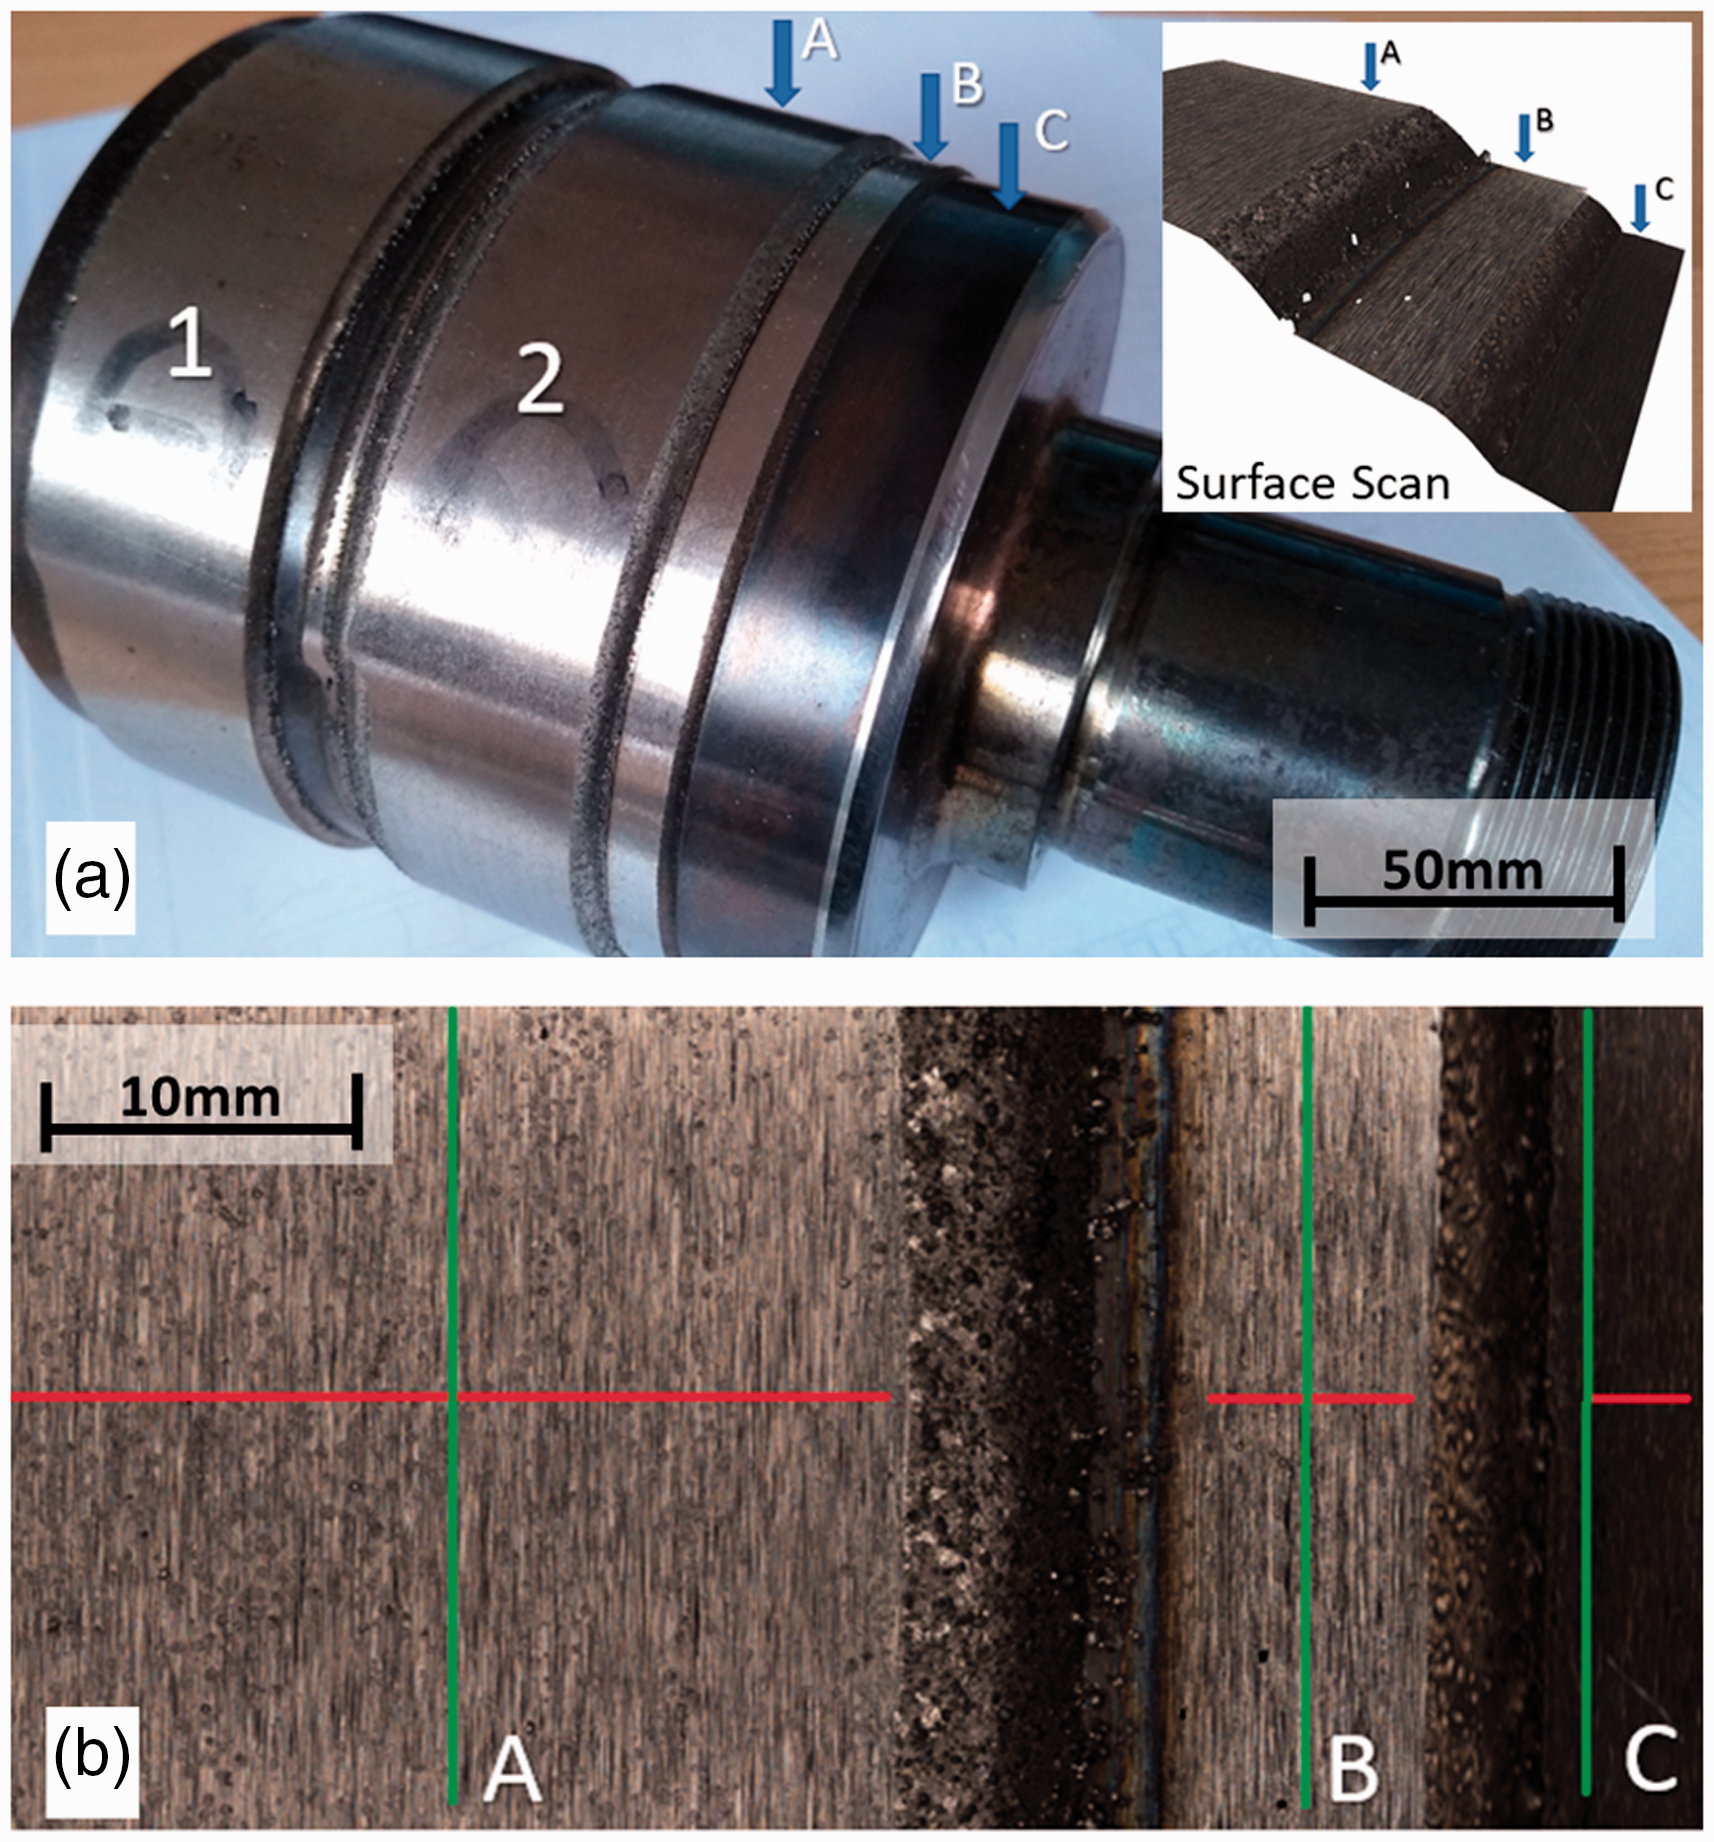
Image of cladded pinion (a) and corresponding top view of the Alicona scan surfaces A, B and C (b).
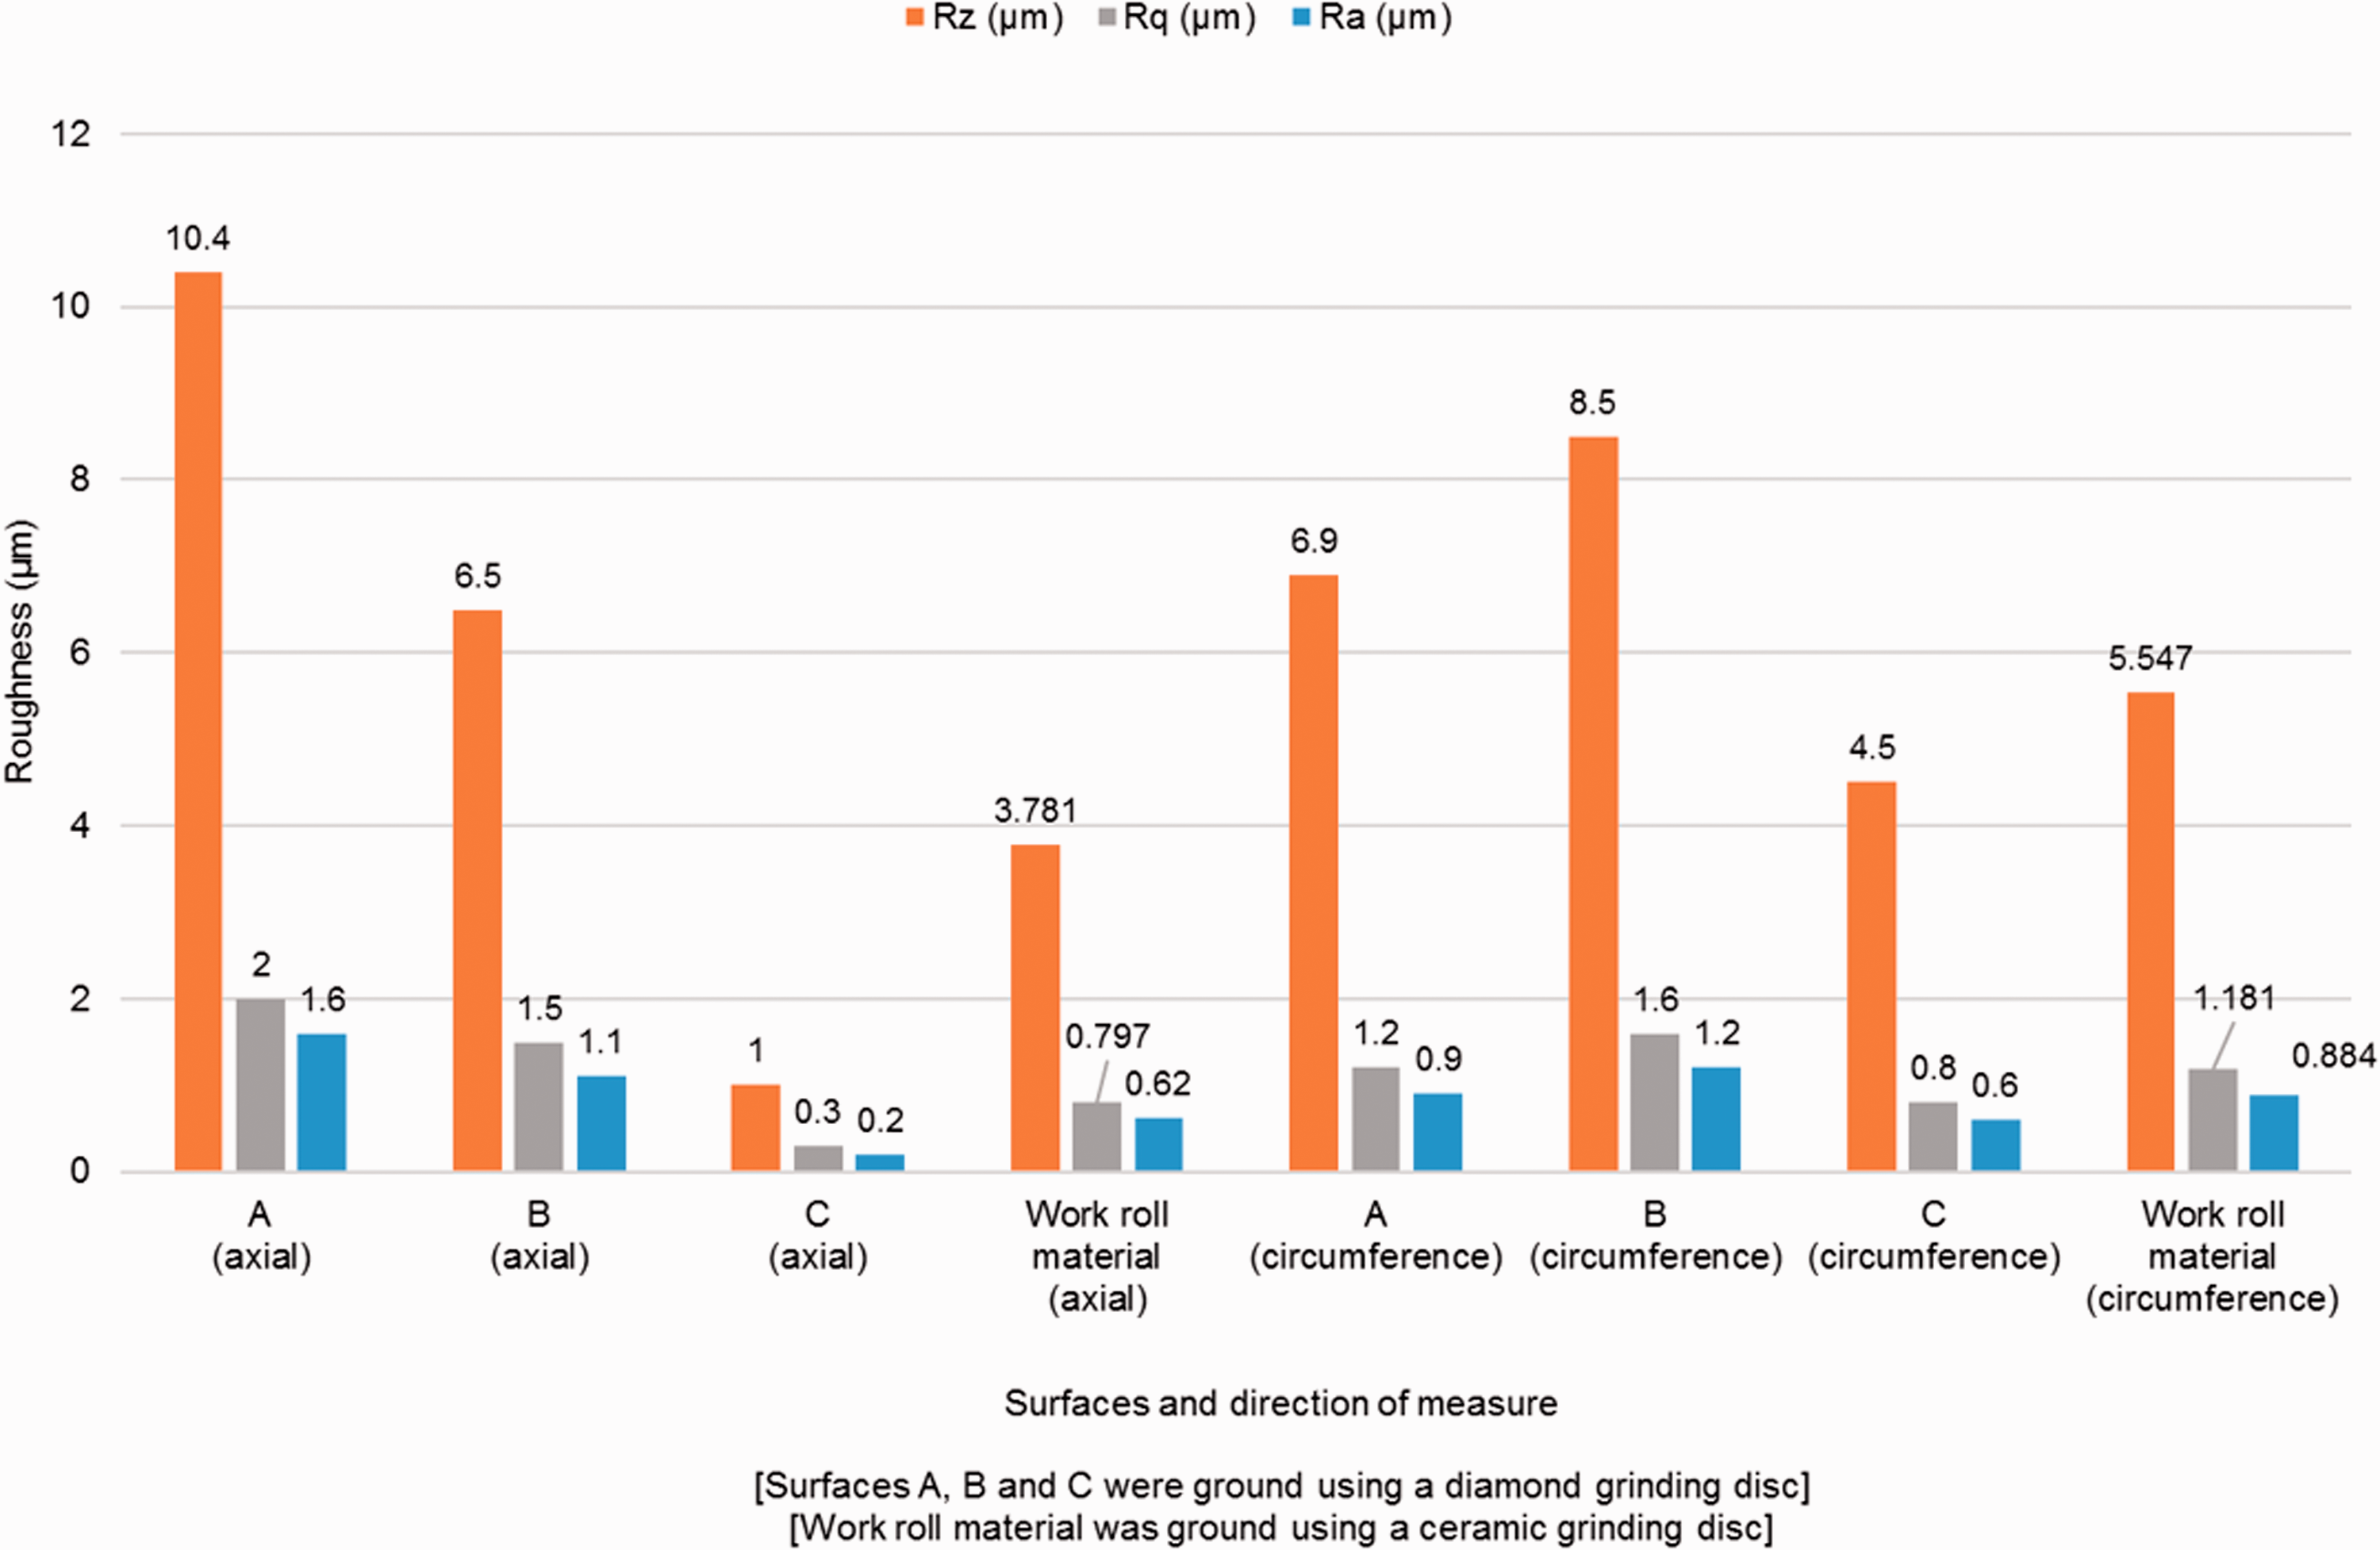
Roughness measurements.
Generally, the chrome plating finish roughness is about 0.1–0.2 µm Ra. A surface roughness of up to 0.6 µm Ra would be acceptable for parts of the pinion surface that are in direct contact with bearing components. This is to ensure a smooth surface, free from large asperities that may contribute to material pick-up during mounting and dismounting of the tapered sleeve. The resultant roughness was found to be 1.6 µm Ra in the direction parallel to the pinion’s axis and 0.9 µm Ra in the circumferential direction. The roughness and pitting on the surface are probably caused by the grinding process, with the removal of WC spherical particles near the outer clad surface. Such surface roughness values are not acceptable for direct contact with the bearings. However, clad work roll material from a parallel study shown in Figure 12 has shown an improvement in the surface roughness with values of 0.62 µm Ra in the axial direction and 0.88 µm Ra in the circumferential direction.
Test specimen preparation
Test specimens were taken from a roll pinion which was taken out of service due to cracking in parts of the pinion. Two sets of test specimens were made. One set of test specimens was taken from the chrome plated surface, while the second set of test specimens were from a pinion where two layers of laser clad coatings were deposited in two separate batches (see Figure 13). The laser cladding was produced by removing the chrome coating from the original pinion with a grinding machine, followed by pre-heating and application of the laser cladding. Smaller test specimens from both sets were cut using Electrical Discharge Machining (EDM) to ensure accurate cutting of thin test specimens with low heat input from the cutting process.
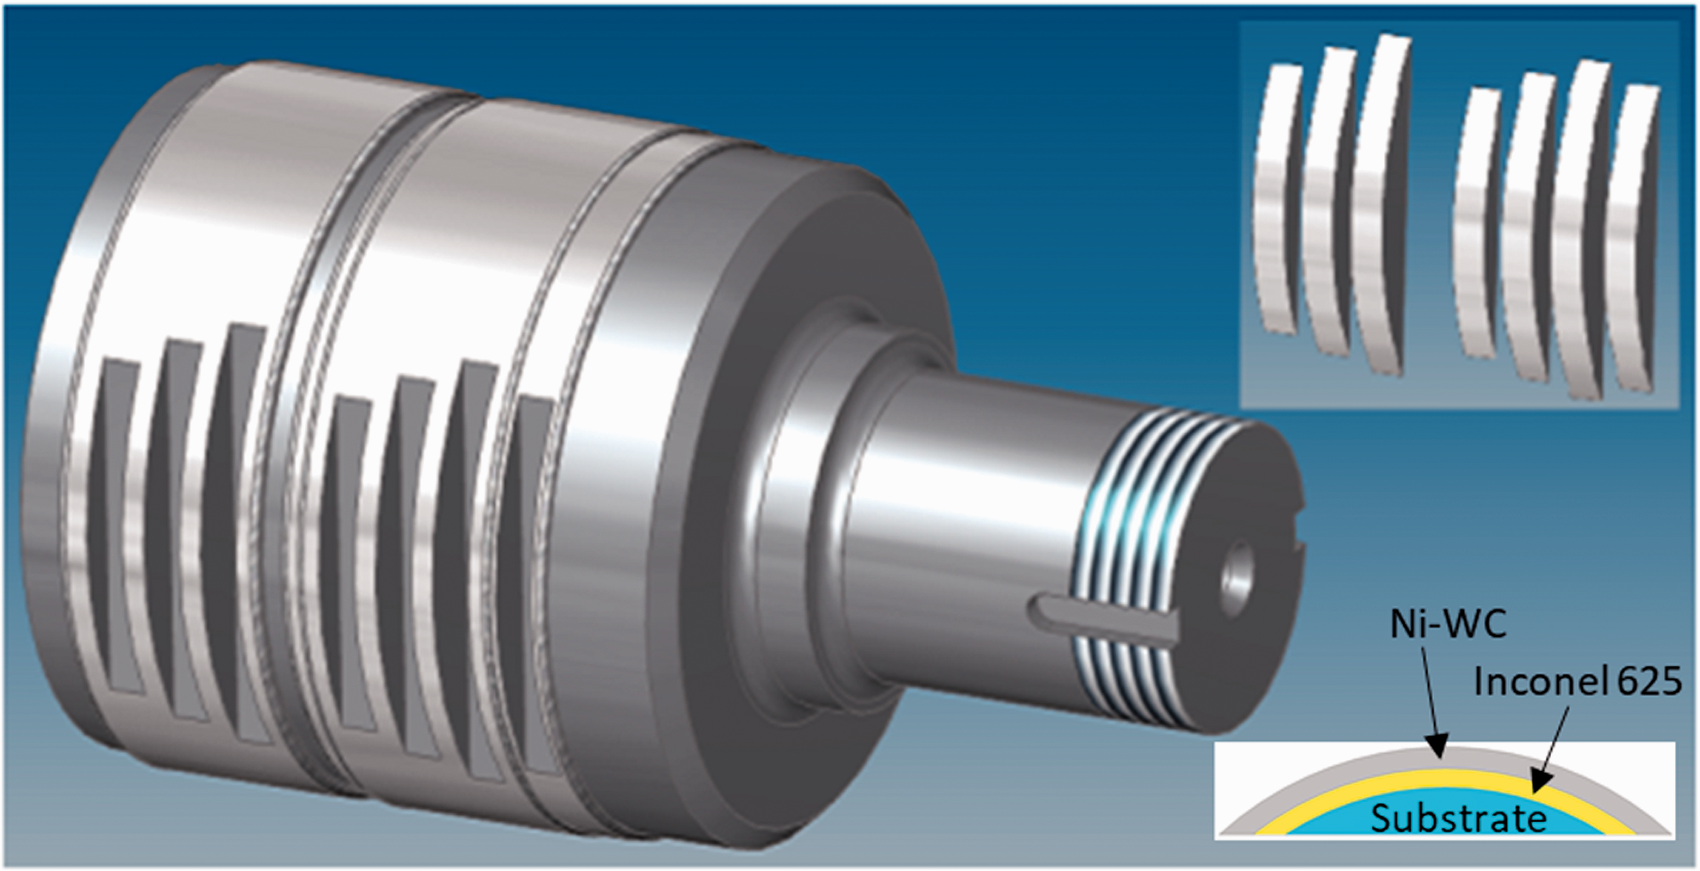
Diagram of various test specimens taken from the clad pinion using EDM.
The test specimens were ground manually on a grinding machine using 1200 grid paper and also polished with 3 µm and 1 µm diamond suspensions. The test specimens were etched using a solution with 4.76% Nitric acid, 47.62% Hydrochloric acid and 47.62% distilled water to reveal the grain boundaries and substructures of the microstructure and to enable a random surface pattern for the DIC identification in the SEM tests. For the UTM tests, matt acrylic white paint was applied on the test specimens by brushing, while matt acrylic black paint was sprayed on top with an airbrush in order to create a speckle pattern for DIC identification. Spray parameters such as nozzle opening, air pressure and paint density (controlled with thinner additive) were varied in order to produce the appropriate size black speckle pattern with good contrast with the background white paint. Figure 14(a) shows the detail of the speckle pattern for the macro test specimen, with an enlarge view in Figure 14(d). Figure 14(b) shows the unpainted side of the same test specimen, which had a height of 12 mm. The micro test specimen used in the SEM tests is shown in Figure 14(c) and had a height of 8 mm. All test specimens had a thickness of 5 mm (distance between painted and unpainted faces) and the radius (R) of the curved face was 50 mm.
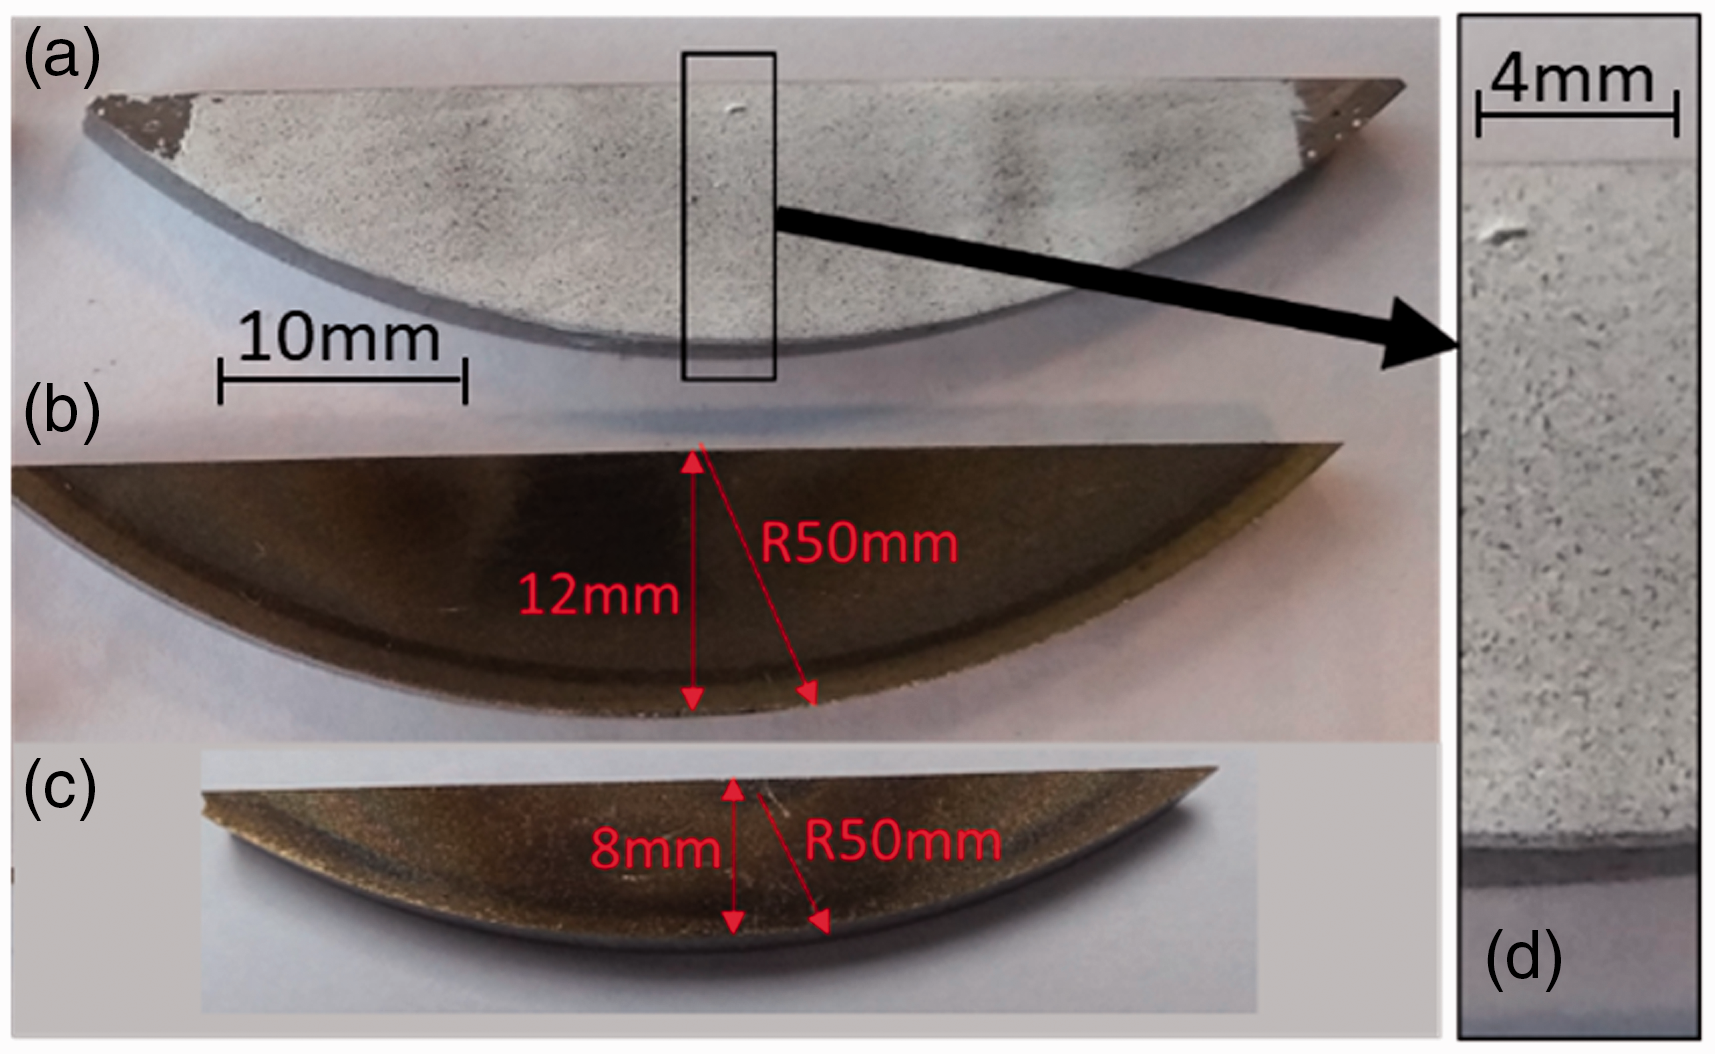
Laser clad test specimens of 5 mm thickness, macro (a) and (b) at 12 mm height and micro (c) at 8 mm height.
Test method
A micro-crack bend test was chosen as a method of initiating cracks on the coating’s surfaces for direct comparison of the coating’s crack initiation and propagation properties. Furthermore, strain values can be measured during the test with the use of LaVision DaVis DIC software. 30 Thin chromium coatings typically contain micro-cracks due to the electroplating process and the brittle nature of the material. Similarly, the Ni-WC coating also contains micro-cracks due to the extremely hard carbide particles that are fused in a comparably softer Nickel-based alloy. The bending tests were aimed at investigating cracks larger than the inherent micro-cracks in the chrome and clad layers.
Preliminary tests on a three-point bend test in the Camscan series 2 Scanning Electron Microscope 31 were performed with a chrome test specimen from an out of service pinion sample. The test specimens had undergone preparation revealing the microstructure and were observed under load with a speed of 0.1 mm/min, on a tooling geometry with 5 mm diameter pins and a 37 mm spacing between the collinear support pins which were in contact with the coated concave face, see Figure 15. Although an effort was made to produce thin test specimens to allow bending at lower force, the bending module reached the end of the force capacity at 4.8 kN. Each laser clad coating (1 mm) is five times thicker than the chrome plated coating (0.2 mm), so it was decided to perform the remaining bending tests on a Tinius Olsen UTM which has a higher loading capacity. Post-test analysis of the micrographs obtain from the SEM test were used to study the strain with DIC.
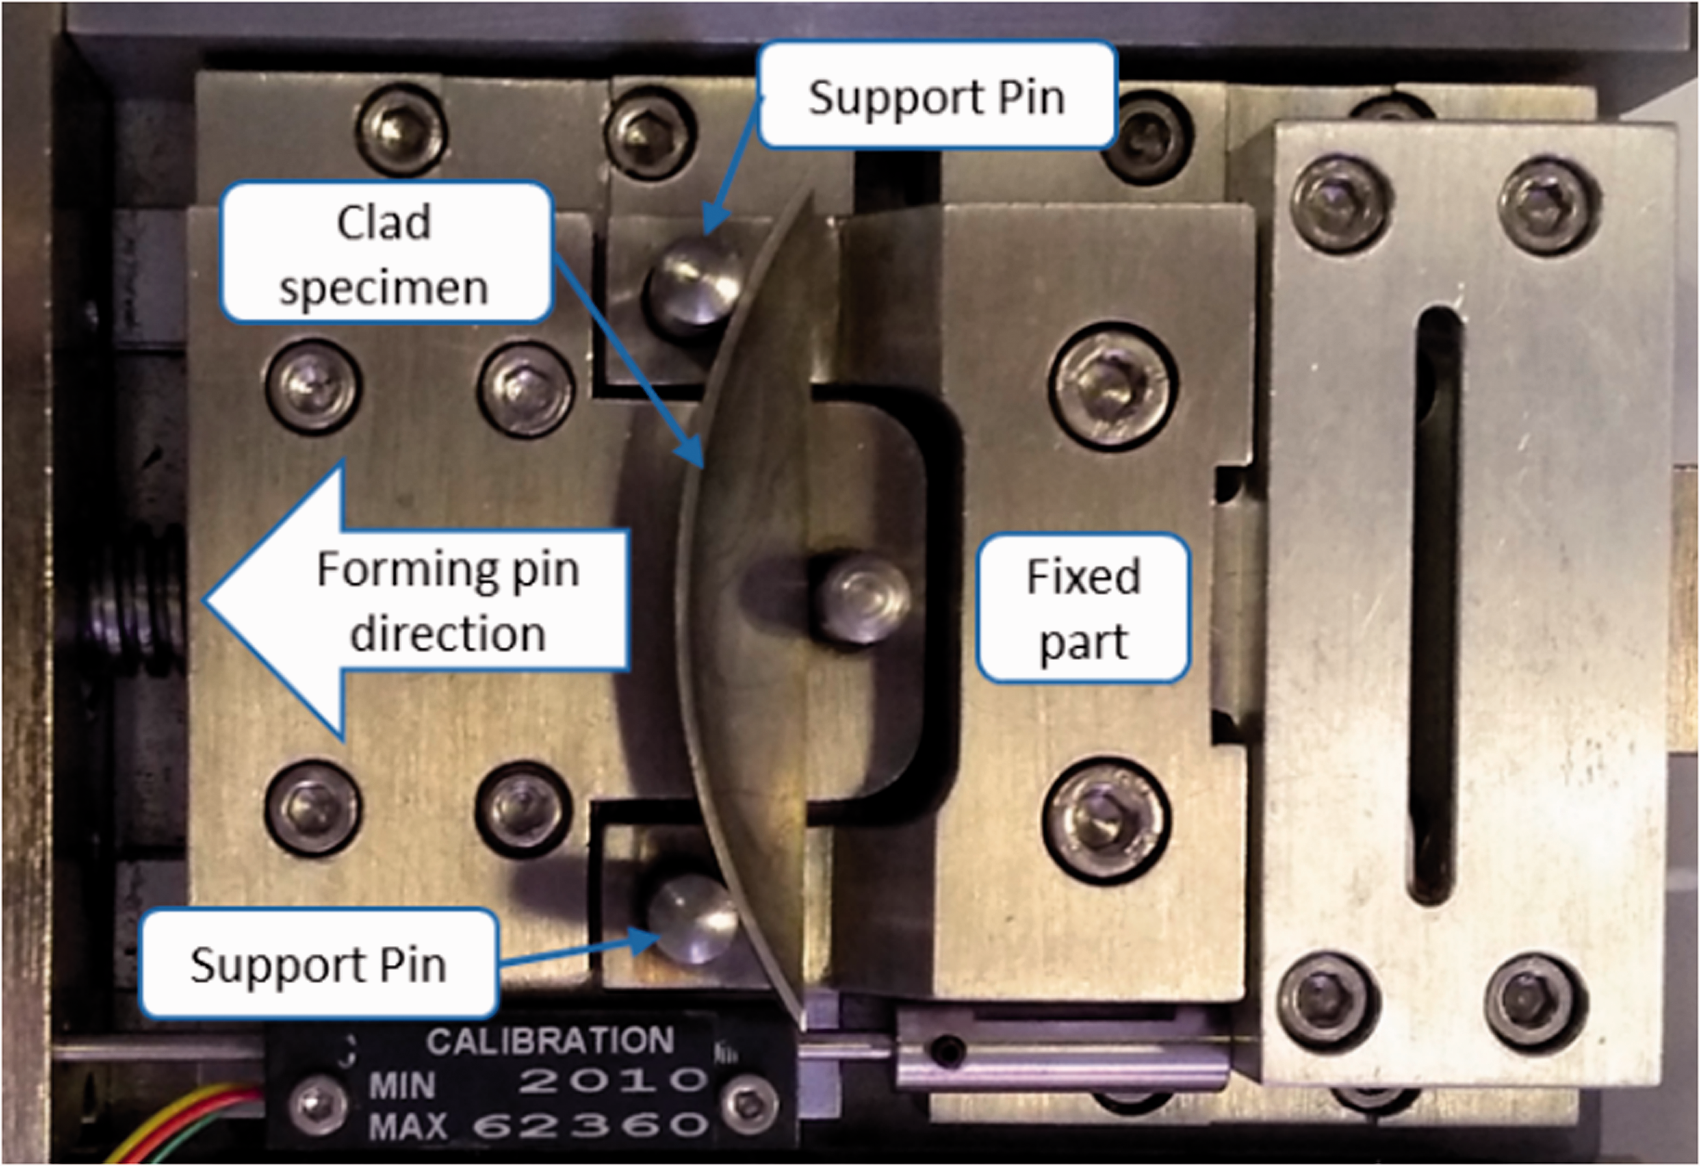
Test specimen loaded onto the SEM bending stage.
A UTM is typically used for flexural tests to obtain the modulus of elasticity in bending, flexural stress and strain. In this study the micro-crack bend test was used to intensify the stress in a selected volume of the test specimen in order to generate cracks and to identify the coating’s resistance to crack initiation and propagation. In addition, strain was measured for direct comparison between the two test specimens. The Tinius Olsen H25I S machine was used for the test, which is a bench mounted electro-mechanical machine capable of up to 25 kN loading force, either in tension or compression. A load cell is available for measuring the loading force. Figure 16 is an image of the testing equipment and corresponding schematic diagram of the three-pin arrangement. Repeat tests were performed to breaking point of the test specimen by displacement control at a displacement rate of 0.04 mm/s. Two collinear pins of 10 mm diameter were in contact with the curved face of the test specimens and at a distance of 43 mm between them. The forming pin was in contact with the flat face, aligned with the centreline of the test specimen, see Figure 16 (right).
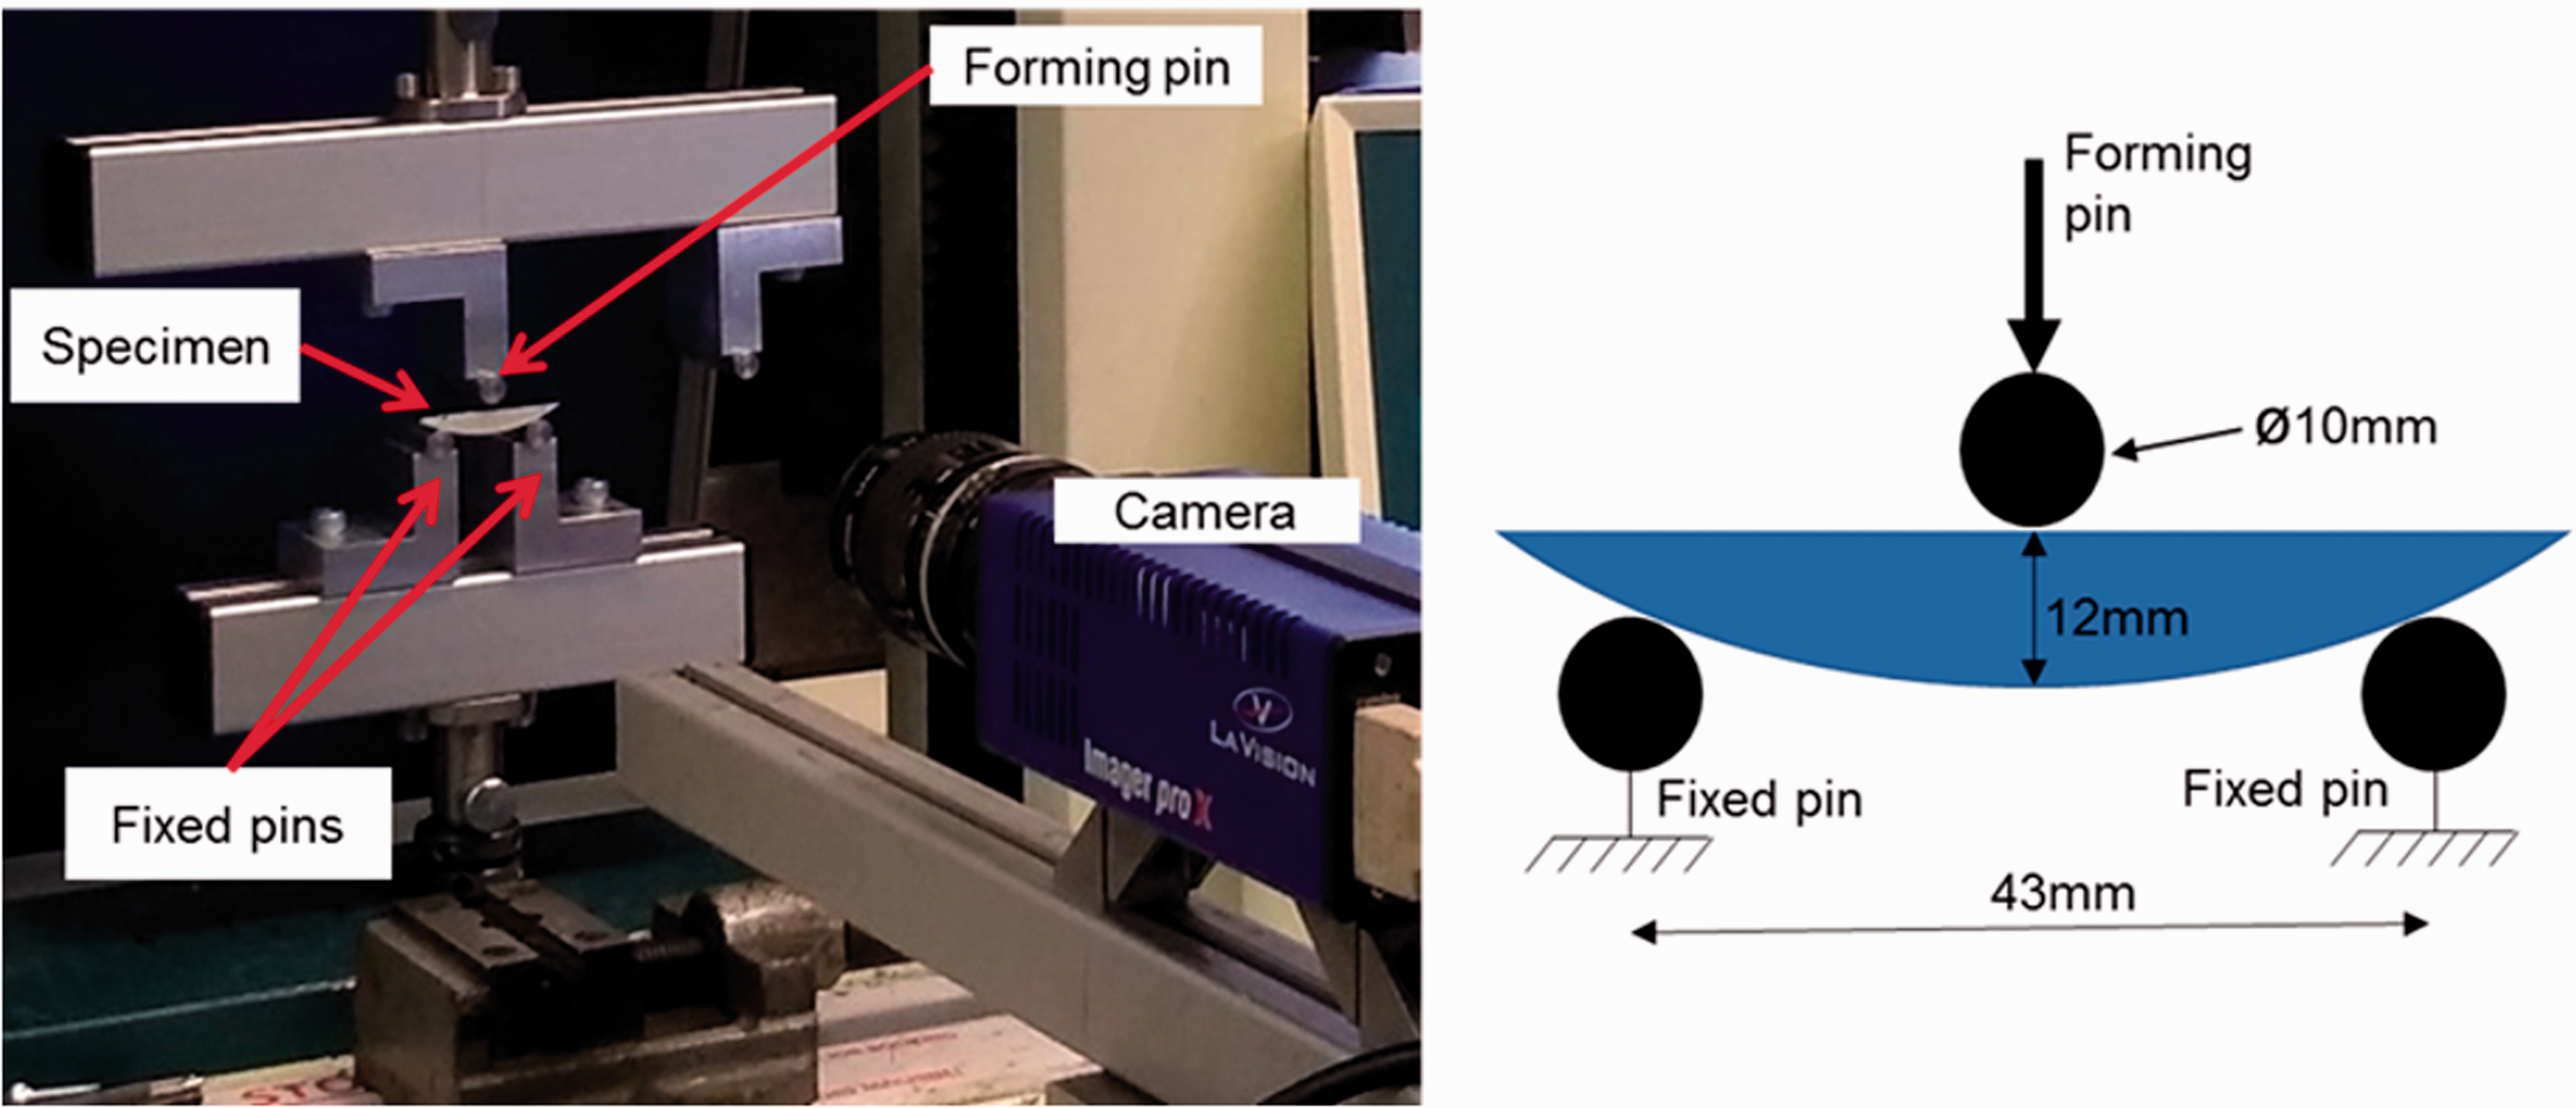
The Tinius Olsen H25IS UTM and LaVision camera used for the three-point bend test (left) and schematic diagram (right).
Results and discussion
Measurements obtained from UTM tests are presented in terms of loading versus displacement, while DIC images from the same tests were used for calculating surface shear strain. Crack formations before and after the tests were obtained from three-point bending tests in the SEM and are presented here for comparison.
Displacement and strain measurements
Cracks appeared on the curved face in all test specimens because this face experienced tension during the tests. Cracks that propagated to the substrate of clad test specimens appeared off centre of the bending axis and this might be attributed to an imbalance in the positioning of the test specimen (see example of clad test specimen Figure 17). Surface cracks near the stressed area opened up during the test and remained open after the test. The gap distance between the cracks is in the range of the distance measured before the test, suggesting that these are existing cracks that opened up. The bending force applied during the test was translating into elastic and plastic strain energy on the test specimen, resulting in crack formation or propagation of existing micro-cracks. In the clad test specimen, higher strain energy levels were concentrated in a wider region on the outer coating, influencing multiple cracks. In the chrome test specimens, it was influencing a narrower region, which may have contributed to the single larger crack propagating into the substrate, escalating the crack damage. A wider strain energy distribution in the clad test specimen over multiple cracks, may have been responsible for the reduction in crack propagation to the dilution zone with the intermediate layer.
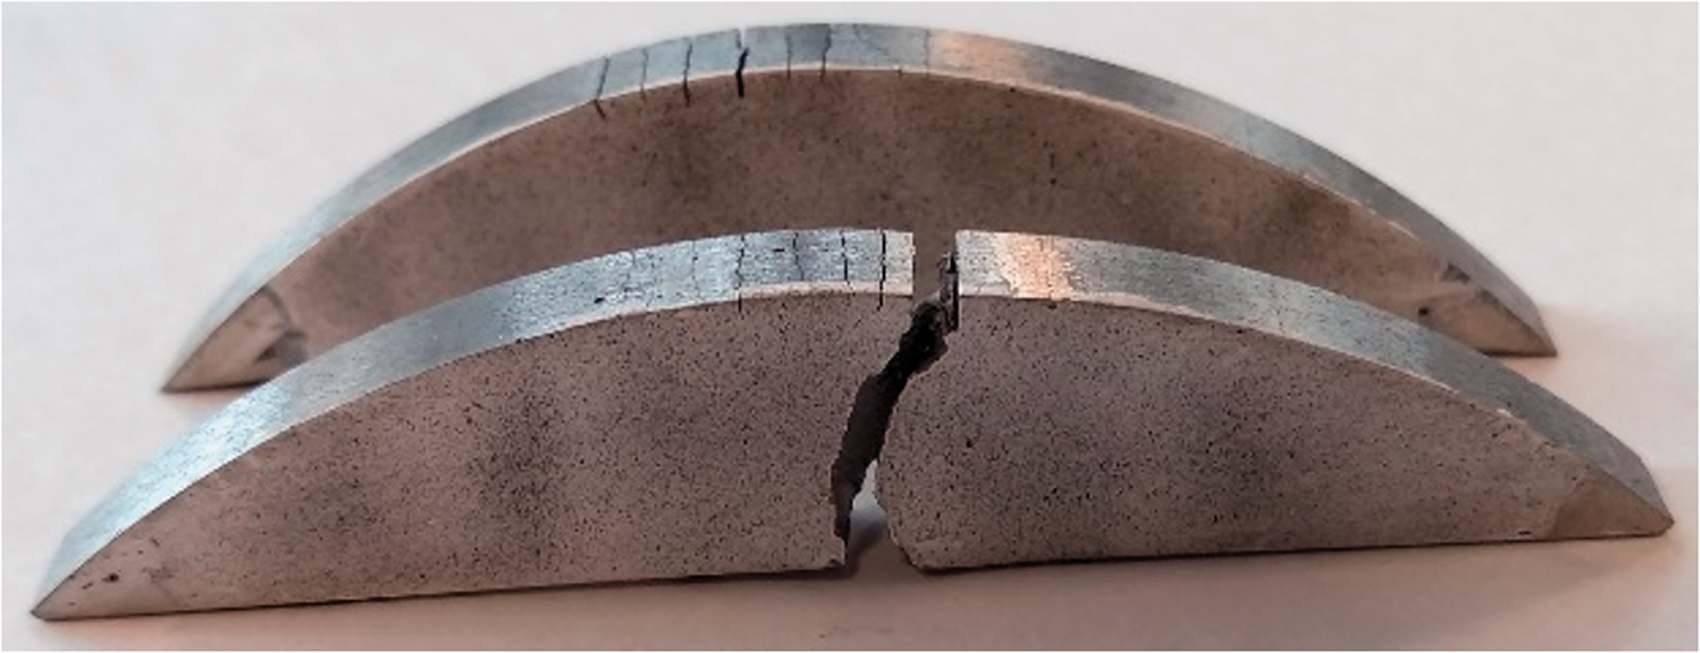
Multiple cracks through the clad layer and total fracture offset from the centre.
The Clad 2 test specimen in Figure 18 was driven to breaking point on purpose. Although multiple cracks may have been initiated, the stress was concentrated in one of the cracks, which has propagated through to the substrate. The weakest crack that propagated was off centre from the bending axis. Similarly, the chrome test specimens 1 and 2 had a single crack that propagated to the substrate off centre from the bending axis, but unlike the clad test specimens, no other significant cracks appeared in other areas of the surface.
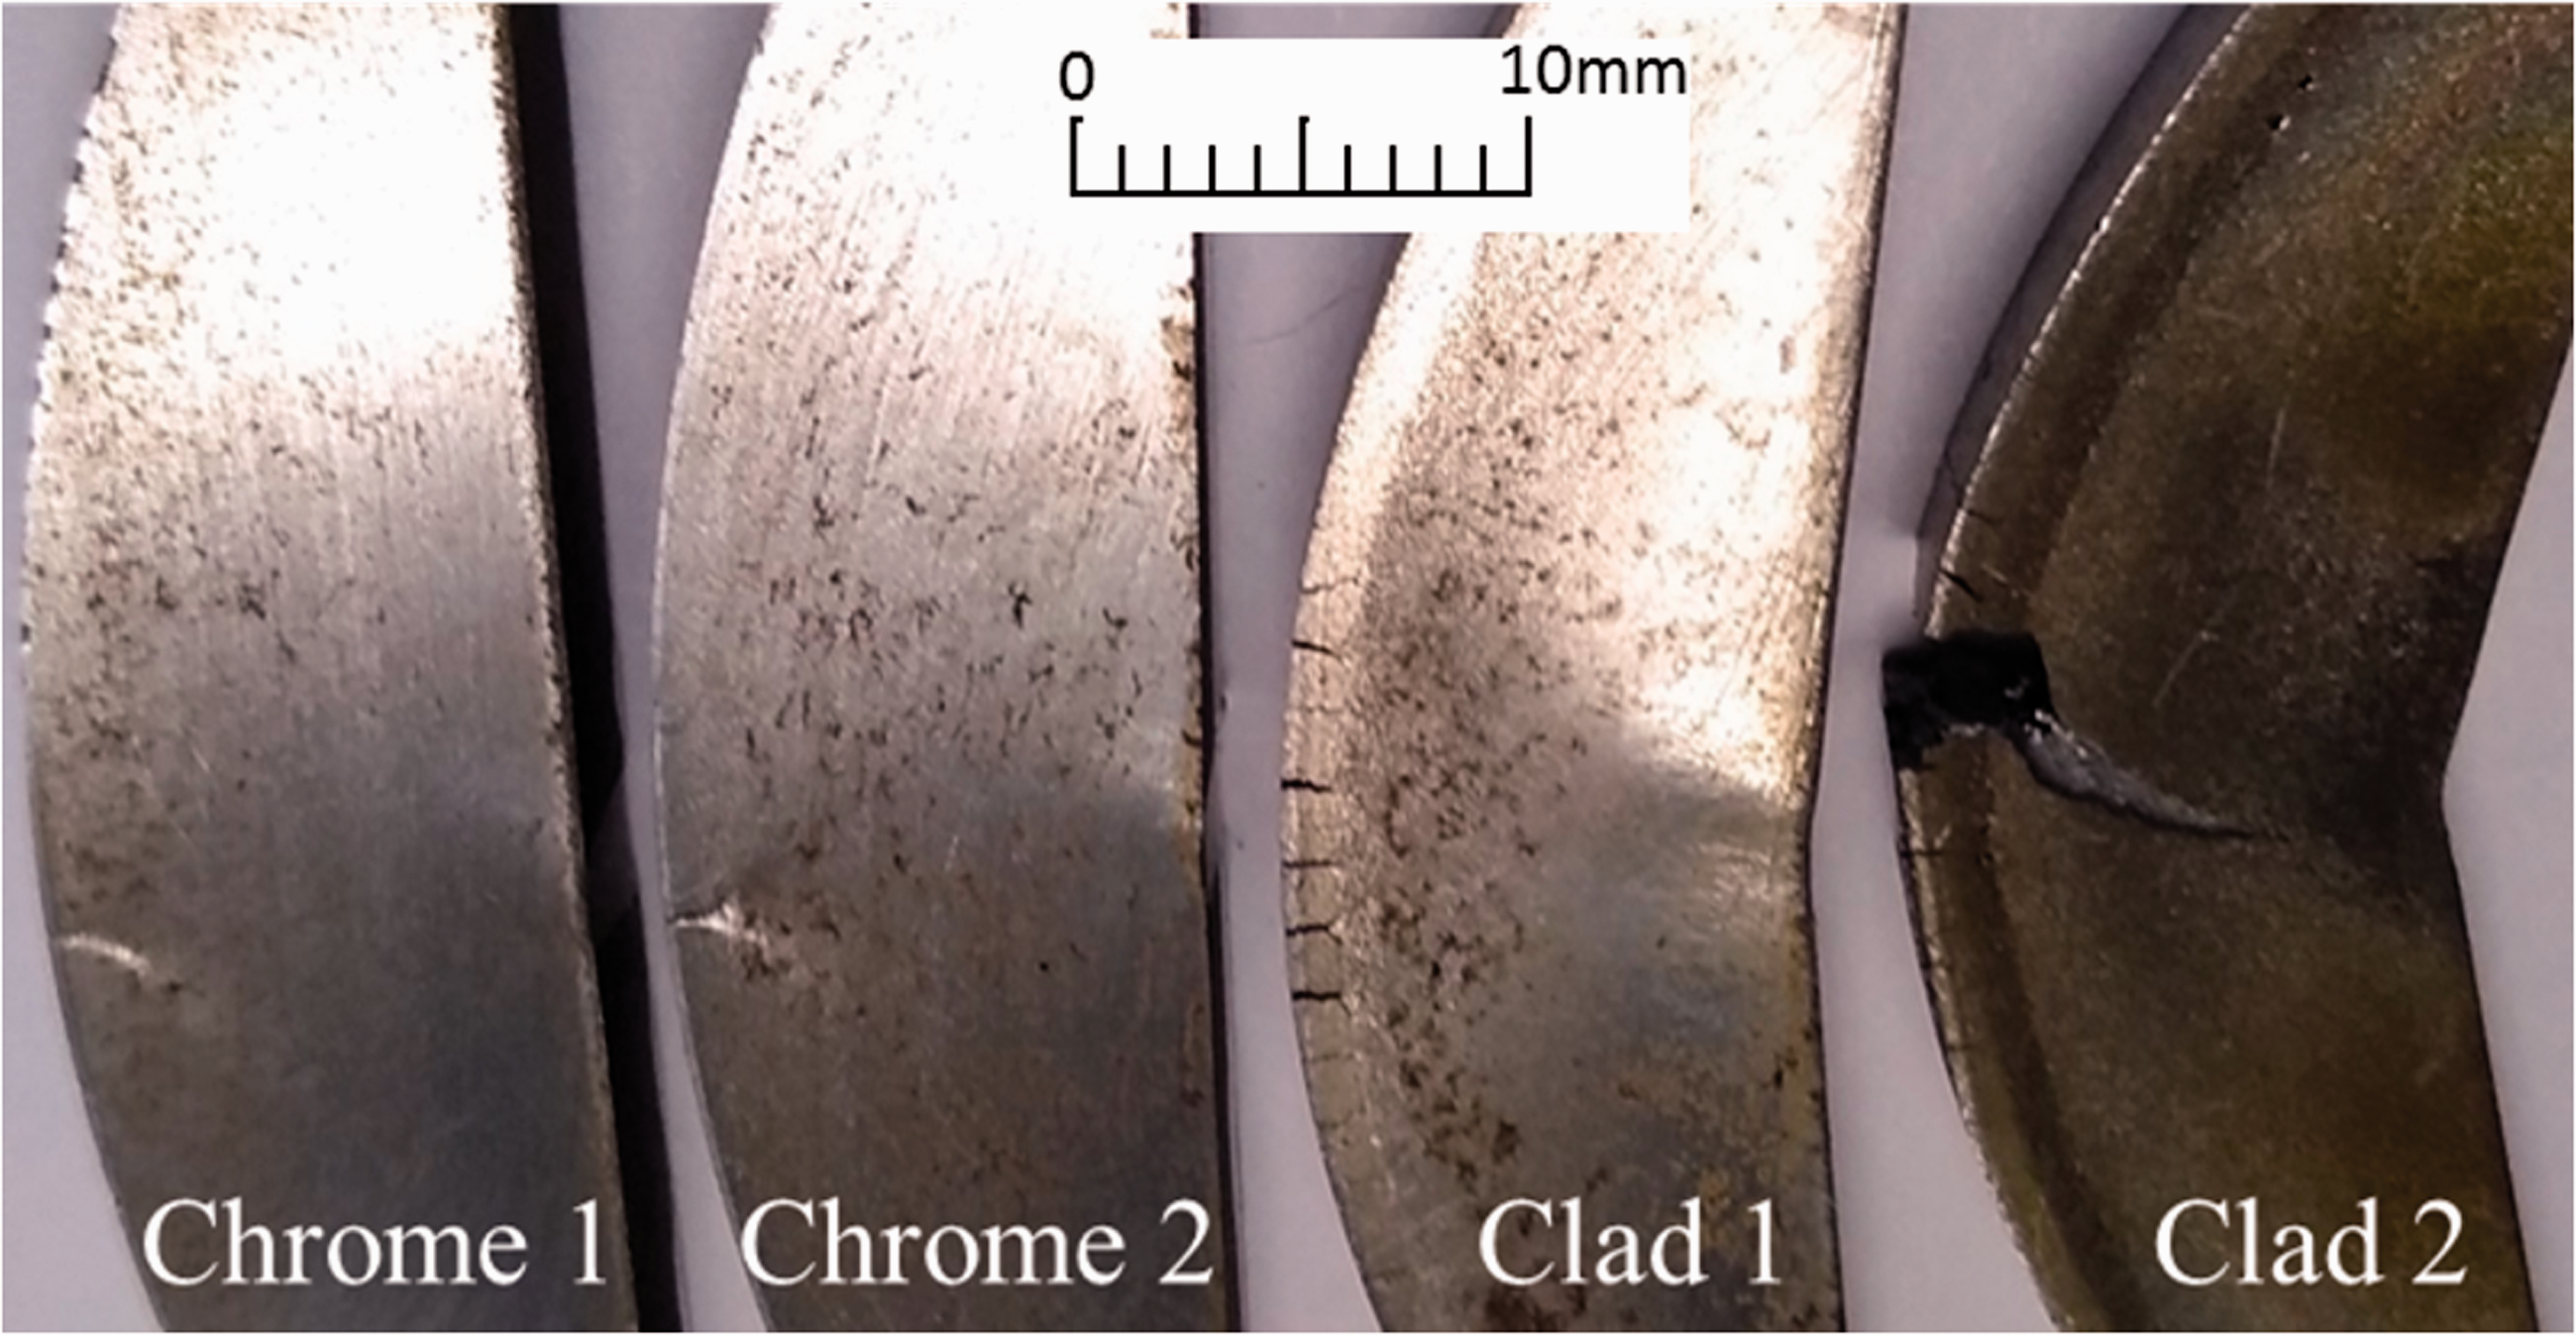
Test specimens from UTM 3-point bend test.
Results of loading force versus displacement in the UTM are shown in Figure 19. The chrome test specimens have a higher breaking force and a steeper inclination, indicating that they are stiffer than the clad test specimens. The smooth change of the Clad 1 and 2 curves around 15 kN load, indicated that the material has started yielding due to the multiple cracks that appeared. Clad 1 has not fully fractured, while Clad 2 has fully fractured at 18 kN.
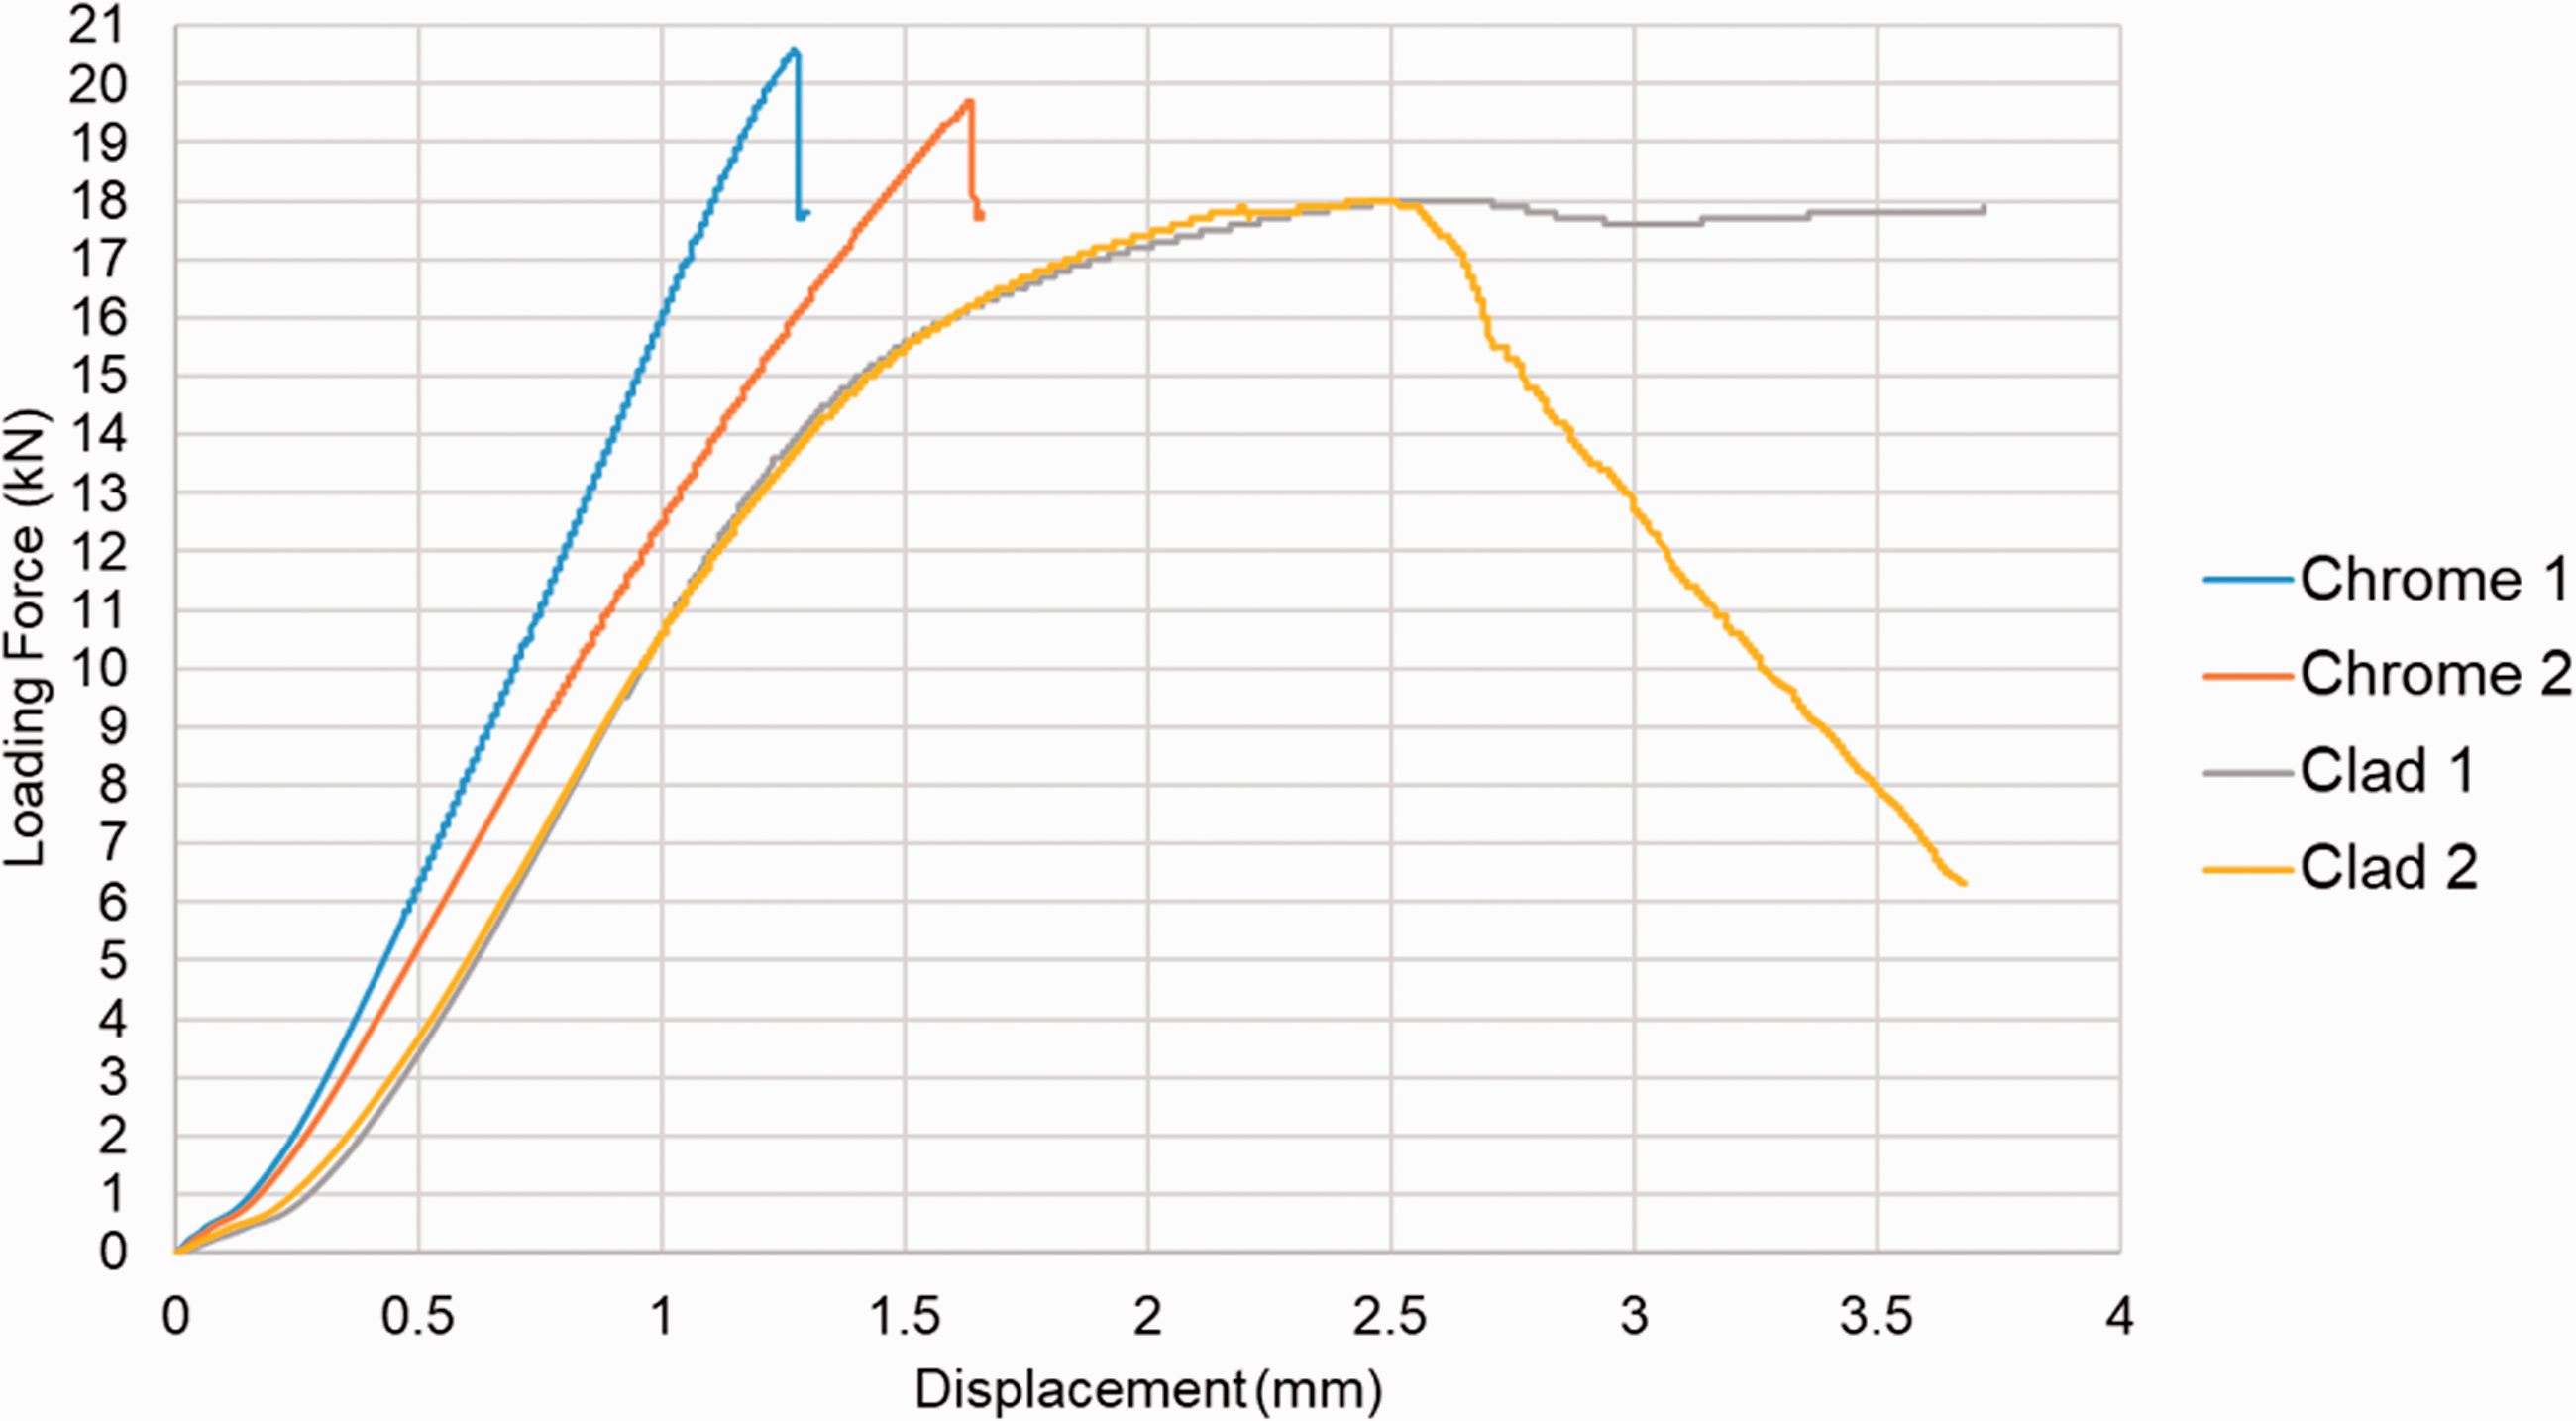
Loading Force vs Displacement for UTM testing.
Although initially the specimens were positioned “flat” on the UTM pins, during loading the contact stress, between the pins and the test specimens’ surfaces, was not uniform. The expected dent by the forming pin was not parallel, but conical, as shown in Figure 20(d). This was the case for all test specimens. This was due to the uneven contact stress, which was higher near the unpainted side of the test specimen, which was also bulging out the material as shown by red arrows in Figure 20(a). Uneven contact stress was also evident by the delamination of the chrome coating near the unpainted side and at positions that correlate to the fixed pin contact with the test specimen, examples shown in Figure 20(b) and Figure 20(c). The Ni-WC coating showed no evidence of delamination at contact with the fixed pins or elsewhere.
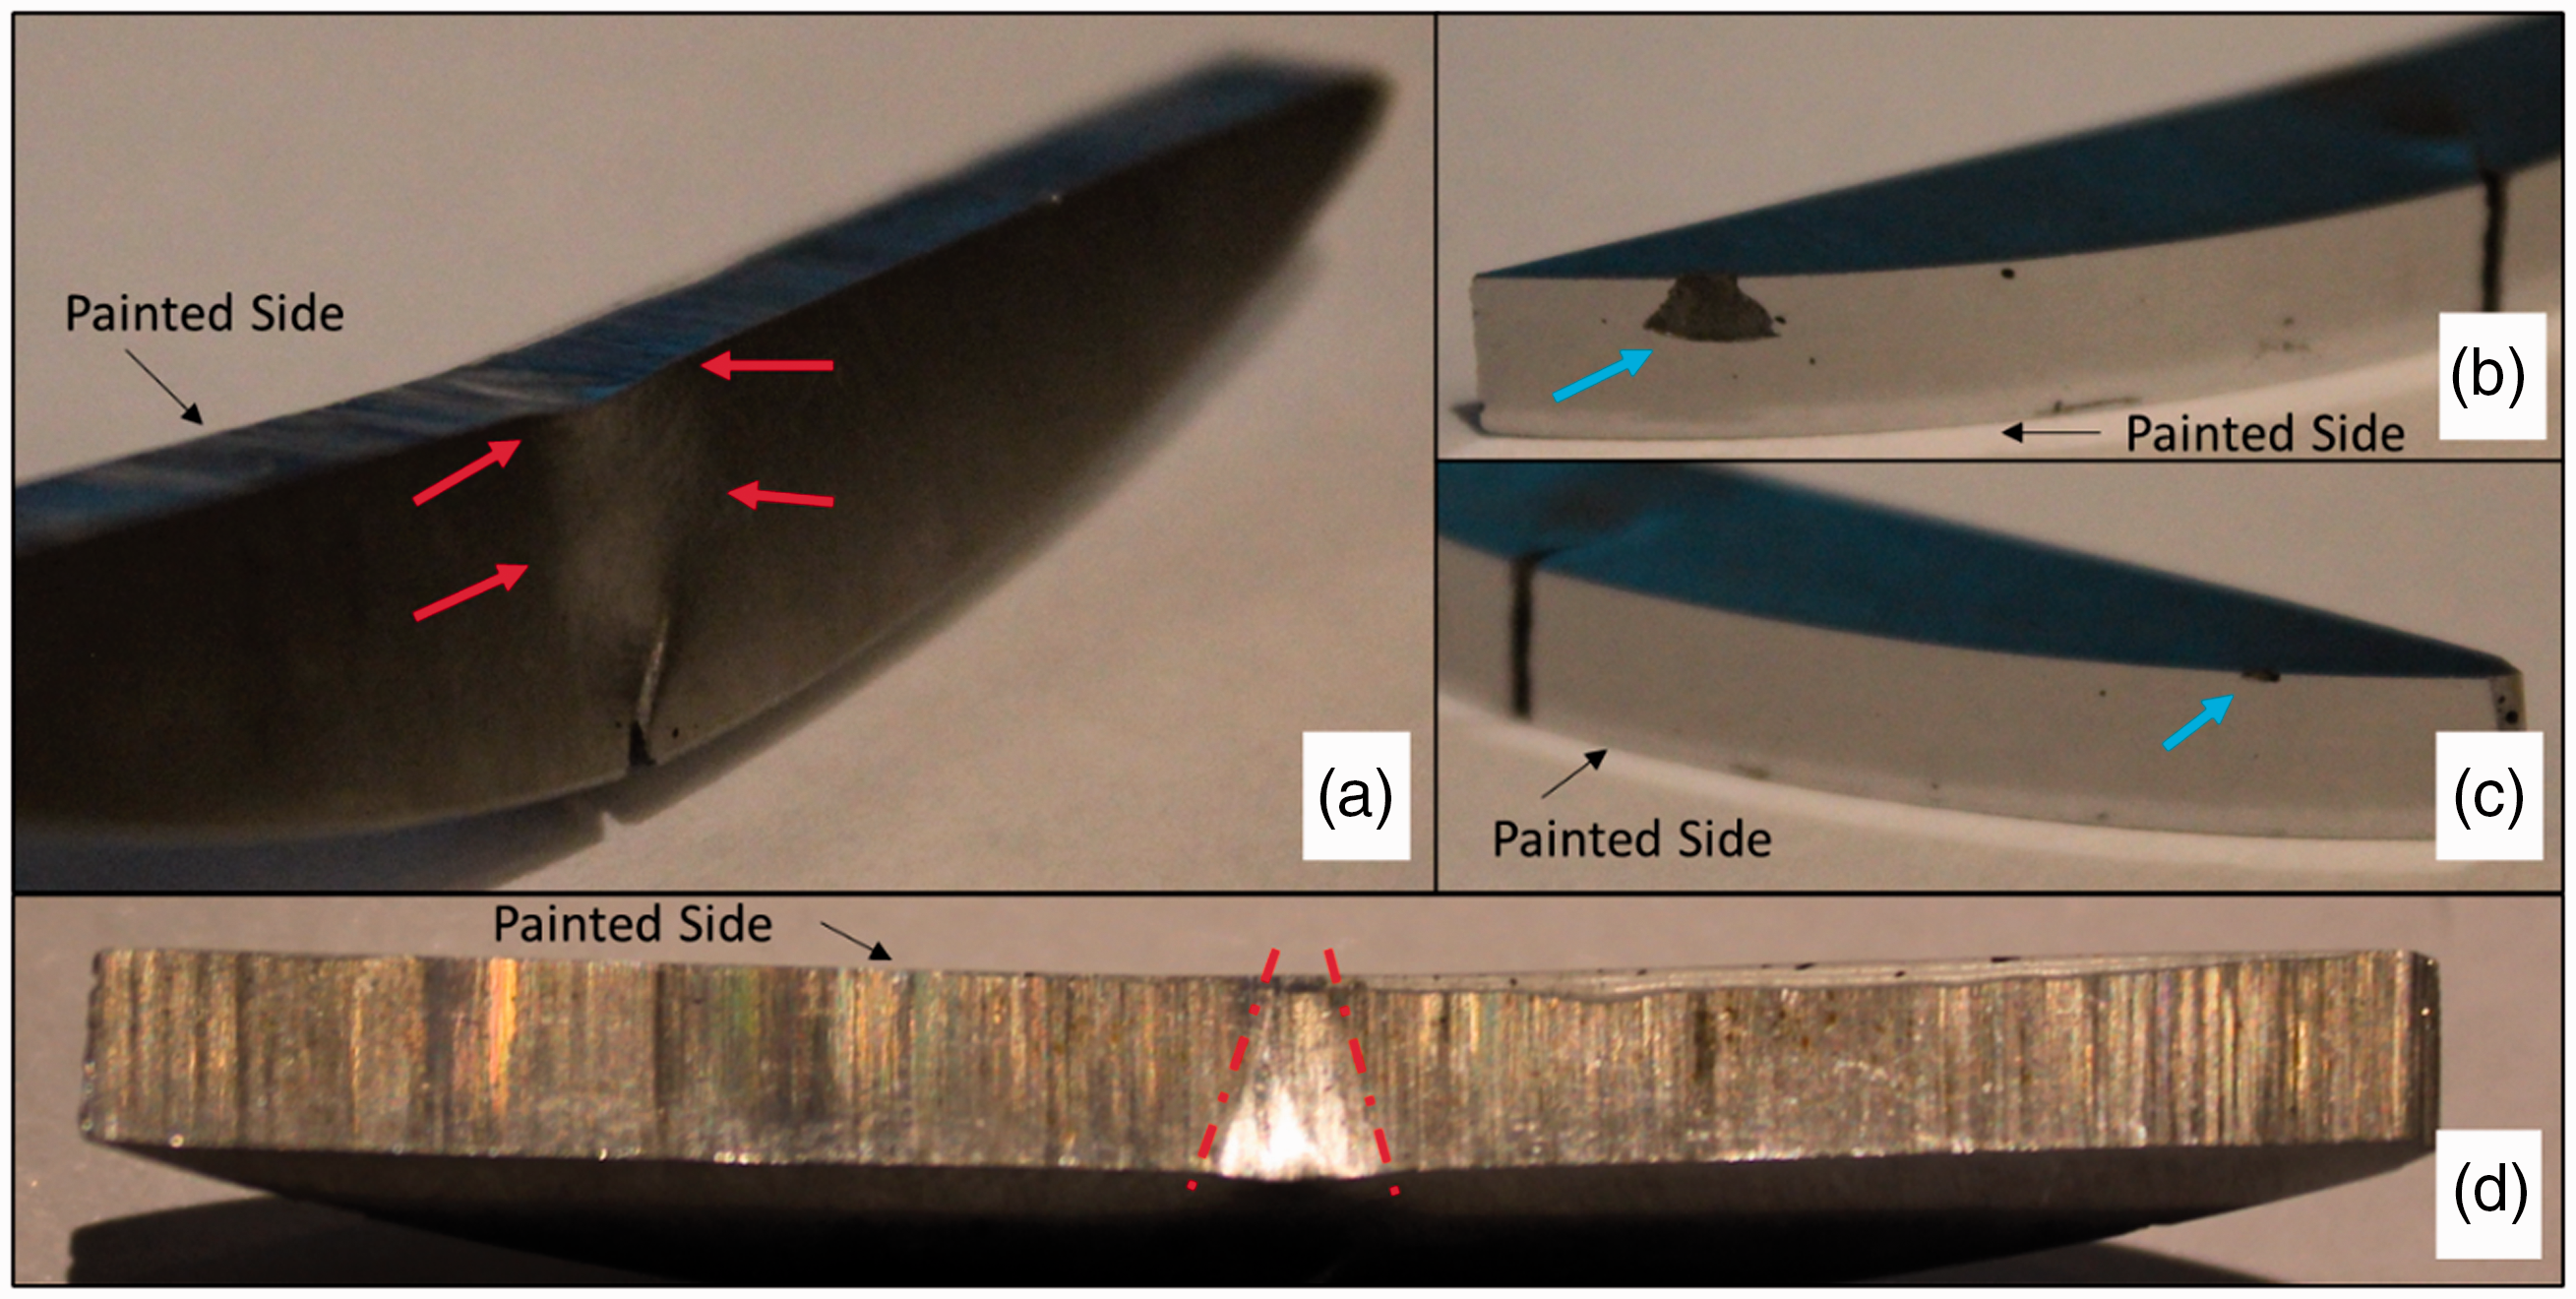
Chrome test specimen bulging out from contact with forming pin (a) chrome coating delamination at contact with fixed pins (b) and (c), uneven contact deformation from the forming pin (d).
UTM displacement measurements before yielding can be seen separately in Figure 21. The initial displacement over force is not linear, and the inclination varies until the equipment has settled. The clad test specimens exhibited the opposite behaviour in the UTM tests with lower stiffness than the chrome test specimens. The chrome test specimens exhibited a wider spread in stiffness than the clad test specimens, this was evident in the UTM and SEM tests, as the clad test specimens in both tests showed similar stiffness gradients. However, due to the small number of samples used in the tests, it is not sufficient to make conclusions on the behaviour of the chrome test specimens. Considering that the clad coating is significantly larger than the chrome coating and the test specimens have the same overall dimensions, less substrate material remains in the clad test specimens after cladding. Reduced stiffness in the clad test specimen may be attributed to the reduced volume of substrate material and with the addition of a softer intermediate. It seems that loss of stiffness and higher ductility from the multi-layered clad test specimens seem resulted in a reduction of the linear portion of the curve, as well as earlier yielding. The strain hardening period from yielding to breaking is extended, allowing for longer displacement prior to full damage.
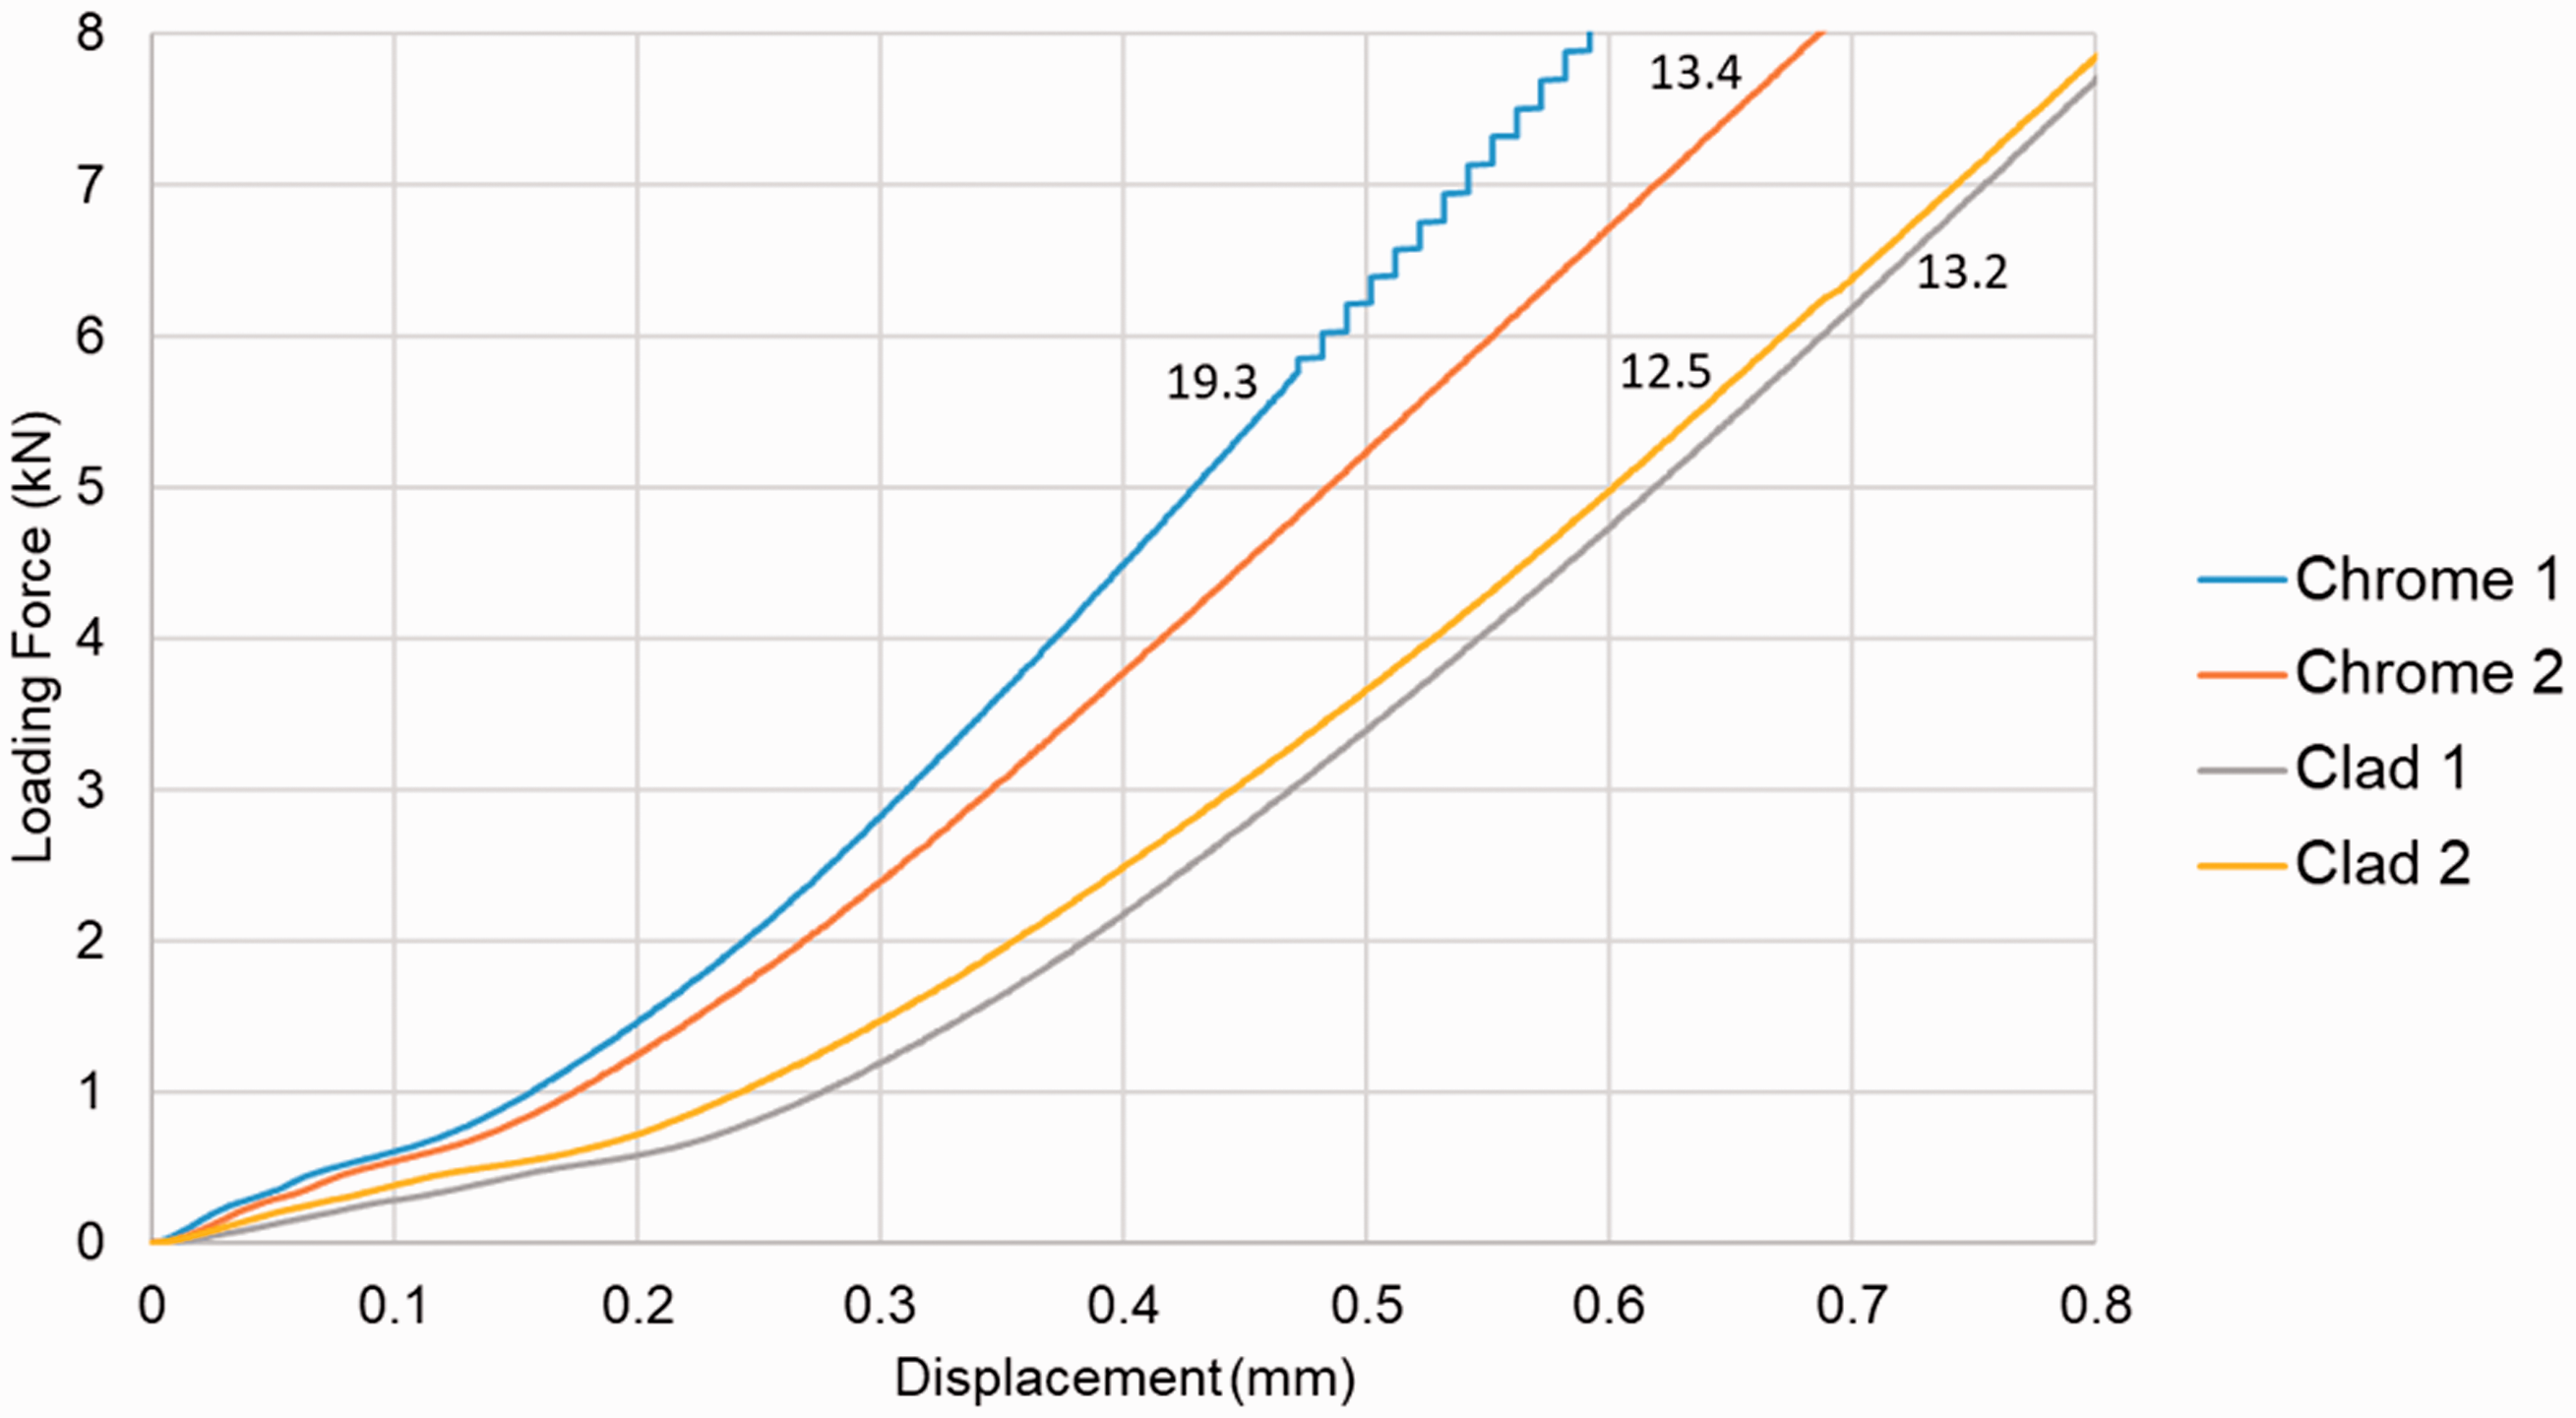
Loading Force vs Displacement early loading, slope gradient indicated on the graph for each test specimen.
The preliminary three-point bend test results from Camscan SEM are shown in Figure 22. The force/displacement curves from the SEM test are linear, except for Clad SEM 2 which exhibited significantly lower stiffness initially. The stiffness of Clad SEM 2 changed after 0.1 mm displacement to a slope similar to Clad SEM. This may be attributed to initial settlement of the specimen on the bending stage. Both Clad slope gradients are higher than the Chrome SEM test specimens’ gradients, indicating they are stiffer. Chrome SEM and Chrome SEM 3 cross each other, indicating a wider spread in the Chrome test specimen stiffness’. Also, Chrome SEM 3 showed a sudden load increase at very low displacement, this might be due to an error in data transfer or load cell reading. Similar measurement issues that produced occasional oscillations on Clad SEM and Chrome SEM test specimens were attributed to the data transfer or the control system of the bending stage. Due to the linearity of the overall measurements, it was decided to include the results in Figure 22.
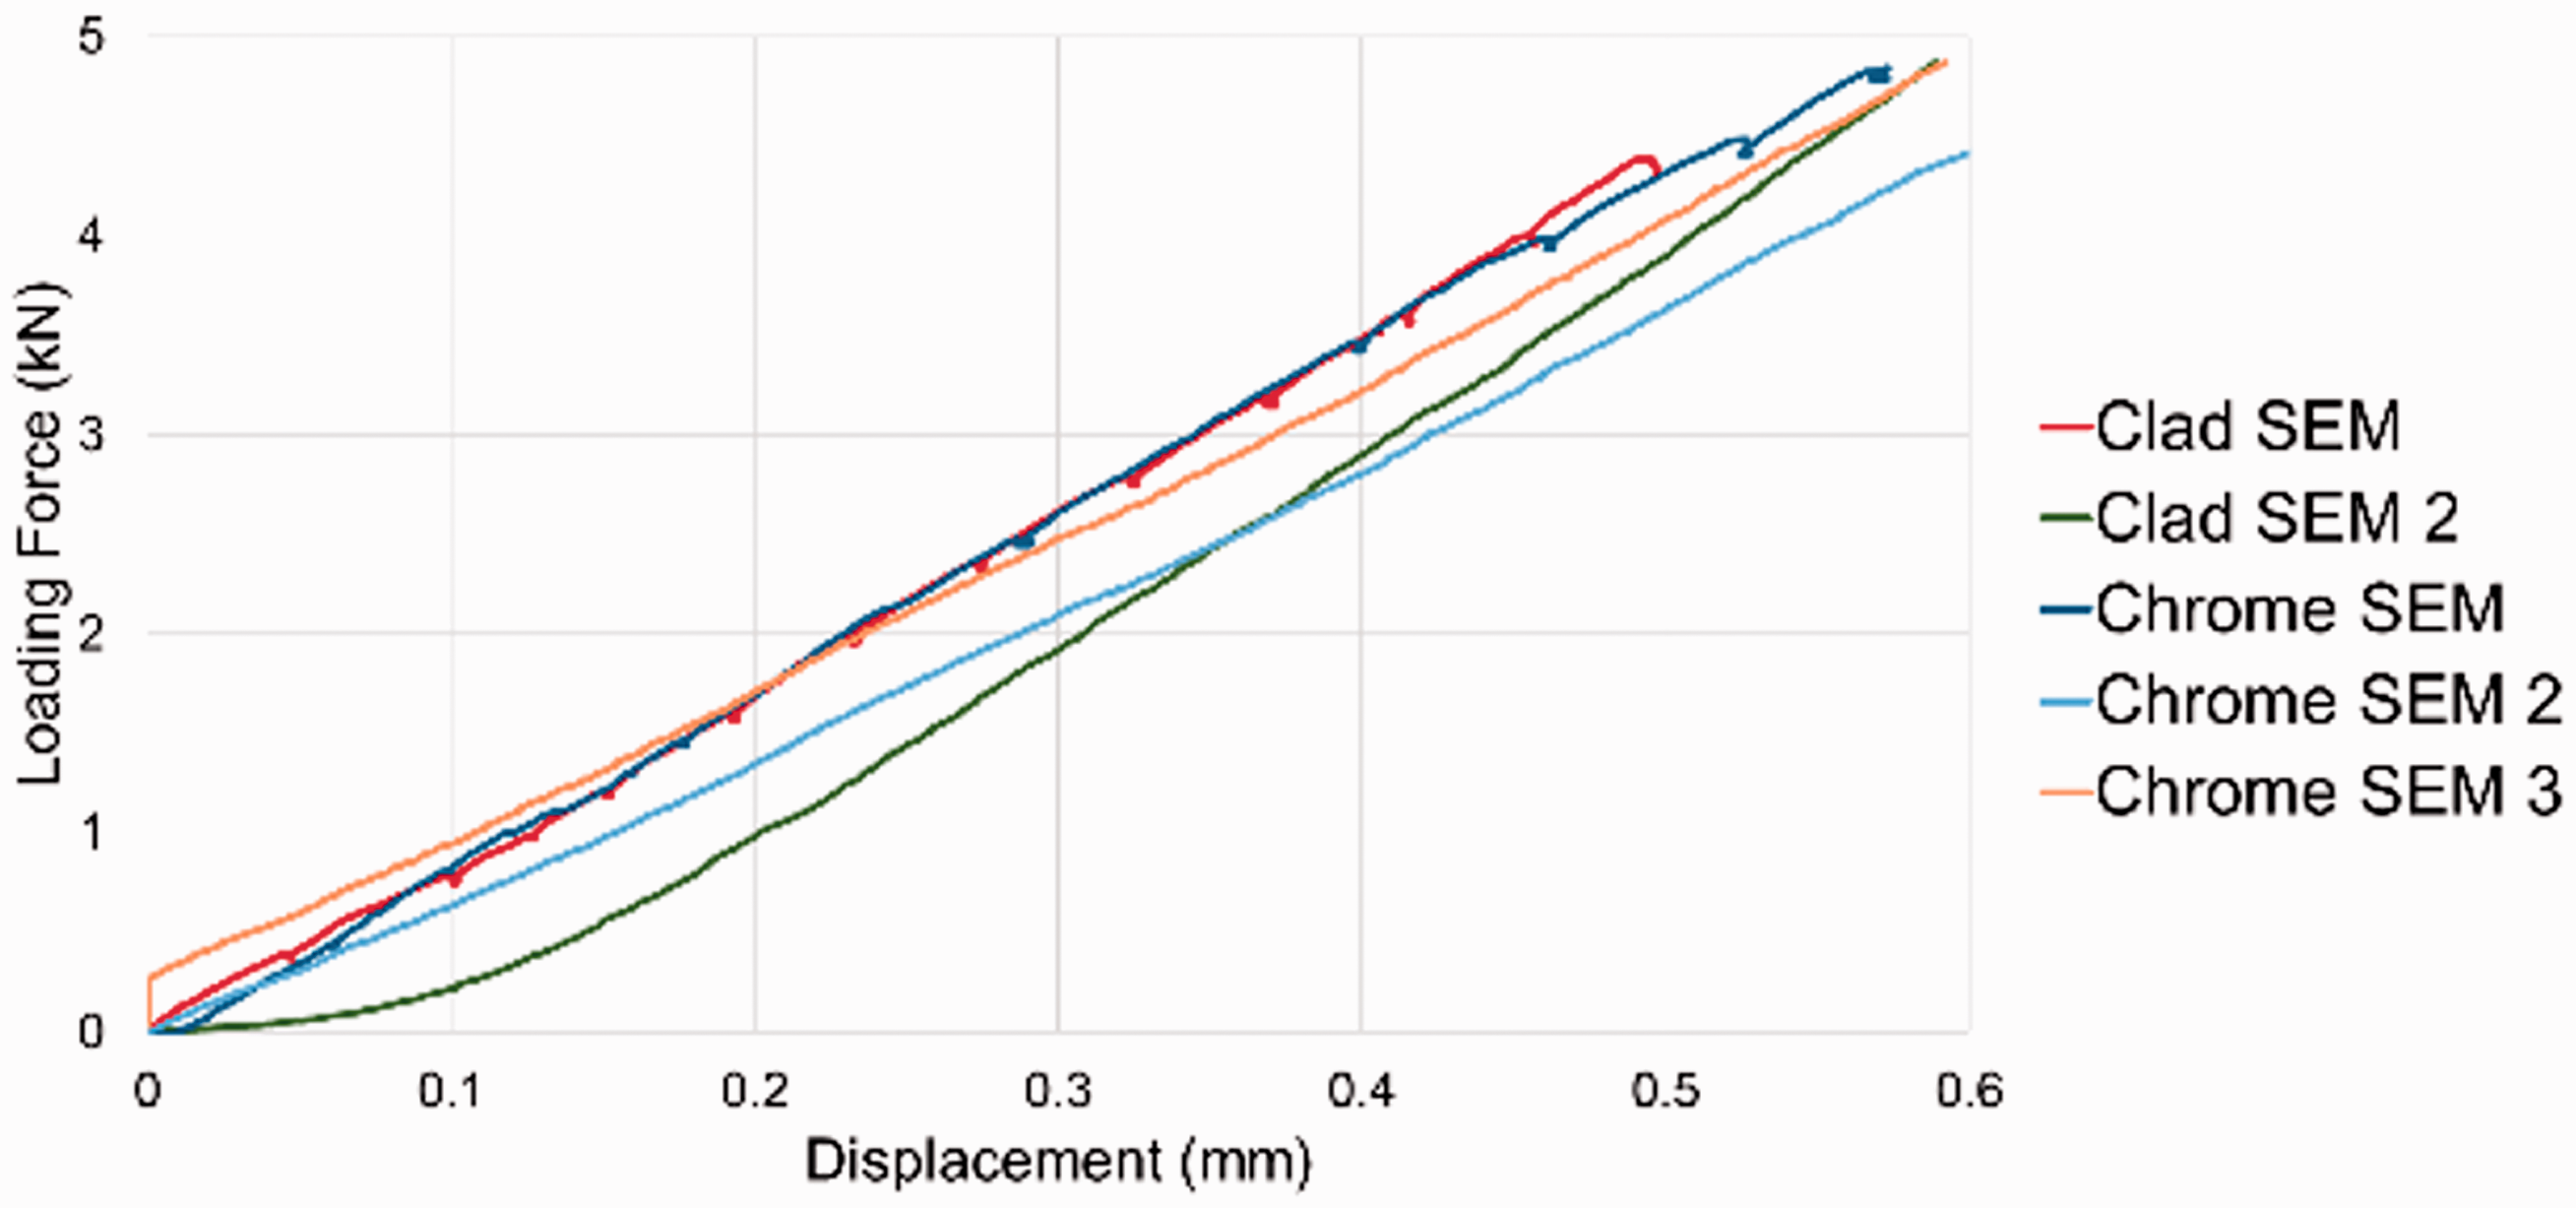
Loading Force vs Displacement for SEM tests.
Sequenced images from the UTM have been analysed using DIC software. 30 Obtaining SEM images for use in DIC, based on the etched microstructure, was challenging. This was especially challenging in the intermediate layer, where the microstructure pattern was not as dense as in the other regions. Therefore, only results from UTM test specimens with a speckle pattern of black paint are presented here. Results from the chrome test specimen in Figure 23(a) indicate significant shearing values after the crack has appeared in the coating. The software analysis picked up shearing bands from the edge of the crack at 45° towards the substrate and 90° to each other. In Figure 23(a) shearing strain values of 0.015 have been shown to precede the cracks. These bands indicate that the crack may follow either direction and this is evident by the first two images in Figure 18 where the crack propagates into the substrate and changes direction by 45°. Strain analysis in Figure 23(b) was calculated from images is obtained by loading the clad test specimen from rest up to around 13 kN. High strain appears as expected and concentrated around a few cracks that opened up during loading. Above these cracks, a narrow shear strain band appears which correlates with the location of the intermediate clad layer. Analysis of the strain to a higher load of 18 kN in Figure 23(c) shows an increase in strain as expected, with values in the region of 0.038. Maximum shear strain values at 18 kN force are higher in the clad test specimen in comparison to values at 20 kN force for the chrome test specimen. Strain near the edges of the boundary may not be realistic and high strain calculation is not valid where cracks appeared since the speckle pattern is replaced by the cracks. The DIC was restricted to a particular area in the test specimen in order to exclude unwanted features such as shadows, for example in the top right section of the test specimen. Strain shown near the loading pin is due to the test specimen “folding” around the loading pin. As observed in Figure 20, the test specimen was plastically deformed by the loading pin, it is recommended on future tests to use a larger diameter loading pin, to distribute the contact stress and eliminate deformation from the loading pin. An interesting observation here is that the maximum shear strain away from the cracks is still concentrated around the intermediated layer and around the individual cracks, distributing the strain energy in a wider area by acting as a pivoting mechanism. This allows for a delay in crack propagation to the substrate. A less ductile intermediate layer or the lack of it may have resulted in behaviour similar to the chrome test specimen in Figure 23(a), whereby the strain energy is concentrated to a small region and crack propagation takes place earlier with respect to applied displacement.
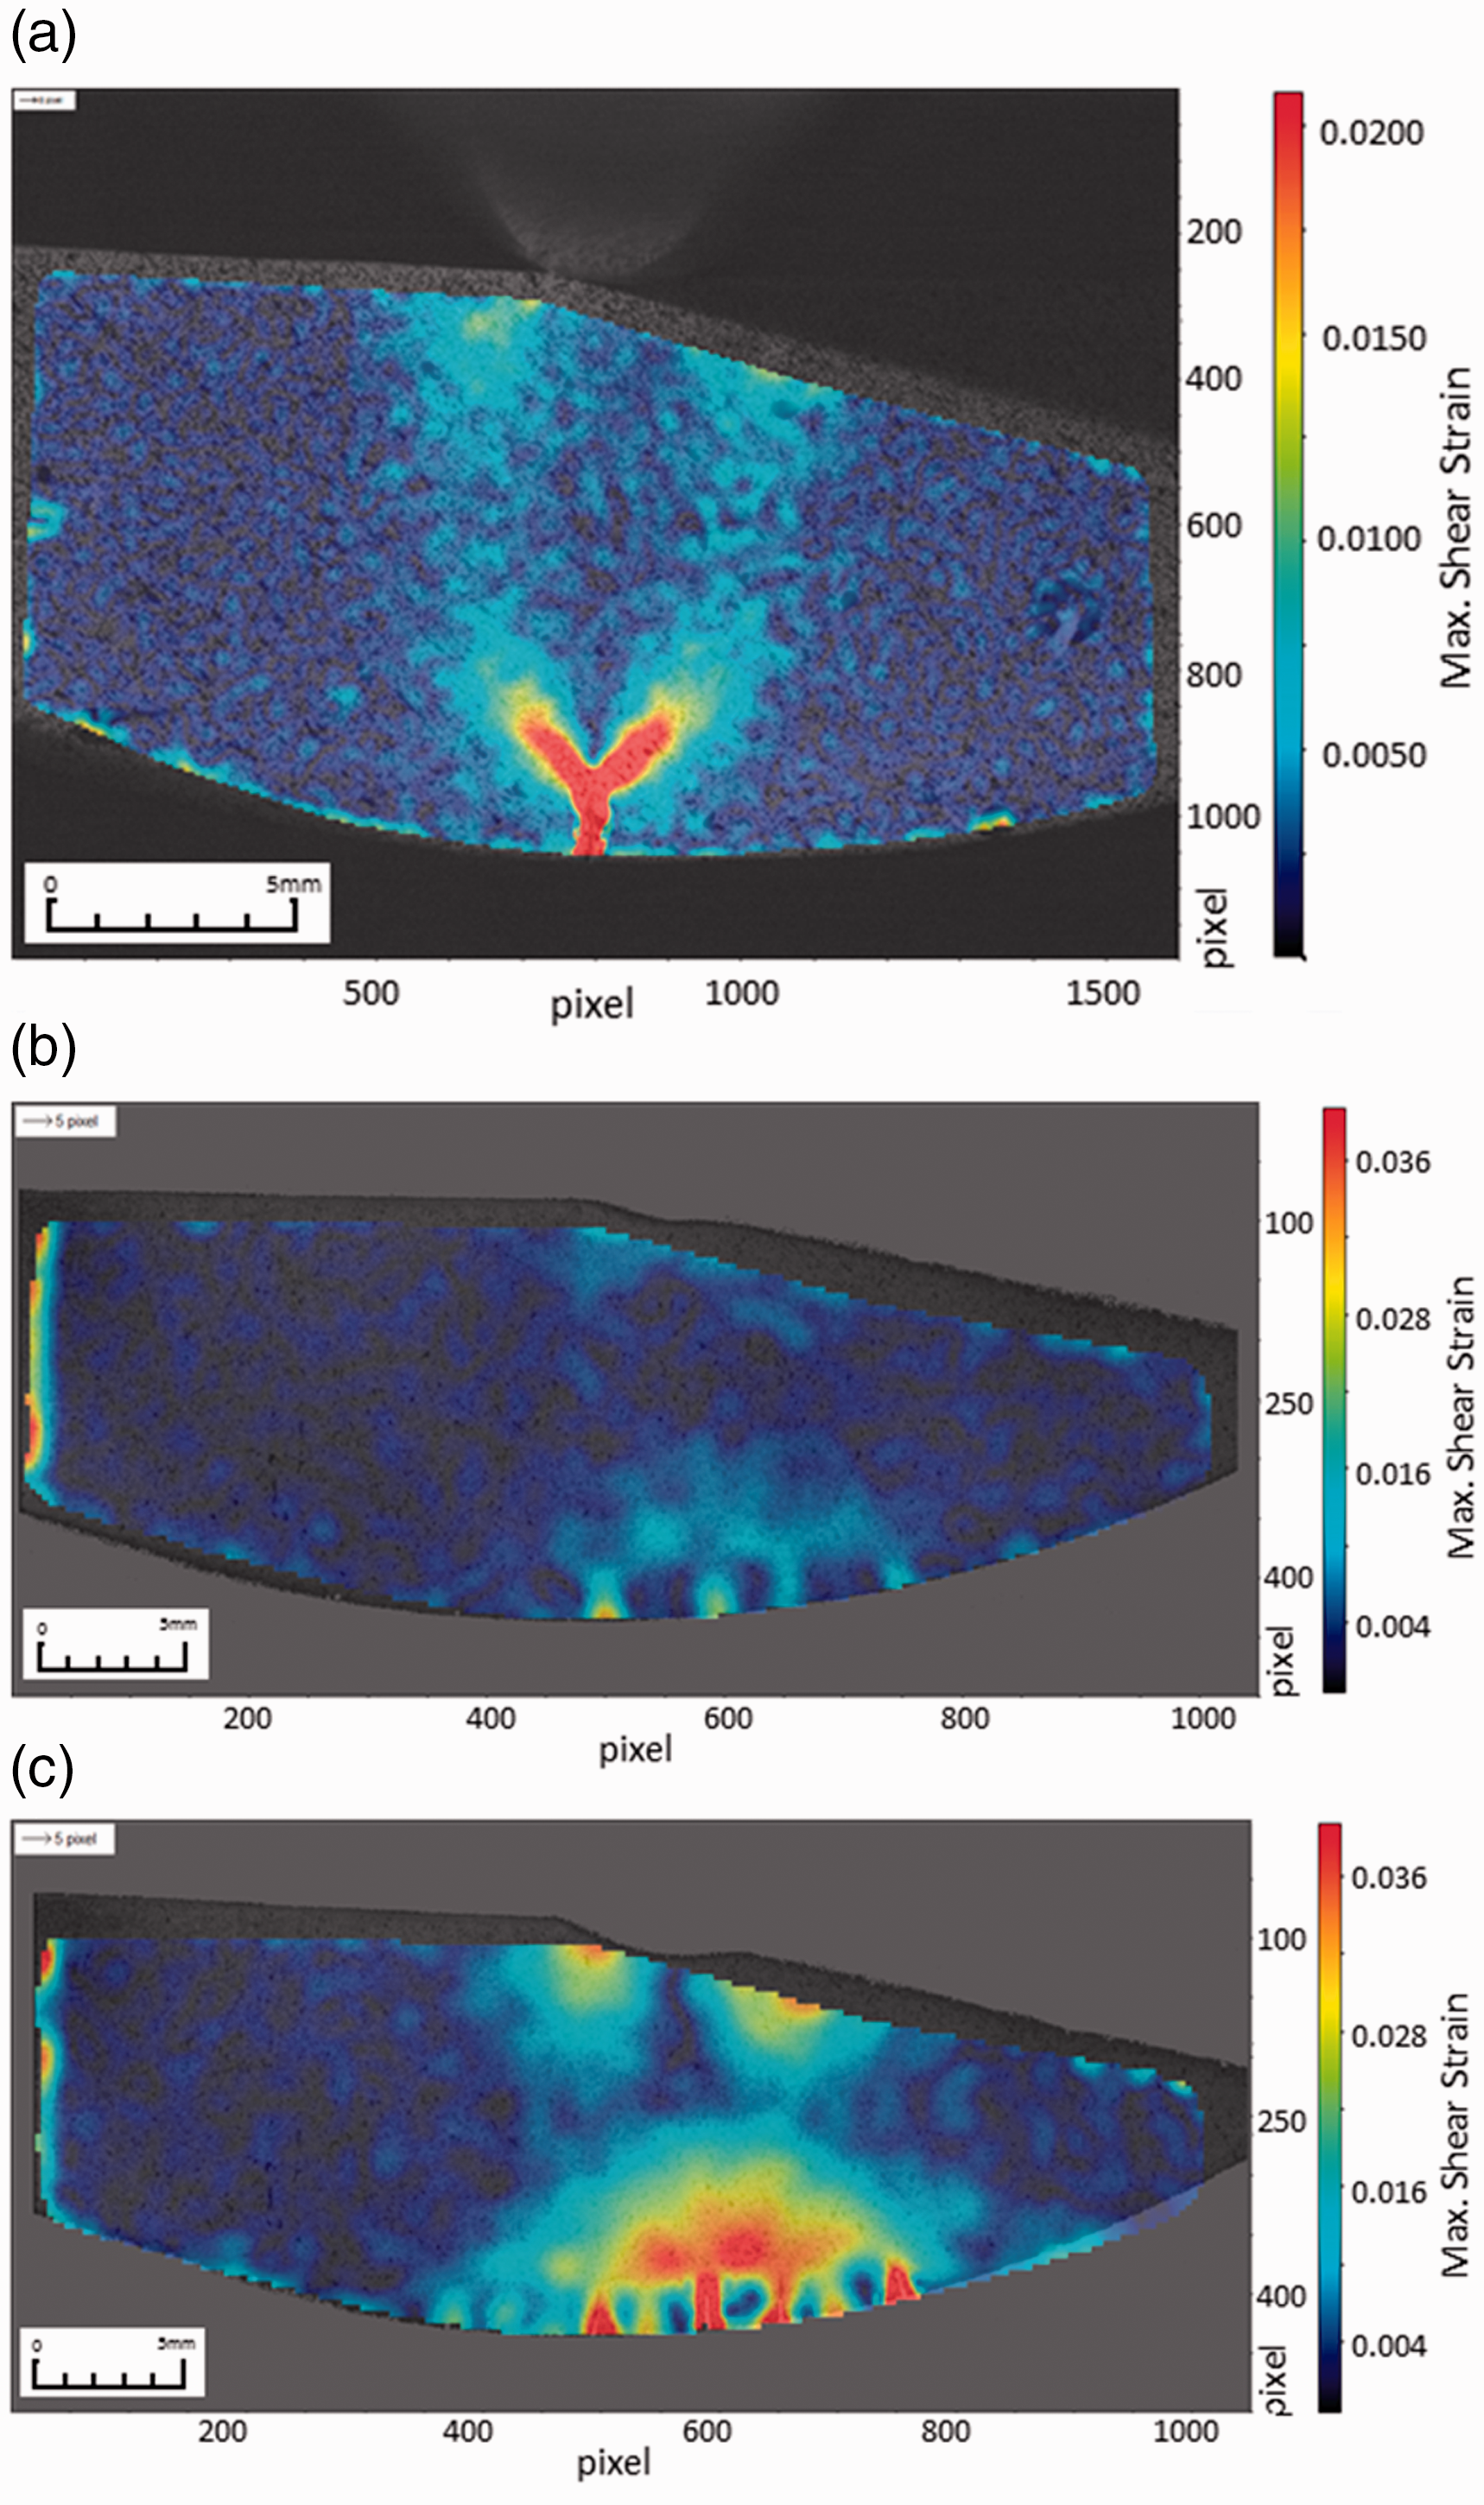
Maximum shear strain obtained from UTM Tests (a) chrome test specimen loaded up to 20 kN; (b) clad test specimen loaded up to 13 kN; (c) clad test specimen loaded up to 18 kN.
The three-point bend tests explained the mechanical behaviour of the proposed material combination, currently not found in the published literature. While the chrome plated test specimens exhibited higher stiffness and load than the two-layer test specimens the failure had very limited plasticity prior to failure due to the lack of ductility in the single layer of chrome plating. Whereas the composite structure used in the Ni-WC matrix promoted plasticity in the Inconel 625 prior to failure, this allowed for greater deformation. While the bending test is a useful means of promoting a failure in the coatings, in service the failure will occur as a material is drawn across the surface and a load is applied to deform it. If friction is applied the delamination observed in the chrome electroplated layer might result in spallation and the loss of this layer. Whereas the superior dilution between layers resists delamination and so the coating may have an extended lifetime.
Crack analysis
Both Ni-WC matrix and chrome electroplating coatings had minor cracks within them. The cracks appeared after cutting the test specimens with the EDM, which was assumed to have released residual stresses that were formed from the coating processes. During bending these cracks propagated in both coatings, but the Ni-WC coating cracks did not propagate into the Inconel 625. While the cracks did not propagate into the Inconel, they continued to grow in the Ni-WC matrix. During the test, the strain energy resulted in several cracks, distributing the localised strain in the Inconel. The two-layer coating bend tests had a greater displacement and undergo significantly more plasticity. In the chrome coating, the bending stress was concentrated into a small region due to the lack of ductility and the failure resulted in one major crack that propagated into the substrate.
Micro-cracks were present in both the clad and chrome test specimens. In both coatings, cracks appeared in multiple locations, more dominant in either side of the bending axis plane, which the plane formed by the bending axis and load path vector (green line in Figure 24(a)). Cracks in the Ni-WC matrix coating have an origin from flaws in the microstructure and grow in multiple direction. This is evident in Figure 24(b). Due to the bending forces, the cracks were encouraged to grow towards the substrate and it is clear that no cracks have propagated into the intermediate layer. Figure 25 is a good example showing the root of a crack in the Ni-WC coating leading to a WC particle, which branched out into multiple cracks out of the WC particle. The bottom right image of Figure 25(a) shows how a single crack trajectory has been influenced by WC particles and how the end of the crack has branched out into multiple cracks that have been directed towards the Inconel 625 layer and stop at the dilution zone. Figure 25(b) highlights the mechanism that characterises this behaviour. When the test specimen is loaded, the crack opens up by pivoting around the softer intermediate layer and because the intermediate layer is more ductile, it stretches to accommodate the bending forces and prevents the crack from propagating, as opposed to behaving in a brittle manner.
(a) Bending axis plane (green line) and cracks at either end (red arrows) for SEM clad test specimen; (b) Possible microstructure flaw or porosity that may have contributed to cracking.
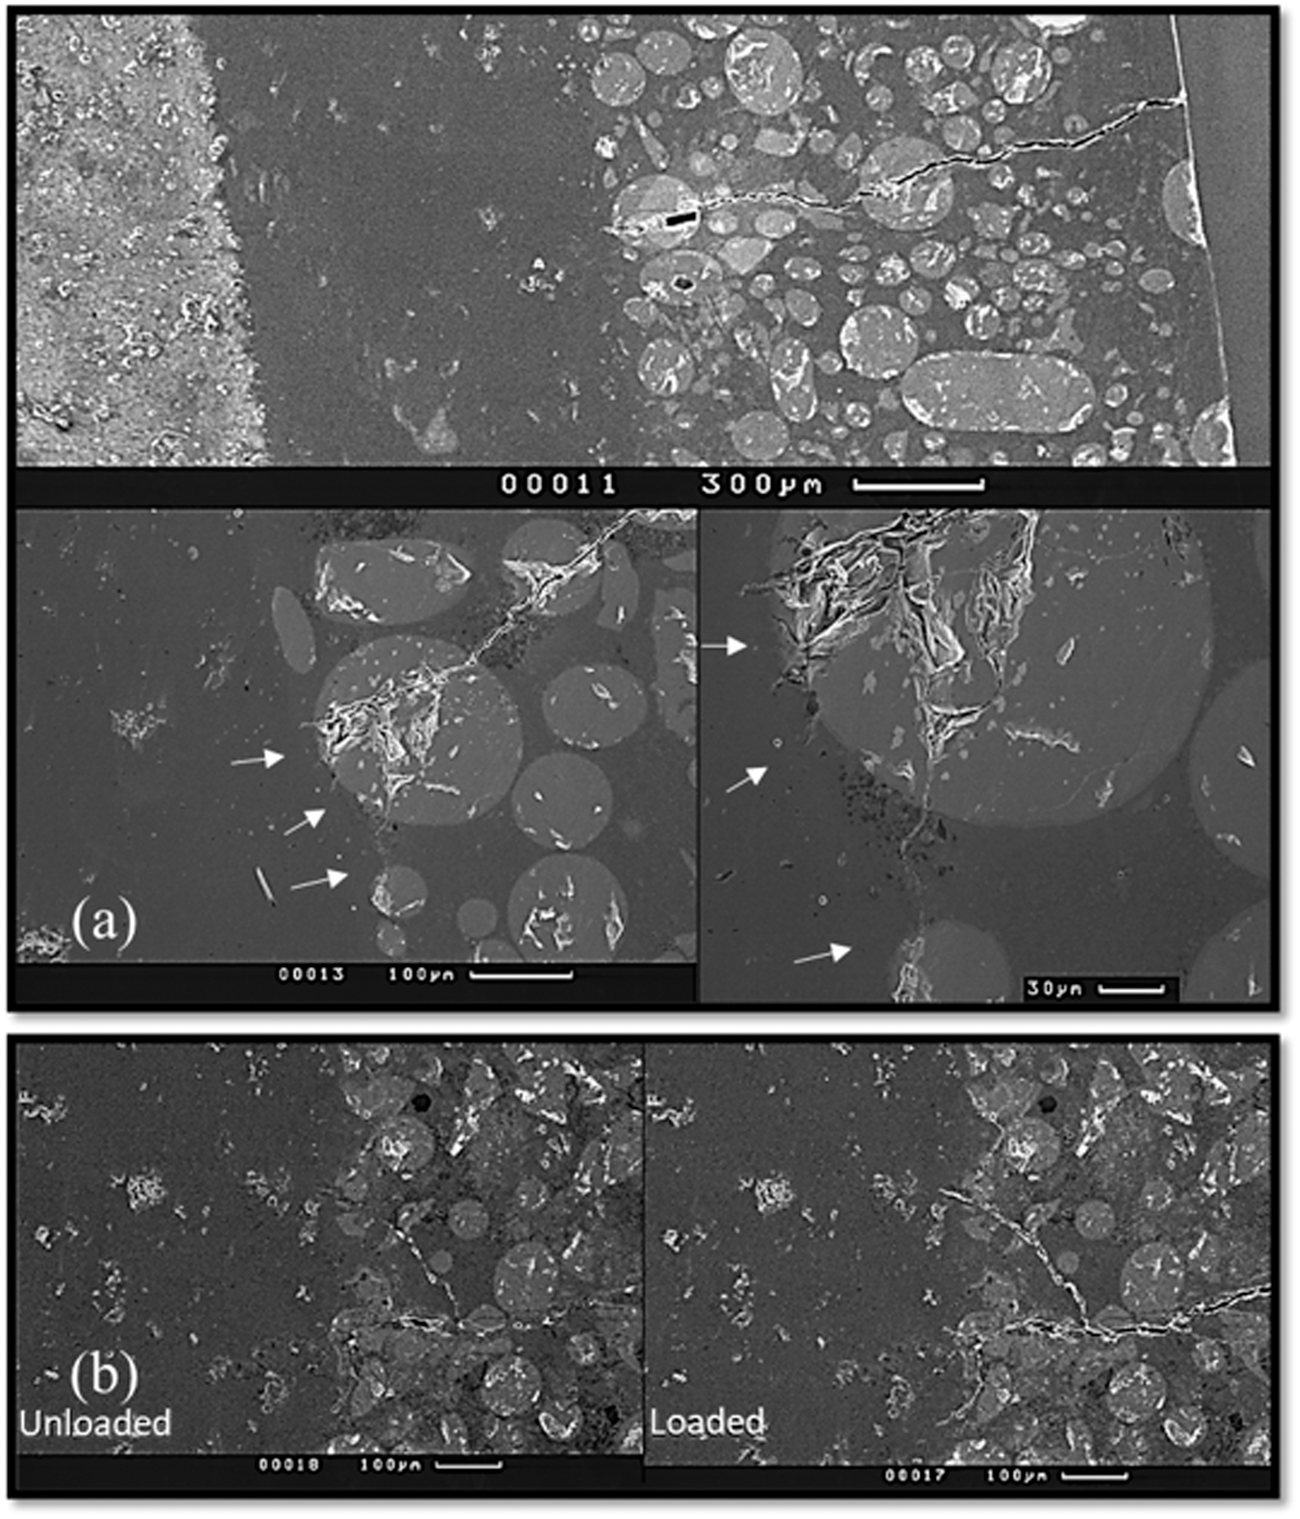
(a) Magnification on the crack end, indicating how cracks stop at the softer intermediate layer (white arrows); (b) Crack image with and without bending load.
The opposite occurred in the chrome layer, where cracks exist through the thickness of the coating and the bending load has either extended the cracks through the full thickness of the coating (Figure 26(a)) or generating smaller cracks which branched out to join other existing cracks (Figure 26(b)).
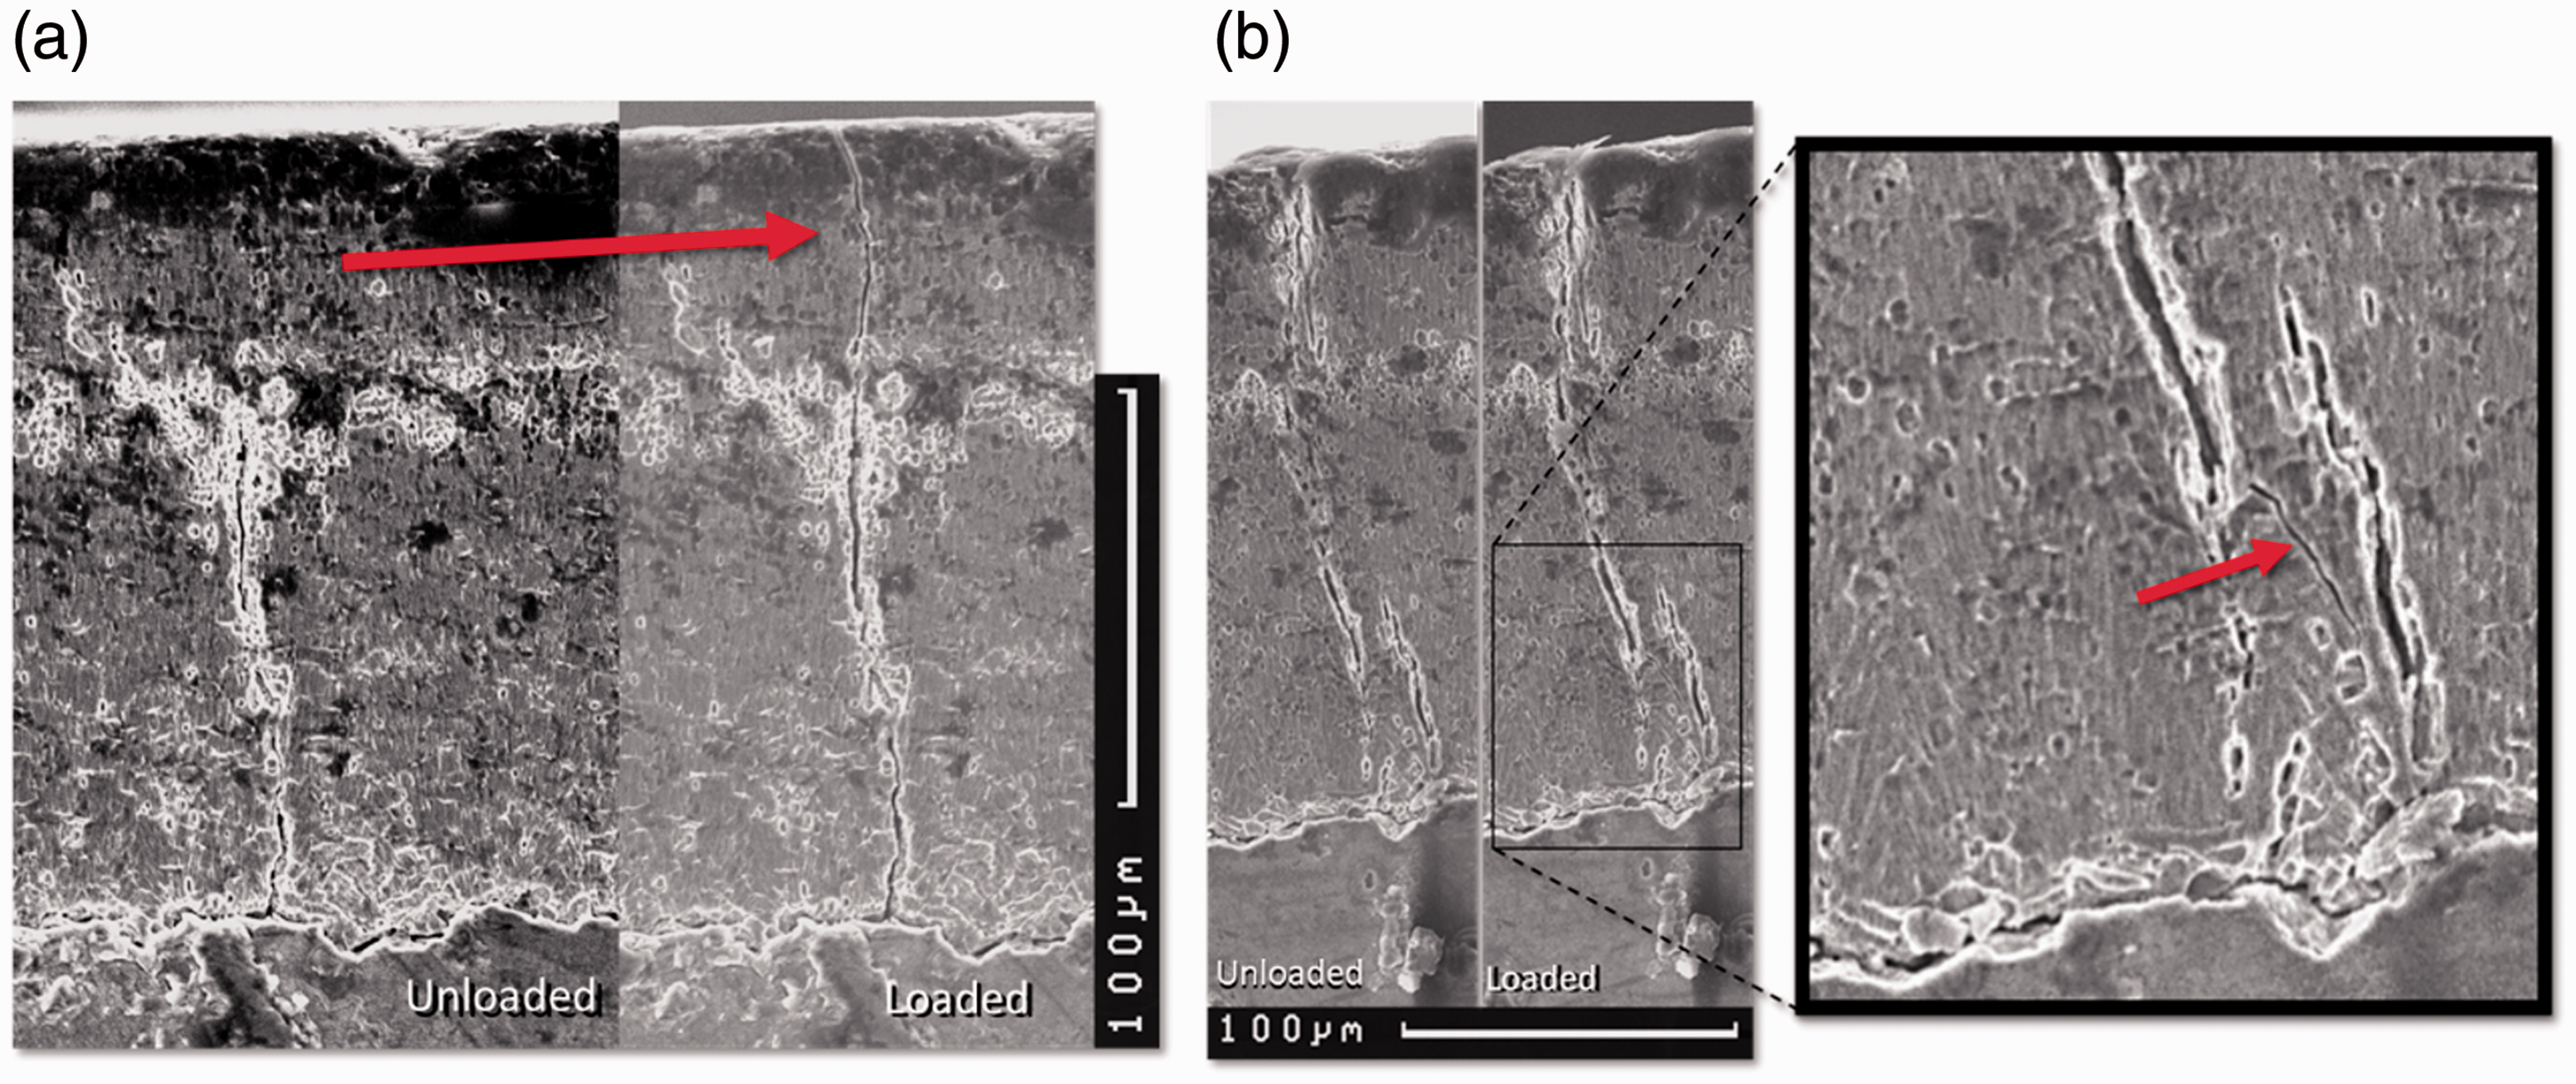
Cracks appearing on chrome test specimen after testing in the SEM.
Conclusions
The present work was carried out to compare the performance of two-layer laser clad coating and chrome electroplating coating. As a case study, a forged steel “rod mill” pinion from the steel industry was chosen, where the mechanical performance of the coatings was tested under three-point bending, using samples from an out of service pinion. The two-layer coating consisted of Ni-WC matrix (outer layer) and Inconel 625 (intermediate layer), which were produced using the Lasercarb® process. The coatings showed no porosity and the desired hardness was achieved. The dilution zones were in the region of 5% of the coating thickness. Test specimens of the two types of coatings have been subjected to three-point bending tests in an SEM and in a UTM. The test results provided a new understanding of the mechanical response of the two-layer clad materials, currently not found in the published literature. Other characterisation includes obtaining measurements for surface roughness, microhardness, elastic modulus and nanohardness using nanoindentation, as well as surface inspection through microscopy.
Although minor cracks were present in both coatings, the propagation behaviour of these cracks was not the same. Multiple cracks were developed simultaneously in the laser clad two-layer coating, where crack propagation was delayed by an extended displacement range in comparison to the chrome test specimen. The benefit of this delay was that the cracks did not propagate into the intermediate layer or the substrate. This showed a distribution of the strain energy across the intermediate coating, while in the chrome coating, the strain energy was concentrated into one small area, resulting in a single crack propagating into the substrate. Crack propagation to the substrate is undesirable for the case study of the pinion, as the chrome electroplating cannot be repaired if there is damage to the substrate.
The behaviour regarding stiffness was different in the two types of coating samples and in some cases uncertain, when observed during the bending tests. Some of the variation in stiffness was attributed to the addition of the intermediate layer, due to its ductility. However, the larger thickness of the two-layer coating, in comparison to the thin chrome layer, might also have contributed to the stiffness, crack formation and propagation behaviour. The composite Ni-WC coating consists of spherical cast Tungsten Carbide particles within a nickel-based alloy matrix layer. The second layer of Inconel 625 has a marginally lower hardness than the steel substrate which has hardness of 325 Hv0.3. The hardness varies through the thickness of the two coatings and when under deformation the softer material is expected to deform to resist the bending strain due to its ductility. The areas of interest are at the dilution regions between layers. High hardness is found in both of these regions at around 450 Hv. This combined with some softening around the dilution region suggests possible heat affected zones or changes in chemical composition in this area. However, the thickness of the dilution zone is very small in comparison to the clad layer, which is one of the advantages of the laser cladding process as opposed to other hardfacing methods.
The surface roughness of the Ni-WC coating was found to be unacceptable in its current form, for direct contact with the bearings used for the pinion. Roughness measurement obtained from a parallel study have shown an improvement in the surface roughness, attributed to the use of a ceramic grinding disc as opposed to a diamond grinding disc. Therefore, it is expected that the clad pinion roughness could improve with the use of a ceramic grinding disc, in both the axial and circumferential directions. Improvements in surface roughness should be considered prior to an industrial trial, perhaps with improvements in the grinding process or the use of alternative surface modifications methods such as laser surface re-melting.
There is a need to replace the chrome electroplating process due to the carcinogenic chemicals required in manufacturing. The two-layer coating has been found to operate as designed with the hard outer coating suitable for load bearing without significant deformation and without delamination when tested under extreme bending conditions. The localisation of strain in the intermediate layer was reduced which had sufficient ductility to limit crack propagation allowing in some bend tests more than twice the displacement without failure. The improved deformation characteristics and dilution between layers can increase the lifespan of coatings as the cracking of the outer coating is less prone to result in delamination and failure. The chrome test specimens have shown uncertainty regarding stiffness behaviour during testing in the UTM and SEM and further tests should include additional test specimens to allow for statistical variation and understanding of the chrome coating behaviour. In addition, further tests should include wear performance and to consider the bearing interface under the same conditions as when in service. Testing the mechanical properties of the coatings individually in standard prismatic specimens, specifically their plasticity and stress distribution, would be of great benefit to understanding the coatings’ behaviour and contribution in the two-layer arrangement. The performance of the clad layer in this study signifies that the laser clad coating could be an alternative to the chrome electroplating coating.
Footnotes
Acknowledgements
The authors would like to thank Laser Cladding Technology Ltd. and Primetals Technologies Ltd., for their contribution in-kind of materials and services.
Declaration of Conflicting Interests
The author(s) declared no potential conflicts of interest with respect to the research, authorship, and/or publication of this article.
Funding
The author(s) received no financial support for the research, authorship, and/or publication of this article.