
Abstract
Laser shear interferometry or shearography is one of the optical and non-contact methods for measuring surface displacements. Shearography can be used in non-destructive testing by applying a kind of excitation such as partial vacuum, mechanical and thermal loadings. Parameters of the excitation techniques significantly affect the test results. In many cases, these loading methods deform the whole surface reducing the detection capability of the technique. This paper considers the vibratory loading method as an alternative to the previously mentioned standard methods. In this method, local heat is generated at the defected area due to the internal and external damping of the piece. A simulation has been conducted using COMSOL software to estimate the generated local heat due to the vibratory loading. The local temperature at the defect area is measured, and the simulation results are validated with an experimental infrared thermography test. The experimental shearography setup is adjusted, and the defects are detected. By comparing the results with those of typical thermal loadings, it has been shown that the fringe patterns obtained by the presented method have higher quality.
Introduction
The development of new non-destructive evaluation methods in polymer materials and composites has become particularly important due to the vast use of these materials in various industries such as oil and gas, aviation, and power generation. Traditional non-destructive testing methods face significant limitations in composite and polymer materials due to their unique properties such as heterogeneity, electrical and magnetic non-conductivity, and high absorption of sonic and ultrasonic waves. For these reasons, many of the traditional non-destructive methods used in metallic material, cannot be beneficially used in evaluation of the defects in composite and polymer materials. Moreover, polymers attenuate waves. Using radiography for composite structure is not possible due to its porous structure. Eddy current and magnetic particle inspection methods can only be used in materials with electrical and magnetic properties. One of the newer non-destructive testing methods widely used for these materials, is digital shearography which is faster and more accurate. Digital shearography is a non-contact optical method that uses monochromatic laser light to evaluation defects specially in composite materials. The ability of Shearography in measurement of surface strains, makes it an excellent tool for assessing defects like delamination and laminations. Whole field measurement ability, is one of the highlighted capabilities of Shearography thet making it much faster than point-by-point techniques, such as ultrasonic. In addition, lower costs of Shearography, makes it very attractive as a first tool in many non-destructive testing. Higher speed and accuracy have made shearography very suitable for polymer materials that are less sensitive to ambient vibrations.1–4
The shearography method measures the strain changes on the surface, caused by loading. The piece is subjected to some kind of loading and interfering images are recorded before and after the loading by a CCD (charge-coupled device) camera. Strain concentration areas are detected using image processing methods. Finally, the defects are detected. The most common loading methods in shearography are thermal, vacuum, and vibrational loadings. Vacuum loading has a higher cost and is not suitable for identifying defects with open borders. Thermal loading has an extended test duration and causes the whole workpiece to be affected and can create temperature gradients across the object surface. Vibration loading does not have those problems; however, images are usually recorded using mean-time method resulting in lower fringe quality than other methods. Thus, in this paper, the vibration method has been used to generate heat at the defect area. This method is called vibrothermography and it is standard and well-known in thermography. Exciting samples at defects’ resonance frequency, creates thermal gradients in defects areas. Using this method results in better fringe compared to thermal and mean vibrational loading.
The shearography method was first used in 1973 by Leendertz and Butters 5 to find the bending moment in beams. Hung 6 conducted extensive research on the theory of shearography and some of its applications, especially in the rubber industry. Several review articles discussed about the principles of forming of shearography fringes, measuring surface strains and applying this method in non-destructive testing of the rubber and aerospace industries. In another study, Hung made a complete comparison of shearography and holography methods. He showed that the shearography method has many advantages over the holography method in performing non-destructive tests.
In the thermal loading method, the thermal expansion causes small deformations in the surface of pieces. If there is a crack near the surface of the work piece, the thermal expansion created in this area will differ from other parts of the piece. As a result of this thermal expansion, shearography fringe is made, and defects are detected. In 2009, Huang et al. 7 investigated the effect of the thermal loading on different materials using digital shearography method. Finite element analysis method was compared with the results of practical tests. This study demonstrated that the loading required for different materials is not the same. The amount of thermal load in each material is proportional to some physical parameters of the sample. In 2011, Amenabar et al. 8 tested three methods of shearography, infrared thermography, and C-Scan ultrasonic testing to identify delamination in the blades of wind turbines made of polymer-based composite. In general, the detection of defects in the shearography method is very effective in the mentioned samples with partial vacuum loading and the results indicate the inability of the thermal loading method in these materials. In 2013, Akbari et al. 9 studied the effect of thermal and mechanical loading parameters on the shearography method. This paper obtained spot patterns in loading PMMA circular plate by two experimental and finite element methods (FEM). They explained the effect of different parameters on the quality and accuracy of the fringes created to detection of the defects. In 2017, Yang et al. 10 examined important parameters in digital shearography such as loading type and size, shear direction and size, and defect size and position. Point pressure, thermal loading, and partial vacuum methods were tested on a circular aluminum piece with the artificial defect for selecting the best loading method. They concluded that the thermal loading and partial vacuum were recognized as more appropriate methods.
Vibratory loading is one of the methods to apply and excite pieces in a practical manner. Vibratory loading fluctuates the work piece with a determined vibration amplitude. The vibration amplitude of the defective parts of the piece is different from other intact parts. If the vibration frequency applied to the pieces is close to the defect resonant frequency, the difference of fluctuating amplitude between the defects and the intact areas will increase. The high sensitivity and capability of digital shearography to the displacement gradients of the part surface, result in the shearography fringe creation. So, the defects of the test samples can be detected. 11 The mean-time shearography method, a special type of vibratory loading, was first developed in 1974 by Hung and Taylor 12 via sinusoidal loading. Later, it was used for non-destructive testing. In another paper, Hung and Taylor 13 examined digital shearography and its application for non-destructive testing of composites. In this paper, two methods of vibratory loading and partial vacuum loading were used to excite a piece. Finally, the results showed that using vibratory loading leads to detecting of the defects. Vibratory loading method detects defects with open and closed borders. Meanwhile, the partial vacuum loading can only detect defects with closed borders. In another study conducted by Toh et al., 14 the mean-time shearography method was used to detect defects of a composite sample. Rao and Mohan 15 applied real-time shearography for different pieces. Sim et al. 16 showed that the real-time shearography method is suitable for performing non-destructive tests and determining vibratory modes. Asemani et al., 17 examined and developed stroboscopic digital shearography using vibratory loading. In 2018, Liu et al. 18 detected cracks on a piece of aluminum with vibratory loading. They detected cracks that were artificially created on the piece of aluminum T351_2024. Vibrothermography is a non-destructive test method for evaluating defects such as cracks delamination near the surface. Much researches have been done to detect heat generation mechanisms due to the vibratory loading. In this method, vibratory loading is used to generate heat in pieces at the defect area and detect the thermal changes of the part using IR camera. 19 In 1980, Reifsnider et al. 20 examined the heat generated by a viscoelastic mechanism on a sample of a polymer composite including delamination defects. They have shown that even the heat generated by this mechanism, will be higher in the stress concentration areas. The applied vibratory stress is kept as low as possible to prevent plastic changes. In 2006, Homma et al. 21 examined the generation of heat in the vibrothermography using experimental evidence, and then they identified the mechanisms of the heat generation. Vibratory loading does not generate much heat unless there is a defect in the piece. The presence of a defect, causes more heat to be generated in the surface. The reason for this is that the presence of a defect such as a crack creates two surfaces that are in contact with each other at points, and these surfaces slide on each other due to vibrations. This leads to heat generation at the defect area. Also, the samples are vibrated in a resonant state for greater efficiency in heat generation. Three mechanisms can generate heat in the pieces. The first is the friction of two internal contact areas created in pieces due to the defect. The second mechanism is the plastic deformation resulting from the material expansion and growth of the cracks. The third is the viscoelastic mechanism. The last factor will be much greater in the areas where the stress is concentrated, such as defects. The viscoelastic mechanism in the polymer base materials, can be considered as an important source of heat generation. It is possible to excite a test sample using mechanical vibrations with a special multi-harmonic signal and observe it using an infrared camera. In 2018, Katunina and Wachla 22 evaluated defect detection of the polymer materials. Firstly, the tested structure was subjected to the modal analysis (MA) to evaluate its frequency response function (FRF). The natural frequency of the modal shapes has been extracted. In the second step, the acquired frequencies have been used to construct a multi-harmonic signal for mechanical excitation. The thermal response has been observed by an infrared camera. The tests were performed on glass fiber-reinforced composite specimens with artificial defects in various shapes. The damage sites were properly detected and localized. In 2011, Renshaw et al. 23 used experimental methods to investigate vibrational heat generation sources such as friction, plasticity, and viscoelasticity. They examined these mechanisms using experimental evidences, such as testing a samples including cracks and applying vibrations on the frequency range of 20–40 kHz. In 2018, Truyaert et al. 24 studied generated heat in some samples using a numerical method. In this paper, it is shown that friction mechanism, will cause heat generation in different conditions of contact at the defect area. In 2018, Al-Zubaidi et al. 25 experimented the heat generated by the vibrations of a rod in the resonant state using IR-thermography. Also, they conducted a numerical simulation by COMSOL software and compared the results of the analytical and numerical methods. In the numerical study, the natural frequency is first examined, and then the amount of the heat generated due to the damping is evaluated. 26 It shows that increasing the loading frequency, reduces the heat generation. The generated heat depends on the natural frequency, structure, and material thermal and mechanical properties of the sample.
Fiber-reinforced polymers have great properties making them a suitable replacement for metallic components. Hedayatrasa et al., 27 in 2019, used viborthermographic spectroscopy to identify the LDR frequencies of a defected sample made of CFRP based on the second derivative of surface temperature. This technique localizes the vibrational energy at the defected area and increases its detectability even in the low excitations. The results of proposed technique have been evaluated and compared with lock-in vibrothermography. In 2018, He et al. 28 proposed a method in which the integrated nonlinear ultrasound (NU) and Vibro-thermography (VT) NDT based on the shared excitation sources has been used to evaluate the location and shape of the defect. A digital, low-power ultrasonic system has been used for excitation. Overall, the detection capability has substantially improved.
As a summary, most of the previous studies use the displacement caused by vibration to detect defects using the digital shearography. In this paper we have:
Investigated shearography using vibratory loading to generate heat at the defect area
Conducted experimental study of shearography non-destructive test on PVC foam and Teflon pieces with artificial defects of different dimensions and depths
Investigated heat generation and temperature changes at the defect area using an infrared camera
Studied effect of vibration frequencies on the heat generated at the defect area using the theory of shearography
Conducted a numerical simulation to obtain resonance frequencies of each defect and Consequently, heat generated in defect area at the given frequency.
Compared the results of the presented method with vibratory and thermal loading methods
Principles
Shearography
Shearography method is based on the interferometry of reflected waves from the surface of a piece illuminated by a monochromatic laser light. A CCD camera is used to record spot patterns, which records the interference light intensity on the camera screen and transmits it to the computer. Different interferometry methods are used to create two separated wave areas. Michelson Interferometer is one of the most widely used interferometry systems that is shown in Figure 1. The system consists of two mirrors with high reflectivity (M1 and M2) and a beam splitter. Figure 1 shows that a part of light beam reaches mirror M1 and the other part goes to the mirror M2 after colliding with the beam splitter. Parts of these two beams pass through the beam splitter again and merge in the screen. As a result, the interfered pattern appears on the camera sensor screen.
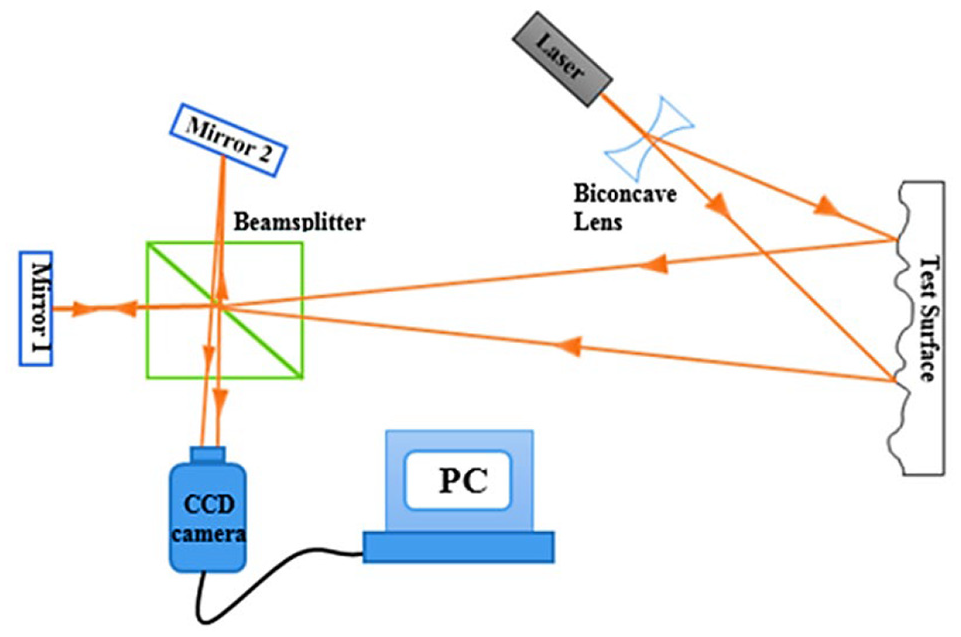
General schematic of the digital shearography arrangement based on Michelson Interferometer.
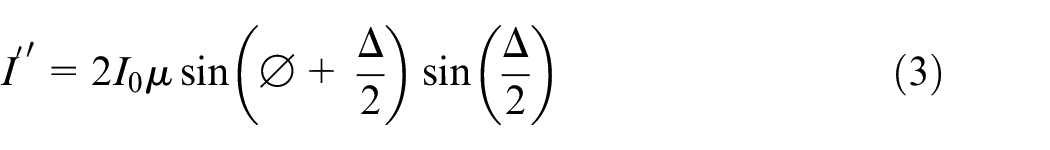
The intensity of the interfered light recorded by the camera is expressed as equation (1) 29 :

Where I is the light intensity of the spot patterns recorded by the camera screen,

Where
Where
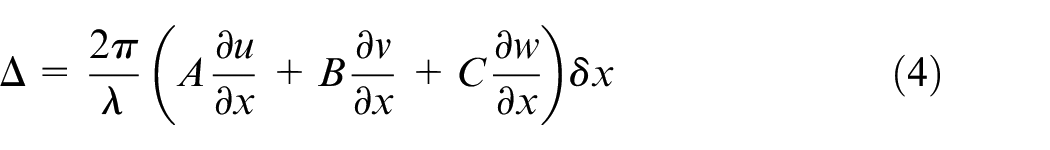
Where
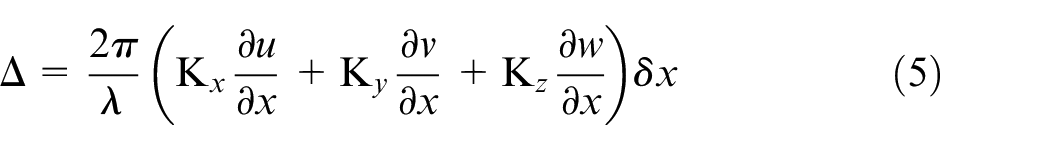
Supposing the incidence and reflection direction are approximately perpendicular to the sample surface, the values of
The latter equation is the primary shearography relation that expresses the relationship between surface displacement gradient and shearography parameters.
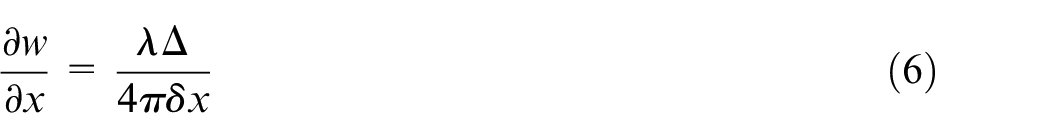
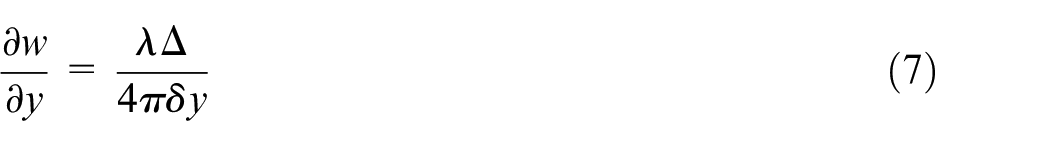
If the shear size is applied in the y-direction, the out of plane displacement gradient is measured in the y-direction, which is equal to:
One of the advantages of shearography method using the Michelson interferometer, is adjustability the shear size, which is accessible by slightly changing in the angle of the rotatable mirror.
The theory of temperature gradient
In this paper, numerical simulations and experimental thermography tests have been used to investigate the heat gradient in different parts of the piece surface. In this section, the theory of thermal gradient created in different parts of the piece due to vibratory excitation is reviewed, which can be used to calculate and obtain the heat generated in the area of the defects.
The heat transfer equation in material under conductive heat transfer with a local heat source is expressed according to Fourier law as follows 31 :
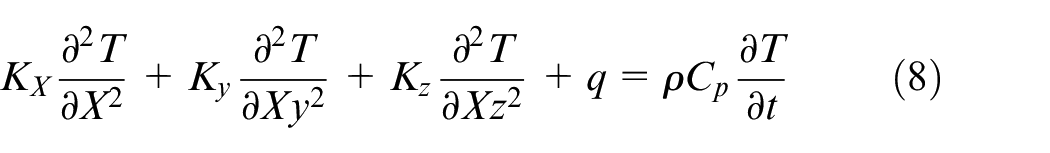
Where T (x, y, z, t) is the temperature of the piece at a given time, K (x, y, z, t) is the coefficient of conductive heat transfer in different directions (given that the part is isotropic, this value is equal in all directions), Cp is the specific heat of the piece and q is the heat generated in the coordinates (x, y, z) at time t, which is defined as follows31,32:

Where
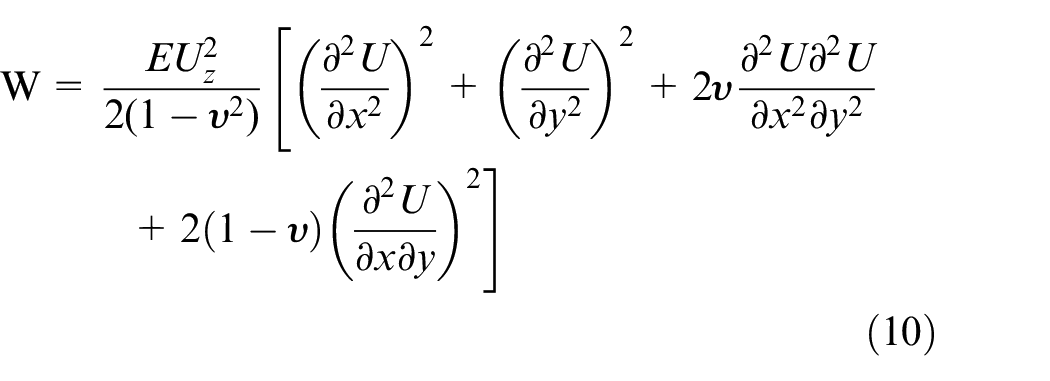
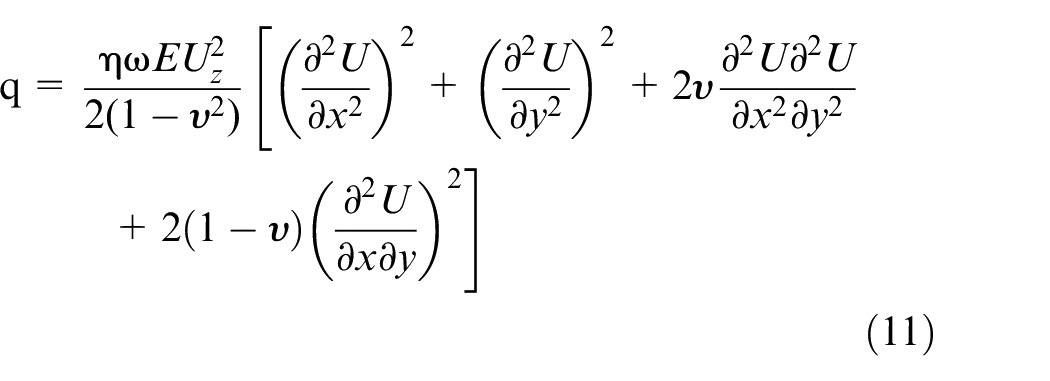
In equation (10), U = u(x, y, z, t) is the displacement caused by the harmonic excitation of the piece, and uz is the amount of displacement in the off-plane direction. By placing equation (10) into equation (9), the generated heat is expressed as follows:
According to the convection and radiation heat transfer, it is expressed as follows:

Where n is the direction of the surface vector, h is the convection heat transfer coefficient
Internal damping is caused by the interaction of material particles under vibration, which generates energy loss. Energy losses depend on the material and geometric structure of the pieces. Thermoelastic damping is an example of this type of energy loss, in which the energy of the system is converted to the thermal energy due to the deformation of the piece. Surface losses are another type of internal damping, and surface stresses generally cause them. Another type of internal loss is losses due to the granulation impurities in polycrystalline materials. Composite materials also have energy loss at the boundary between the layers. 33 External damping depends on the boundary conditions; the most important one is the air damping.
In a thermoelastic solid sample, expansion and compression can change the work piece temperature. In a defect with transverse oscillation, the upper and lower surfaces of the defect undergo different deformations. When the defect is bent, the upper surface is compressed (its temperature increases due to the compression), the lower surface is strained (the surface temperature decreases); therefore, this difference creates a thermal gradient at the cross-section of the defect. This temperature gradient creates an irreversible heat flow in the defect. As a result, the oscillating energy of the piece is wasted in the form of heat transfer between the two surfaces, and thus its entropy increases. However, this energy loss does not always have a significant impact. The energy loss and heat generation are maximized when the oscillating frequency of the piece is close to the defect resonant frequency.
Simulation and experimental tests
Defects simulation
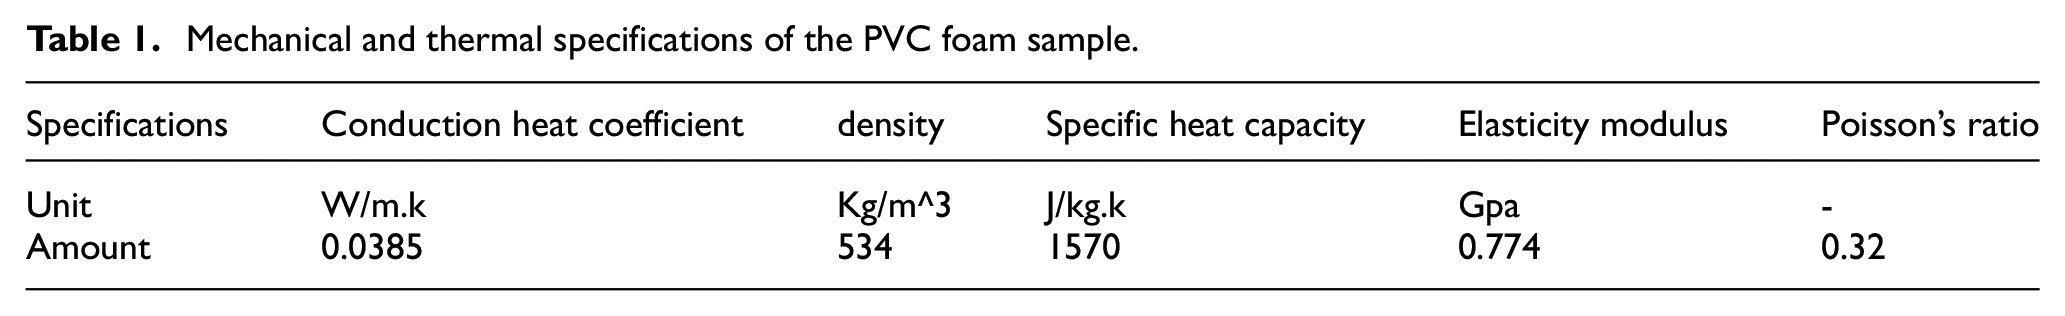
In this paper, a PVC sheet, with the specifications shown in Table 1 with a thickness of 4 mm and dimensions of 114 ×145 mm, has been simulated by COMSOL software. The nature of the problem is multiphysics, that it combines vibrations and heat transfer fields. COMSOL is selected as an analysis software since it is one of the best well-known software in the multiphysics analysis. In this sample, defects have been created with diameters of 20 and 25 mm in two depths of 0.5 and 1 mm so that, surface defects in materials and composite parts can be modeled. When the piece’s excitation frequency is close to the resonant frequency of the defects, the energy loss and heat generation due to the vibration of the defects is maximal and the defect can be detected by detection of the thermal gradient. For this purpose, resonance frequency of each defect is obtained by performing a simulation in COMSOL software. Figure 2 shows workpiece surface displacement in the particular range, indicated by the color palette next to the object’s result.
Mechanical and thermal specifications of the PVC foam sample.
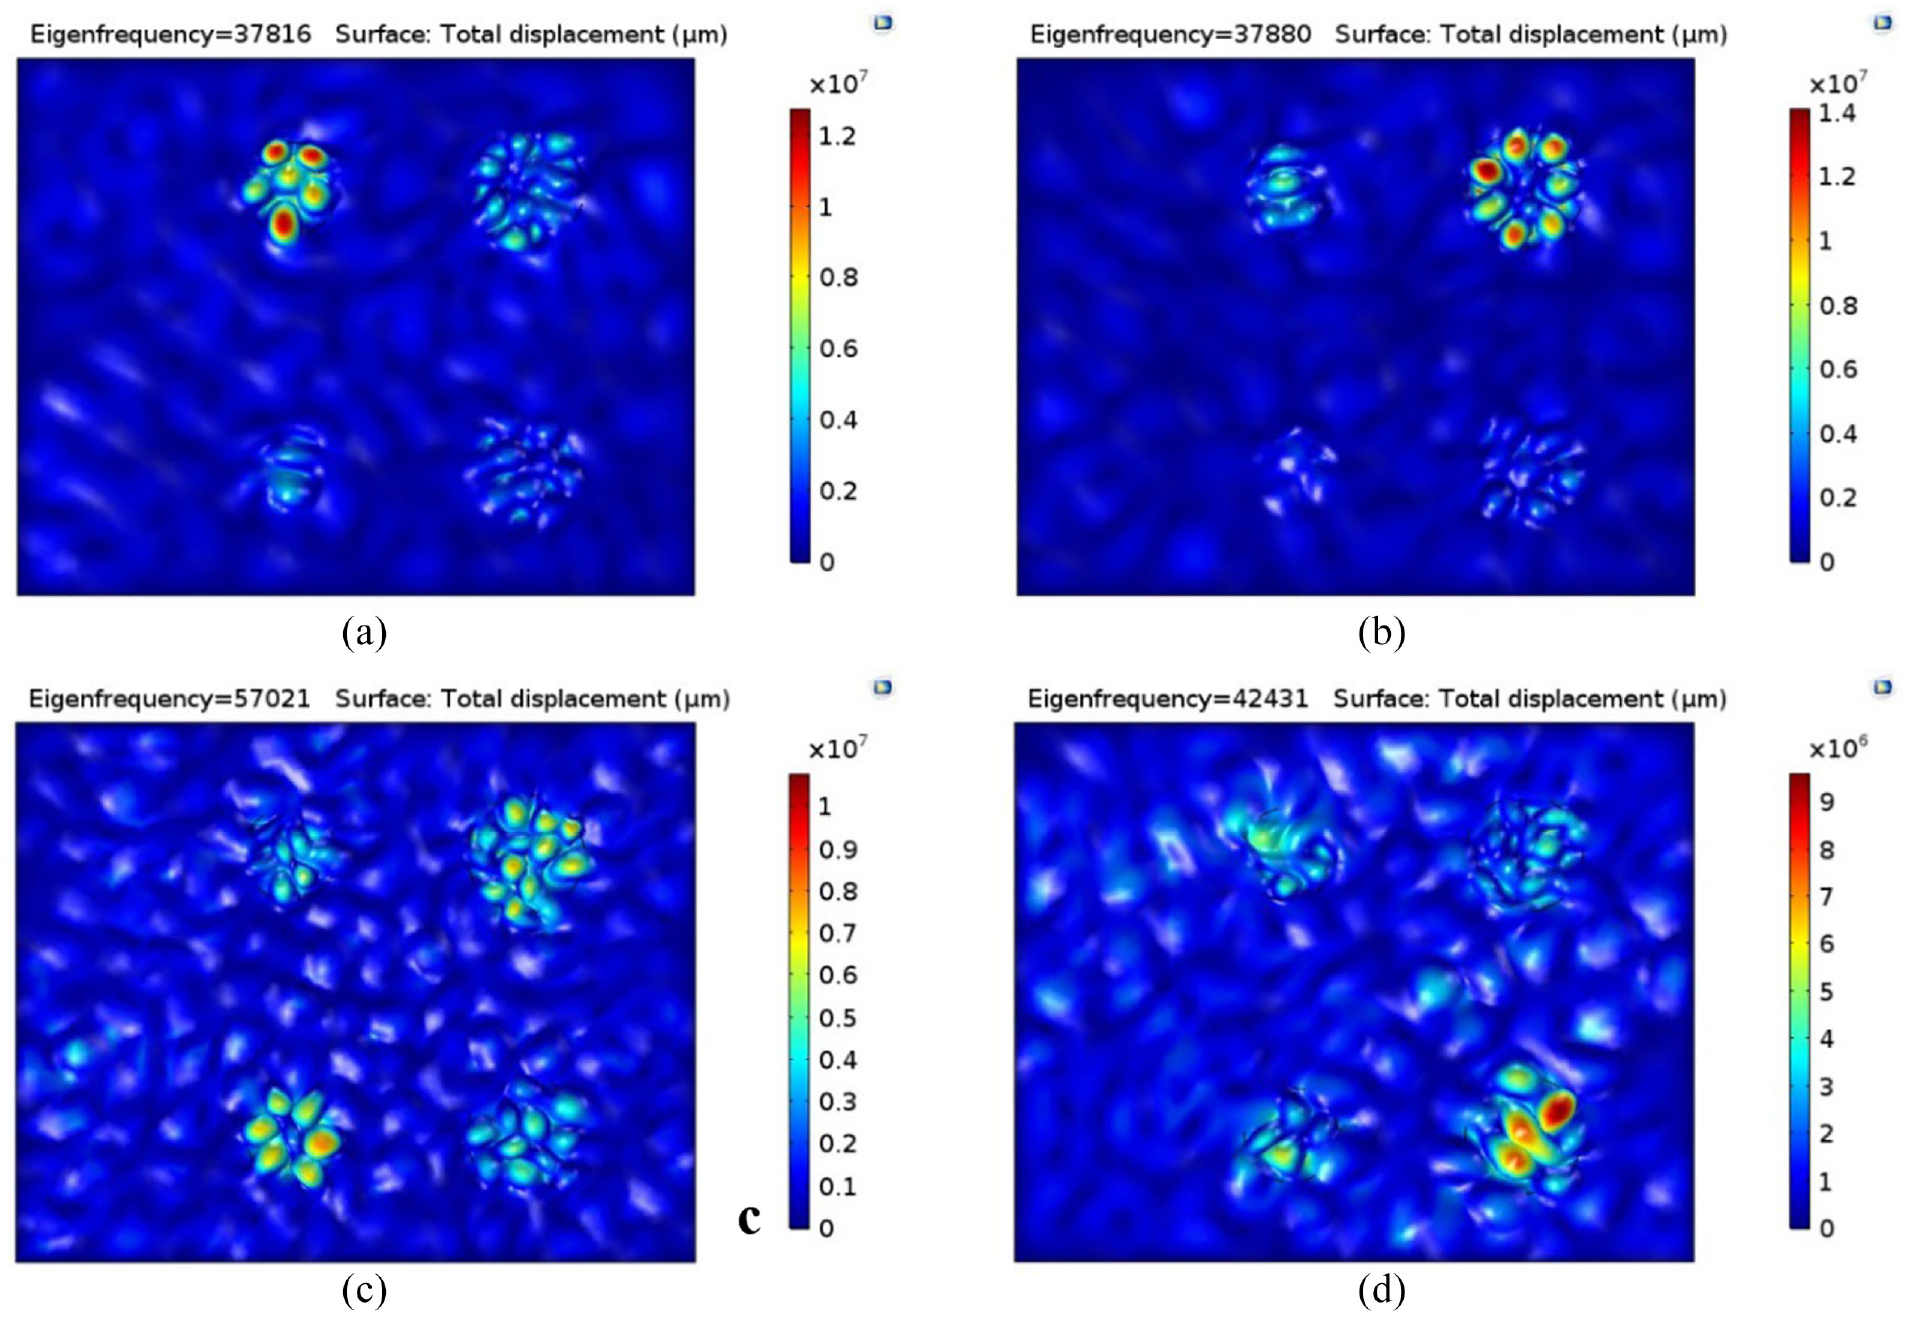
Temperature distribution due to the mechanical vibration on a defective sample: (a) the defect with 20 mm diameter and 0.5 mm depth (37,816 Hz), (b) the defect with 25 mm diameter and 0.5 mm depth (37,880 Hz), (c) the defect with 20 mm diameter and 1 mm depth (57,021 Hz), and (d) the defect with 25 mm diameter and 1 mm depth (42,431 Hz).
The piece is excited with a maximum displacement amplitude of 2 µm and different frequencies for 30 s. Heat generation at the defect area is kept constant by applying excitation at the resonant frequency of the defect. Figure 3 shows the amount of heat generated by the excitation at the resonant frequency in each defect. Figure 3 shows workpiece surface temperature in Fahrenheit. The color palette indicates the temperature range in the figure.
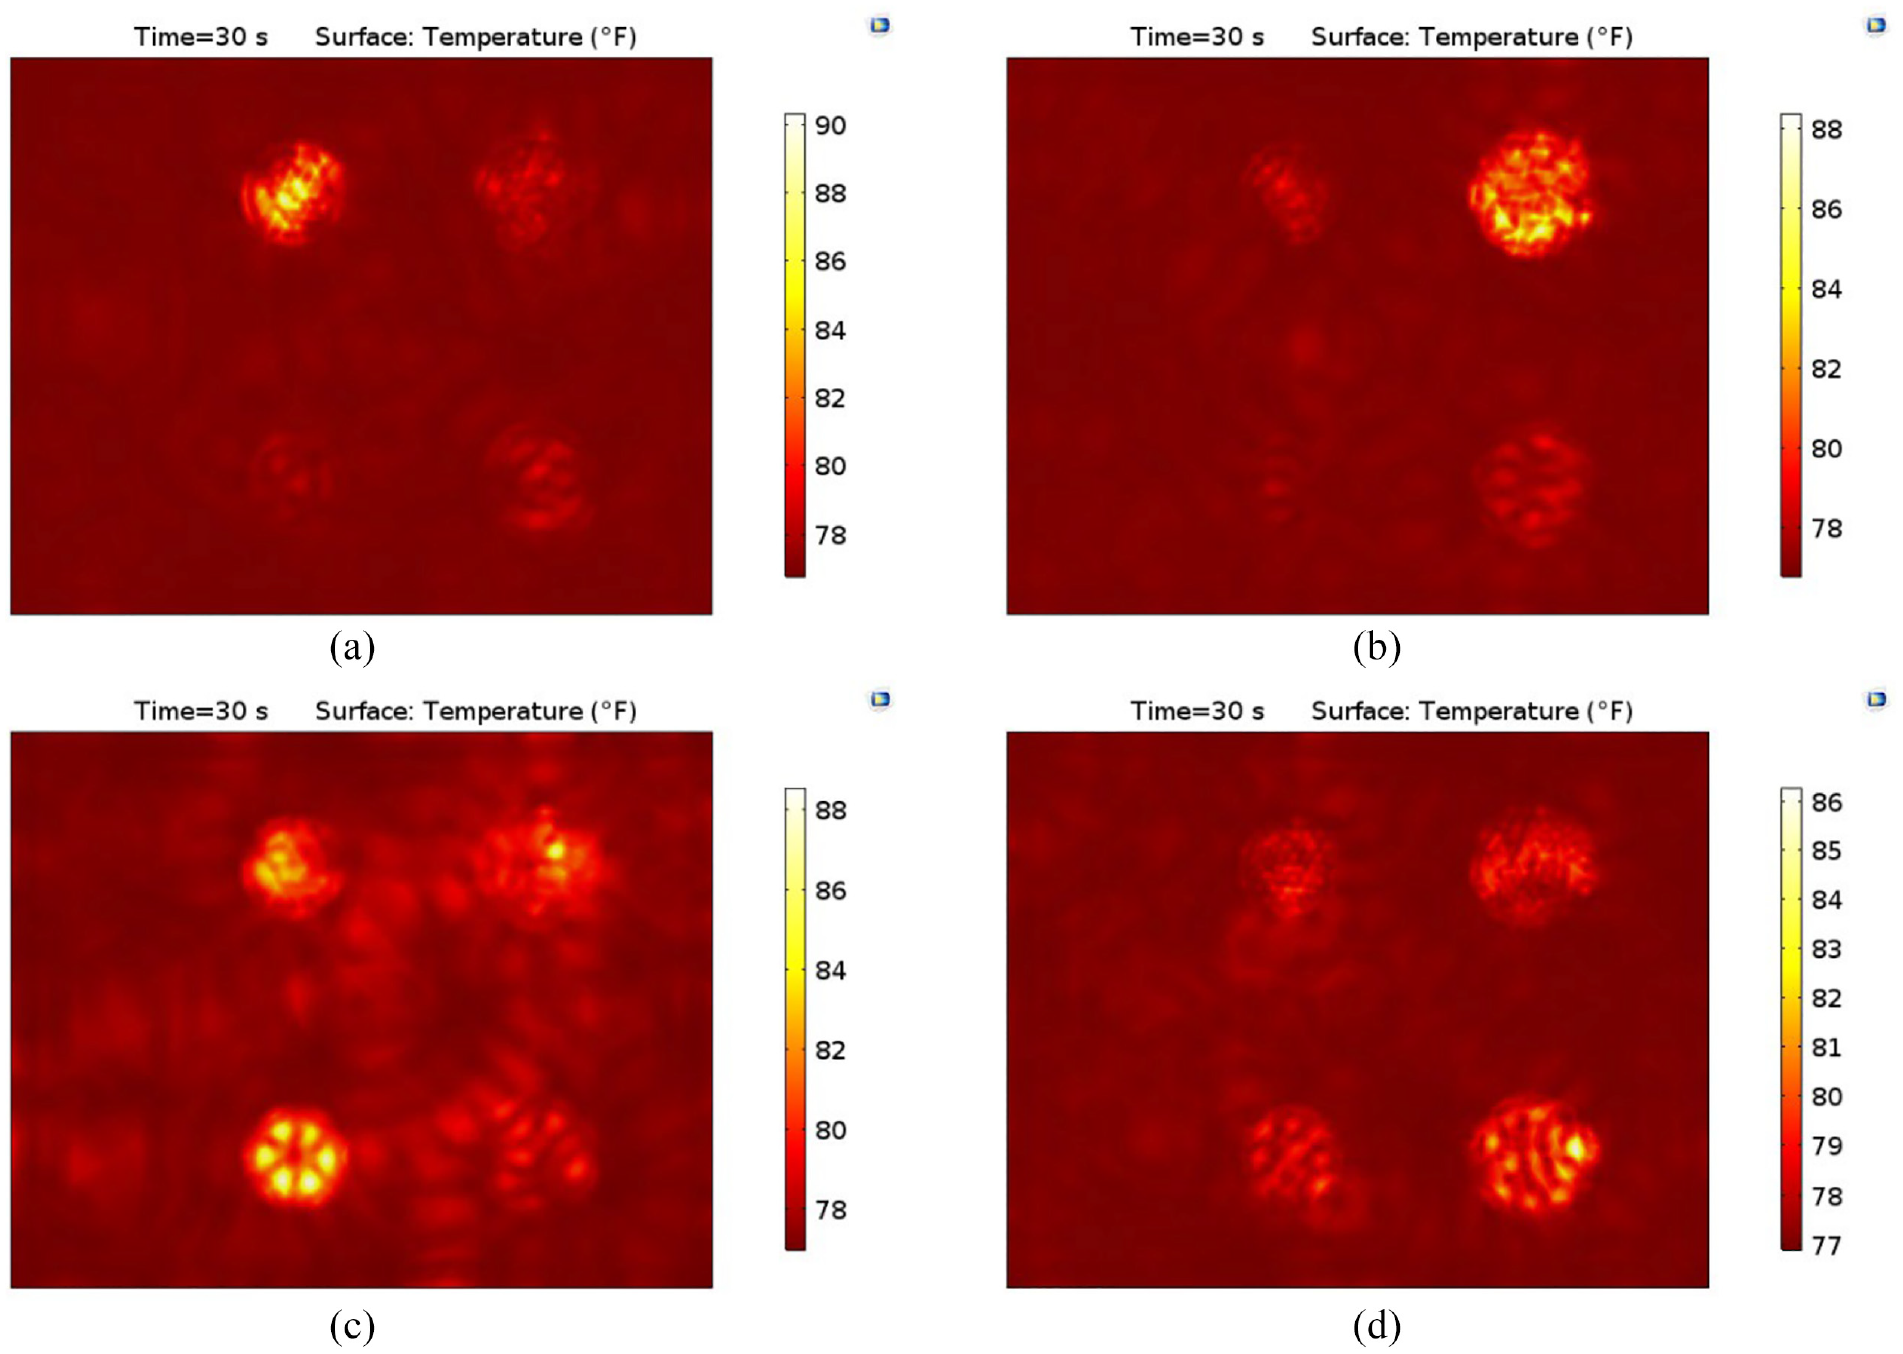
Thermal gradient generated by excitation for 30 s.
Infrared thermography test
An experimental thermography test has been used to verify the simulation results, detect the area of thermal concentration due to the vibratory loading, and validate the analytical results. A thermography camera with a resolution of 320 × 240 pixels and a temperature measurement sensitivity of 0.08°C is used to measure the temperature distribution during vibratory loading. A PVC sample with the mentioned specifications is prepared and machined using a CNC milling machine to model the surface defects. The depth of these blind-end holes has been selected so that two defects can be seen from the piece’s opposite surface with a depth of 1 and 0.5 mm. The position, shape, depth, and size of the defects can be seen in Figure 4.
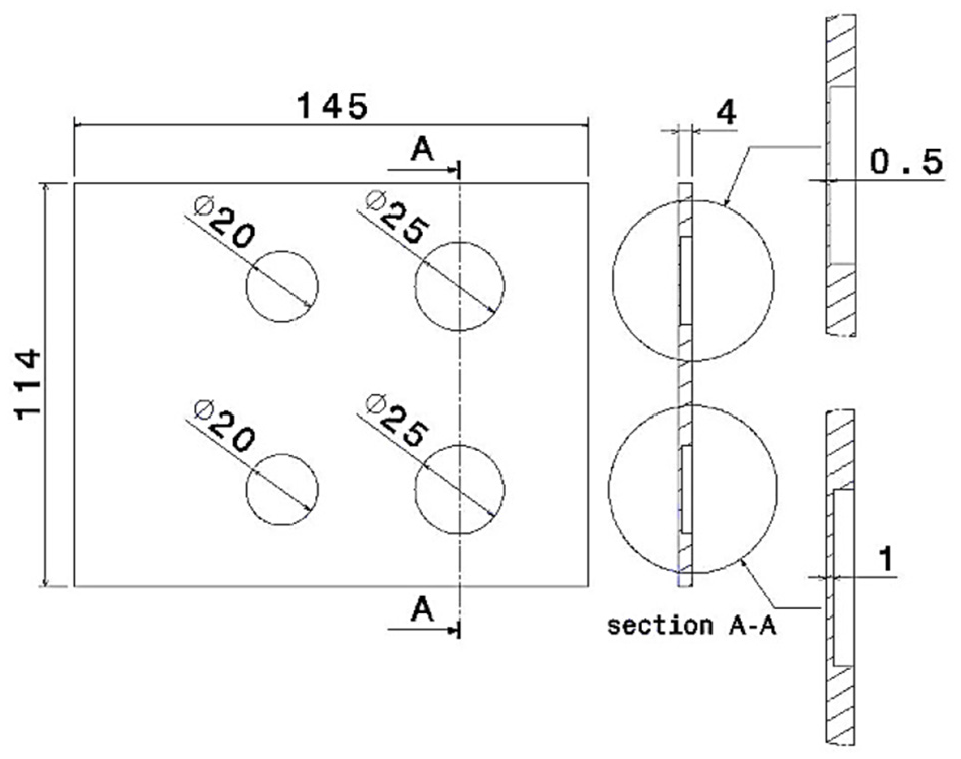
Position, shape, and depth of defects on the PVC piece.
A digital function generator (G305) performs vibratory loading with the sinusoidal wave and different vibratory frequencies. The generated waves are amplified using an amplifier. The waves are generated and transmitted to the piece using a speaker. The arrangement of the thermography test is shown in Figure 5.
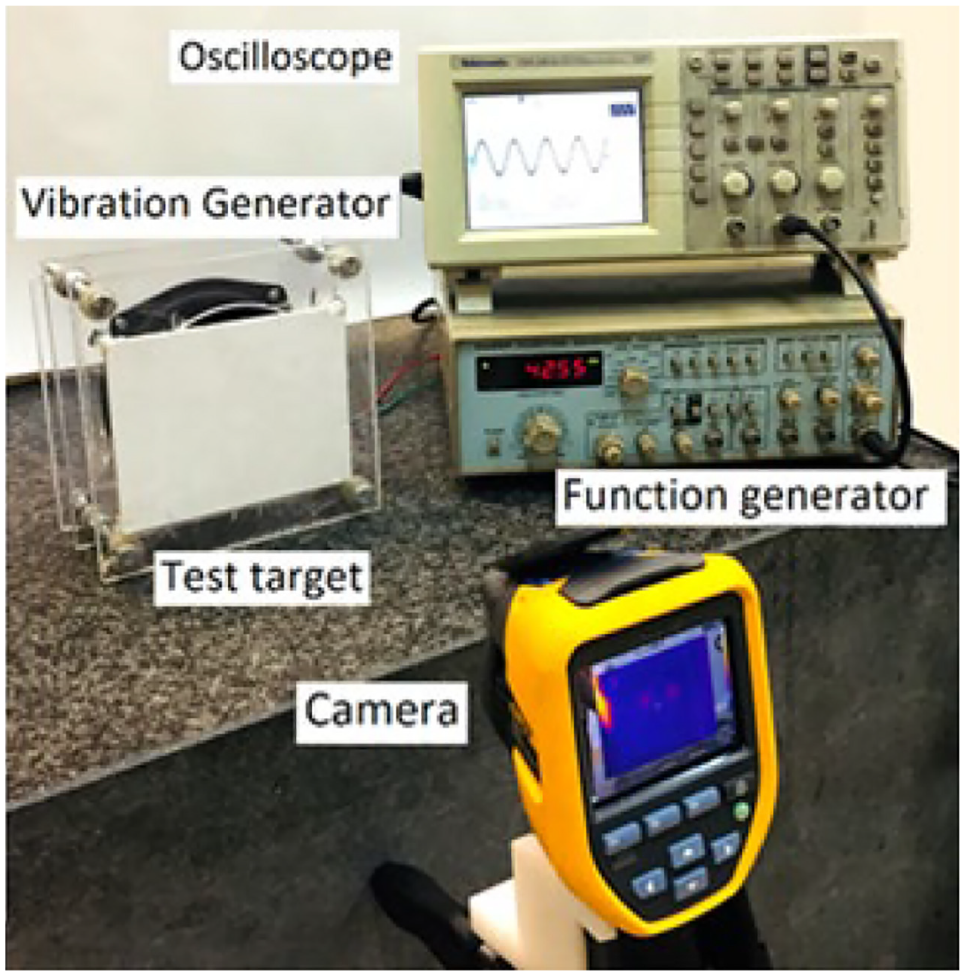
The arrangement of the thermography test using vibratory loading.
After performing the initial tests, adjusting and calibration, the camera is appropriately located in front of the piece’s surface. The piece is excited using sinusoidal waves with different frequencies for 30 s. The heat generation due to the vibration is observed and defect location is determined by the camera. Defects detected due to the heat generation by vibratory loading are shown in Figure 6. Also, the temperature distribution at the defect area is measured along the line passing through the defect cross-section.
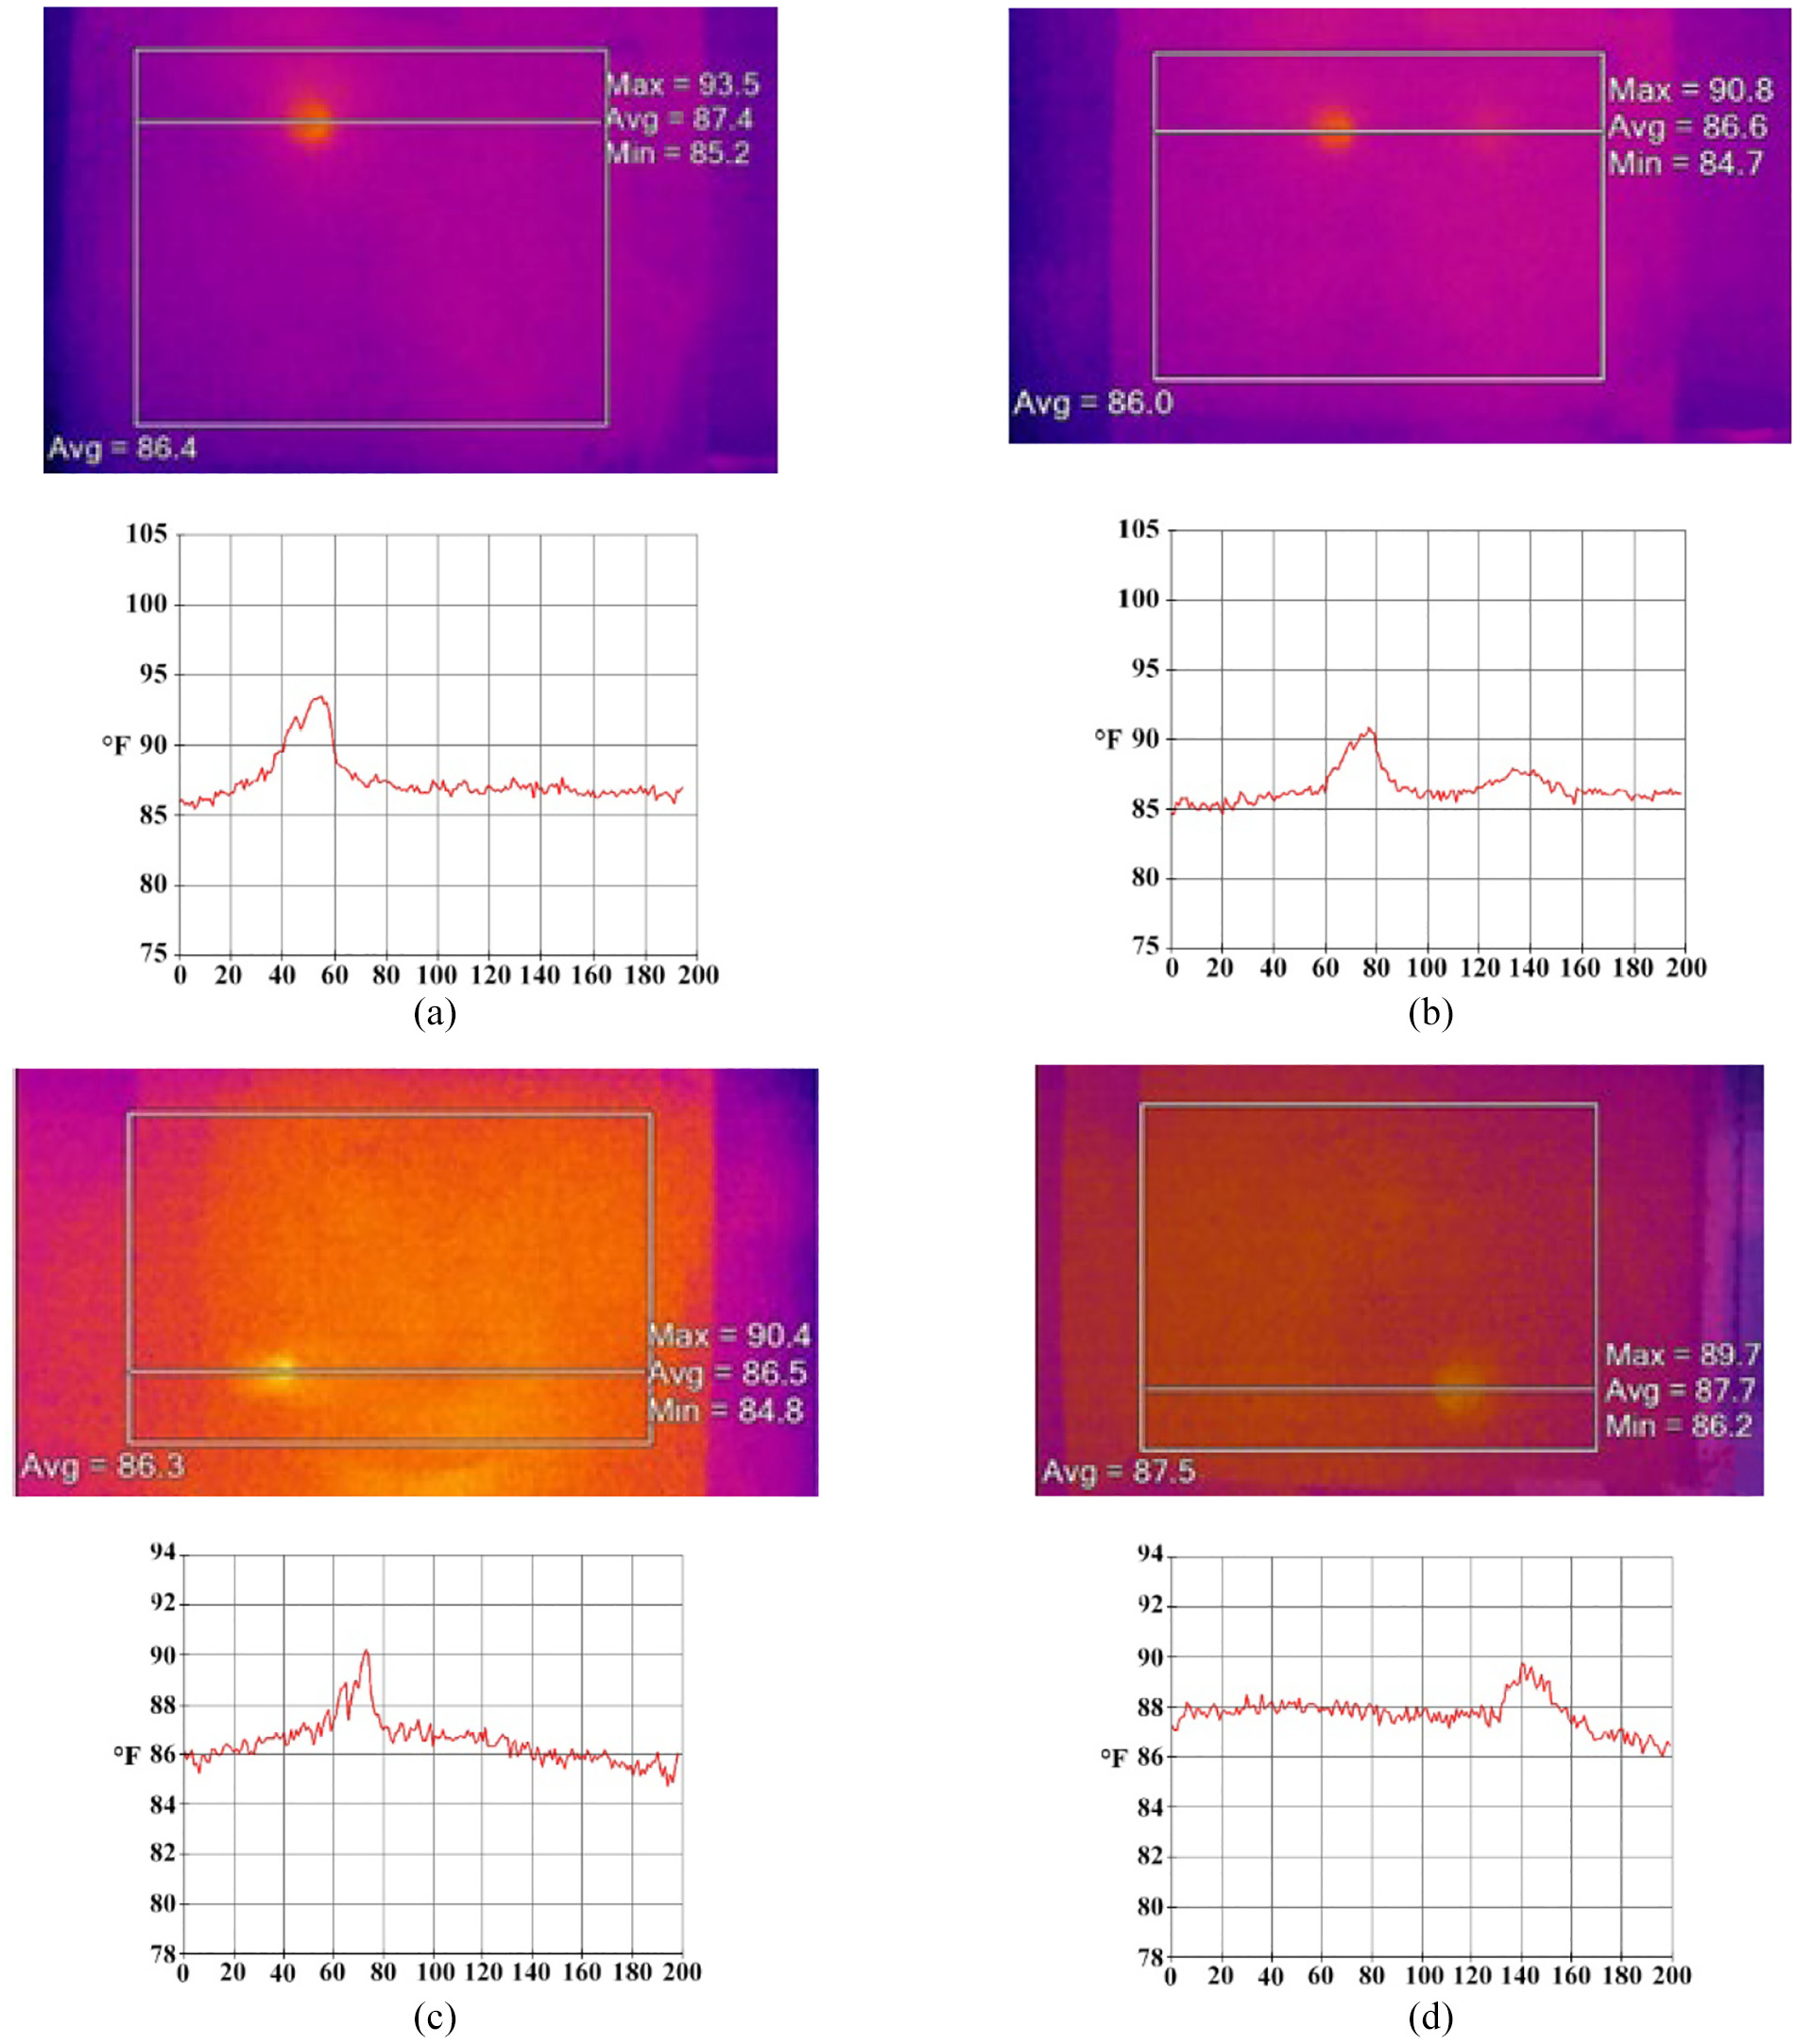
Thermal images of the temperature (Units are in Fahrenheit) at the area of the defects due to the vibratory excitation of the piece: (a) the defect with 20 mm diameter and 0.5 mm depth (43.94 kHz), (b) the defect with 25 mm diameter and 0.5 mm depth (42.55 kHz), (c) the defect with 20 mm diameter and 1 mm depth (62.21 kHz), and (d) the defect with 25 mm diameter and 1 mm depth (44.70 kHz).
The results of the thermography tests are compared to the experimental data by measuring the thermal gradients created at the different parts of the piece surface. The results of this comparison is shown in Figure 7:
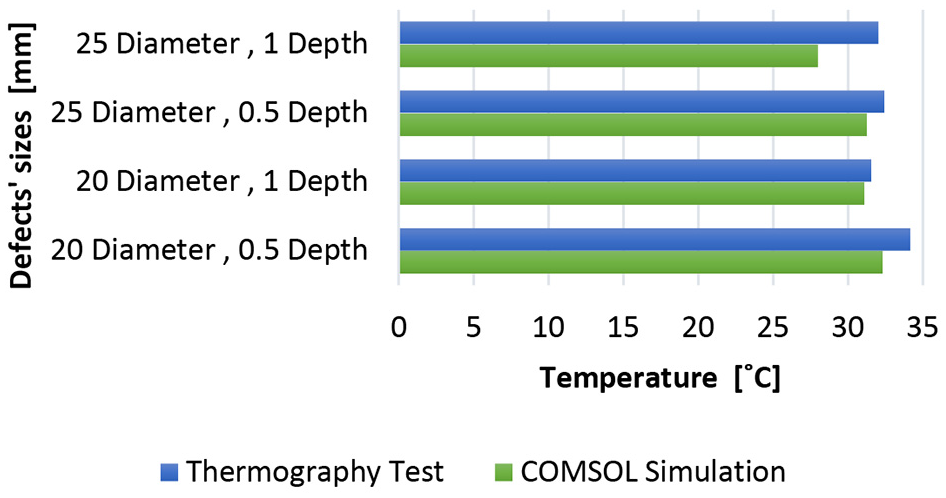
Thermal gradient in the defected area. Comparison between simulations and experimental tests.
According to Figure 7, the thermal gradient created in the experimental thermography tests, is more significant than those of the simulations. One of the main reasons is the difference between the excitation frequency of the piece in the practical test compared to the simulation, which also causes a difference in the heat generated at the piece’s surface. Other sources of error can be the material properties of the piece, impurities in its structure, grain size, environmental conditions, the accuracy of the thermography camera, and measurement errors. However, the simulation can be adapted to the experimental results by considering a correction factor.
In addition to the temperature gradient, the resonance frequency of the piece in the experimental test and numerical simulation are compared. Figure 6 shows that the excitation frequency required for detection of the defects in the experimental thermography is slightly higher than the results of the numerical simulation. This comparison also indicates that the frequency difference of experimental and numerical tests in defects with a depth of 1 mm is less than 6%. However, this difference increases up to 12% in defects with the depth of 0.5 mm. The main reason of this difference is the support conditions and tightening of the practical test piece. Another potential reason is the difference in geometry (thickness, dimensions, size, etc.) of defects created in the simulated piece and the sample under experiment.
Experimental test of shearography
In this section, the ability of shearography non-destructive test in detection of the defects is experimentally investigated based on the heat generation at the defect areas due to vibratory loading. Also, the results are compared to the standard thermal loading method. For this purpose, a shearography set-up, including optical perforated plane, mirrors, Michelson interference, CCD camera, and laser with a power of 50 mW are prepared. To maintain stability and rigidity, a granite plate table is used here. The set was calibrated using the point loading system, and the performance and accuracy of the arrangement is evaluated.
Defects are detected using digital shearography technique by recording and comparing reference images with deformed ones after applying 30 s of sinusoidal vibratory loading in different frequencies. The deformed interfered images from the surface of the piece are recorded with a time interval of 1 second. The shearography arrangement with the adjusted vibratory loading system is shown in Figure 8.
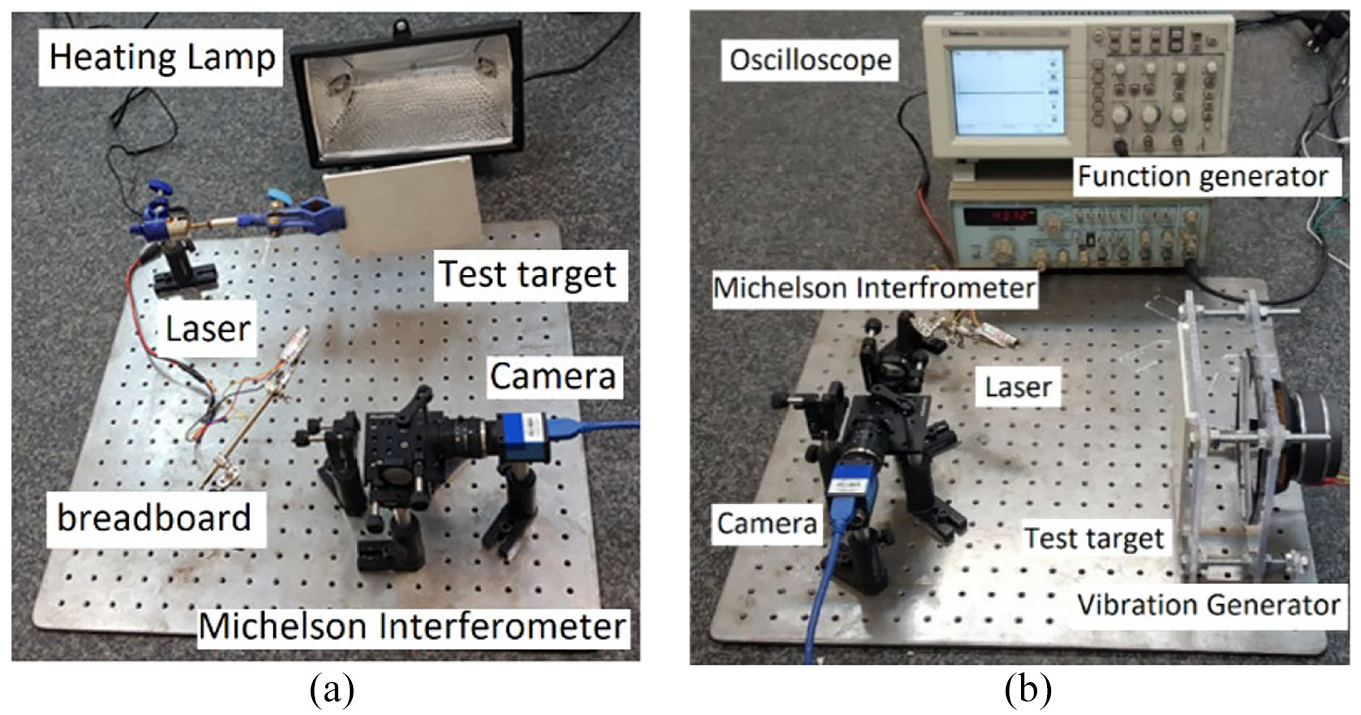
(a) Digital shearography set-up with vibratory loading and (b) digital shearography set-up by loading with 1000 W heat lamp.
In addition to the presented vibratory loading, standard thermal loading method is also applied and the results are compared. To apply the thermal loading, a 1000 W heat lamp was used, which was placed at a distance of 30 cm from the back of the sample. After recording the reference images of the three test samples, the heat lamp is switched on for 2 s and thermal loading is applied to the workpiece; then, as the lamp is turned off, the deformed interfered images are recorded from the piece surface during the cooling of the piece with time intervals of 1 second. The shearography set-up with the adjusted thermal loading system is shown in Figure 8.
After recording the interfered images and performing the processing steps, the defects appear in the form of shearography fringes as shown in Figure 9. It is observed that all the artificial defects are successfully detected using the introduced loading system. In addition to detecting the presence of the defects and their sites, the size and depth of the defects can be estimated from the number and compression of the fringes relative to each other. The distance between the fringes must be measured to quantitatively evaluate defects from shearography fringes. Therefore, the quality of the fringes and the removal of annoying fringes will have a significant impact on the accuracy of the quantitative measurement process. One of the most critical parameters that affect the quality of the fringes is the type and amount of the loading.
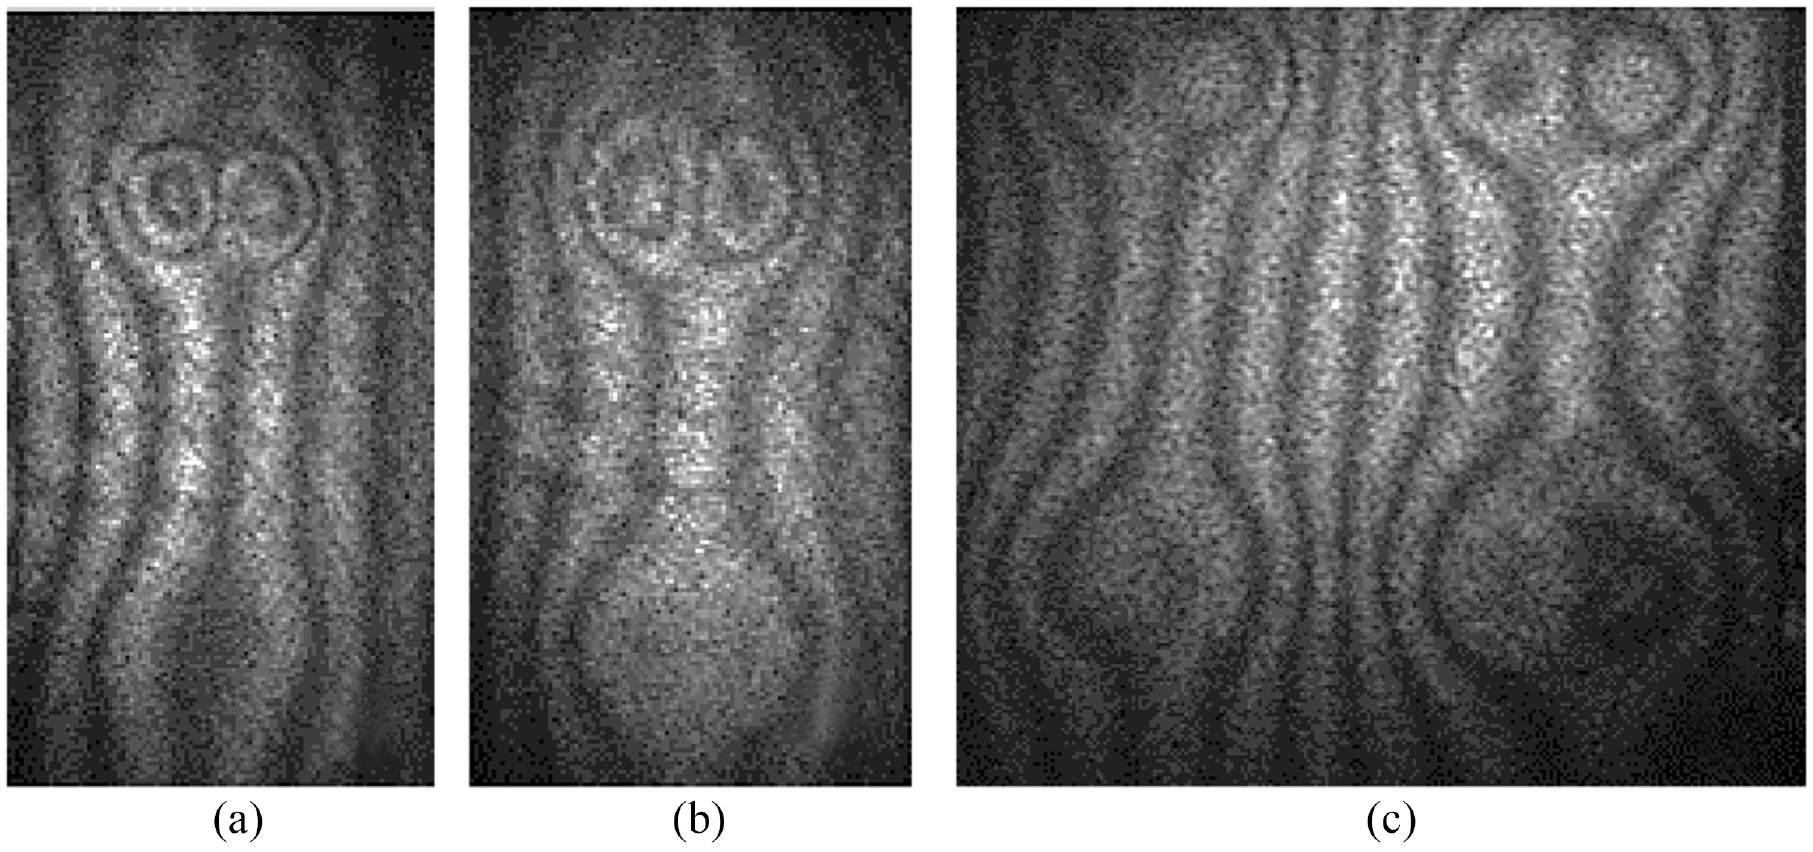
Detected defects on a piece of PVC foam with traditional thermal loading: (a) detection of defects with a diameter of 20 mm, (b) detection of defects with a diameter of 25 mm, and (c) detection of four defects simultaneously.
Figure 9 shows the defects detected using traditional thermal loading with diameters of 20 and 25 mm and depths of 0.5 mm at the top of the image, and 1 mm at the bottom on a PVC foam piece. A noteworthy point in these results is the creation of unwanted fringes of the workpiece and the concentrated fringes of defects, which will cause errors in inspection of the workpiece and reduce the overall quality of the results.
Figure 10 shows the detected defects with diameters of 20 and 25 mm at two depths of 0.5 and 1 mm using vibratory loading. A noteworthy point in the results of shearography using vibratory loading is eliminating the additional fringes and increasing the separability of the fringes with a higher quality and higher resolutions.
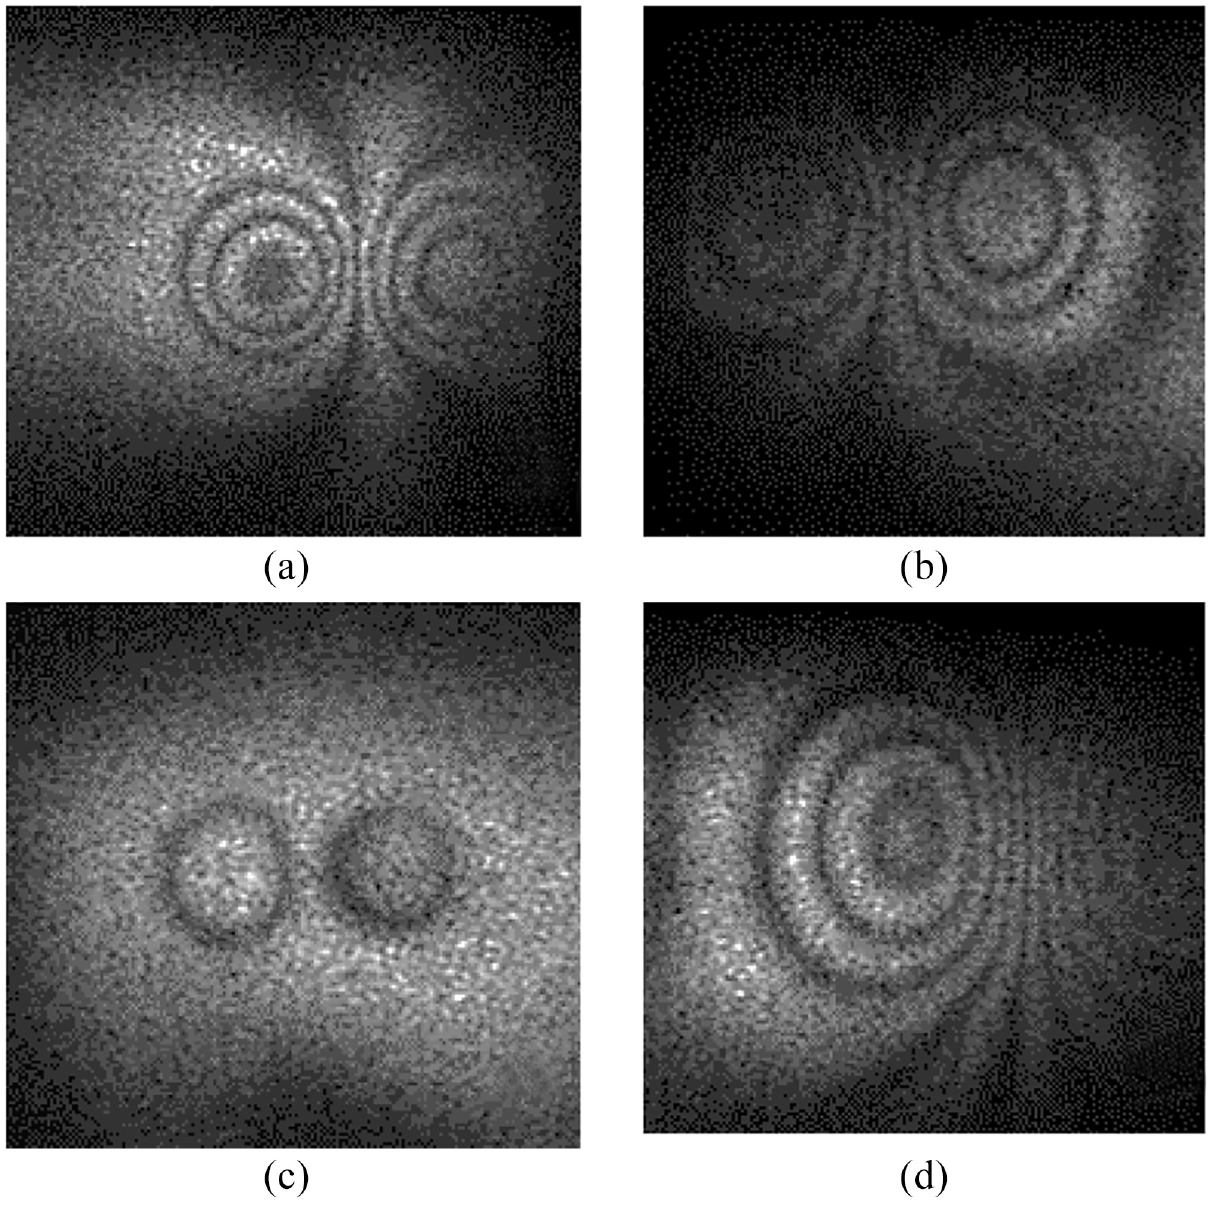
Detected defects on a piece of PVC foam with proposed vibratory loading: (a) detection of a defect with a diameter of 20 and a depth of 0.5 mm, (b) detection of a defect with a diameter of 25 and a depth of 0.5 mm, (c) detection of a defect with a diameter of 20 and a depth of 1 mm, and (d) detection of a defect with a diameter of 25 and a depth of 1 mm.
Another test sample made of Teflon was prepared to validate the repeatability of the test and study the effect of the specimen material. Defects with diameters of 20 and 25 mm at two depths of 0.5 and 1 mm have been created.
Figures 11 and 12 show the detected defects in the Teflon sample using thermal and vibratory loadings.
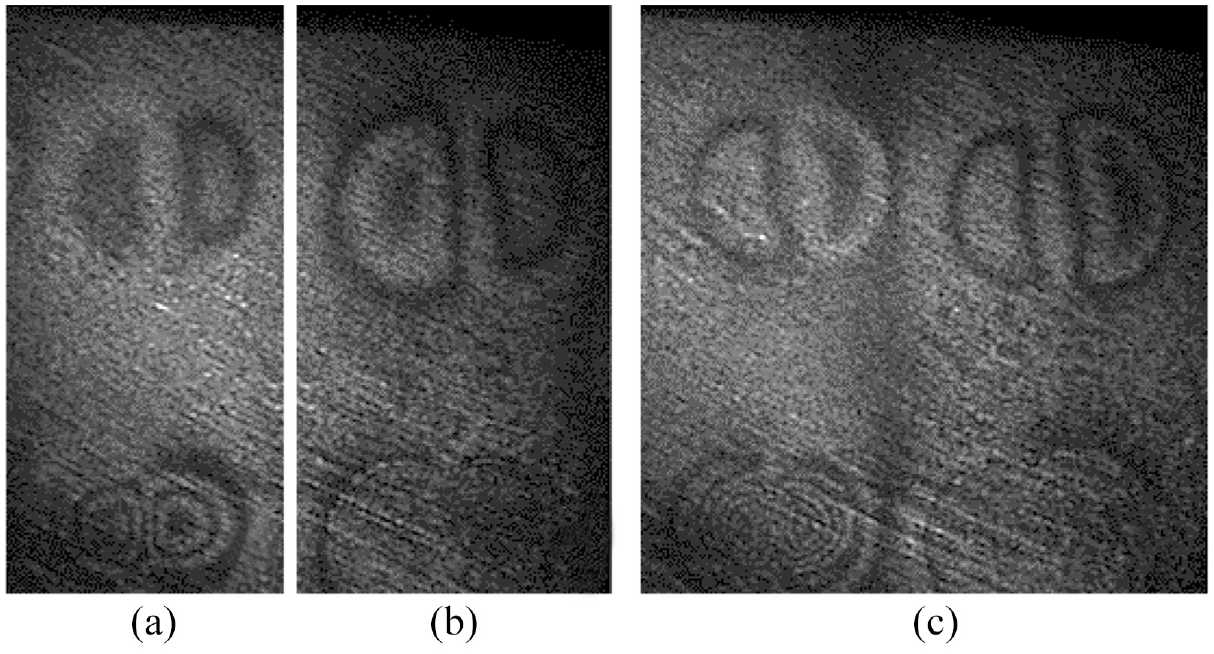
Detected defects on the Teflon piece with thermal loading: (a) detection of defects with a diameter of 20 mm,(b) detection of defects with a diameter of 25 mm, and (c) detection of four defects simultaneously.
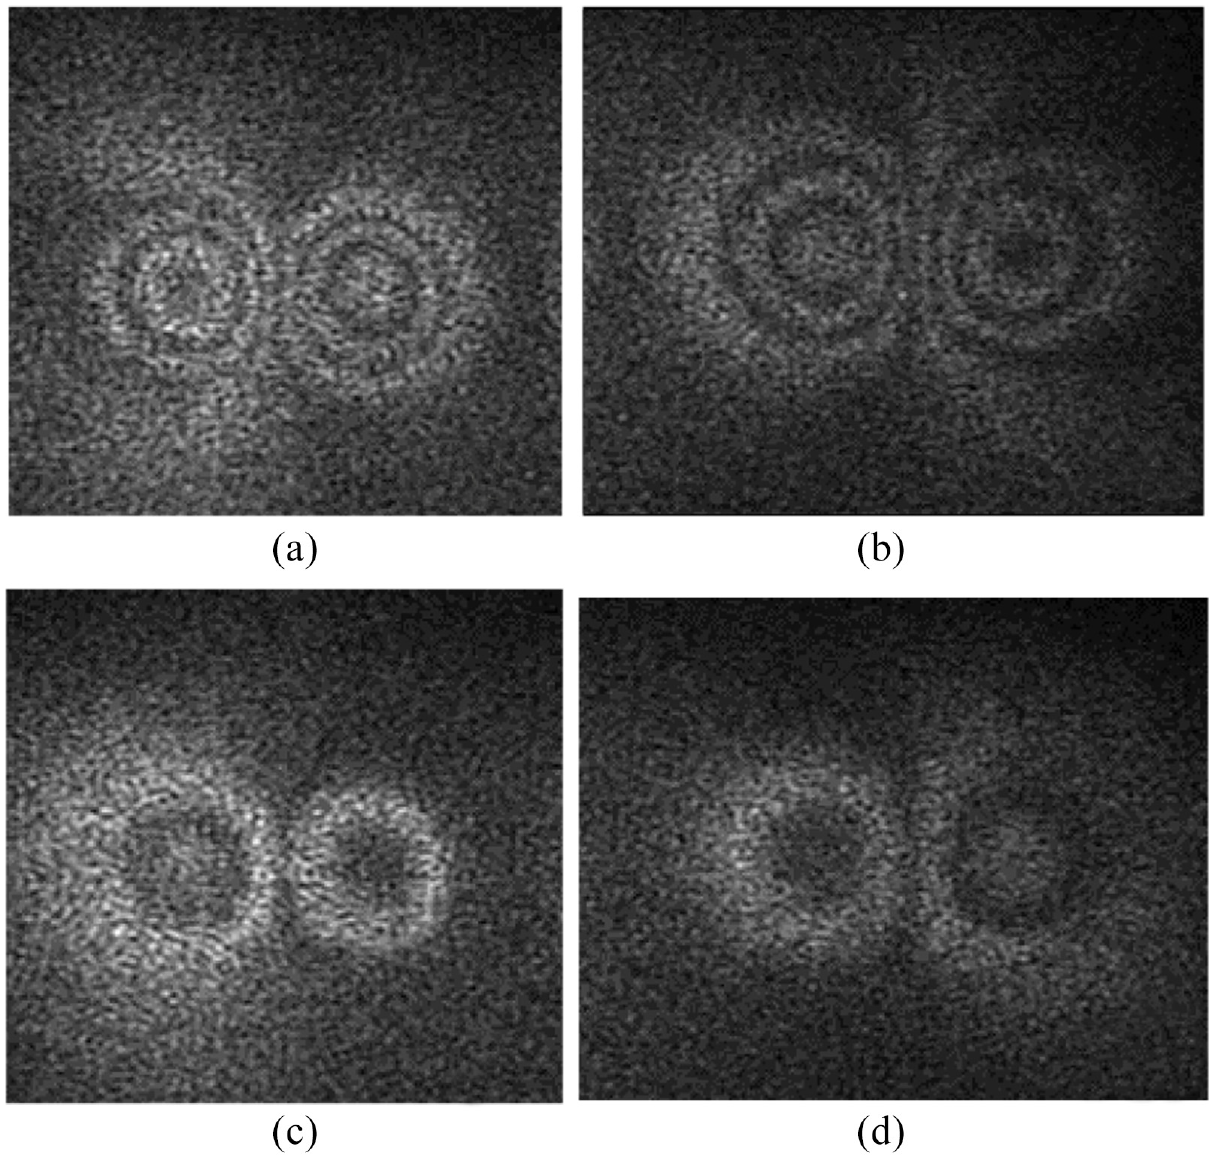
Detected defects on the Teflon piece with vibratory loading: (a,b) detection of defects with a diameter of 20 and 25 and 0.5 mm depth and (c,d) detection of defects with a diameter of 20 and 25 and 1 mm depth.
As it can be seen in Figures 10 (a,b,c and d) from the images above, shearography fringes created by vibratory loading have a relatively higher quality than those of thermal loading. In the traditional thermal loading method, the heat is applied to the surface of the piece causing thermal stress in the entire work piece, deforming both defected and intact areas. However, in the vibratory loading method, most of the heat is generated at the defects area only, and as a result, thermal stress and deformation do not occur in the entire piece.
Although vibratory loading method has advantages in creating higher quality fringes, however, it has some limitations as well. One the main limitations of the vibratory loading compared to the thermal loading is that we cannot detect all the defects at the same time. To detect each defect, one need to choose a frequency close to the defect resonance frequency. In thermal loading we can detect all the defects at the same time since the applied heat will create deformation in the entire piece simultaneously. When the exact dimensions of the piece and the defects are unknown, the experiment needs to be repeated with different frequencies to cover all the potential defects using vibratory loading method.
Conclusion
This paper investigates the effect of the heat generated at the defect area due to internal and external damping of the test piece in digital shearography method. For this purpose, first, the effect of different vibratory frequencies on the optimal amount of heat generated at the defect area has been investigated using finite element simulation. Experimental test samples with artificial defects with different dimensions and depths have been prepared. Using a thermography test, local heat at the defected area has been investigated. Then, vibratory and thermal loading methods are conducted to two Teflon and PVC samples and the results are compared. The results are summarized as follows:
In the vibratory loading, heat and the resulting deformation are created locally at the defect area, and only the shearography fringes related to the defect are formed. While in the thermal loading, unwanted fringes reduce the overall quality of the results caused by the fact that the entire body of the object is stressed by temperature.
The results indicate that the vibration technique does not create stress variations across the object. On the other hand, thermal loading causes temperature gradients across the object surface, which result in an uneven displacement gradient map across the object surface.
The proper frequency to generate optimal heat at the defect site in vibratory loading is equal to the defect’s resonant frequency. Finding a precise resonance frequency could be hard to achieve. However, a range of frequencies can be estimated by simulations.
As the amplitude of the vibratory waves increases, more displacement occurs at the defect area, which causes a rapid rise in the temperature and a reduction in the inspection time. However, over-increasing displacement will cause uncorrelated image and losses the fringes’ quality.
Simultaneously detecting of several defects with different diameters and depths using the vibratory loading method is hard or even impossible. Therefore, all possible defects can be identified by scanning the sample with different frequencies.
By combining the thermal and vibratory loadings, the advantages of both these shearography test methods can be achieved.
Footnotes
Declaration of conflicting interests
The author(s) declared no potential conflicts of interest with respect to the research, authorship, and/or publication of this article.
Funding
The author(s) received no financial support for the research, authorship, and/or publication of this article.