
Abstract
Prestressed ultrasonic peening (UP) is beneficial to enlarge bending deformation and improve surface properties of the plate compared to free UP process. The effects of processing parameters on variation of surface topography, surface roughness and hardness, residual stress distribution are analyzed. Then the microstructure and fatigue life with prestressed UP is studied. The results show that smaller surface roughness, larger surface hardness, larger and deeper compressive residual stress are generated in prestressed UP compared to free UP. Small prebending curvature radius and offset distance both contribute to enhancement of surface properties. Large firing pin velocity is beneficial for large surface hardness as well as larger and deeper compressive residual stress; nevertheless, it will increase the surface roughness. The UP process mainly improves the high cycle fatigue life of the material, while there is no difference of the low cycle fatigue life between the peened and un-peened samples. The high cycle fatigue life significantly increases at small stress after peening process and it can be further enhanced after prestressed UP. Deformation band with peened indentations are generated on the surface. With the experiments of distributions for hardness, yield stress and residual stress, the strengthening mechanism in peening process is discussed.
Keywords
Introduction
Ultrasonic peening (UP) is commonly used for the manufacture of wing panel and integral panel of the plane. 1 The UP device can be installed in the CNC machine, consisting of ultrasonic generator, ultrasonic transducer, amplitude transformer, tool head, and firing pin, as shown in Figure 1. The surface of the plate is subjected to severe impact; plastic deformation and compressive residual stress are generated on the surface, which significantly improves the mechanical properties. 2 Prestressed UP is made up of prebending process and ultrasonic peening process. The plate is subjected to elastic strain during the prebending process, which enlarges the bending deformation and the compressive residual stress compared to that in free UP.3,4

Diagram of UP process.
The effects of forming parameters on the bending behavior, 5 residual stress, 6 and fatigue behavior 7 were analyzed. Dutta 8 studied the mechanism of the grain refinement induced by UP process. The nano-structure at the surface of the plate was beneficial for the improvement of the corrosion behavior.9,10 Feng 11 studied the effects of the stress distribution, micro-hardness, and fold defects on the surface quality during UP. The relationship between surface roughness and hardness as well as the parameters were analyzed.12,13 Numerical models were established for surface analysis and the effect of particles reinforcement on the surface hardening was studied.14,15 The microstructure variation and its relation to the mechanical properties were discussed16,17. The microstructure evolution under different UP parameters had large effect on the hardness of the alloy 18 . The surface grain refinement induced by UP may increase fatigue life19,20. Prestressed UP was beneficial to further enlarge the bending strain compared to that in free UP. Xiao 21 and Miao 22 simulated the effect of prestress on the stress distribution. Zhang 23 found that the prebending stress contributed to larger deformation and higher surface hardness. Hu 24 studied the influence of the prestress on the bending deformation and residual stress of aluminum alloy 2024-T351 during laser peen forming.
The analysis of prestressed UP focused on the variation of bending deformation and residual stress. The effect of prebending curvature and other peening parameters on bending deformation and residual stress variations were analyzed. 25 However, the effects of prebending stress on surface properties were rarely published. Furthermore, comprehensive studies for surface properties and residual stress needed to be deeply studied. The strengthening mechanism of prestressed UP still needs to be revealed and the effects of forming parameters on the surface properties and fatigue performance should be further analyzed. In this study, prestressed and free UP experiments are conducted and effects of forming parameters on surface roughness and hardness, as well as residual stress are studied. Optimized parameters of prestressed UP are acquired and the experiments of fatigue performance and microstructure are conducted. Finally, the peening mechanism is discussed on the basis of the analysis of hardness, yield stress, and residual stress distribution through the thickness of the plate.
Materials and methods
Before peening process, an elastic bending moment is applied to the plate and different prebending curvatures can be achieved by the prebending molds in prestressed UP, as shown in Figure 2. While in free UP, the prebending process is removed. The feeding velocity of the machine tool is set as 3000 mm/min.
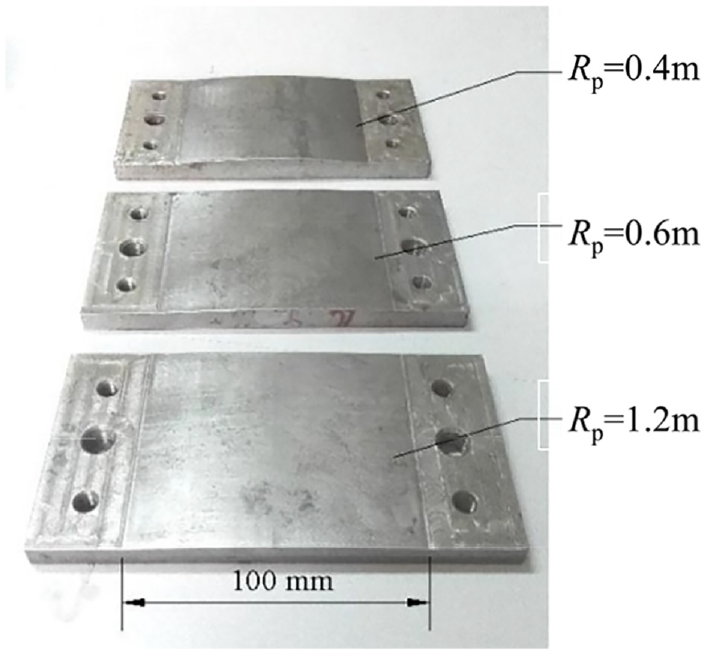
Prebending molds with different curvature radiuses.
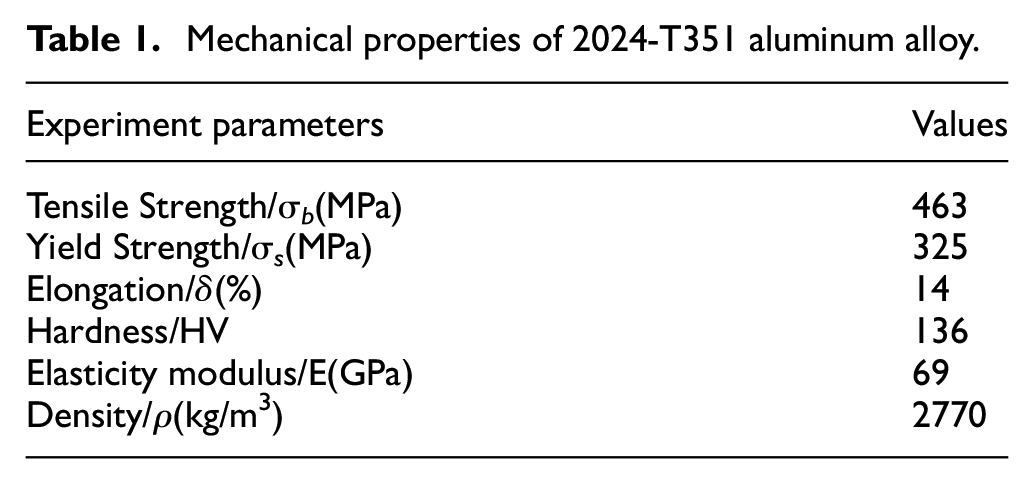
The impacting frequency is 20 KHz and it equals to the ultrasonic frequency. The maximum amplitude is 50 μm. The material of firing pin is 45 steel with a diameter of 3 mm. In this experiment, the mass of firing pin is 220 g. The material is smooth plate of aluminum alloy 2024-T351 and its mechanical properties are shown in Table 1. The size of the plate is 120 mm (length) × 50 mm (width) × 2.5 mm (thickness). The peening process is applied in the central zone with the area of 80 mm ×50 mm.
Mechanical properties of 2024-T351 aluminum alloy.
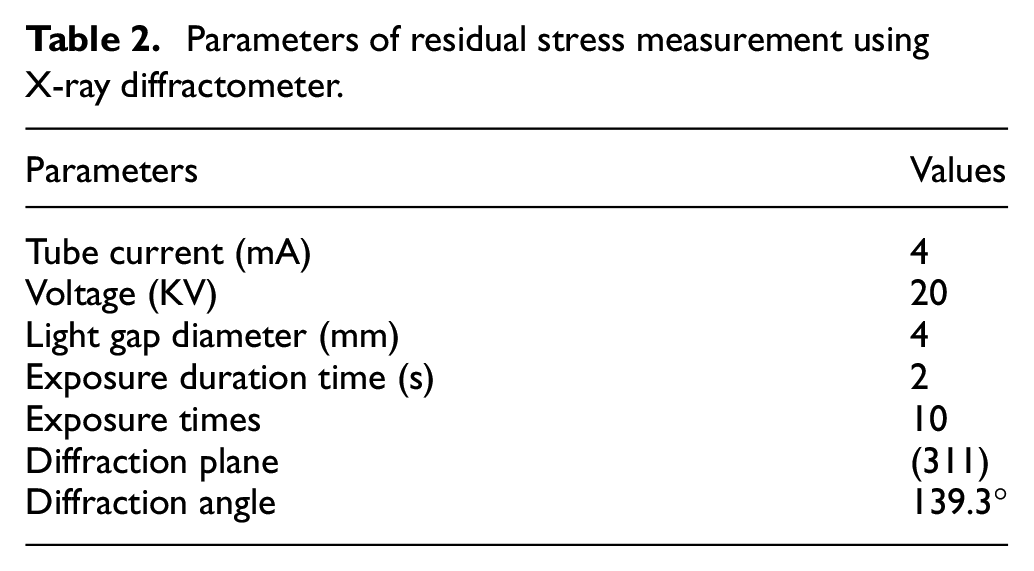
The surface topography of the plates after free UP and prestressed UP is observed. The surface roughness and hardness are analyzed. The hardness is measured with a load of 1 kg and holding time of 30 s. The distribution of the residual stress through the thickness of the plate is analyzed using the X-ray diffractometer with electrolytic polishing method. The parameters of residual stress measurement using X-ray diffractometer are shown in Table 2. To obtain the distribution of residual stress through the thickness of the plate, the removal thickness is set as 0.1 mm each time through adjustment of electrode voltage and etching time. The flow velocity of corrosion solution (ammonium chloride) is 4 L/h. The diameter and voltage of the electrode is 12 mm and 80–90 V, respectively. The corrosion time for removal of each layer is about 120–150 s, through which 0.1 mm thickness of metal can be removed.
Parameters of residual stress measurement usingX-ray diffractometer.
Three comparative fatigue test coupons (without peening, free UP and prestressed UP) are prepared, as shown in Figure 3. The effects of different stress on the fatigue life are studied. The fracture morphology of the fatigue test coupons is examined.
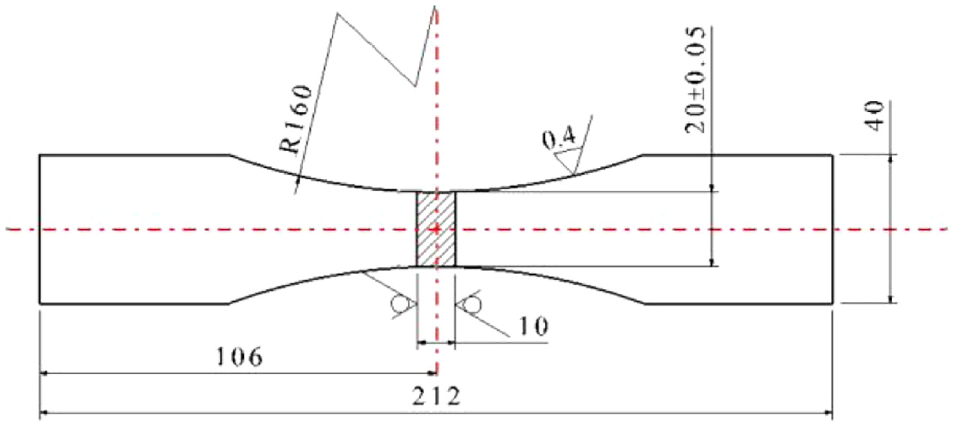
Dimensions of fatigue test coupon.
Table 3 shows the peening parameters. The variation of velocity is achieved by adjustable amplitude. The offset distance is defined as the move distance of the tool head between previous impact and current impact.
Experimental parameters for UP process.
Results and discussion
Surface topography
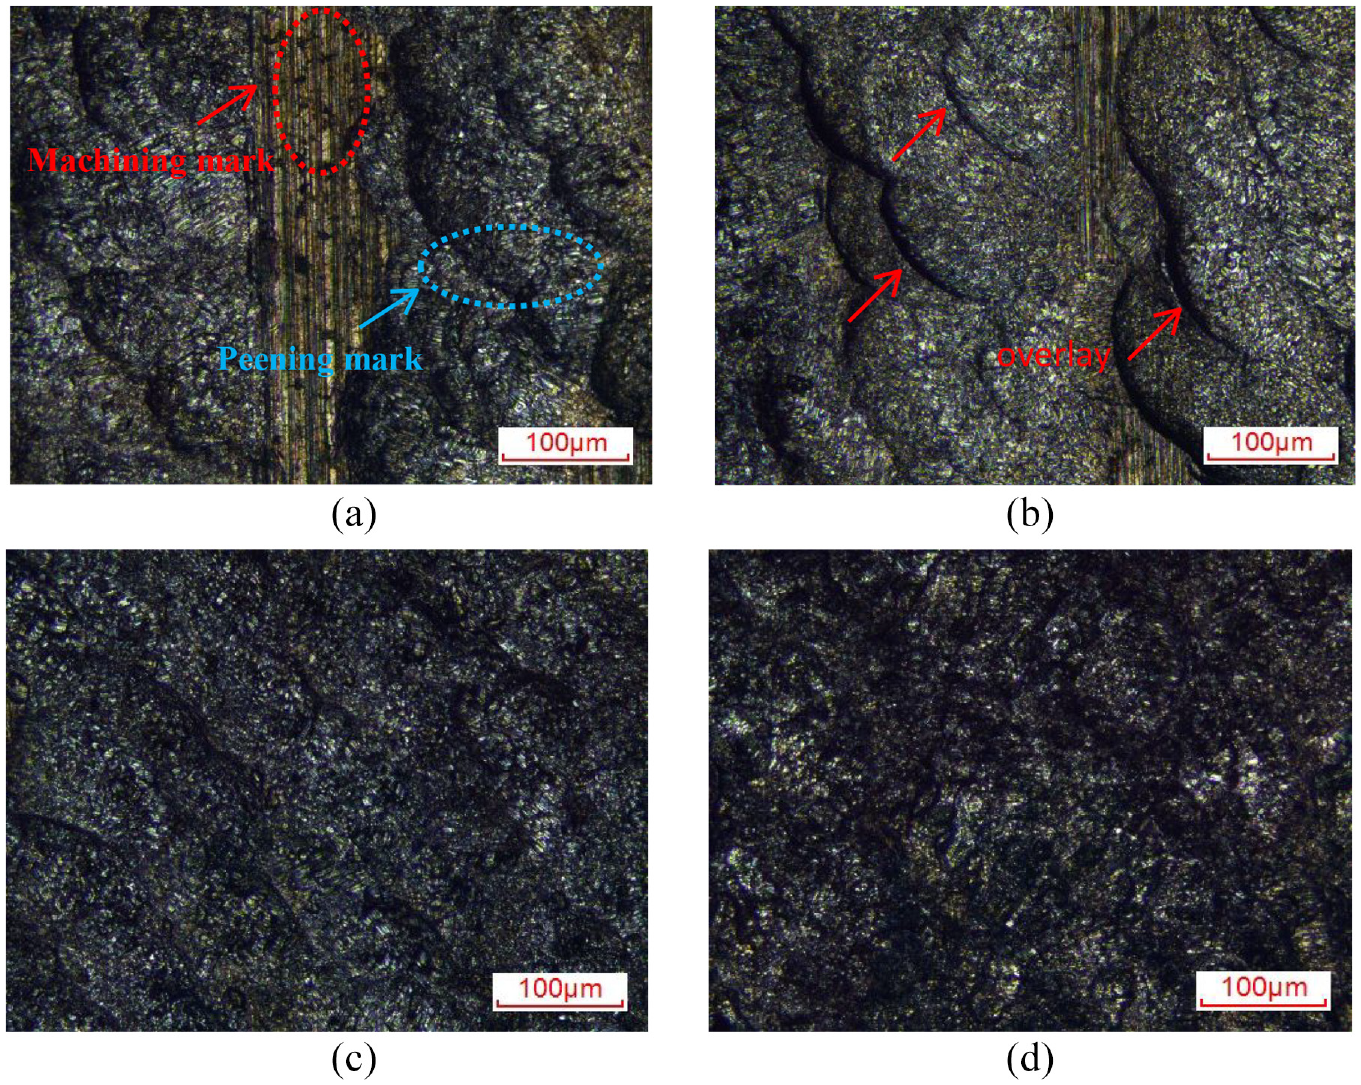
As shown in Figure 4, in free UP (Rp = ∞), isolated and large hemispheric pits can be clearly seen and the shape of these pits is nearly circular, which illustrates that the press between different hemispheric pits is small. Therefore, fluctuation between each pit is significant due to the independent peak and valley of each pit induced by the fierce impacts. However, in prestressed UP, some hemispheric pits are overlaid by other pits generated by the following impacts, and the overlay boundary between the pits can be seen obviously. The fluctuation between these pits is significantly decreased, indicating that press between hemispheric pits is much larger than that in free UP. Meanwhile, it is hardly to see a hemispheric pit with completely circular shape under small prebending curvature radius. It can be inferred that small prebending curvature radius contributes to the increase of deformation uniformity based on the distribution of indentations induced by the peening process. To quantitatively investigate the surface topography of the plates after free UP and prestressed UP, the geometry of the peening indentations, including the maximum, minimum, and average length of the peening indentations in the horizontal direction is calculated in Table 4. The maximum and minimum length of the peening indentations in free UP is 160.8and 101.7 μm, respectively, which decreases to 120.5 and 60.1 μm with Rp = 0.4 m. As a result, the average length of the peening indentations decreases with the decreased prebending curvature radius, illustrating that the size of peening indentations is much smaller in prestressed UP compared to that in free UP.
Effect of prebending curvature radius on surface topography after prestressed UP: (a) Rp = ∞, (b) Rp = 1.0 m, and(c) Rp = 0.4 m.
Geometry of the peening indentations after free UP and prestressed UP.
The band-like machining marks are not completely replaced by hemispheric pits under small firing pin velocity, as shown in Figure 5(a) and (b). The number of impact per second decreases with the decreased firing pin velocity as the feeding velocity of the machine tool is fixed. Meanwhile, the overlay boundary of the pits is not obvious as the independent peak and valley of each pit is small under small firing pin velocity. With the increase of firing pin velocity, the depth of the indentations is increased, which will increase the fluctuation between the hemispheric pits. The kinetic energy is related to the mass and velocity of the firing pin, which will increase with ascending firing pin velocity, resulting in larger deformation and more severe press between hemispheric pits. Additionally, the volume fraction of the peened zone increases with the increased firing pin velocity and the machining marks are completely replaced by the hemispheric pits under large firing pin velocity.
Effect of firing pin velocity on surface topography after prestressed UP: (a) V = 3.0 m/s, (b) V = 3.5 m/s, (c) V = 4.5 m/s, and (d) V = 5.0 m/s.
Alternating band-like machining marks and large hemispheric pits appear under large offset distance, as shown in Figure 6(a). The overlapping region is relatively small and the peaks and valleys of the hemispheric pits are quite obvious. With the decrease of offset distance, the overlapping region is increased and the band-like marks are completely replaced by hemispheric pits. The overlay boundary of the pits can be hardly seen with small offset distance, while it is quite obvious in Figure 6(a) and (b). The peening coverage is related to the offset distance and the number of impact per unit area significantly increases under small offset distance. The latter peening pits are generated on the previous hemispheric pits, showing obvious press between different hemispheric pits. As a result, the fluctuation between hemispheric pits is decreased by multiple impacts at small offset distance, which results in smoother surface.
Effect of offset distance on surface topography after prestressed UP: (a) d = 1.4 mm, (b) d = 1.2 mm, (c) d = 0.8 mm, and(d) d = 0.4 mm.
Surface roughness
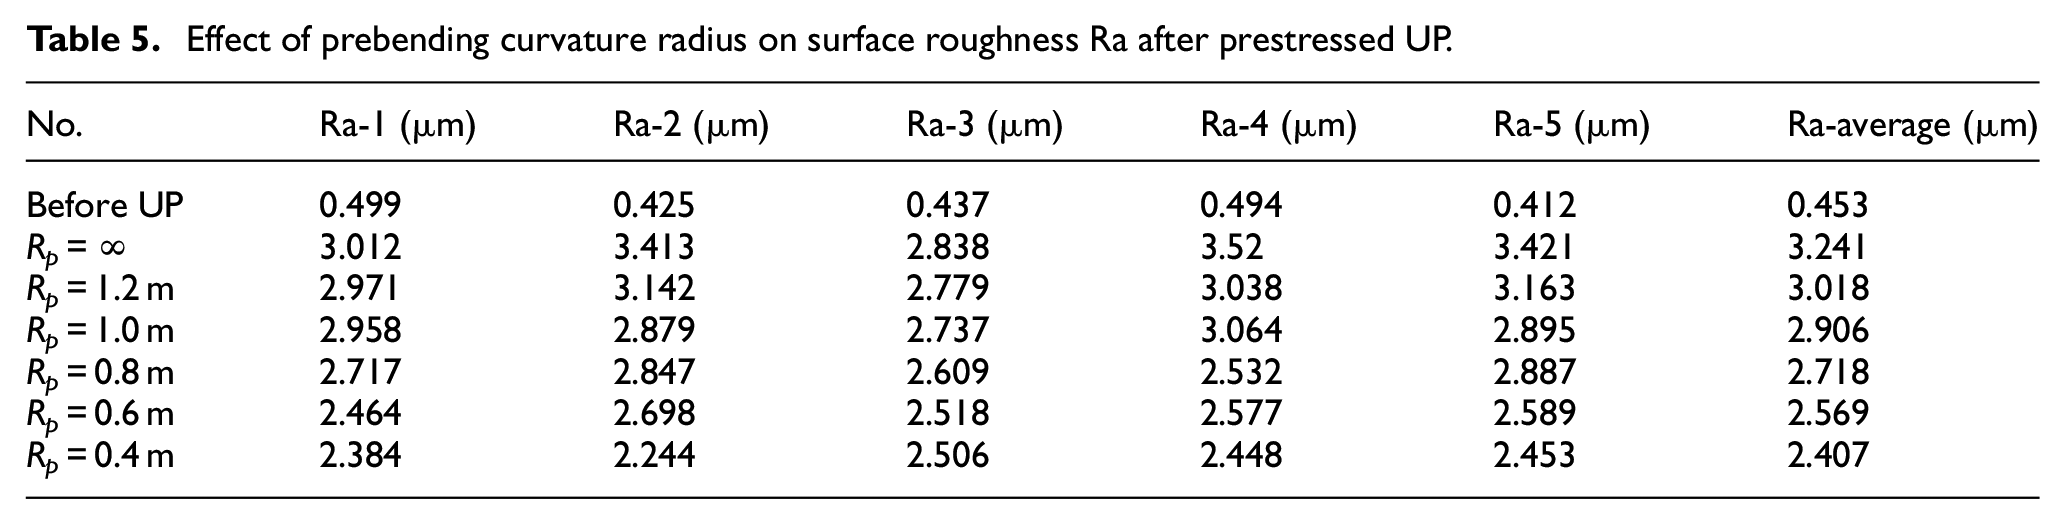
The surface roughness is quite small before UP, while it increases sharply after UP, as shown in Table 5. The value of surface roughness in free UP is over 7 times as large as that before peening. There are two stages for the variation of surface roughness during peening process: first, large number of isolated and hemispheric pits is generated on the peened surface and it results in obvious peak and valley for each pit, significantly increasing the roughness. Then, as the hemispheric pits will be overlaid by the pits induced by the following impacts, the increase rate of surface roughness will slow down and even the value of surface roughness may decrease. With decrease of prebending curvature radius, the surface roughness is decreased, indicating that the prestressed UP is beneficial to reduce the surface roughness compared to that in free UP. The domain size decreases with ascending prebending stress, while the microstrain increases during the prebending process 26 and the following peening process, which obviously increases the strain uniformity on the surface of the plate. Therefore, the bending strain induced by the prebending moment in prebending process of prestressed UP contributes to the sufficient and uniform strain distribution, thus decreasing the surface roughness. During the peening process, the stress caused by peening impacts at most positions in the peening zone will quickly exceed the yield stress of the material. Therefore, small fluctuation of hemispheric pits and small surface roughness can be obtained in prestressed UP. The value at Rp = 0.4 m is 74% of that in free UP, illustrating that prestressed UP plays a vital role in decreasing the surface roughness.
Effect of prebending curvature radius on surface roughness Ra after prestressed UP.
There is linear relationship between the surface roughness and the firing pin velocity, as shown in Figure 7(a). The value of surface roughness at V = 5.0 m/s is about four times larger than that at V = 3.0 m/s, indicating that the firing pin velocity has a great influence on the surface roughness. The kinetic energy and impact force both increase with ascending firing pin velocity; as a result, larger, and deeper pits are induced on the peened surface. For a given offset distance, the number of impact per unit area is fixed; large depth difference between pits will be induced by large firing pin velocity, which enlarges the surface roughness. Additionally, as the feed velocity of the peening machine is fixed, large firing pin velocity only causes deeper peened pits, resulting in large surface roughness.
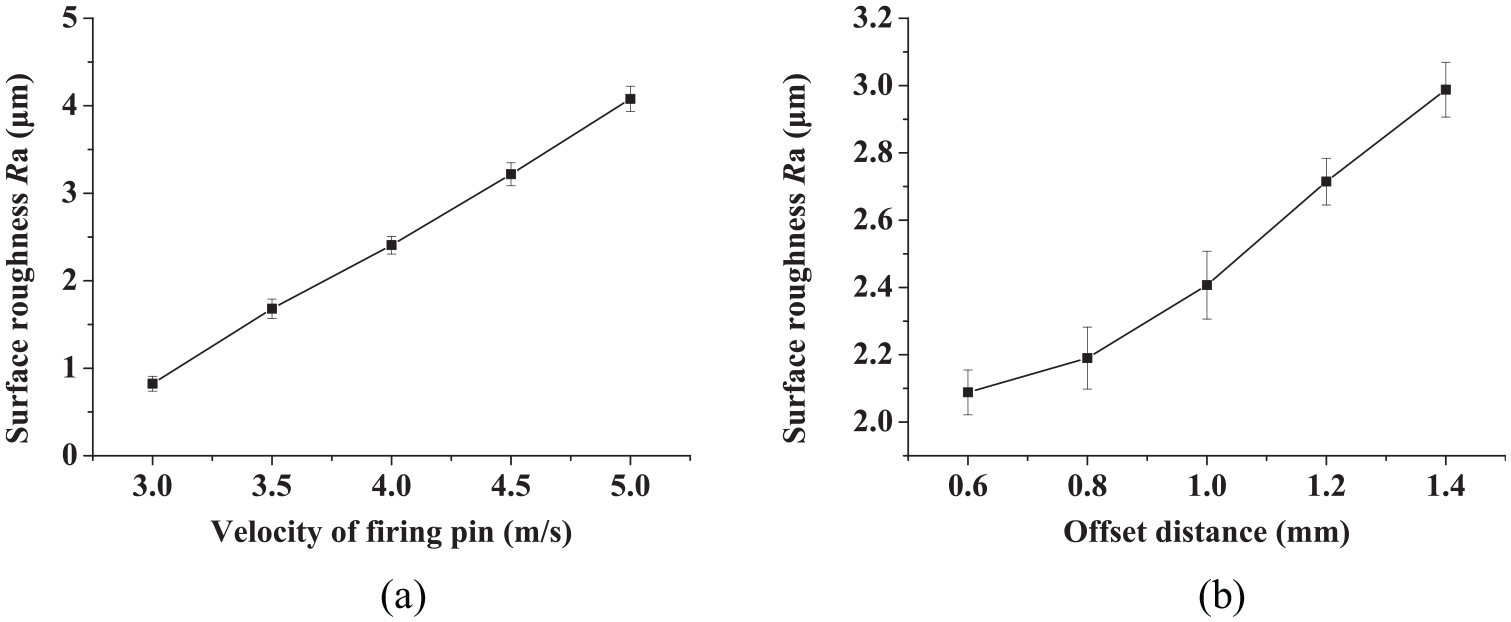
Effect of (a) firing pin velocity and (b) offset distance on surface roughness after prestressed UP.
The surface roughness almost decreases linearly with descending offset distance. With decrease of offset distance, the impact times of per unit area on the surface is increased. The same position at the surface of the plate may be suffered to several impact times, so the hemispheric pits formed due to the previous impact will be compressed in the latter impact times. The independent peak and valley of each pit is significantly decreased. As a result, the overlapping region obviously increases with decreased offset distance, resulting in the decreased fluctuation between pits.
Surface hardness
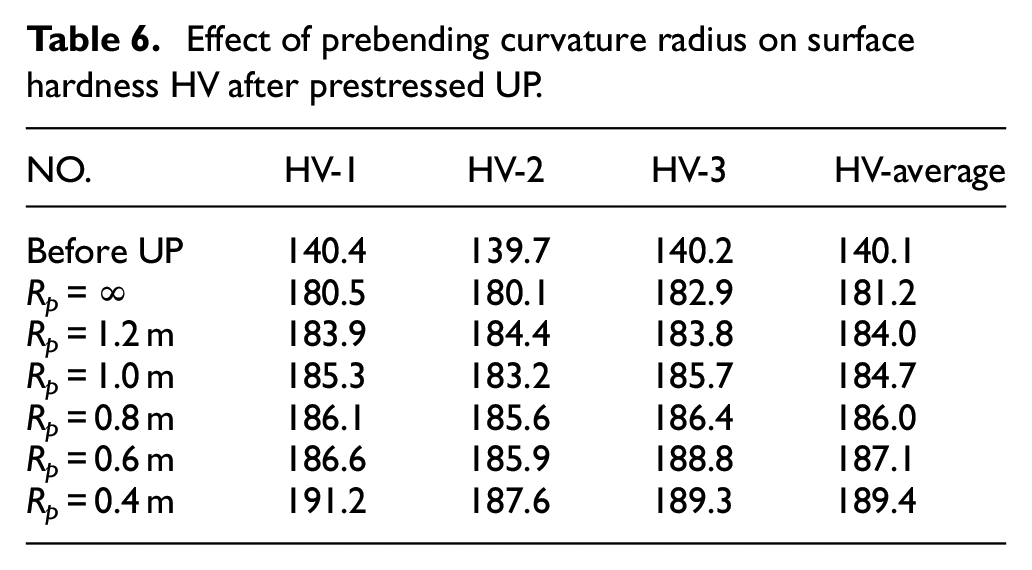
The surface hardness increases sharply after UP process because the strain induced by peening process will significantly increase the dislocation density inside the material, 27 which will enlarge the surface hardness, as shown in Table 6. The surface hardness in prestressed UP increases slightly with descending prebending curvature radius. Meanwhile, the surface hardness in prestressed UP is larger than that in free UP. Bending deformation and dislocation density induced by the prebending moment during prestressed UP are larger than them in free UP, which can significantly enlarge the surface hardness. The elastic strain of prebending process contributes greatly to the increase of plastic deformation during peening process in prestressed UP, and it increases with increased prebending moment. Meanwhile, the prestressed tensile stress induced by the prebending moment before peening process is beneficial for grain refinement as well as large and deep residual stress distribution, which contributes greatly to the increase of surface hardness. More grain boundaries resulting from grain refinement during peening process provide obstacles for the dislocation movement of slipping and climbing. Therefore, more obvious grain refinement in prestressed UP plays significant role in the material strengthening and the increase of surface hardness. The similar results were also found in other published articles. Wang 28 concluded that both grain refinement and high dislocation density induced by UP process contributed to a significant increase in the hardness and yield strength. The multiple peening would promote the microstructure uniformity of the surface and increase the number of grain boundaries. They can act as strong barriers to the dislocation motions, leading to the increase of strength of sample. The multiple impingements during UP resulted in the large number of dislocation pile ups, sub-boundaries, sub-grains, and eventually nano-grains, leading to the increase in micro-hardness. 29 The dominating strengthening mechanisms in the UP processed sample were supposed to be grain boundary strengthening and dislocation strengthening, which are linearly additive. The grain boundary strengthening and dislocation strengthening were responsible for the prominent enhancement of hardness in the UP processed sample. 30
Effect of prebending curvature radius on surface hardness HV after prestressed UP.
The surface hardness increases with ascending firing pin velocity. The value of surface hardness at V = 3.0 m/s is 27.5% larger than that before UP and this value turns to 45.2% at V = 5.0 m/s. Under the given diameter of the firing pin, the kinetic energy transferred to the plate increases with ascending firing pin velocity. The impact force will significantly increase and the plastic deformation generated during peening process also obviously increases. The increasing rate of dislocation density is related to the strain rate based on Laasraoui-Jonas dislocation density model. The larger strain rate induced by large firing pin velocity will obviously increase the dislocation density and its increasing rate. The working hardening increases with ascending firing pin velocity, which enlarges the dislocation density and then increases the surface hardness.
The surface hardness increases with descending offset distance, as shown in Figure 8(b). With decrease of offset distance, the same position on the surface of the plate will be subject to more frequent impacts. The plastic deformation and dislocation density will obviously increase, enhancing the extent of work hardening. Meanwhile, the grain size can be further decreased under multiple impacts. As shown in Yang’s results, 27 equiaxed grains with a size of 100 m were observed before UP process, while fine grains were observed in surface regions of UP-treated samples and some grains were slightly distorted and elongated. The size of fined grains was less than 50 m. When the peening needle velocity decreased from 2.0 to 1.0 m/min, the fined-grain region enlarged in depth and more remarkable distortion of grains was observed. As the dislocation movement is difficult to go through the grain boundaries, which will increase the strength and the surface hardness. Larger deformation and finer grain induced by smaller offset distance on the surface are both beneficial to enlarge the surface hardness.
Effect of (a) firing pin velocity and (b) offset distance on surface hardness after prestressed UP.
Residual stress
UP is beneficial for the enhancement of fatigue life due to the significant compressive residual stress on the surface. 25 Four parameters are adopted to describe the distribution of residual stress in UP process: surface compressive residual stress (σ0), maximum compressive residual stress (σm), the total depth of compressive residual stress (Z0) and the depth corresponding to the maximum compressive residual stress (Zm).
UP induces “√” shape distribution of the residual stress and it changes from compressive stress on the surface to tensile stress at a certain height of the plate. As shown in Figure 9(a), the prestressed UP shows larger values of σ0 and σm compared to them in free UP, and their values also increase with decreased prebending curvature radius. Additionally, the prestressed UP induces a larger depth of compressive residual stress, and it increases from 0.77 mm in free UP to 0.9 mm with Rp = 0.4 m in prestressed UP. It should be noted that the value of Zm hardly changes with variation of prebending curvature radius, and it nearly locates at the depth of 0.3 mm. Unlike free UP, there is a prebending process in prestressed UP and the elastic bending deformation is much larger than that in free UP. Additionally, the tensile stress generated in the prebending process is beneficial for the improvement of strain uniformity during the followed peening process. The elastic strain will be recovered when removing the clamps after the peening process. As a result, larger elastic strain and more uniform strain in prestressed UP contribute to the larger and deeper compressive residual stress.
Effect of: (a) prenbending curvature radius, (b) firing pin velocity, and (c) offset distance on residual stress distribution.
Similar to the variation of prebending curvature radius, values of σ0, σm, and Z0 increase with ascending firing pin velocity, as shown in Figure 9(b). The value of σm at V = 5.0 m/s is 36.8% larger than that at V = 3.0 m/s; meanwhile, the value of Z0 increases from 0.84 mm to 0.95 mm. However, different to the effect of the prebending curvature radius, the value of Zm is slightly increased with ascending firing pin velocity, which indicates that large firing pin velocity is beneficial to larger and deeper compressive residual stress. The values of σ0, σm, and Z0 increase with decreased offset distance, nevertheless, the increasing rate is much smaller than that during varied prebending curvature radius or firing pin velocity. The value of Zm varies little with changes of offset distance. By taking comprehensive consideration of surface properties, the optimized parameters during prestressed UP are: prebending curvature radius 0.4 m, firing pin velocity 3.5–4 m/s and offset distance 0.6–0.8 mm.
Microstructure
The typical banded microstructure of the rolled plate without peening can be seen in Figure 10(a). The length and width of each banded grains can be obtained with the software of Image J. The average length-width ratio is 10.4 ± 2.7, indicating that the elongated grains resulting from the rolling process are the typical structure before peening process. Many precipitated particles (black dots) are generated in the grain interiors and grain boundaries, which are the strengthening precipitates generated in the heat treatment. These particles have pinning effect on the grains slipping and they will impede the movement of dislocation, thus significantly enhancing the strength of the material. Some peening indentations are generated on the peening surface of the plate after UP, indicating that obvious strain is induced by the impacts from the firing pin. The thickness of the banded microstructure is about 100 μm before peening and it decreases to 50 μm after UP. Despite the indistinct grain boundary after UP process, the plastic flow of the metal around the peened indentations is quite obvious and the deformation band can be seen beneath the peened indentations. However, there are no distinct fragmentized grains at the peened surface of the plate during UP process. Meanwhile, the microstructure varies from severely deformed layer at peened surface to banded structure with increased depth. Nevertheless, the depth of deformed band is small due to the limited peening depth during UP. Although there are peened indentations at the peened surface, the surface roughness is not quite large as the repeated impacts from the firing pin may decrease the fluctuation between each peened indentation. The dislocation density inside the material is significantly increased after UP process as the lattice distortion is enhanced during peening impacts; meanwhile, the appearance of slip band will contribute to the formation of sub-grains and grain refinement. A large value of residual stress was induced by the UP process, which led to a small domain size, an important lattice distortion and a high dislocation density. The domain size and lattice distortion degree of the deformation layer can be quantitatively calculated by the modified Williamson-Hall method with a uniform deformation energy density model.31,32 Liu 33 analyzed the domain size and microstrain of the peened material with modified Williamson-Hall method and concluded that the uniform density of deformation energy caused the lattice distortion.
Microstructure variation of the plate under: (a) before peening and (b) after peening.
Fatigue performance
In Figure 11, there is no obvious difference of the fatigue life between peened and unpeened samples when the maximum stress is larger than 210 MPa, indicating that the UP process has little effect on the low cycle fatigue performance of the plate. The fatigue life increases significantly with decreased applied stress and it can be seen that the fatigue life of ultrasonic peened samples is much larger than that of samples without peening. Meanwhile, the fatigue life of samples after prestressed UP (Rp = 0.4 m) can be further increased compared to that with free UP. It shows that the UP process mainly affects the high cycle fatigue performance of the material and the difference of fatigue life between peened samples and without peened samples is increased with decrease of applied stress. The fatigue life is mainly related to the surface roughness, the formation of crack source and its propagation during the fatigue test. The reasons for improvement of fatigue life during UP process can be described as follows: grain refinement resulting from the severe impacts during UP process will increase the volume fraction of grain boundaries, thus enhancing the resistance for the crack propagation. Meanwhile, the dislocation density inside the material is significantly increased, dislocation loop and tangled dislocation may be generated during UP process, which will impede the dislocation slip and then decrease the growth rate of fatigue crack. A large number of dislocation cells with a high density of dislocation tangles were identified in the grains after UP process. 28 From the TEM microstructure analysis, it was noted that dislocation structures were predominant in ultrasonic peened samples. Meanwhile, some nanometer-scale mechanical twins can also be observed and they were across the dislocation cells. The size and number of nano-twins were small as compared with that of the dislocation cells. Meanwhile, developed dislocation structure including dislocation walls, pile-up of dislocations and sub-grains were observed in UP-treated specimen, 27 which illustrates that the UP process obviously increases the dislocation density inside the material. Thirdly, the crack source is usually originated at the surface of the plate due to the stress concentration resulting from surface roughness during peening process, nevertheless, the induced surface compressive residual stress plays a vital role in restraint of crack formation and propagation and even for the closure of initial crack. The compressive residual stress was beneficial for the crack closure, which was proved by the published articles. Jiang 34 investigated the effects of weld microstructure and residual stress distribution on the fatigue crack growth rate of stainless steel narrow gap welds, founding that the fatigue crack growth rates were several times greater in the inner weld with large tensile stress than the outer weld region with compressive stress. Pouget 35 analyzed the fatigue crack propagation and the induced residual stresses in friction stir welded AA2050. The compressive residual stresses were present in the vicinity of the weld, leading to crack closure and a decrease in the fatigue crack growth rate as the crack approaches the weld.
Fatigue performance under different conditions.
Figure 12 shows the fracture morphology after the fatigue test. Large number of dimples accompanied by some large and deep dimples (marked with yellow arrow) is generated for the samples without peening, indicating good ductility and transcrystalline fracture. It can be seen that many small cracks appear around the dimples, which will decrease the fatigue life of the material. Smaller and shallower dimples appear after UP process due to the severe impacts; meanwhile, flat surface with brittle characteristic can be seen for peened samples. Therefore, the ductility for peened samples is much smaller than that without peening. The quantity of crack for free UP and prestressed UP decreases compared to that without peening, which is beneficial for the improvement of fatigue life after peening process.
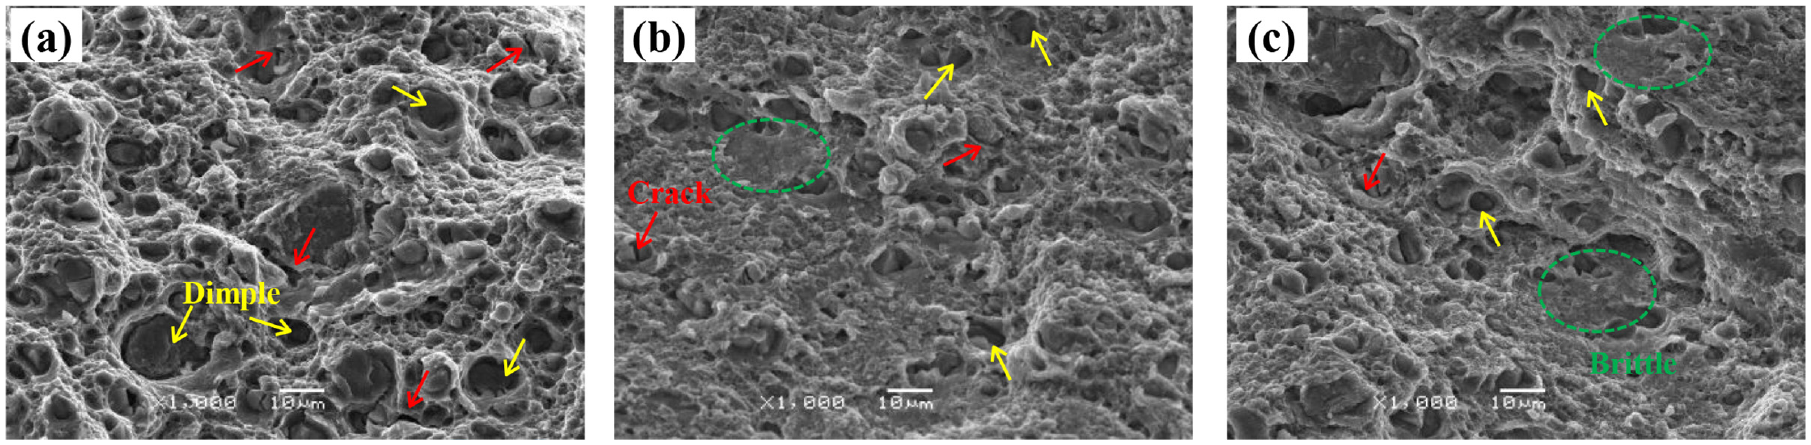
Fracture morphology under: (a) before peening, (b) after free UP, and (c) after prestressed UP at Rp = 0.4 m.
Strengthening mechanism
UP is a kind of surface treatment and the peening depth as well as the peening mechanism is quite crucial for the mechanical properties of the plate. Besides the surface hardness, the hardness distribution through the thickness direction of the plate is measured with an increment of 0.1 mm, as shown in Figure 13(a). To avoid the overlapping region between adjacent indentations, there is a horizontal distance. The hardness decreases with ascending depth of the plate both for free and prestressed UP process. The value of hardness at depth of 0.6 mm in free UP is equal to that without peening process, which is defined as the peening depth. The peening depth of prestressed UP is larger than that in free UP, indicating that applied prestress during the prebending process is beneficial for enhancement of surface deformation and peening depth. Meanwhile, it can also be seen that the hardness in prestressed UP is larger than that in free UP along the depth of the plate. However, the hardness difference between two UP processes is quite large at surface and it decreases with the increased depth. Peening is a surface treatment and only the material with a certain thickness of the plate can be strengthened.
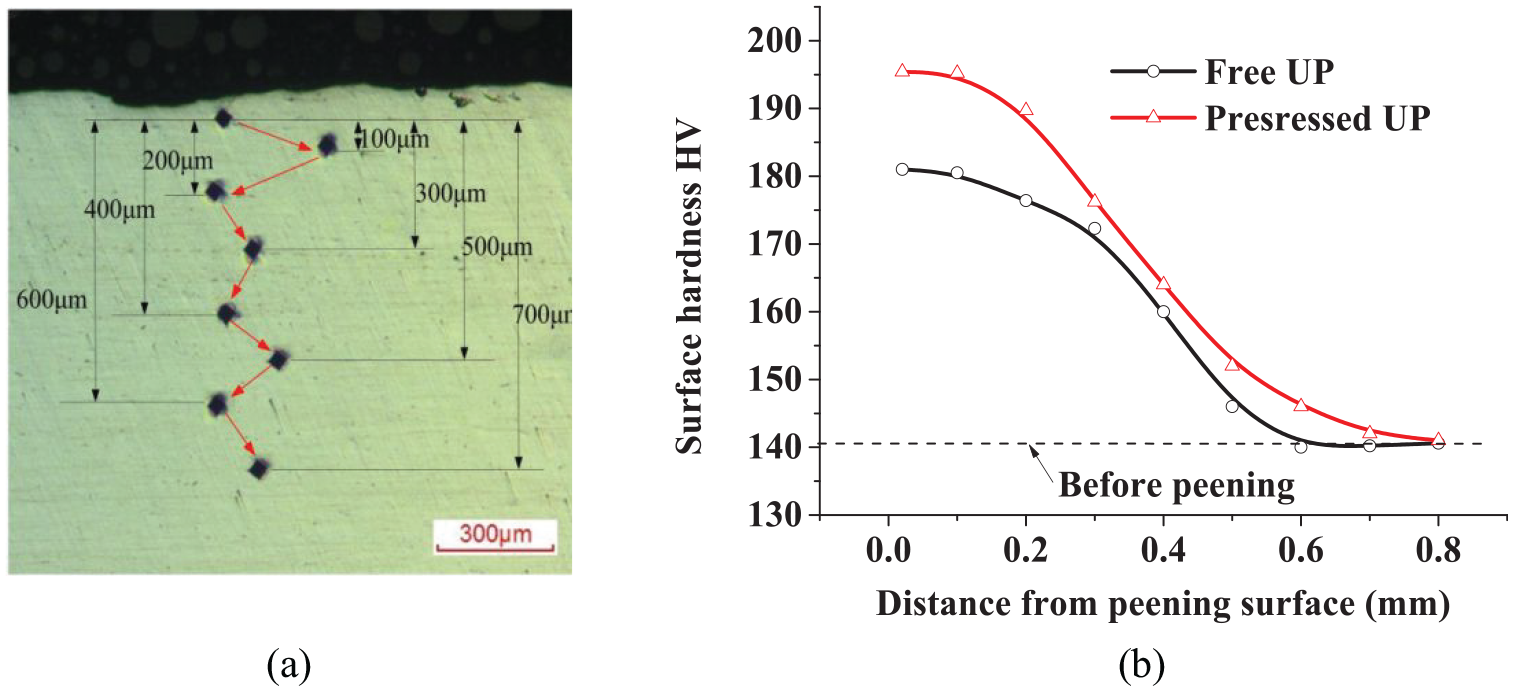
(a) Schematic diagram of hardness measurement and (b) hardness distribution after free and prestressed UP.
It is known that the yield stress of the material is related to the hardness. Nobre 34 established the linear relationship between yield stress and hardness increment, as shown in equation(1). The yield stress in each layer can be calculated according to the normalized variation of the hardness. Figure 14 shows the calculated yield stress and the experimental residual stress distribution. The yield stress distribution is similar to the hardness distribution, showing limited peening depth. The induced deformation from peening process will increase the dislocation density inside the material, the tangled dislocation or dislocation cells will impede the dislocation movement and then increase the yield strength. The absolute value of residual stress is smaller than the yield strength through all the thickness. The local yield strength induced by peening process is obtained, showing the limited strengthening depth and uneven distribution through the thickness direction of the plate.
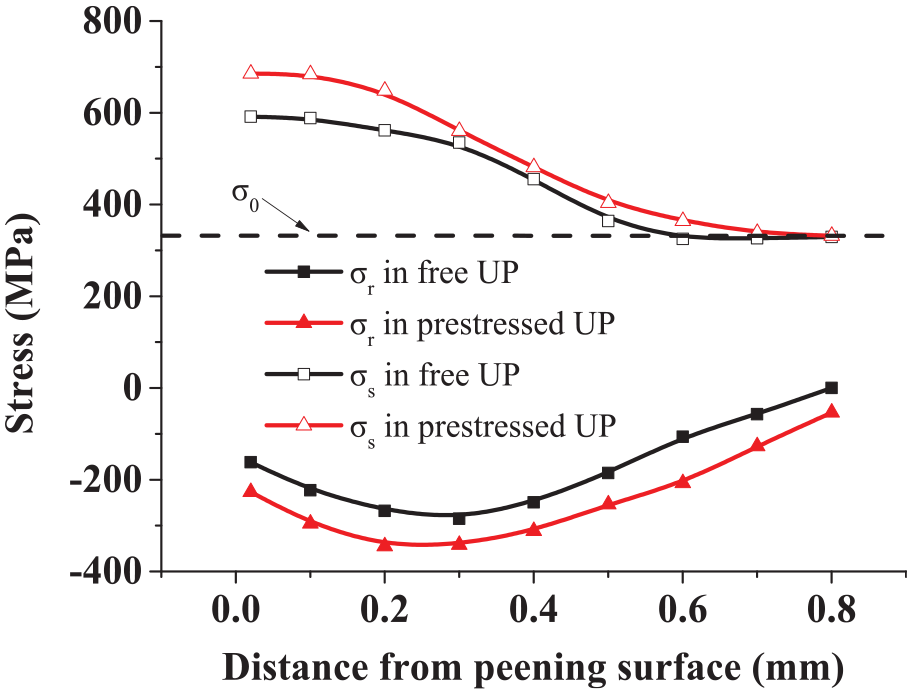
Yield stress σs and residual stress σr distribution after free and prestressed UP.
The generation of residual stress can be explained with the following reasons: first, elastic-plastic deformation is induced on the peened surface of the plate under the severe impacts from firing pin during UP process. A part of the elastic strain is recovered after removal of all clamps of the plate, 35 which causes the residual stress inside the material. Secondly, the impact load with high frequency will induce non-uniform deformation, resulting in serious crystal defects, such as distortion of atomic lattice and high density of dislocation, which is shown as residual stress at the macro level. Different to the hardness distribution, the maximum compressive residual stress locates at depth about 0.2 mm and it is larger than the value on the peened surface. During peening process, the maximum shear stress was generated at sub-surface instead of the surface layer 36 as the contact Hertz stress plays a vital role in the deformation of the plate. Additionally, adiabatic shear effect usually appears on the peened surface of the plate, especially under high frequency impacts or large deformation area under high velocity. As the strain rate is quite large under high frequency peening process, the heat induced by deformation energy cannot be transferred into the plate or the environment immediately. As a result, the stress relaxation is more likely to be generated on the peened surface of the plate, which decreases the value of residual stress after peening process. The peened plate showed a gradient microstructure along the depth direction due to the gradient nature of plastic strain and flow stress, and it will also be affected by the plastic strain rate.37,38 The top surface was heavily deformed and endured the highest strain rate and flow stress. 39 The original coarse grains at the top surface were refined by UP because of the repeatable high-frequency impact process. Based on Saleh’s results, 36 the final stress state was a result of a very fine balance between: (a) dynamic strengthening and the thermal softening of the aluminum alloy and (b) the kinetic impact or shot peening effect. The thermal softening reduced the flow stress of the material and overcome the strain and strain-rate hardening.40,41 Therefore, the larger strain rate in the peened surface induced more heat, the thermal softening will reduce the flow stress and the residual stress.
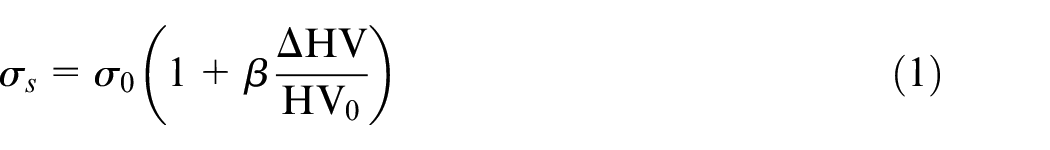
where σs is yield stress after peening, σ0 and HV0 are initial yield stress and hardness without peening, β is the constant of scale factor and is set as 2.8 for most metal alloy, ΔHV is hardness increment.
Conclusions
Smaller roughness, larger hardness, and compressive residual stress are obtained in prestressed UP compared to free UP. The change rate increases with descending prebending curvature radius.
Large firing pin velocity and small offset distance increase the surface hardness and the depth of compressive residual stress; however, large firing pin velocity will increase the surface roughness.
Both free and prestressed peening improves the high cycle fatigue performance, while they have little effect in the low cycle fatigue performance. Prestressed UP shows larger high cycle fatigue life than that in free UP.
The strengthening mechanism of peening is revealed, showing limited strengthened depth and uneven distribution of the strengths.
Footnotes
Declaration of conflicting interests
The author(s) declared no potential conflicts of interest with respect to the research, authorship, and/or publication of this article.
Funding
The author(s) disclosed receipt of the following financial support for the research, authorship, and/or publication of this article: This work was supported by State Key Laboratory for High Performance Complex Manufacturing, Central South University (ZZYJKT 2021-05).