
Abstract
Blades are the core component of aero-engines. The complexity of aero-engine blades deformation after multi-axis milling causes poor consistency in batch blades. In turn, the poor consistency of blades affects the aerodynamic performance of an aero-engine. Hence it is critical to ensure the consistency of blades before precise machining. This article proposes a clustering-based blade grouping strategy aiming to improve the consistency of the same group of blades automatically and efficiently. First, the feature vector of the blade and the distance between two blade surfaces are defined. Then the K-medoids clustering algorithm is used to group the blades. According to the maximum allowable distance between the blade surfaces and the Ray-Turi index, the ideal number of clusters, that is the number of groups, is determined. Finally, the clustering center of each cluster is selected as the blade processing model of each group. The experiment for aero-engine blade grouping and machining was performed to demonstrate the effectiveness of the proposed method and the results show that it can improve the consistency of the blades in each group. The geometric contour differences of the blades in the group are not more than 0.02 mm, which can satisfy the requirements of the following precise array machining.
Introduction
Blades are the core components of aero-engine, the performance of which is determined by the flow of adjacent blades. Each engine has hundreds of blades, and their manufacturing workload accounts for about 25%–40% of the entire engine’s manufacturing process.1,2 The production schedule of blades directly combines to produce the whole engine, and the processing efficiency is important. There are many blade processing methods and the most commonly used is multi-axis CNC machining.3–5 The common CNC machining tool can only process one blade at a time and its processing efficiency is low. While the multi-spindle blade CNC machining technology can process multiple blades at the same time, it is difficult to ensure the machining consistency and accuracy.6,7 The Germany Company STAMA 8 has built the world’s first double spindles machining center, able to save 40% of the power consumption and lessen the processing time compared with the single spindle machining center. For the cost of machining, STAMA pointed out the least cost occurs when four pieces are assembled at the same time based on the research of RWTH Aachen University. Each spindle processes two pieces in a cycle, and the cost per unit can be reduced to less than 70% of the cost of processing the same four pieces on a single spindle machine. Germany’s CHIRON Company also developed double spindles and four-spindle machine tools which adopt linear array arrangement, and pointed out the processing cost of using double spindles can be reduced by about 40%. The WZL Machine Tool Research Institute, also in Germany, further studied and proved the processing efficiency of four-spindle machine tools is more than 250% higher than that of single-spindle machine tools. 9
In aero-engine blade precise machining, the super-hard abrasive tool has been used during CNC grinding and polishing of various types of blade and has improved the efficiency of precise machining significantly.10,11 Inevitably, however, although blades before the grinding or polishing met the design tolerance needs, the clamping position, tool cutting force, cutting heat, residual stress, tool wear, and machining vibration can also lead to machining deformation.12–14 The deformation will cause the actual blade profile to deviate from the original design and affect the aerodynamic performance of the compressor. Lebele-Alaw et al. 15 studied the relationship between blade twist and its power consumption, and found that blade profile twist caused the airflow deflection angle to increase, resulting in an increase in compressor power consumption and a decrease in efficiency. Benini and Biollo 16 used NASA rotor 37 as a prototype to study the changes in circumferential bending and axial sweeping angles. It is found that bending and sweeping angles will affect the structure of shock waves and secondary flow. Optimizing the degree of blade bending and sweeping angles could improve the compressor efficiency by 1.3%. Zhen et al. 17 and Chen et al. 18 studied the influence of compressor blade position, profile and torsion deviation on performance. The results show that when the blade position changes, the aerodynamic performance of the high-pressure compressor is always reduced. For example, the axial position will reduce the surge margin by nearly 25%, while the profile and twist tolerance will cause negative linear changes. To reduce the machining deformation of the blade, Meng et al. 19 studied the clamping deformation caused by the over positioning. In addition, many studies have concentrated on modeling and predicting the cutting force during blade machining and allowed for error compensation to improve the accuracy of the milling process.20,21 As there are still profile differences among batches of blades after milling, the consistency of blades geometry and machining allowance will be affected and the final array precise machining pass rate and efficiency will be reduced. The traditional solution of the factory is to observe the light transmission of the blade with a blade measuring template, and then group the blades according to the light transmission which stands for the processing allowance. Finally, workers polish the blades in groups using a grinding wheel. This method is inefficient, labor-intensive, and relies on the experience of workers. And the quality of manual polishing is unstable.
This article presents an automatic clustering grouping method for blade array machining. It aims to increase the consistency of engine blades before array machining. It is organized as follows: Section “Multi-axis CNC array machining” presents the array grinding and polishing process system. In the section “Blade feature vector description,” the composition of the blade geometric feature vector is described, including point geometry information and blade deformation information. Section “The blades grouping method based on clustering” presents a detailed grouping algorithm based on clustering which contains the K-medoids clustering algorithm, the clustering evaluation index, and the method of deciding the ideal grouping number. Section “Experiment results” illustrates the experimental verification of the proposed strategy. Finally, Section “Conclusions and future work” concludes the whole article concisely.
Multi-axis CNC array machining
To give full play to the advantages of array machine tools in machining efficiency, Beihang University changed the traditional multi-spindle machine tool from “linear array” to “matrix array.” And they developed the rectangular array machine, which can be used for grinding or polishing small and medium-sized blades,
22
as shown in Figure 1. In the same machine space, the number of spindles can be more compact from
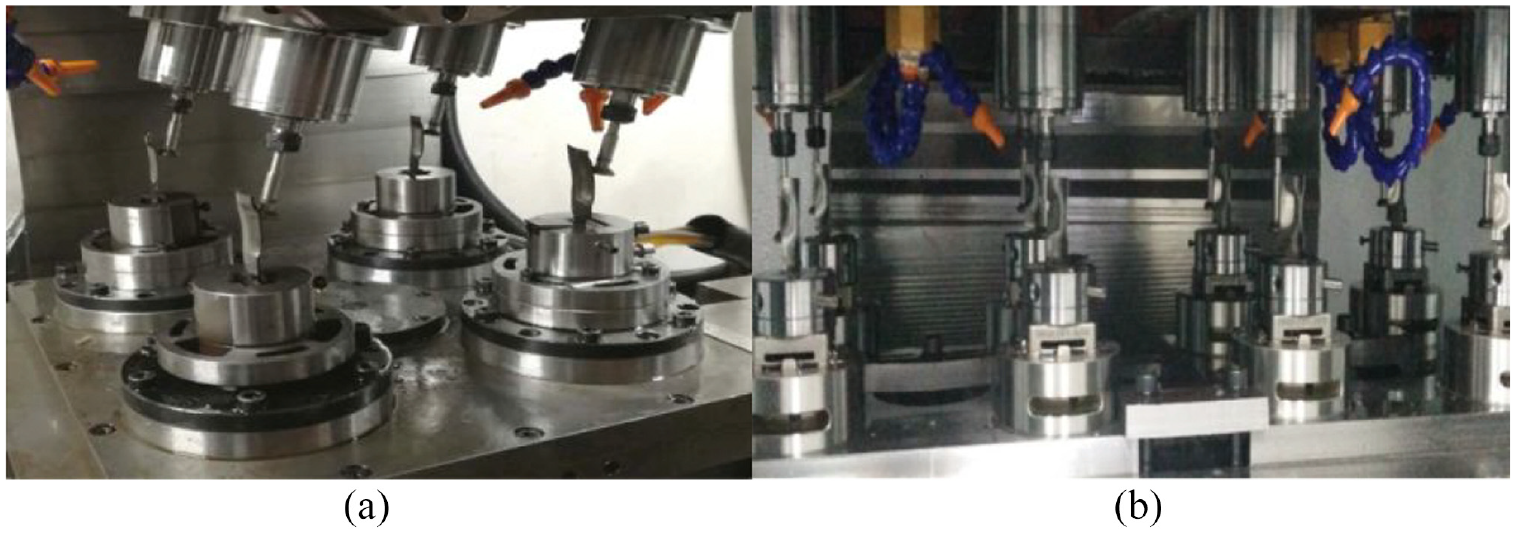
Rectangular array machine tool: (a) four-spindle rectangular array grinding and polishing machine tool and (b) eight-spindle rectangular array grinding and polishing machine tool.
The hardware of high-efficiency array grinding and polishing process system is mainly composed of long life super-hard abrasive flexible polishing tools, SYSTEM 3R fixtures, and multi-spindle array machine tools. The software part mainly generates the non-interference tool path through the CAM system, which is the same as the single spindle programming. The synchronous array grinding and polishing adopts the fixed-trajectory machining technology, which can realize the blade full-surface grinding and polishing through the elastic deformation of the flexible tool and the preset trajectory of the CNC machine tool. The super-hard abrasive flexible wheeled tool has a complex generating line, and the matrix material of the tool is rubber which is connected to super hard abrasive through intermediate reinforcement structure, as shown in Figure 2. The tool will produce elastic deformation under a certain pressure. Figure 3 shows the grinding and polishing process.
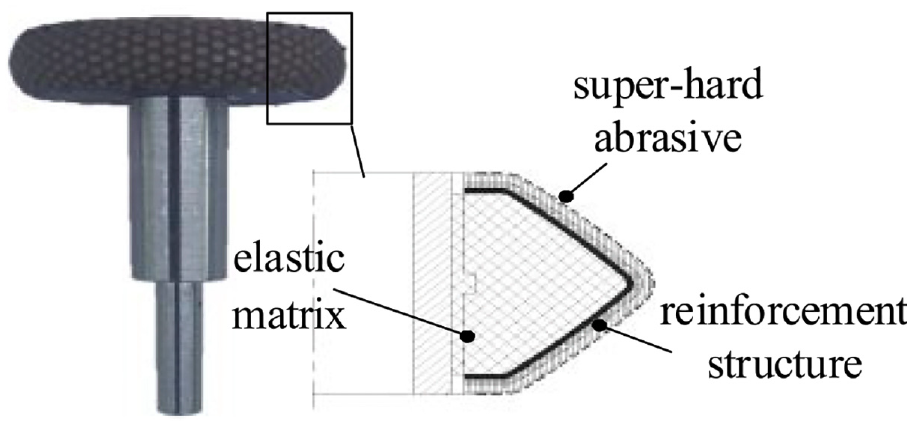
The super-hard abrasive flexible wheeled tool.
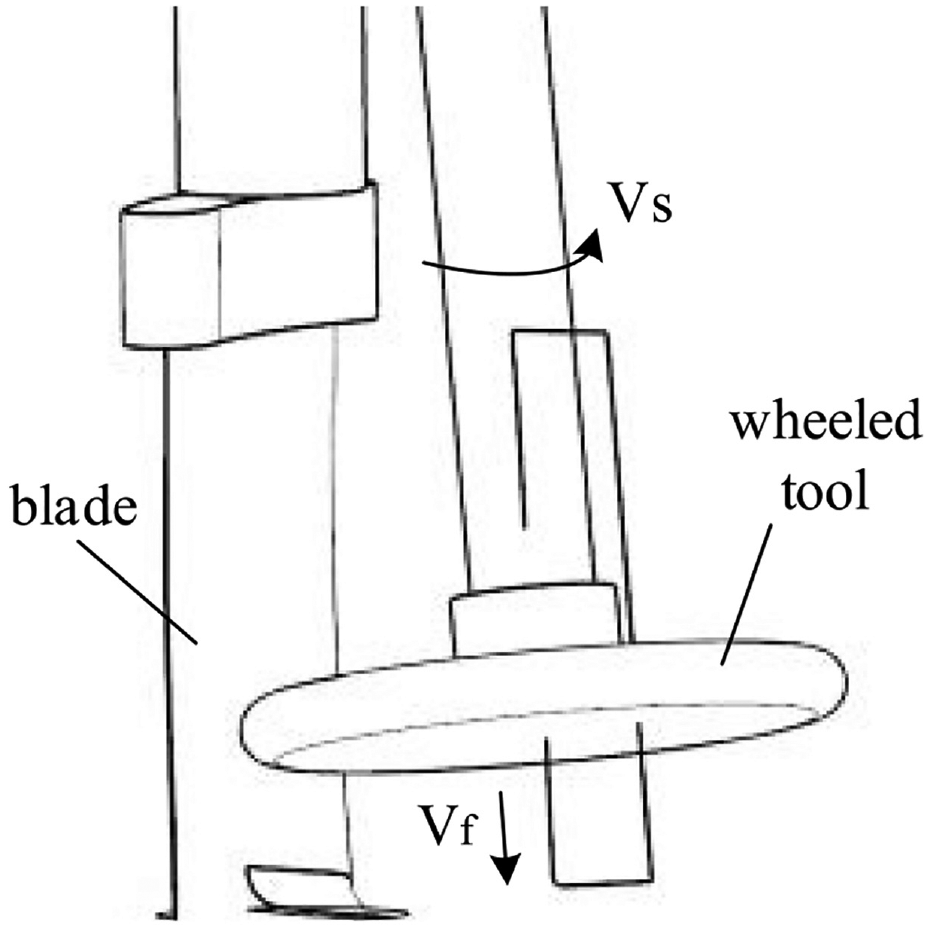
The grinding and polishing process.
Blade feature vector description
Aiming at improving the efficiency of the algorithm for fast grouping and retrieval of blades, a notion of feature vector-based blade description was proposed to improve the efficiency of the grouping method. To describe the geometric shape of the blade in the round, the vector description of the blade should include two parts: the local geometric information and the global characteristic information. 23
For the local geometric information, using the coordinates of measuring points on the blade profile to represent it, and the blade vector can be described as:
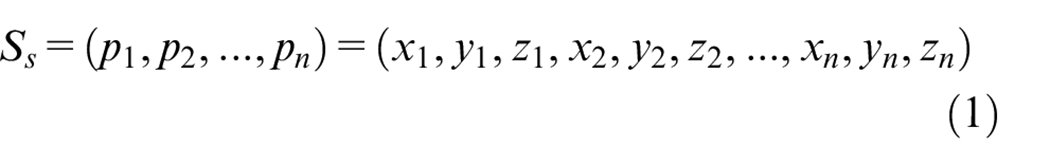
where n is the total number of measurement points,
The global characteristic information can be reflected by the deformation state of the section and the contour error of the blade. By registering the actual measuring points with the theoretical section curves, the position error

Finally, the feature vector expression of a blade can be obtained by merging the local geometric information with the global feature information:

The blades grouping method based on clustering
Distance between blades
After describing the blade through mathematical methods, the vector is standardized to unify the units of all dimensional variables and simplify the calculation of the distance. For the distance between two blade surfaces
where
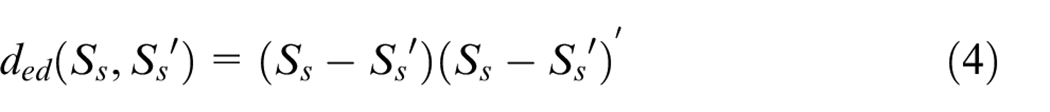
The distance calculation between blades after grouping can be evaluated by the average Euclidean distance of matching points between two surfaces:
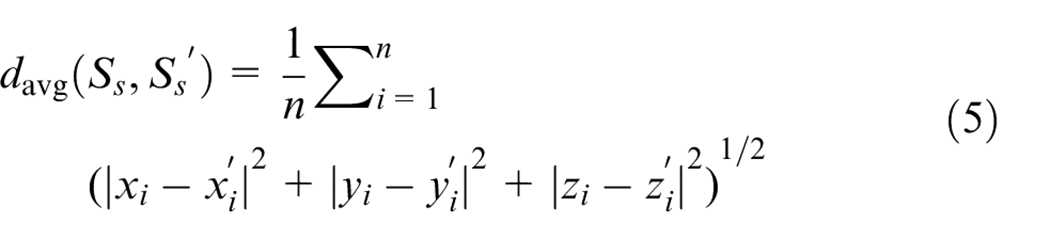
where n is the total number of measurement points,
Clustering
For the clustering of blades, the data set of blades is divided into different groups or clusters according to the distance, so the consistency of blades within the same cluster is as high as possible. One cluster is considered as a group. At present, the most classic clustering algorithm is the K-means algorithm. It can divide data objects into different clusters through iteration, to minimize the objective function and make the formed clusters as independent as possible. The main disadvantage of K-means algorithm is the number of the clusters, K, needs to be given in advance, and the algorithm is sensitive to noise and outlier data. Different from the K-means algorithm, the K-medoids algorithm chooses the closest position to the center of the cluster rather than the mean as the center of clustering. So it can partially remove the influence of outlier. Also, the center of the cluster is conducive to create the array machining tool path directly. However, the disadvantage of the K-medoids algorithm is that the calculation is complicated, and the center needs to be selected through sorting by distance. So it consumes more computation time than that of K-means algorithm. The specific flowchart of the blade grouping method based on K-medoids algorithm is shown in Figure 4.
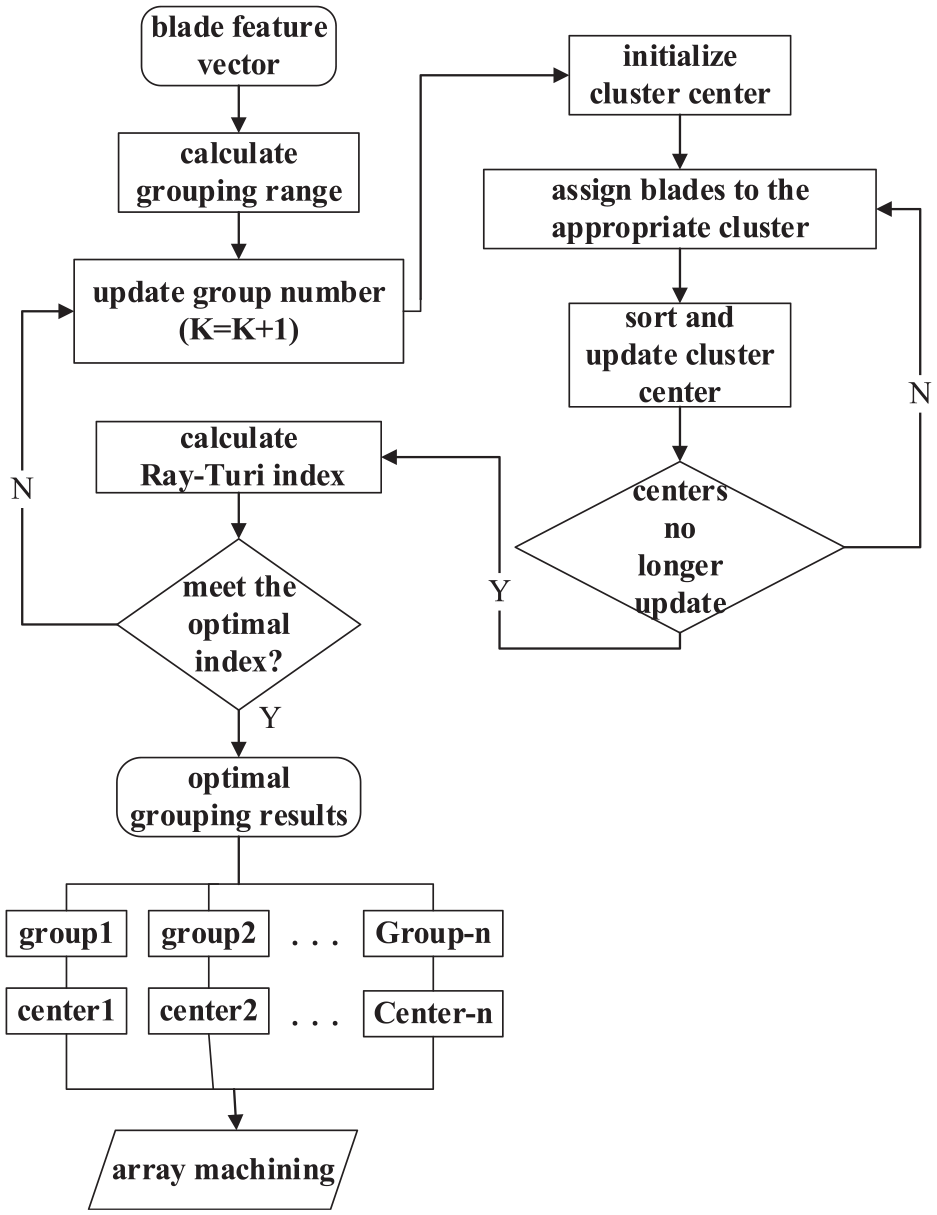
Flowchart of the blade grouping method.
The main steps of the K-medoids blade grouping algorithm are as follows:
Step 1: Give the range of groups (see section “Determination of the number of groups” for details).
Step 2: Select the minimum value m of the range of group number, and set the number of groups K = m, then randomly select m blades as the initial grouping centers. A center identifies a group.
Step 3: Calculate the distance from other blades to each center, and divide each blade into matching groups according to the principle of closest distance.
Step 4: Calculate the distance from each blade in the group to other blades, and select the blade with the smallest distance in the group as the new grouping center.
Step 5: Repeat steps 3 and 4 until the grouping centers of all blades are no longer updated.
Step 6: Calculate the Ray-Turi index of grouping effectiveness evaluation indicator, and select the K value corresponding to the ideal indicator to decide the grouping number and grouping results. The calculation method of the Ray-Turi index is as follows:
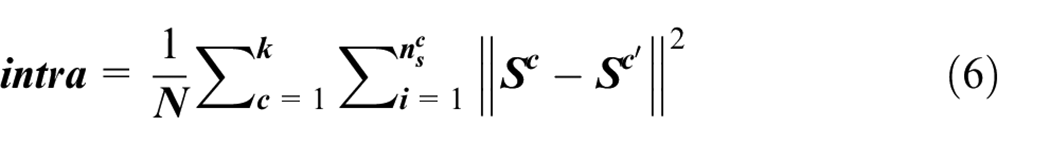
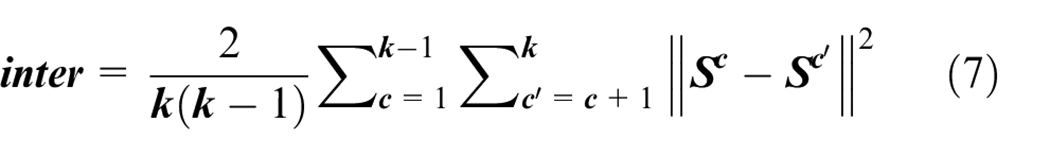
where k is the number of groups,
Determination of the number of groups
Theoretically, the ideal number of clusters can be automatically selected. However, some clustering algorithms fall into the extreme of clustering range and are not ideal. For example, the Ray-Turi index usually supports a few clusters. In this case, the distance between clusters is large, while the distance within clusters is small, resulting in a small Ray-Turi index. On the other hand, as the number of clusters increases, the average distance between blade surfaces in the cluster will decrease continuously.
To avoid this problem, the boundary range for the number of clusters is usually needed to be set. This can be achieved by combining the distance between blade surfaces calculation and evaluation index. First, the upper boundary of clusters is set according to the total number of blades to be grouped and the number of array machine tool’s spindles. Then, set the lower limit by calculating the distance between blade surfaces. As the number of clusters increases, the distance between blade surfaces will decrease. The maximum allowable distance between blade surfaces shall be determined according to the needs of the following processing. The maximum distance between blade surfaces will decide the lower boundary of the clusters. Finally, the number of clusters with the most proper evaluation index in this range is selected as the best. Once the ideal cluster number is determined, the center of each cluster is selected as the processing model of each group.
Experiment results
The following example is used to demonstrate the blade grouping algorithm. The factory offered 20 compressor blades of the same batch after multi-axis milling and the max geometric contour deviation among blades is about 0.06 mm.The material of the blade is super alloy. Taking 15 blades as grouping samples, and the measurement data of the blades were obtained by measuring the 613 points on five designed section profiles of each blade by three coordinate measuring machine (CMM). When using the method mentioned above to reflect on the local geometry information of each blade, there would be 613 × 3 = 1839 dimensions in the vector, and the vector-matrix size was 15 × 1839. It would cause a huge amount of calculation when comparing the distance between the blades. So the principal component analysis (PCA) method was used to lessen the vector-matrix dimensions, and 10 new principal components were select to reflect the information contained by the data. As shown in Figure 5, 10 principal components can represent more than 95% of the original data, so a matrix of 15 × 10 can be formed to reflect the vector-matrix of the original sample.
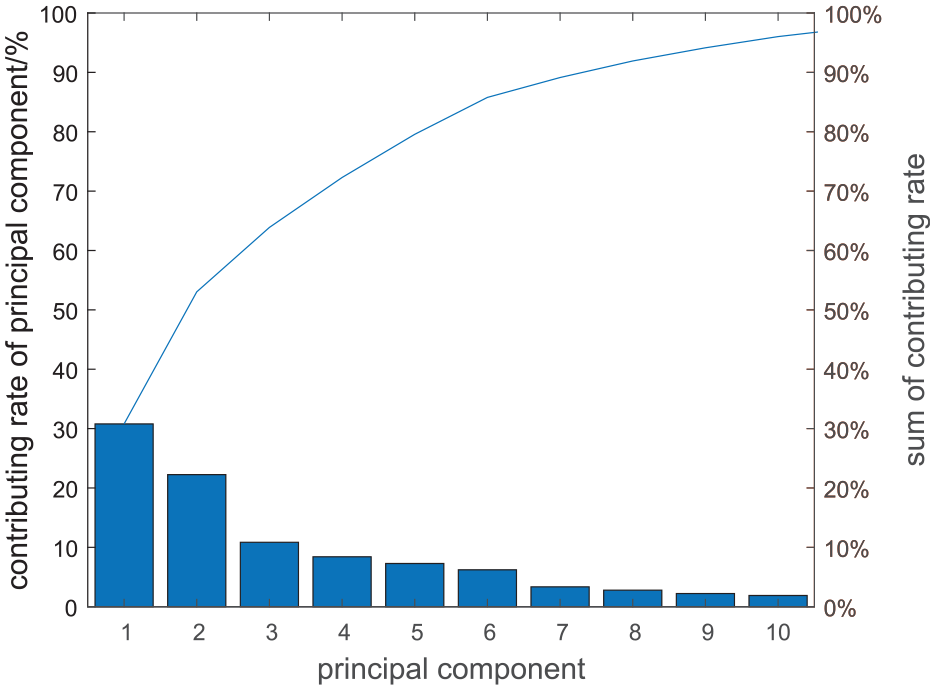
Principal component analysis of data.
For global feature information, since five sections were measured and each section had seven feature parameters, the blade feature vector matrix of size 15 × 35 could be obtained. Finally, the local geometric information matrix of size 15 × 10 and global feature information matrix of size 15 × 35 were normalized according to dimensions and then fused to compose the matrix of the final sample, with a size of 15 × 45. The sample matrix was calculated by the program prepared by MATLAB for grouping calculation.
Number of groups
To satisfy the need for the array machining of 15 blades, at least two blades should be divided into a group, then the maximum number of groups is 7. For the minimum number of groups, in this example, the allowable tolerance of following polishing processing should be 0.03 mm, and the minimum number of groups can be determined as 2 from Figure 6(a). So the ideal grouping number was determined between 2 and 7 and the appropriate K value was found in this range to make Ray-Turi index the least, as shown in Figure 6(b). It shows that group numbers 4, 6, and 7 all reached the lower Ray-Turi index. However, from the view of array machining, choosing fewer groups means the number of processing programs for each group could be lessened to improve the efficiency of processing. Therefore, group number 4 was chosen as the ideal group number. After deciding the number of groups, the calculation was performed as shown in Figure 7.
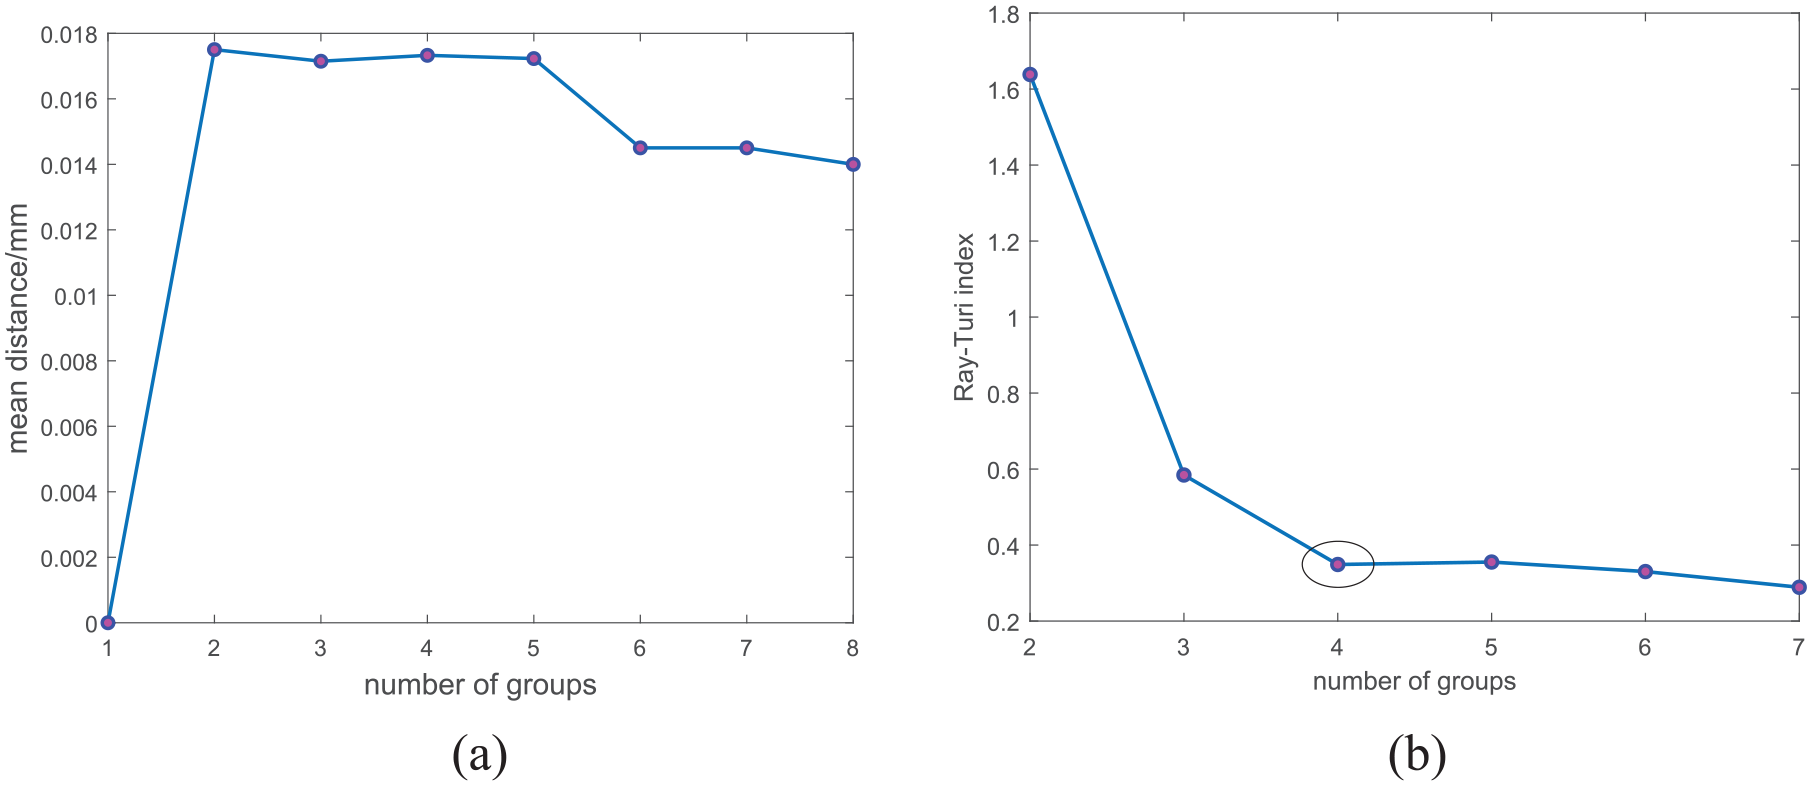
Number of groups calculating process: (a) The process of determining minimum number of groups and (b) The Ray-Turi index of diffrent number of groups.
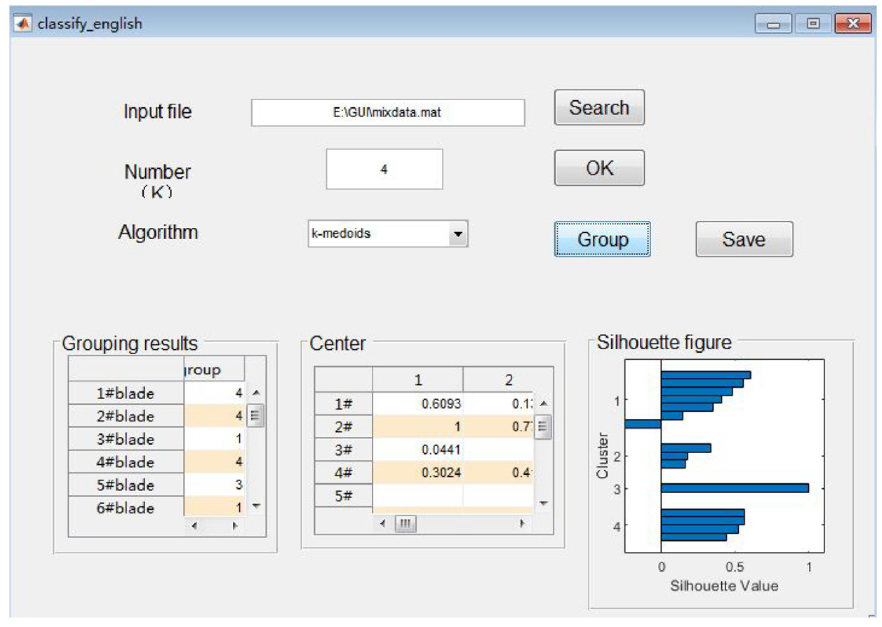
Grouping program.
Analysis of grouping results
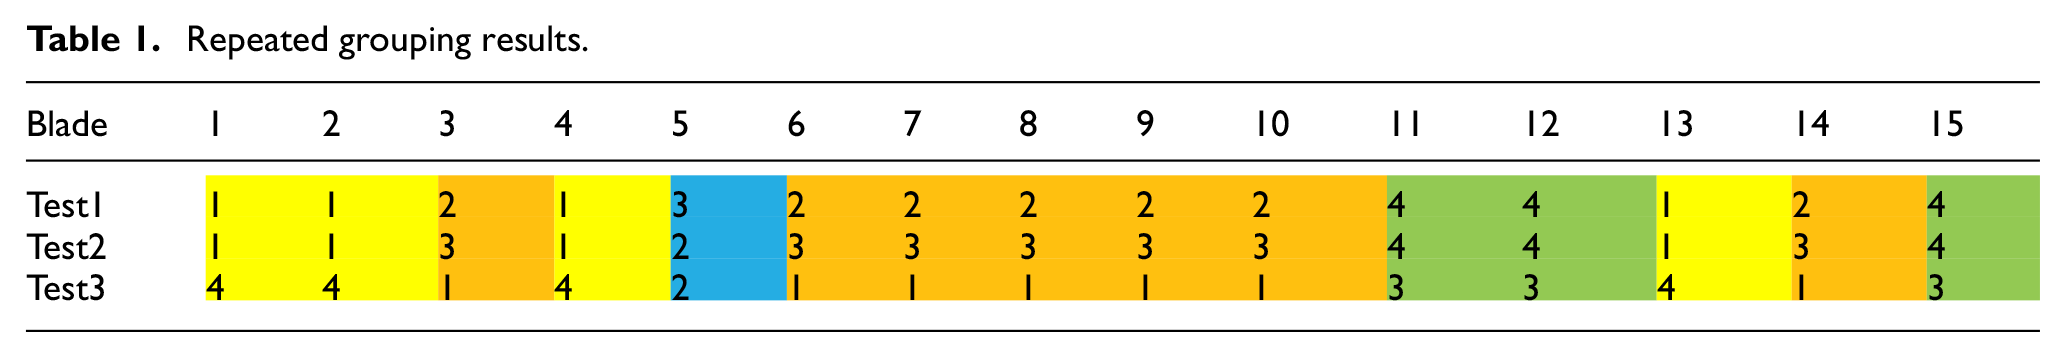
Results of the independent tests are shown in Table 1, the number in the table represents group mark. Table 1 uses the same color to mark the same grouping results of three independent repeat tests, for example the blades marked yellow belongs to Group 1 in Table 2, which proves the algorithm has good stability and the result of each grouping is stable. The running time of the program was about 0.3 s on Intel Core i5-4200m platforms.
Repeated grouping results.
Grouping results and grouping centers.
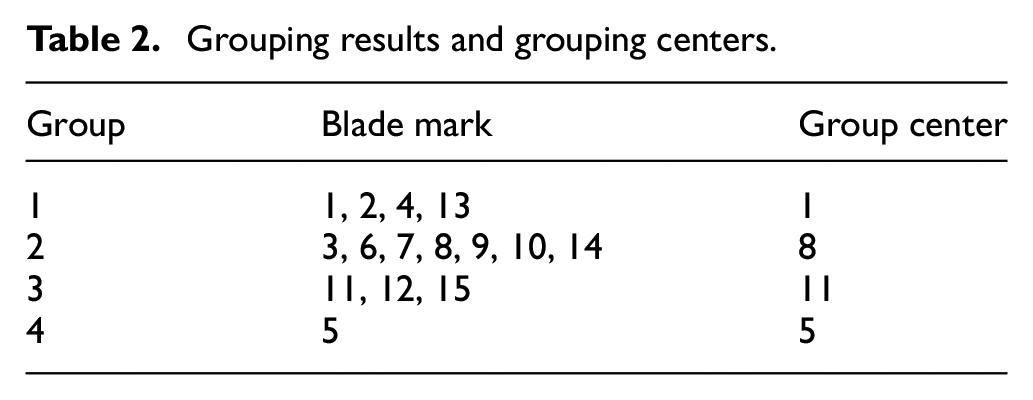
The final blade grouping results and the corresponding center blade marks are shown in Table 2.
The silhouette figure is made from the grouping results, as shown in Figure 8. In the silhouette figure, the number of groups and the number of blades in each group are easy to find, where the value range of silhouette value is (−1,1). The definition of silhouette value at the i-th point in the contour diagram is shown as equation (9):
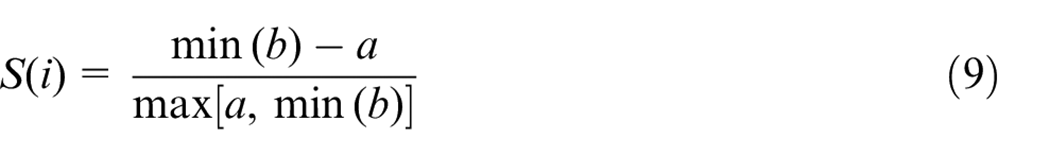
where i = 1, 2,…,n,
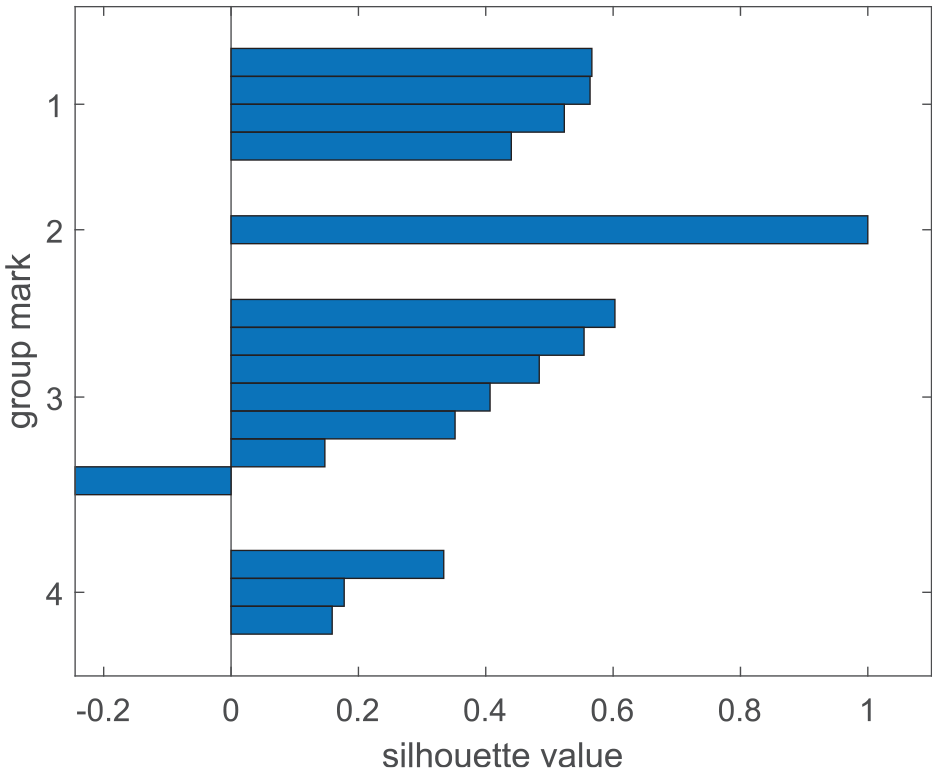
Silhouette figure.
Simulation comparison
The results of blade grouping were corroborated by simulation. First, the CAD model of the group center’s blade surface was built in the 3D modeling software UG. In one group, the distance between the measured points of other blades and the central blade surface was compared to evaluate the consistency of the blades in the group. Then a blade was randomly selected in each group to demonstrate the difference between the groups.
For the center blade of the first group, the modeling process is as follows. First, CMM points data of five section curves were imported. Then spline fitting was performed for each section line. Finally, the blade surface passing through five section curves was created by using the command of ThroughCurves in the software UG, as shown in Figure 9. After modeling, other blade measurement points were imported to measure the distance from points to the surface (error) using the surface analysis of PolyWorks, as shown in Figure 10. The comparison results are shown in Tables 3 and 4.
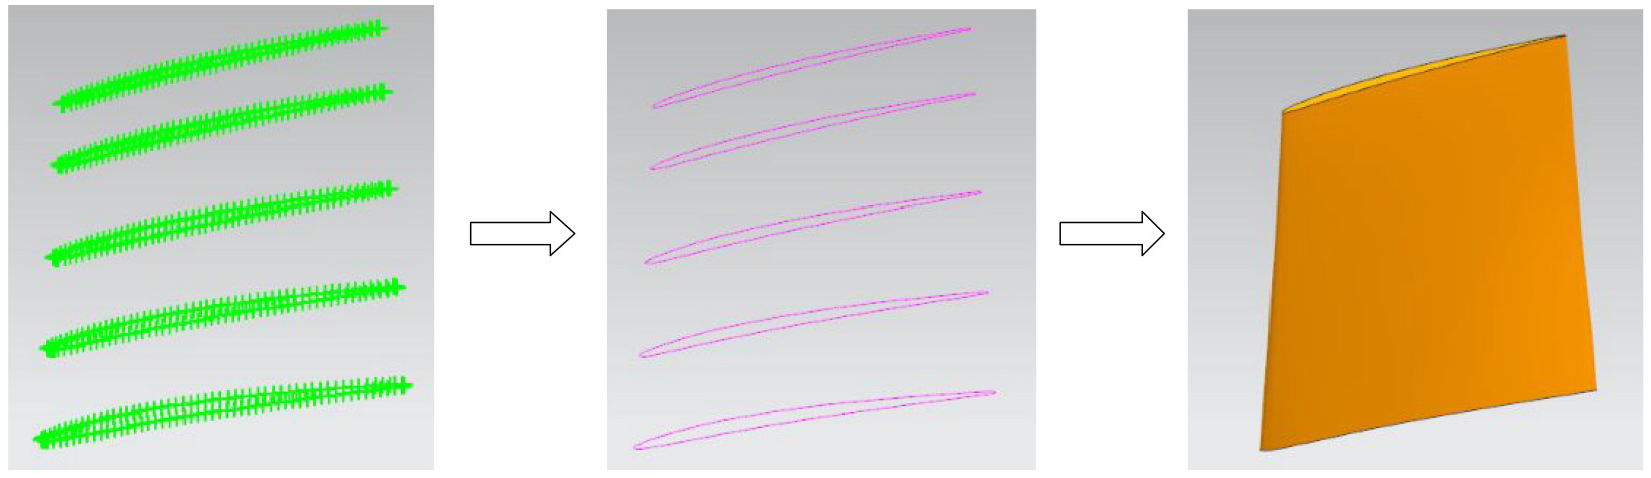
The blade modeling.
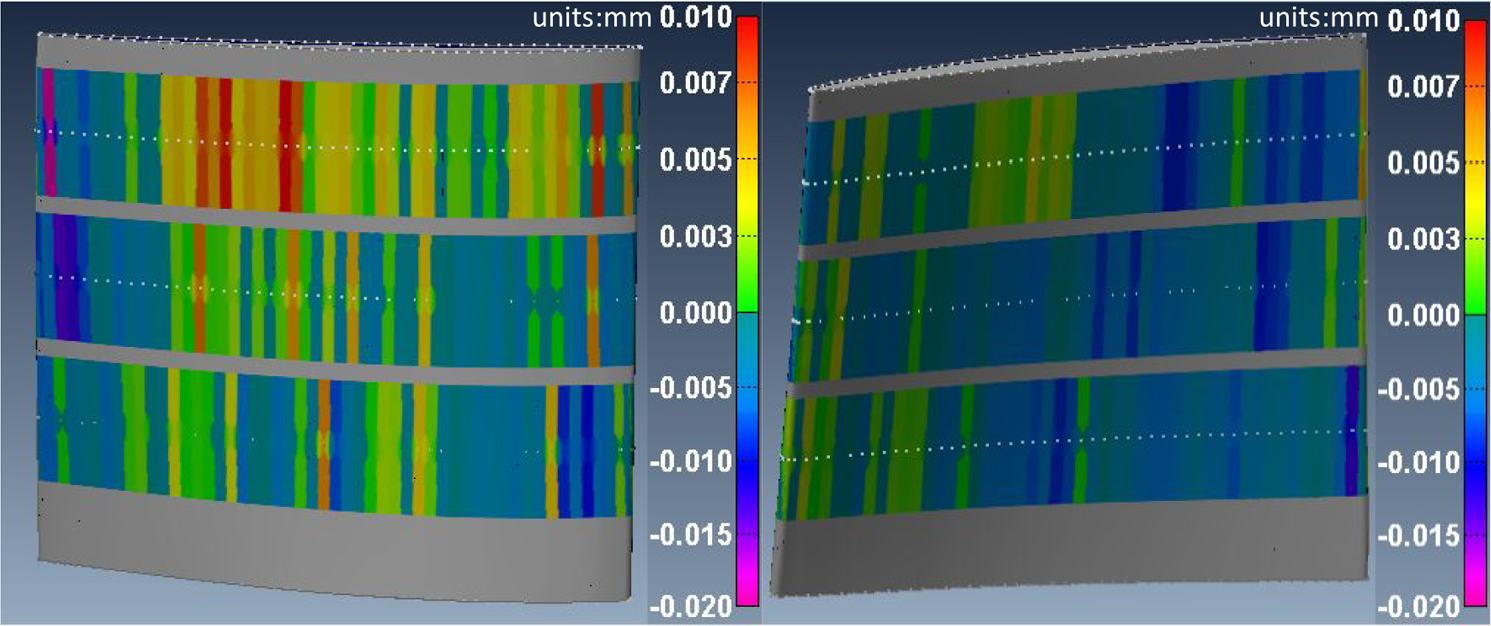
Surface error analysis.
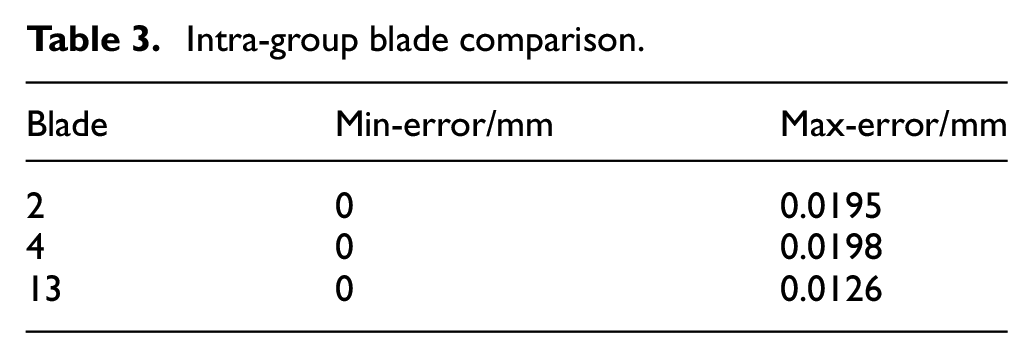
Intra-group blade comparison.
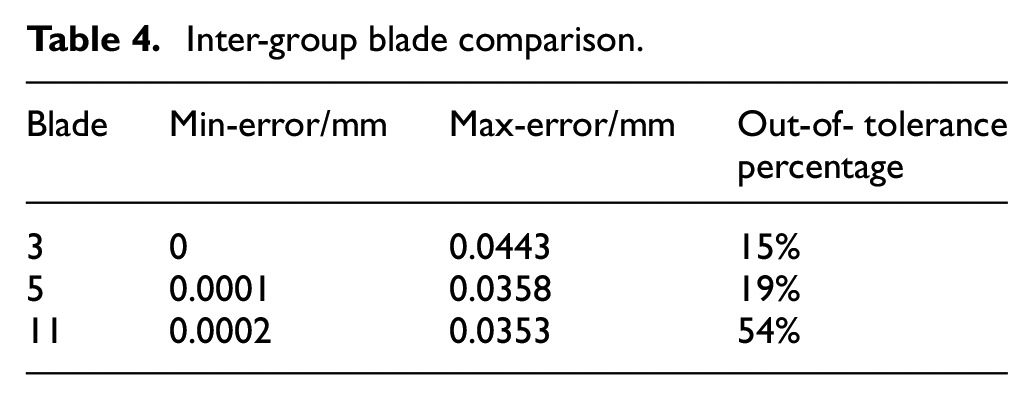
Inter-group blade comparison.
Comparison of No. 1 blade and No. 2, 4, and 13 blades in one group:
Comparison of No. 1 blade and No. 3, 5, and 11 blades among groups.
By analyzing the comparison results in Tables 3 and 4, the following conclusions can be drawn:
(1) The grouping method proposed in this article can be used to group batch blades correctly according to geometric shape characteristics. And the maximum profile deviation among the blade surfaces in the same group is smaller than 0.02 mm.
(2) It can be inferred from Table 4 that the blades of different groups after grouping are discrepant. And the deviations among most parts of the blades are more than 0.03 mm, which is not qualified for array machining.
Array machining tests
Machining tests were carried out with super-hard abrasive flexible wheeled tool at PJZ5.04-200 W four-spindle rectangular array grinding and polishing machine tool with a maximum power of 10,000 rpm and 40 kW. The machining process is shown in Figure 11. Two groups of blades were processed, one group is the No.1, 2, 4, and 13 blades of group 1 in Table 4 grouped by the method presented in this article, the other control group is consisted of four ungrouped blades No.16, 17, 18, and 19. The cutting parameters of the two groups of blades are the same, and the spindle speed is set to 6000 r/min with feed 900 mm/min. The size of the wheeled tool is D30R1.5 mm and the super-hard abrasive is CBN. The machining tool path of the blades is generated through the CAM system by UG. The process model used is the No.1 blade’s model which is reconstructed as the center of the group. The processing time for four blades is 12 min, which is equivalent to only 3 min for one blade, which significantly improves the processing efficiency and saves a lot of labor costs.
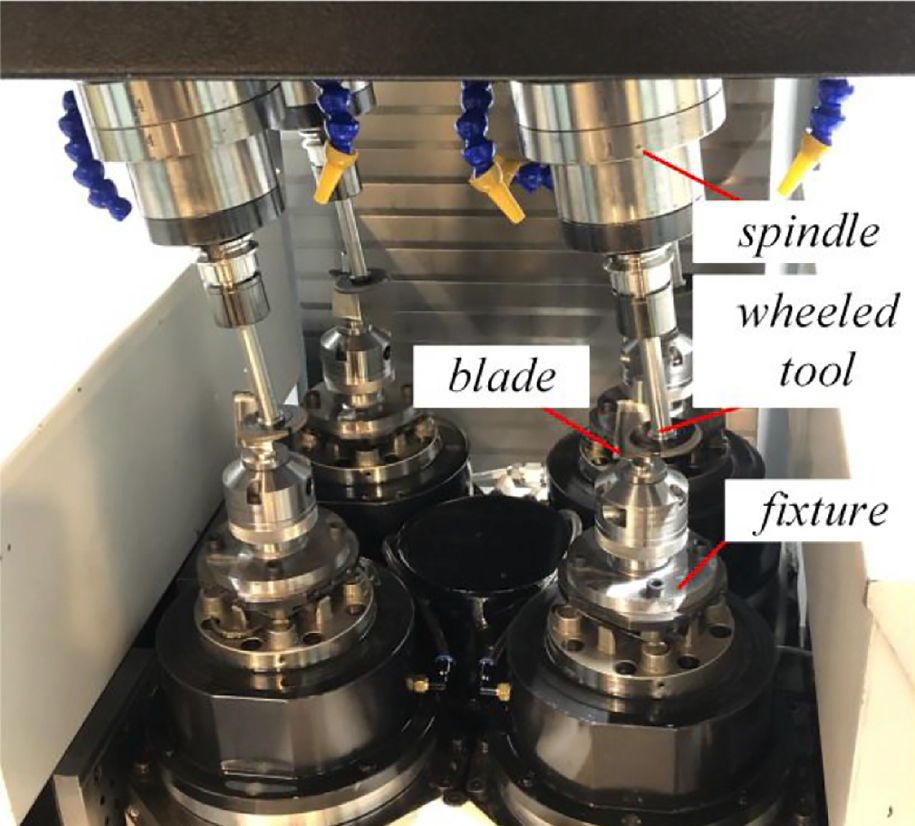
Blades machining process.
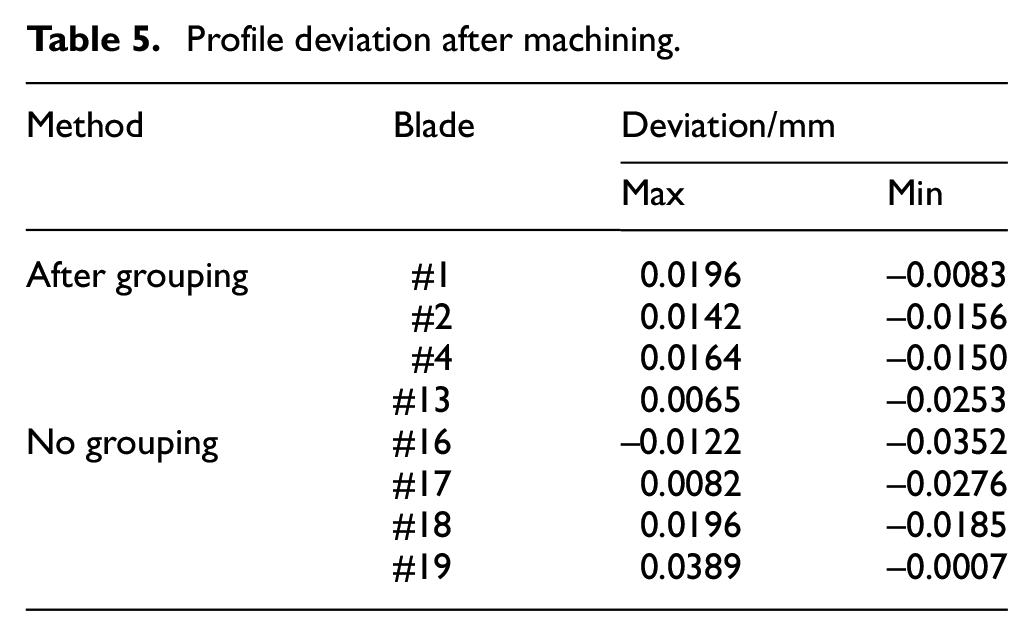
After machining, the blade was measured with the WENZEL CODE-DS white light 3D scanner, as shown in Figure 12. The profile tolerance of blade ranges from −0.04 mm to 0.04 mm. The position tolerance is 0.1 mm and orientation tolerance is 0.12°. According to the measurement report, the maximum and minimum profile of the polished blade is obtained, as shown in the Table 5. And the X-shift, Y-shift and R-rotate value
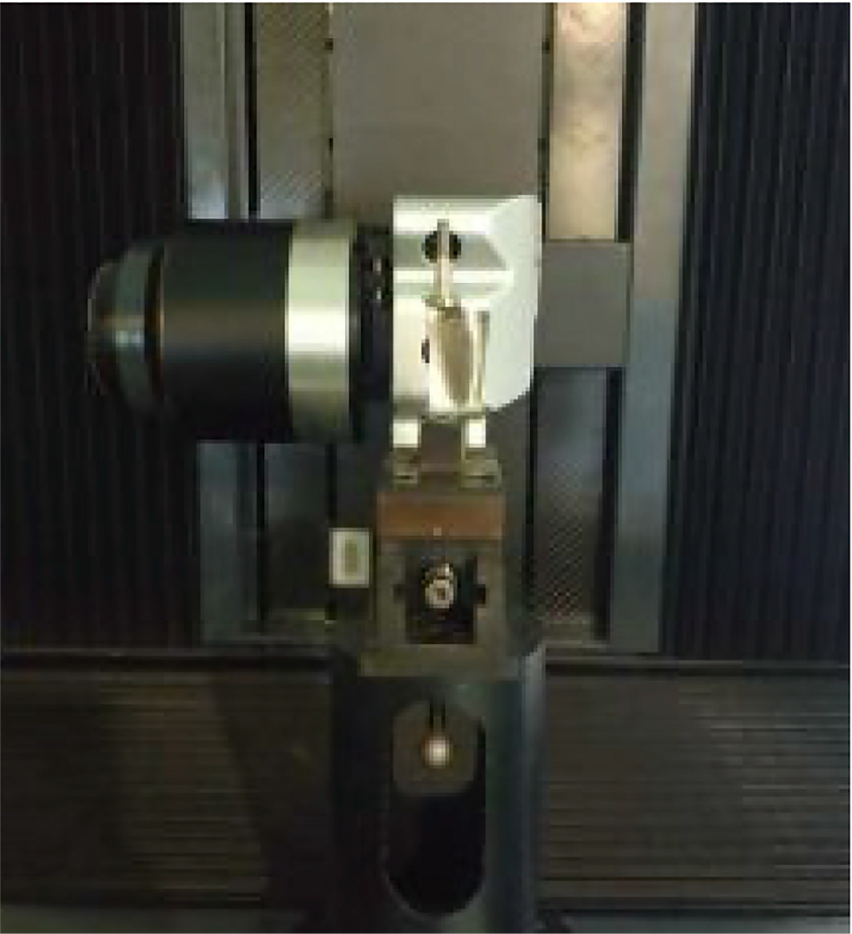
Process of measuring.
Profile deviation after machining
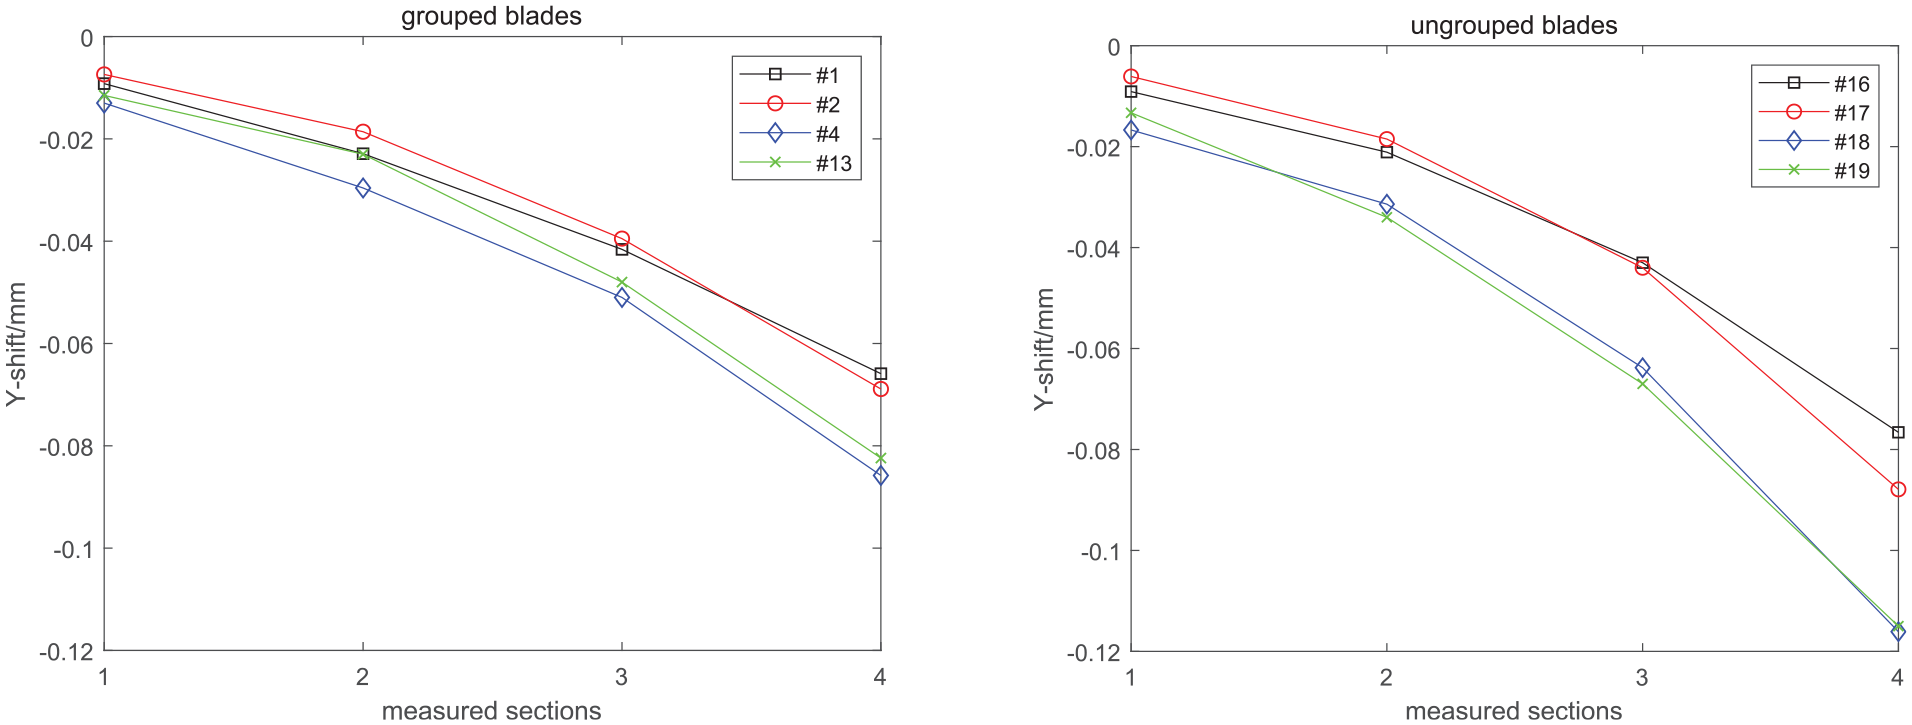
Y-shift values of blades after machining.
Obviously, according to Table 5 and Figure 13, all polished blades grouped can meet the tolerance requirements. The maximum surface profile difference of the four blades is 0.0314 mm, and the four blades without grouping is 0.0741 mm. In engineering practice, ungrouped blades can also meet the tolerance requirements, but the contours of the blades vary greatly, which will affect the overall aerodynamic performance of the engine. As for the position deviation, it can be seen from Figure 13 that within the design tolerance range, the Y shift value of the four blades processed after grouping does not exceed 0.02 mm in each measured section. While the Y shift values of the four ungrouped blades in each section are poorly consistent. The difference between the four ungrouped blades in the fourth section with the worst rigidity is about 0.04 mm. The comparison shows that the grouping strategy adopted in this article can make the machining accuracy of blades within 0.035 mm, and the Y-shift value, that is, the bending deformation error among blades can be reduced by about one time from 0.04 mm to 0.02 mm.
Conclusions and future work
This work has presented a blade grouping method to realize digital grouping in the field of array machining. The method integrates the existing clustering algorithm and sets out an entire process flow for blade grouping and array machining. In this method, a vectorization representation method including global characteristic information and local geometric information of blades is described. The K-medoids clustering algorithm is used to divide blades with similar geometry into a group. In the process of clustering, the accuracy and efficiency of grouping are improved using the optimization strategy of the number of groups. Finally, a blade grouping experiment was conducted on blades provided by the factory. The experiment results can be concluded as follows:
(1) The profile error of the blades in one group was controlled within the tolerance of 0.02 mm which is acceptable for array precise machining. The consistency of the blades in one group is improved.
(2) The machining test showed that the accuracy of the grouped blades reached 0.035 mm, and the deformation among the blades was reduced from 0.04 mm to 0.02 mm. This proves that the method is appropriate to be implemented in factories for the production of large batches of blades.
Under the framework of the proposed strategy, future work will be conducted in the grouping method based on the feature points of blades. In this way, the information needed to be measured for each blade will be reduced and the blade feature vector description will be easier. The authors plan to concentrate on feature point recognition and try to answer the following two questions.
(1) Which points can best reflect the characteristics of a blade?
(2) How many feature points should be measured for blade grouping?
Footnotes
Acknowledgements
The authors thank the anonymous reviewers for their constructive comments and suggestions.
Declaration of conflicting interests
The author(s) declared no potential conflicts of interest with respect to the research, authorship, and/or publication of this article.
Funding
The author(s) disclosed receipt of the following financial support for the research, authorship, and/or publication of this article: The work is supported by National Science and Technology Major Project (Grant number 2018ZX04004001).