
Abstract
In micro-electrical discharge milling (μED-milling), the rotation and forward feed motion of the tool is the key element responsible for evacuation of the debris particles. The inability to eliminate debris from the interelectrode gap (IEG) causes secondary discharge, short-circuit, and hampers removal rate. This problem is predominant in electrical discharge machining (EDM) where the tool is stationary. Various methods have been devised in the literature to boost debris removal from the IEG. In this paper, the use of a slotted tool with different cross-sections is proposed. The dielectric flow-field, debris trajectory, and cooling rate are calculated using computational fluid dynamics (CFD). Effect of different parameters such as tool rotation, gap size, jet velocity, the shape of slots on the dielectric flow is determined. The slots on the tool create turbulence which enhances the debris removal from the IEG. It also provides the space to accumulate the debris particles, thereby increasing the removal rate. The variation in the dielectric flow-field greatly affects the debris flushing from the IEG. The trajectory of the debris particles depends on their initial position in the IEG and they cool rapidly, which is validated using simulation and mathematical approach.
Introduction
Micro-Electrical Discharge Milling (μED-milling) is a popular process to manufacture intricate shapes using a simple cylindrical tool with a high aspect ratio. The process differs from wire-EDM in which the cut is throughout whereas in μED-milling blind holes or shapes are possible. The applicability of the μED-milling is enhanced due to multi-axis CNC control and complex trajectory motion. Simple cylindrical tool rotating and translating in a linear direction may generate complex shapes. Rotation is the inherent part of the process and it enhances debris exclusion from the inter-electrode gap (IEG). However, rotation is only one aspect of debris removal, there are several other flushing techniques such as high-velocity jet, tool vibration, and tool jump which have been devised in the past to maintain a low level of debris concentration in the gap. Though, this necessitates additional attachment/setup which is expensive and requires maintenance. Therefore, geometric features provided on the cylindrical tool as compared to the plain tool can provide an effective push for the debris removal from the IEG. This study focusses on using a slotted tool to improve debris exclusion in the μED-milling process.
The simulation is a useful tool to study the physical phenomenon of the process and is used by various researchers to study the flow-field, variation of different parameters in the domain under study. Haas et al. 1 used dielectric fluid flow simulation of the wire-EDM to study the flushing efficiency. Pontelandolfo et al. 2 investigated the dielectric and particle motion in the die-sinking EDM process. The vortex generated at the bottom of the gap enhances the evacuation of particles. Shervani-Tabar and Mobadersany 3 studied the ultrasonic tool vibration, velocity, and pressure distribution in the dielectric around the bubble in EDM using the numerical simulation. Fujiki et al. 4 considered the effects of electrode lead and tilt angles, dielectric fluid flow rate on machining performance in near-dry ED milling process using CFD. Zhou et al. 5 investigated a new technique for machining lens molds using tilt ED milling. As the dielectric fluid plays avital role in ED milling, its flow changes due to the spherical electrodeis analyzed using simulation. Lunardelli and Wentz 6 designed the nozzle used for atomized spray cooling systems in micromachining applications using CFD. Okada et al. 7 studied wire breakage phenomenon due to dielectric jet through nozzle in wire EDM. The dielectric flow, debris movement, and pressure distribution in the gap are calculated using the turbulence k–ε model. Gadeschi et al. 8 computed the heat flow from the electrode to the dielectric during a EDM using numerical simulation and experimentation. Beigmoradi et al. 9 studied different types of tool geometry and materials which can be used as a vibratory tool in the EDM process. The vortex generation and the tool shape can enhance the debris flushing in the gap.
Different methods have been developed by various scholars to enhance flushing efficiencies such as high electrode jump and improvised tool. In this aspect, a simple cylindrical tool is modified to improve flushing and machining performance. Various types of tool geometry used by researcher are foil, 10 slotted,11,12 stepped, 13 peripheral slots, 14 bunched, 15 tubular, 16 semi-cylindrical, 17 inclined micro-slots, 18 helical slots, 19 single and double-helical, 20 and 3D printed complex profile 21 to improve machining performance. However, all the study was focused on the experimentation to enhance material removal rate and reduce tool wear rate. The improvised tools provided sufficient turbulence and drag to the dielectric fluid in the small IEG. The debris particles which are generated at a faster rate are efficiently removed due to dielectric motion in the IEG. The self-cleaning ability due to improvised tool and tool rotation has become an intrinsic part of the µED-milling process. These factors proved favorable for improving the machining performance by eliminating the secondary discharge. Hence, in-depth study to understand the dielectric flow-field and its interaction with the debris is essential. This gave impetus to the authors to get useful insights into the gap of the μED-milling process. In this paper, the study of the dielectric flow-field, debris movement, and temperature analysis in the gap is done using the slotted tool. The influence of various parameters such as tool rotation speed, gap width (IEG), and nozzle inlet velocity is considered and the responses such as the average dielectric velocity (ADV) and flow patterns taken for observation. The dielectric velocity and the flow pattern are responsible for the efficient debris removal from the IEG. The cooling rate of the debris particles are also calculated using analytical method and are validated with the simulation results.
CFD model
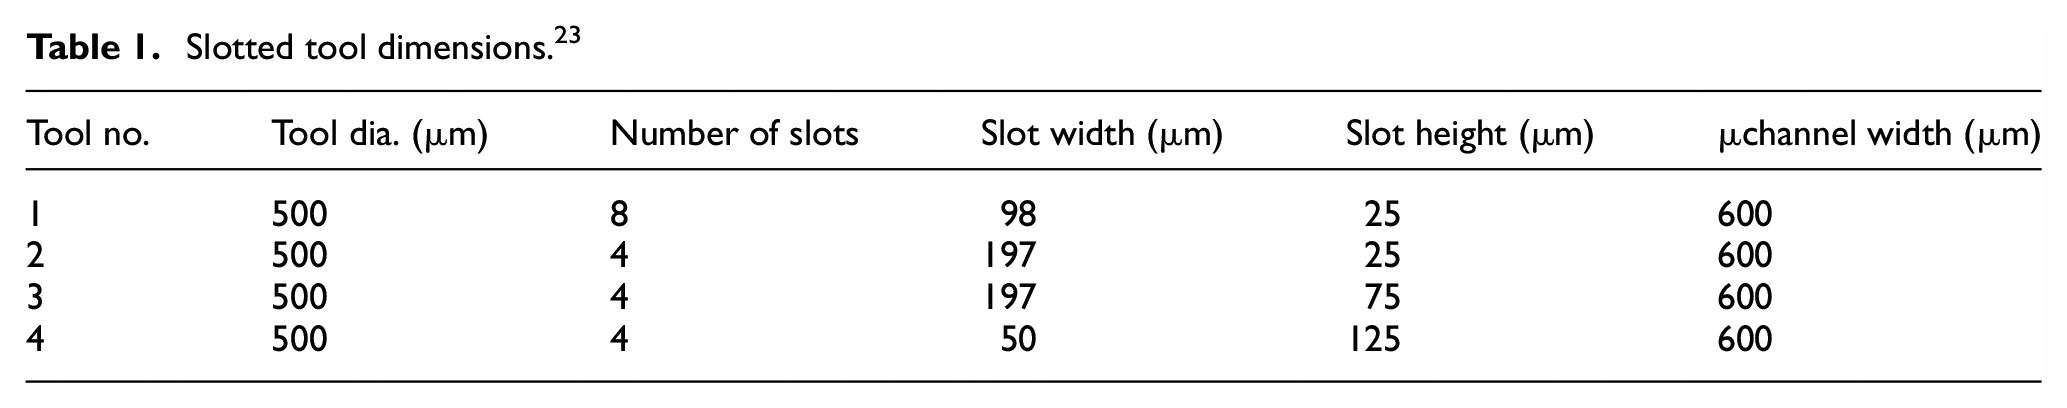
The dielectric flow-field and debris particle trajectory in the gap are simulated using commercial software ANSYS Fluent. Various slotted tool considered for simulation is represented in Figure 1. The model under study is a two-dimensional representation of the cutting by the μED-milling process. Since the behavior of the µED-milling process does not vary along the length of the channel and tool only a plane section is considered for simulation. The part of a channel is cut by a rotational and linear travel of the tool. Four different shapes of the slotted tool namely slotted tool 1, 2, 3, and 4 is considered for simulation. As described in Table 1, the number and size of slots are varied to study its effect on the flow-field. The width and depth of slot is as illustrated in Figure 1. The width of µchannel cut is 600 µm constituting the tool diameter of 500 µm and IEG of 50 µm. The distance between the inner circumferential surface of the workpiece and the inner surface of the slot is represented as gap width which is equal to IEG plus slot height. This gap width is equally divided into three positions and the velocity of dielectric is calculated as represented in the figure. These positions are I, II and III across the IEG such that these positions are near to workpiece, at the center and near to tool respectively. At each position, three points are considered to measure the values of dielectric velocity and an average of these values is reported. 22 The positions in Figure 1 also shows that they are located at the front end of the tool and the area behind the tool is referred to as the back end of the tool where the formation of vortex is observed. This region at the back end of the tool is important to study the fluid flow pattern and the vortex behavior. To study the trajectory of the particles, five different positions on the workpiece is used to inject the particles.
Slotted tool dimensions. 23
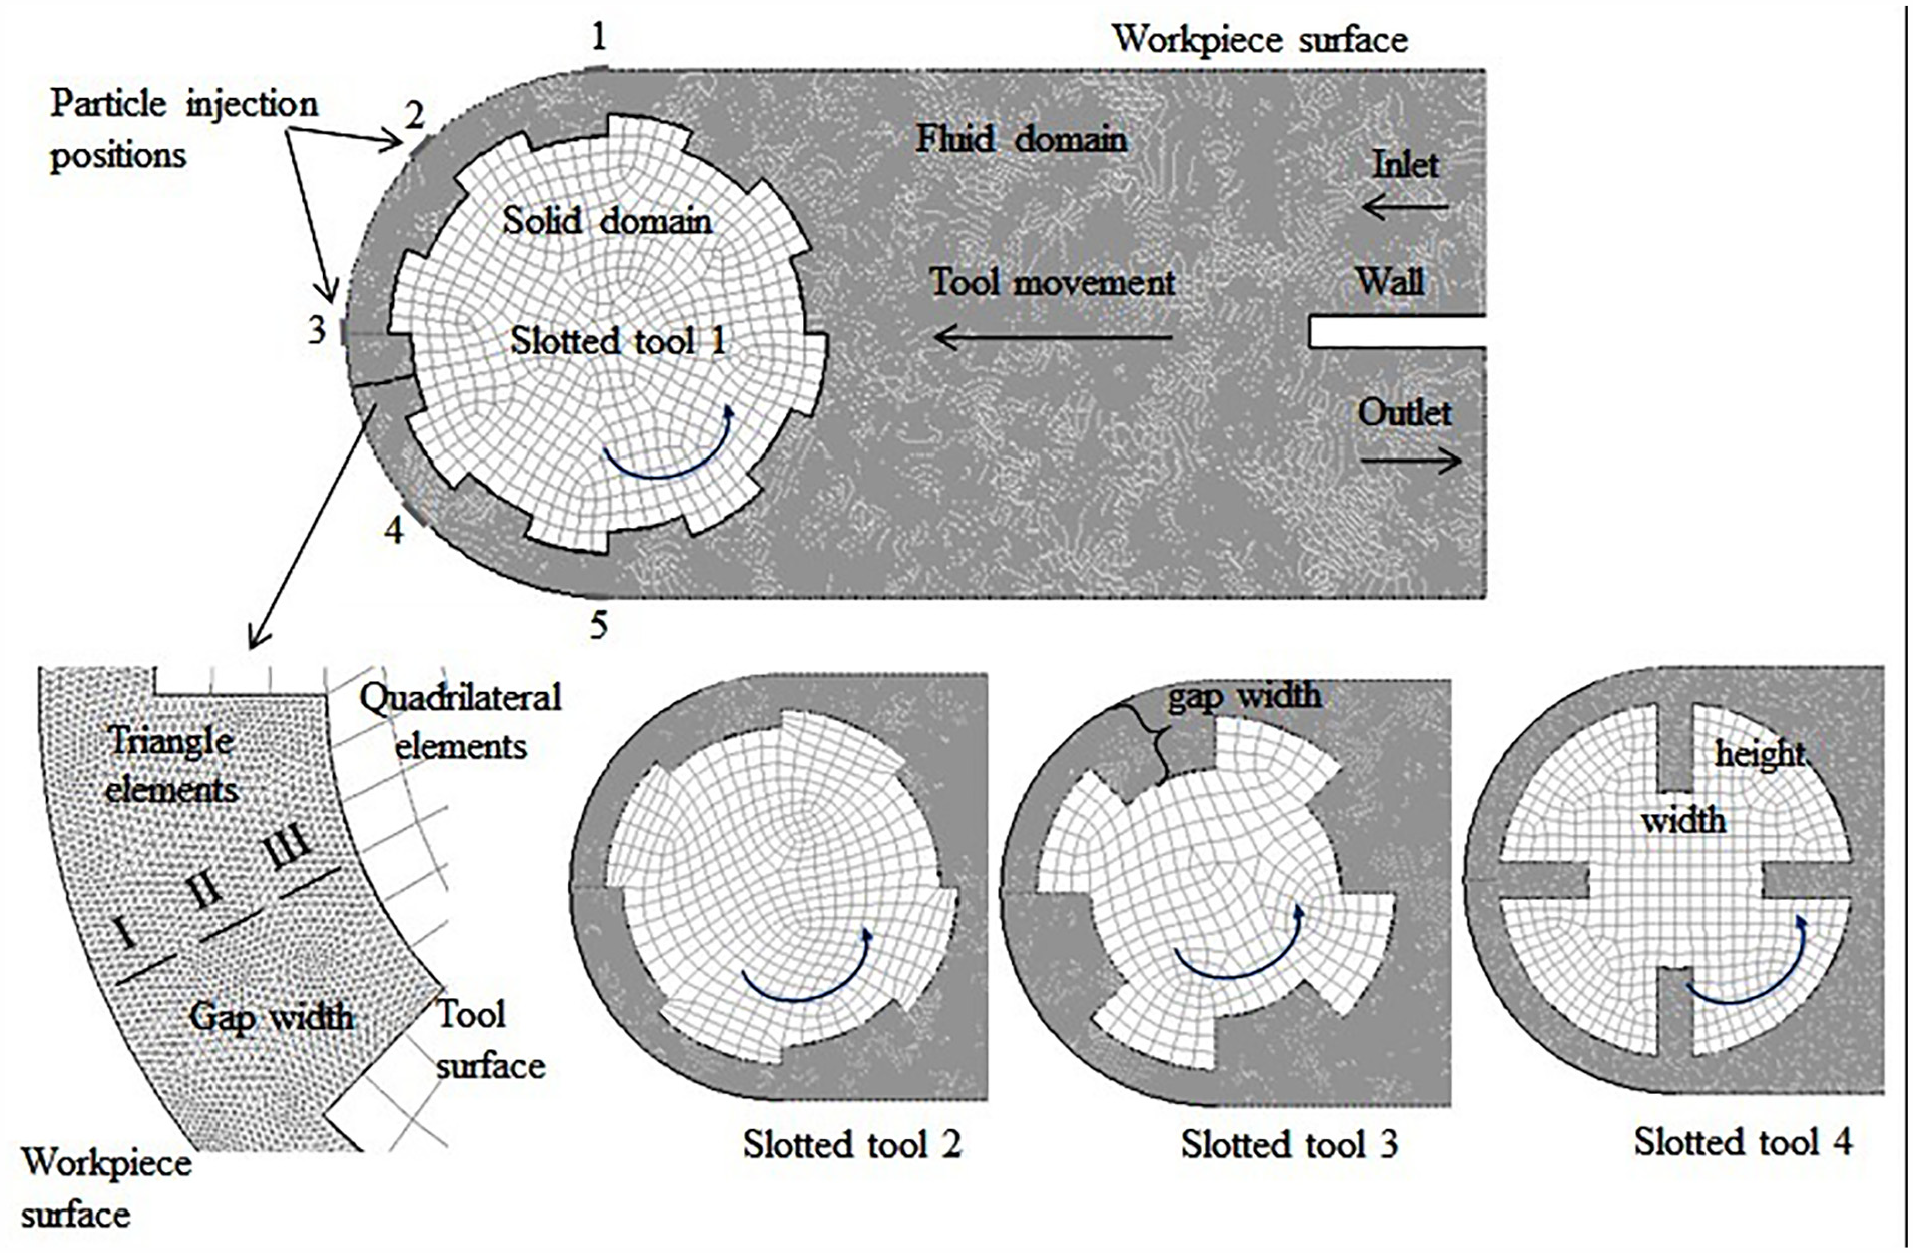
Schematic diagram representing the slotted tool and analysis points.
Boundary conditions
In the geometry, tool is considered as the solid domain and the μchannel cut is the fluid domain as represented in Figure 1. As the dielectric flow-field is under the investigation, this fluid domain is finely meshed with unstructured triangle elements. The solid domain is coarsely meshed with structured quadrilateral elements as there are no any significant changes. The fluid domain is filled with the kerosene as a dielectric and for the recirculation it is injected from the inlet cross-section at a velocity of 0.01 cm/s. The used dielectric moves out of the fluid domain from the outlet cross-section. The imaginary wall is considered for simulation to give inlet and outlet boundary conditions and this does not affect the flow pattern. Angular rotation in a counter-clockwise direction is provided to the tool by the moving reference frame (MRF). The inlet is set with velocity conditions and outlet is set with atmospheric pressure conditions. Other surfaces of tool and workpiece are set with no-slip condition that is, zero dielectric velocity. The algorithm used is realizable k–ε model which is widely used where the flow is rotational. k is the turbulence kinetic energy (TKE) and ε is the dissipation rate.8,24
The transport equations are 8
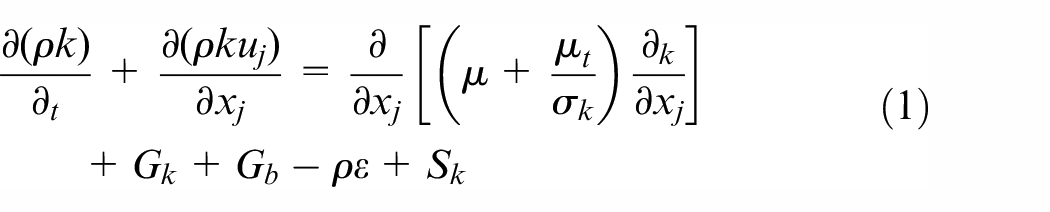
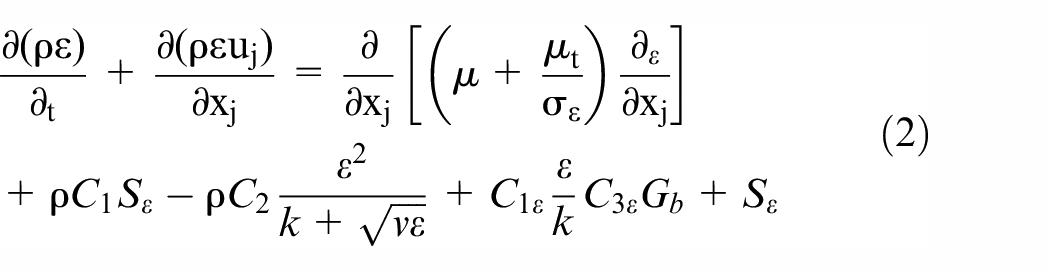
where
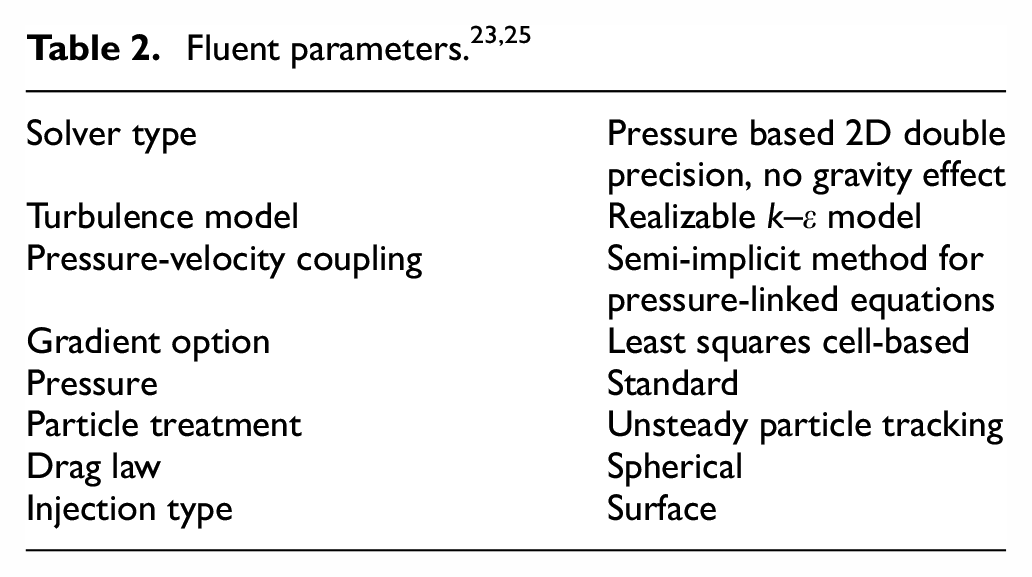
The spherical steel particles are injected with certain velocity from the workpiece surface and its trajectory is tracked to study the debris flushing due to dielectric. The discrete phase (debris particles) is tracked in the continuous phase (dielectric) using Euler-Lagrangian approach. As the quantity of particles are less as compared to dielectric, its effect on dielectric flow is neglected and hence one-way coupling is used for simulation. The list of CFD parameters used for simulation is given in Table 2. The momentum transfer is calculated using the Schiller-Naumann drag model in the software. Particles are inert with no gravity effect. Zero velocity (no-slip condition) is considered at the workpiece surfaces.
Results and discussion
Effect of parameters on dielectric fluid flow
The effect of different parameters on the dielectric flow in the gap is studied using different slotted tools. The ADV and the dielectric flow pattern in the gap are calculated and are discussed at length in this section.
Tool rotation
The velocity of the dielectric at the IEG is greatly influenced by the rotational speed of the tool. The values of the ADV at the IEG for various slotted tools when the gap width is 50 µm is given in Figure 2. The tool rotational speed considered is 100, 500, and 800 rpm and the dielectric injection velocity is constant at 0.01 cm/s. It is seen that the ADV is higher near the tool and it is lower near the workpiece for all the tools except the slotted tool 4 as shown in the figure. At lower speed, the variation in velocity is less while it is large at higher tool speed. The dielectric in the proximity of tool, inside and outside the slot experiences higher centrifugal force and hence its velocity is higher. The next subsequent fluid layers get necessary drag from the streamlines in proximity of the tool and due to this, the velocity reduces toward the workpiece. As the centrifugal force depends on the speed and radius of rotation, the velocity of the fluid in the slot is less as compared to the velocity outside the slot due to a decrease in the radius equal to slot height. The presence of the slot reduces the velocity of the dielectric in the IEG. In tool number 4, the ADV at the workpiece surface is more as compared to near the tool which is exactly opposite for all other tools. The velocity at the center of the slot is minimum and this is due to the vortex flow created in the slot as the height of slot is more as compared to width.
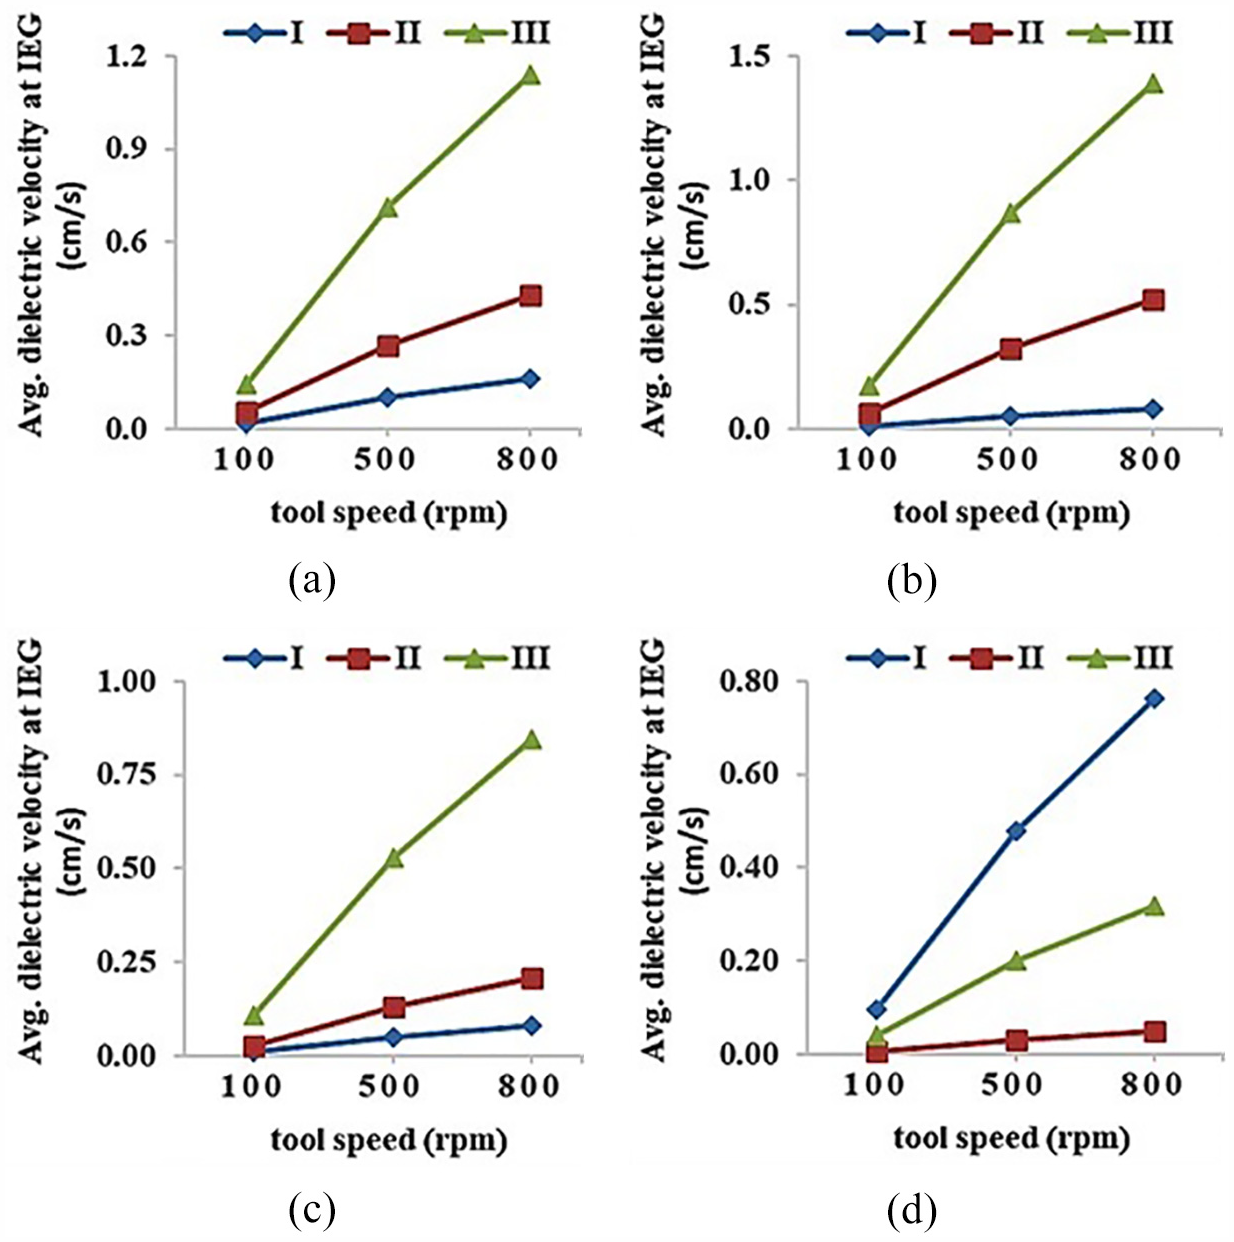
Effect of tool rotation speed on the average dielectric velocity at the IEG: (a) slotted tool 1, (b) slotted tool 2, (c) slotted tool 3, and (d) slotted tool 4.
Interelectrode gap
The gap width is varied and its effect on the ADV at the IEG is calculated at the tool speed of 500 rpm as given in Figure 3. The IEG size selected are 30, 40, and 50 µm with the equivalent tool diameters of 540, 520, and 500 µm to have a constant µchannel width of 600 µm. The inlet velocity of the dielectric is kept constant at 0.01 cm/s. It is seen from the figure that at position III near the tool as the IEG size increases the ADV decreases for all the slotted tools. This is due to the decrease in the tool diameter and the corresponding decrease in the centrifugal force acting on the dielectric. At positions I and II, the ADV slightly increases with the increase in the IEG size. This is due to the higher dielectric flow in the IEG due to the larger gap width. The flow-field in the case of slotted tool 4 is different as compared to other tools as discussed earlier due to vortex flow in the slot. As the variation in velocity is less even with the small gap width, the flushing will be effective. When compared with the ADV in the IEG using cylindrical tool, 25 the velocity in case of slotted tool is less for dissimilar gap width. The reason is vortex flow in the slot which reduces the velocity. The dielectric is unable to reach the sharp corners of the slot creating void in the slot.
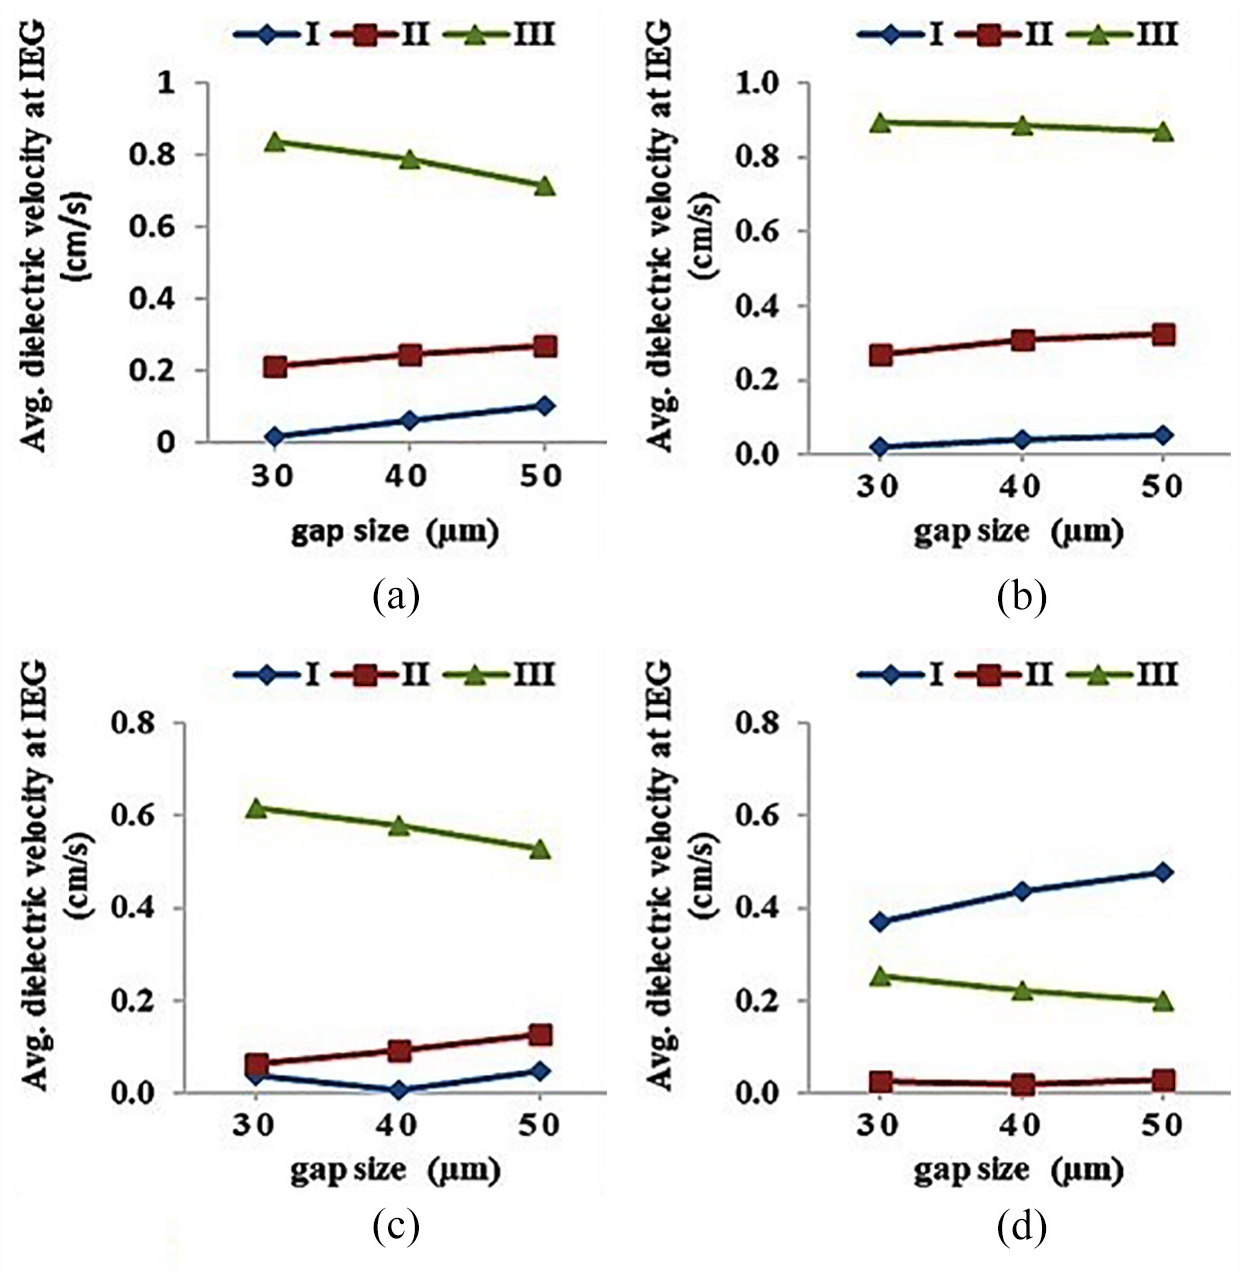
Effect of gap size on the average dielectric velocity at IEG: (a) slotted tool 1, (b) slotted tool 2, (c) slotted tool 3, and (d) slotted tool 4.
Nozzle inlet velocity
The nozzle inlet velocity is the dielectric velocity at the entry of the µchannel to ensure recirculation and flushing of debris. Its effect on the ADV at the IEG is studied. The velocity contour plots of the dielectric flow of slotted tool 1 for various nozzle inlet velocity is shown in Figure 4. The inlet velocity is varied from 0.001 to 50 cm/s and gap width is kept constant at 50 µm. It is seen that when the velocity rises from 0.001 to 10 cm/s, the ADV in the IEG is constant irrespective of the tool speed. However, when it rises above 10 cm/s, there is a small drop in the ADV. This shows that the tool rotation is the major driving force to increase the dielectric velocity in the IEG. The slots on the cylindrical tool create stirring action and disturb the uniform rotational flow. Due to this, the direction of the fluid changes and it reduces the velocity of the flow. At low inlet velocity, a vortex is seen at the back of the tool similar to the results obtained for cylindrical tool. However, the vortex formed is not symmetrical as in case of cylindrical tool. It is elongated at one end toward the gap inlet and its center is slightly shifted. Increasing nozzle inlet velocity above 1 cm/s, most of the dielectric flow back from the outlet section without affecting the velocity at the IEG.
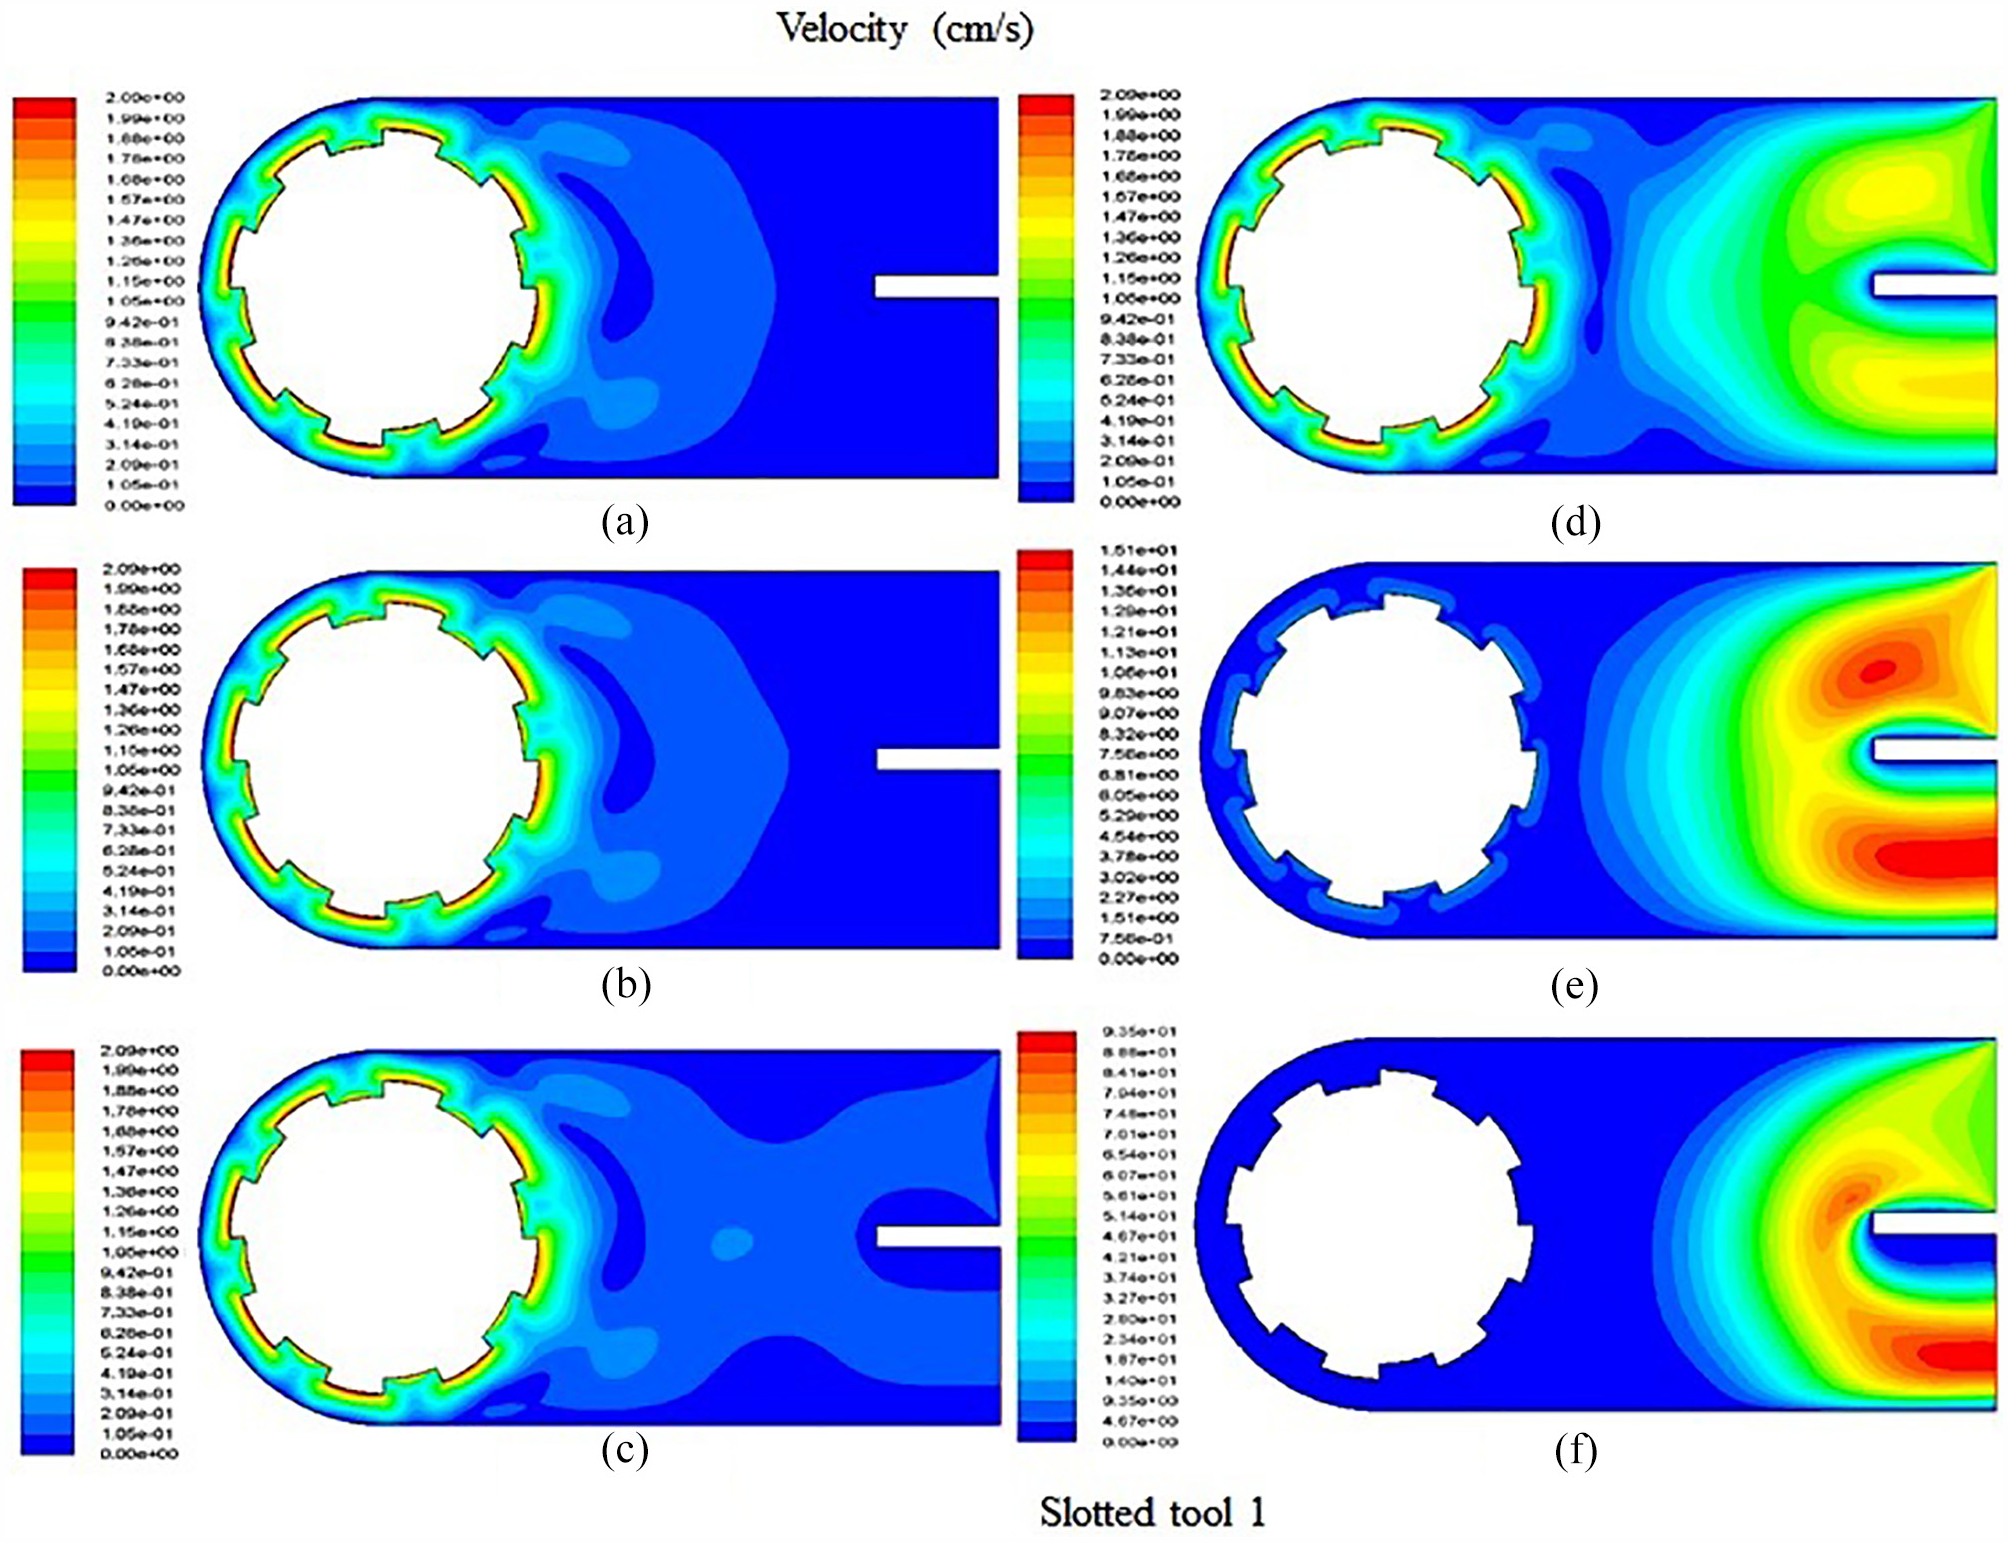
Contour plot showing velocity of the dielectric at various nozzle inlet velocity: (a) 0.001 cm/s, (b) 0.01 cm/s, (c) 0.1 cm/s, (d) 1 cm/s, (e) 10 cm/s, and (f) 50 cm/s.
Different shapes of tool
The effect of different shapes of the tool on the flow-field in the IEG is studied. The contour plots showing static pressure and velocity of the dielectric in the slots of different tools at a tool speed of 800 rpm is shown in Figure 5. A large pressure difference is observed in the slot of all the tools. The pressure is maximum on the corner and the edge of the slot (representing the height) in the direction of the flow. While the vacuum or negative pressure is observed on the opposite edge of the slot as shown in Figure 5(a). This is because the dielectric fluid entering the slot fails to contact the sharp corner due to perpendicular slot edges. In addition to that, when the fluid moves from a larger section to a smaller section there is vortex flow at the corners reducing the pressure in that region. When the width of the slot is more (slotted tool 2) the pressure in the slot is equally divided into low and high pressure. With the increase in the height of the slot (slotted tool 3) pressure in the slot increases. The dielectric velocity pattern in the gap varies considerably with the shape of the slot as shown in Figure 5(b). With the increase in the slot height, dielectric velocity decreases and vortex flow is observed in the slot as in slotted tool 4.
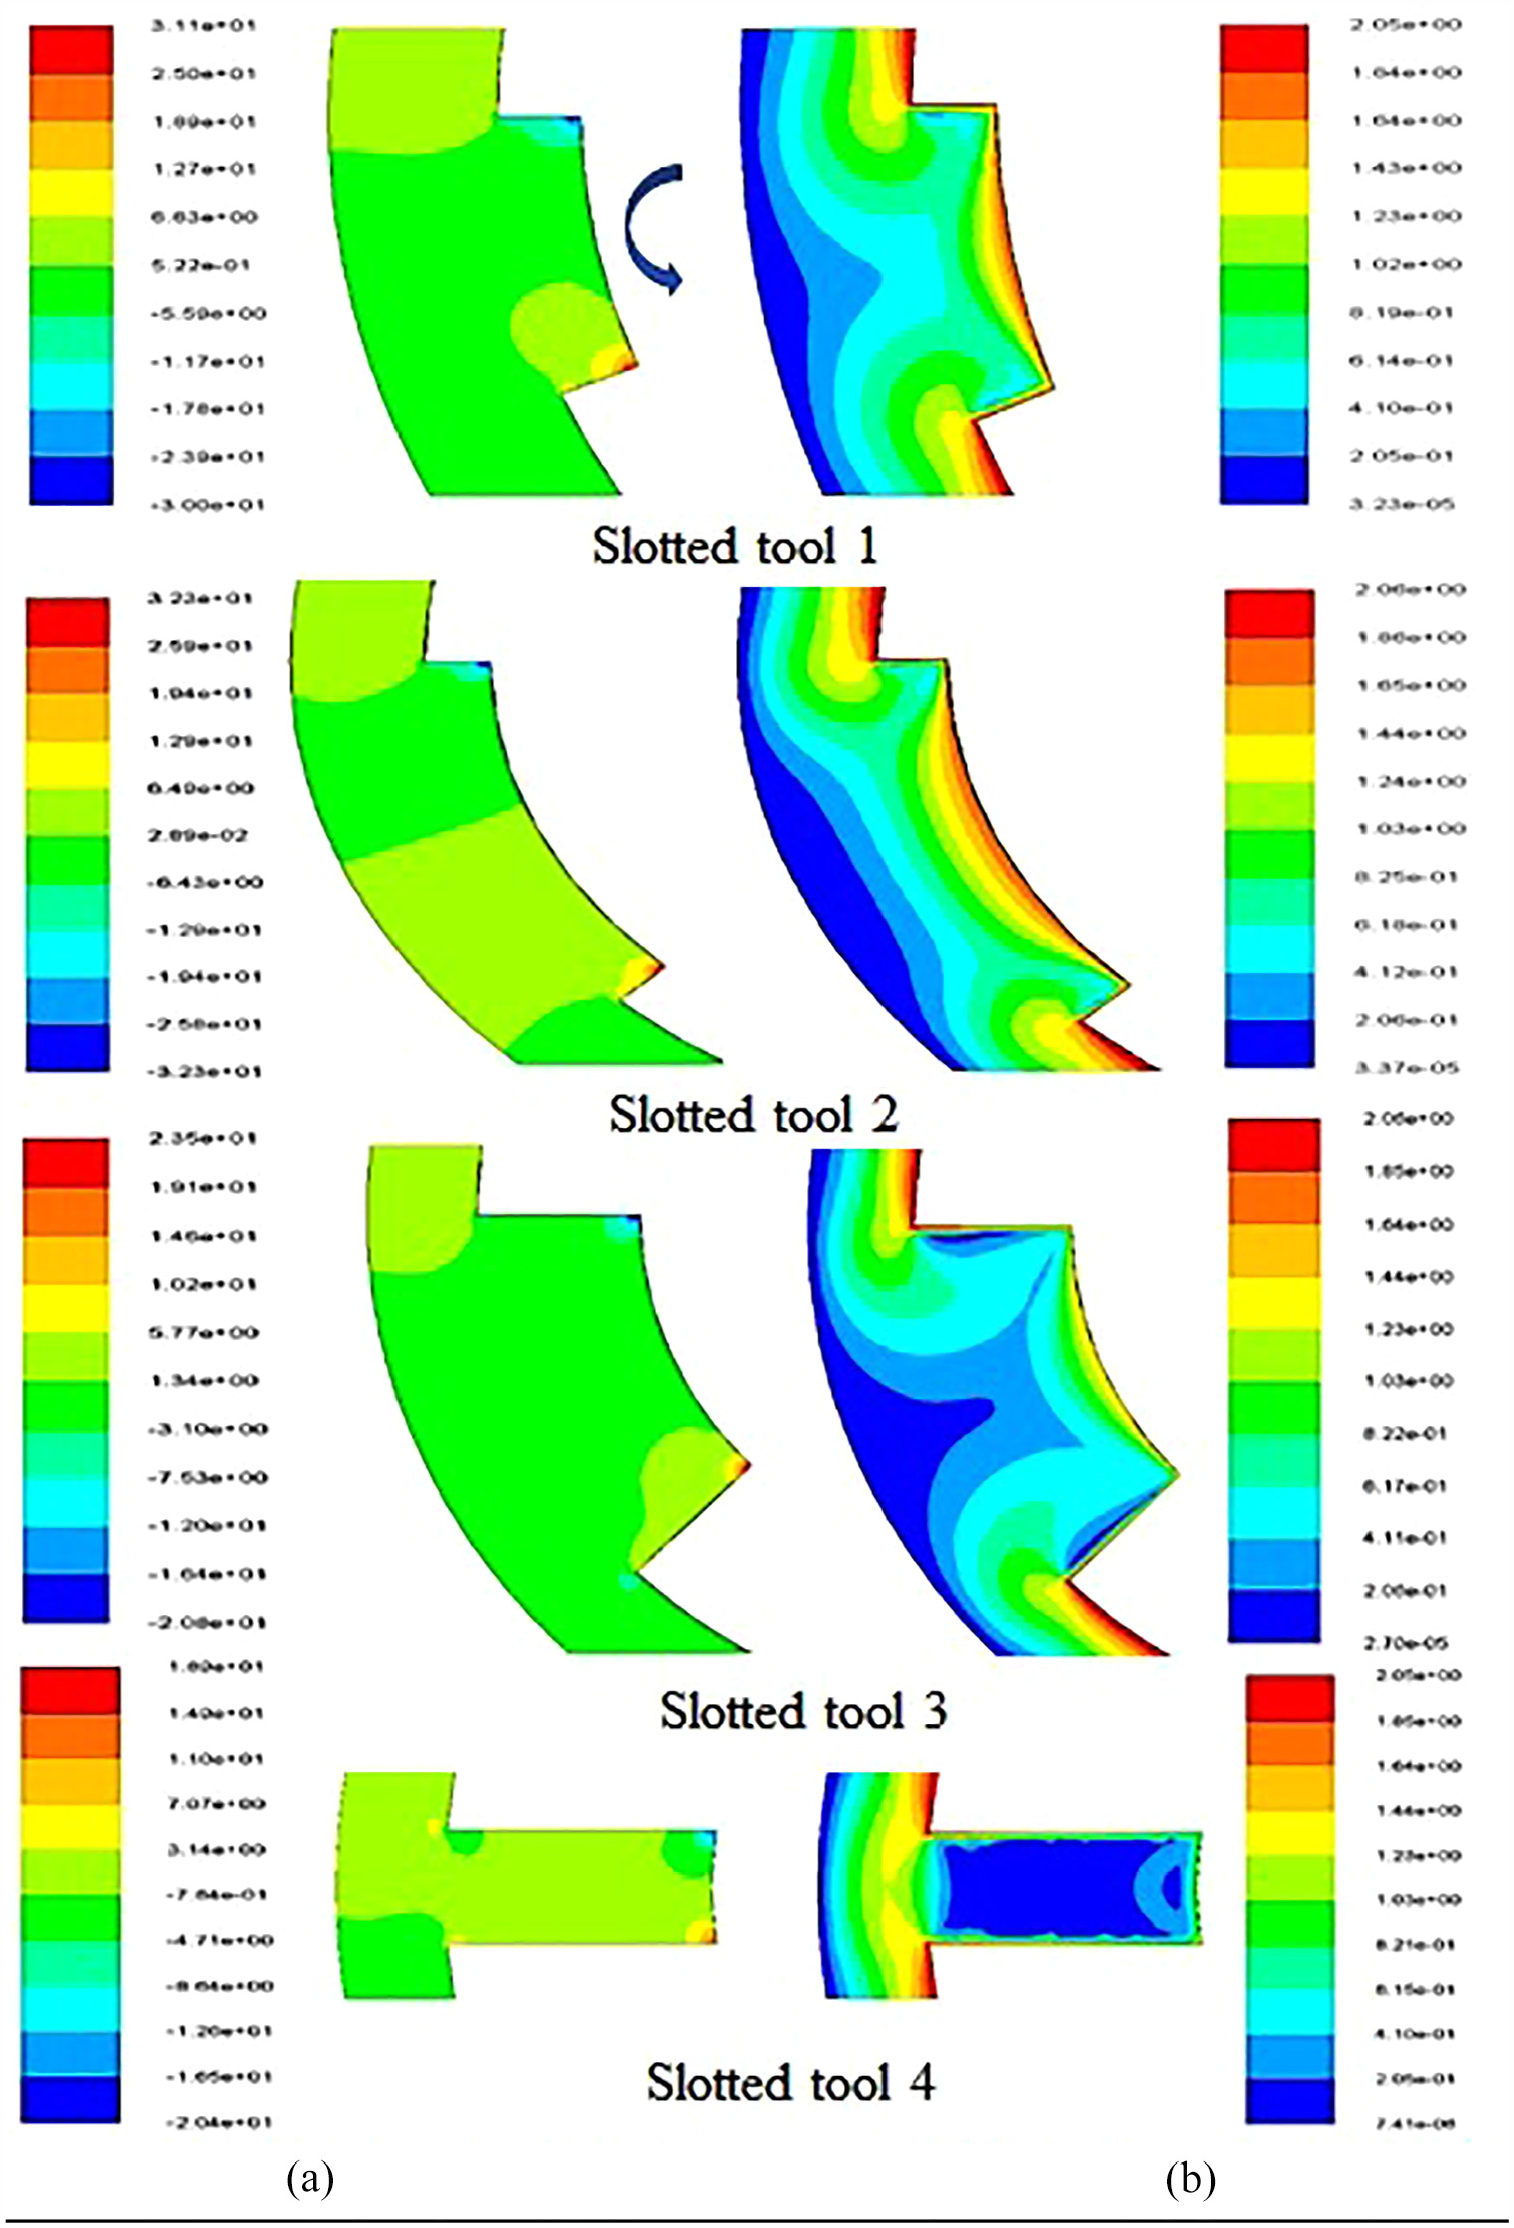
Contour plots showing: (a) static pressure (Pa) and (b) velocity of dielectric in the slots of various slotted tools (cm/s).
Debris particles
Trajectory of debris particles
The trajectory of the particles is studied by injecting the spherical steel particles of 8 μm diameter from different positions of the workpiece surface as shown in Figure 1. The debris particle size of 4, 8, and 12 μm is selected and the number of particles is calculated by taking ratio of volume of crater/volume of a debris particle. The volume of the crater due to meltingis calculated as:

where Ee is erosion energy, Vexp is experimental erosion volume, ρ is the density, Hm is the melting enthalpy of the workpiece material. 26 From this, the volume of crater for a single discharge is calculated from the known input energy.
Limited particles are injected to find the trajectory of particles and to circumvent flooding in the IEG. The trajectory of the particles in the gap and the slot of the tool are represented in Figure 6. When the particles are released with low velocity then, it travels a few distances in the gap and gets dragged from that position due to dielectric flow. In this case, particles do not enter the slots of the tool as the dielectric velocity at the periphery of the tool is higher. It continues to rotate around the tool making few rotations and finally gets stuck in the vortex. However, when the particles are injected with a higher velocity, it enters the slot as shown in Figure 6. This can happen in the μED-milling process where the debris is ejected with very high velocity due to the sudden breakdown of the bubbles.
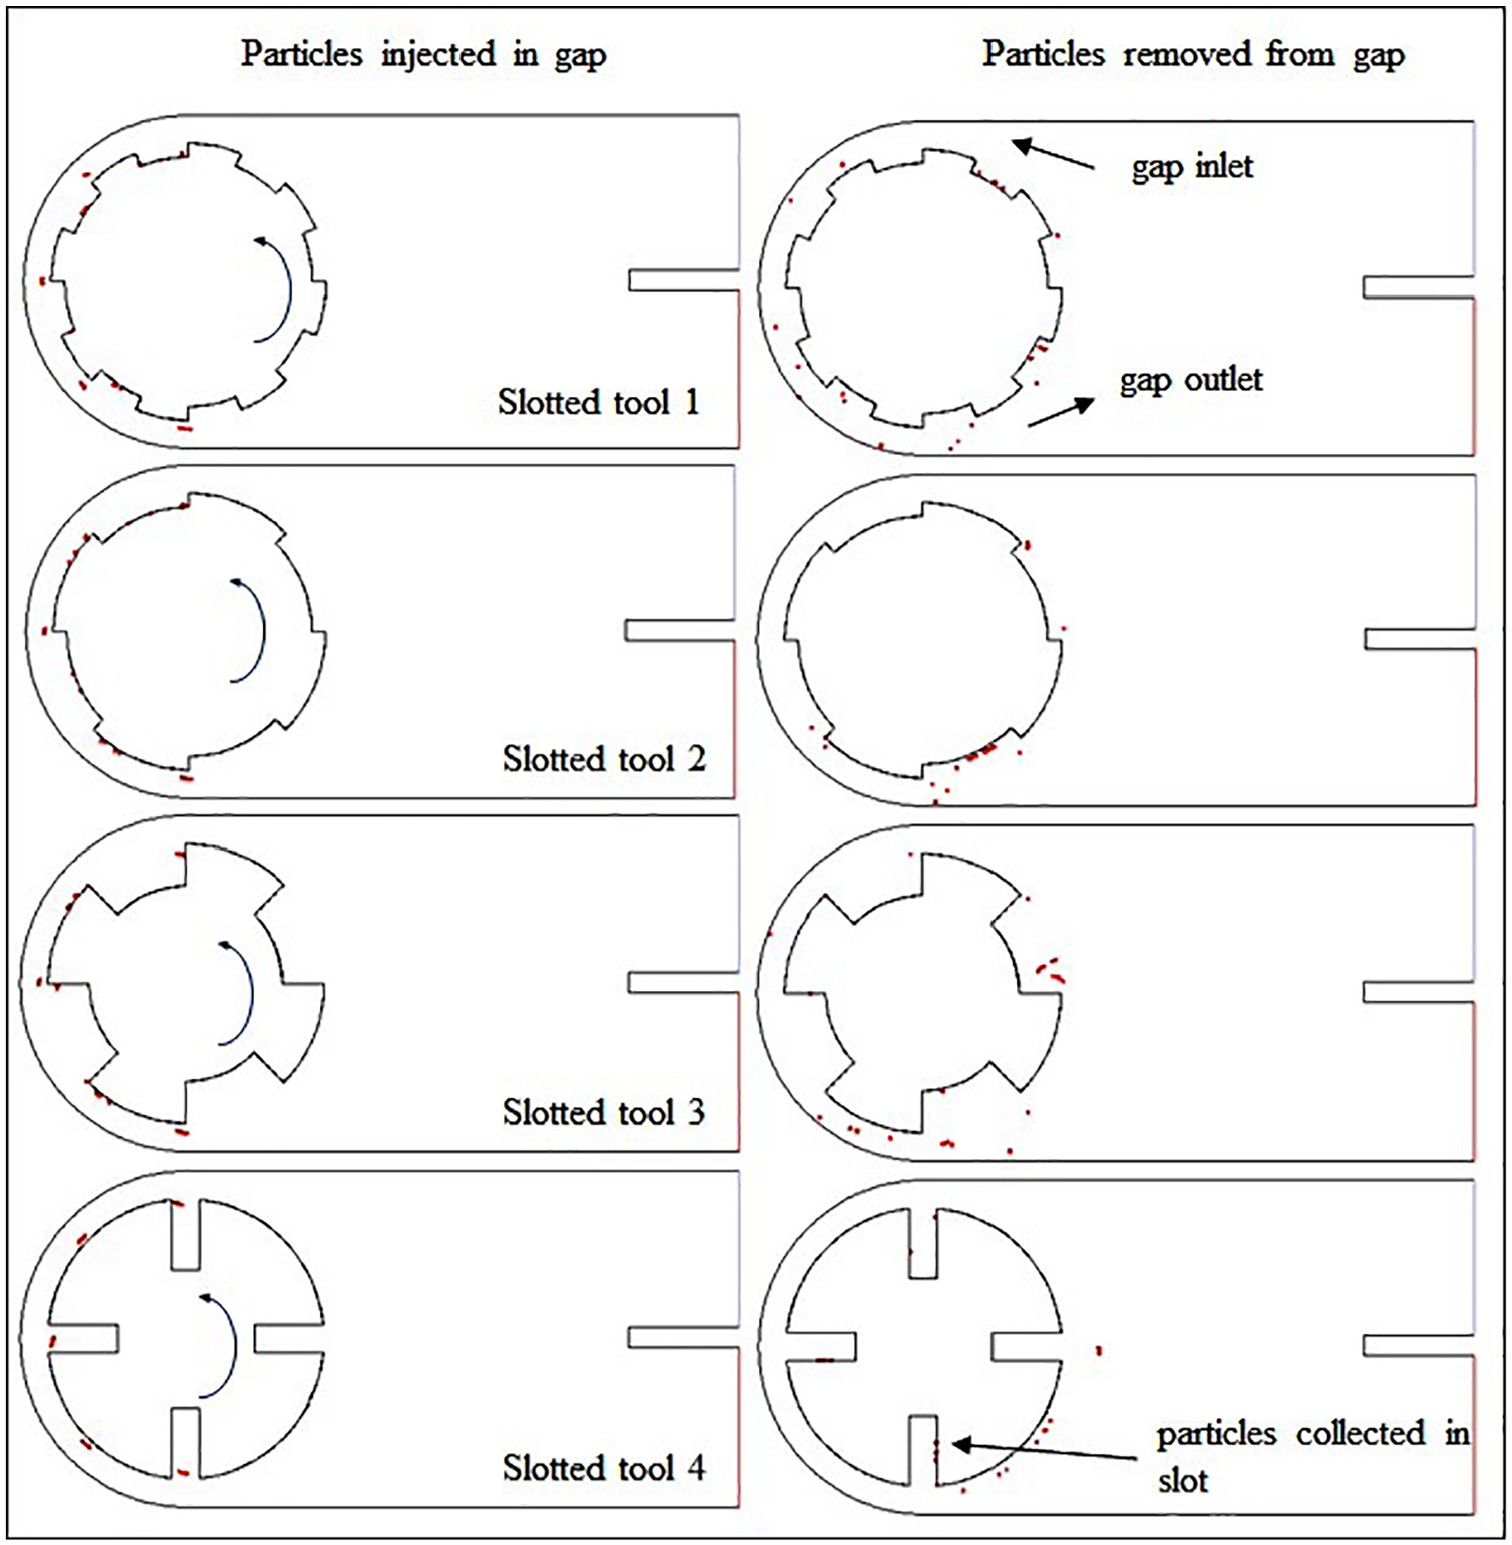
Trajectory showing particles injected and removed from the gap.
In the case of slotted tools 1 and 2, as the slot height is small the particles released from the workpiece fail to collect in the slot. They travel around the tool and get scattered by the stirring action of the tool. In slotted tool 3 as the slot width is more the particles get collected in the slot at the IEG and with the rotation of the tool it gets ejected at the rear side of the tool. This enhances the particle removal from the IEG. In slotted tool 4, the particles collected in the slot are unable to move out of the slot as the velocity is higher at the outer periphery of the tool. This is necessary to collect and remove maximum particles from the IEG. Particles are continuously collected in the slot reducing the concentration of particles in the IEG. These particles collected in the slot do not affect the sparking process, as the gap width is higher near the slot.
Determination of cooling rate using simulation
The particles of various diameter (4, 8, 12 μm) are injected from the workpiece surface with a temperature of 15,000 K. The particle is injected after 60 s so that the maximum velocity of the dielectric is attained in the IEG. The particle is injected with a high velocity so that it will reach the desired position in the IEG (I, II, III). This is essential to study the cooling rate and the distance traveled by the particle when it is initially present at a different position in the IEG. The time required by a particle to attain the temperature of dielectric (300 K) is given in Figure 7. When the particle of the same size travels from a different position in the IEG the time for cooling is nearly the same. However, with the increase in the size of the particle the time for cooling increases. The particle of size 4 μm cools rapidly as it comes in contact with the dielectric while the particle of 12 μm takes some time to cool. The reduction in temperature is very high when the particle in the first instance comes in contact with the dielectric, later the heat transfer rate reduces.
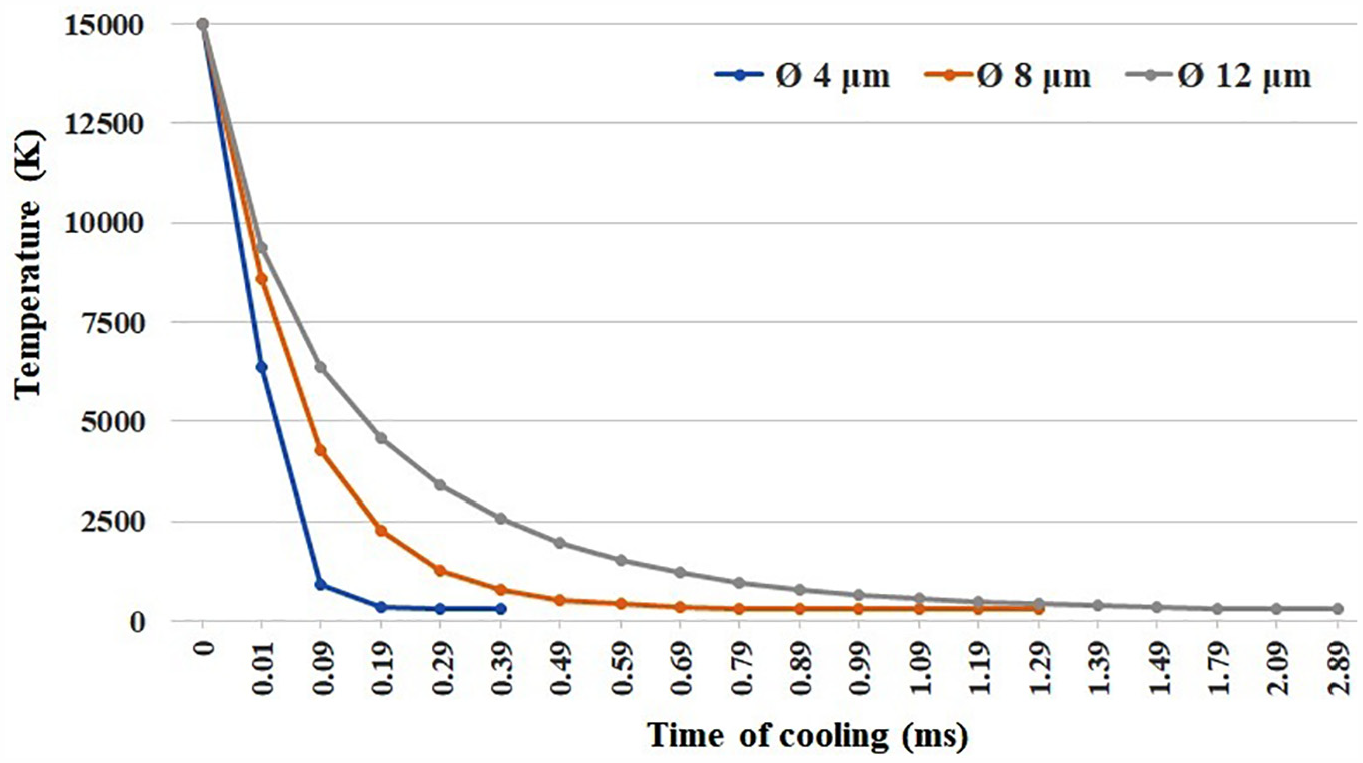
Time required for cooling of a particle initially at 15,000 K of various size.
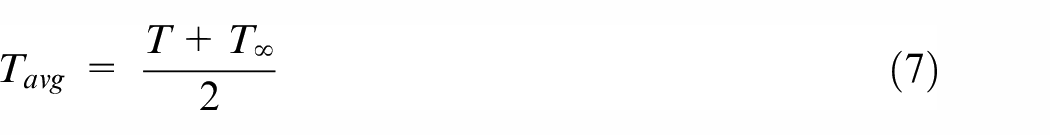
The temperature of the particle immediately after injection and its temperature after traveling some distance before cooling in the IEG is given in Figure 8(a) and the trajectory followed is shown in Figure 8(b). The distance traveled by the particle during cooling is given in Figure 8(c). The initial and the final coordinates of the point are plotted in the AutoCAD software and the arc is drawn. The length of the arc represents the distance traveled and the trajectory of the particle. It is seen that if the particle is near the tool it covers longer distances irrespective of the size of the particle. And if the particle is near the workpiece it travels small distance and cools rapidly as the velocity of the dielectric is less. This is similar to the results obtained for cylindrical tools. 22 The trajectory of the particle near the workpiece shows that the particle is dragged toward the center of the IEG due to the higher velocity of dielectric in that region. When the particle is not injected with a high velocity then it fails to move out of the workpiece surface. At the position of the injection, if the temperature of the workpiece surface is very high then the temperature of the dielectric surrounding it increases as shown in Figure 8(d). If the particle is present in this zone, then it is heated to a higher temperature. With the travel of the particle out of this zone its temperature decreases. These particles which are near to the workpiece and are at sufficient temperature get stick to the nearby workpiece surface.
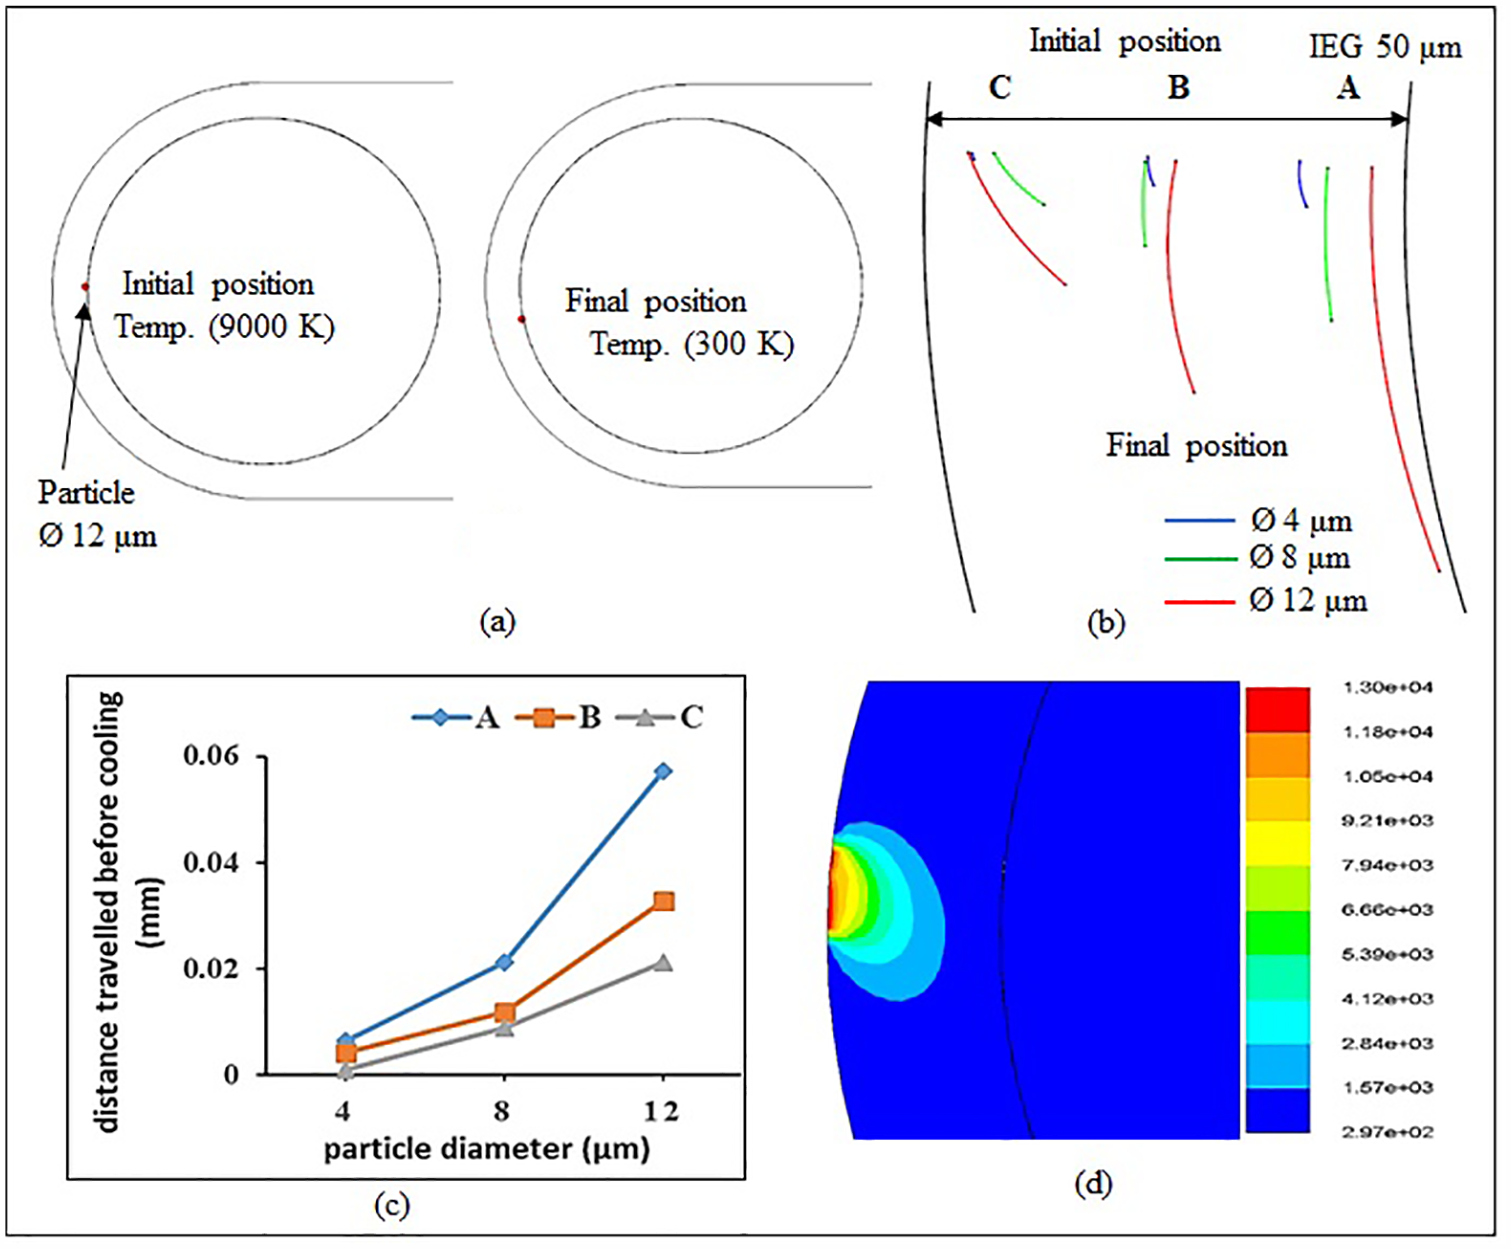
Plot showing: (a) particle temperature and its motion in the IEG, (b) trajectory of the particles before cooling in the IEG, (c) distance traveled, and (d) temperature distribution in the IEG.
Determination of cooling rate using the analytical method
In the analytical method, a single spherical particle is assumed stationary in the μchannel at a temperature (T = 15,000 K). Kerosene flows at a temperature (
The Reynolds number of the flow is calculated as
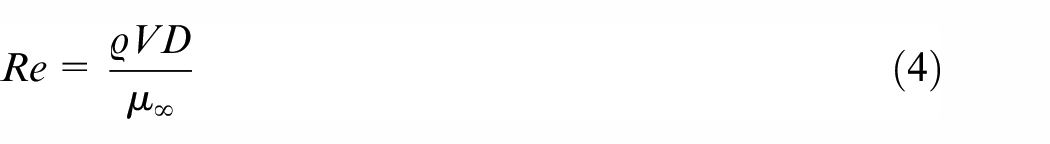
where ϱ, V,
The Prandtl number is calculated as
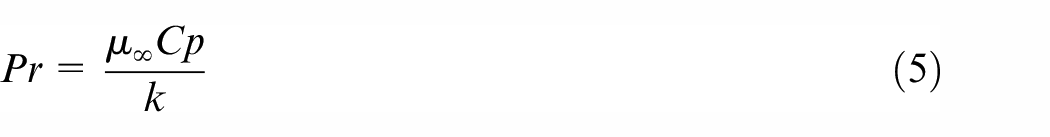
where Cp and k are specific heat and thermal conductivity of kerosene.
According to Whitaker, the Nusselt number for flow over spherical shape is given by 27
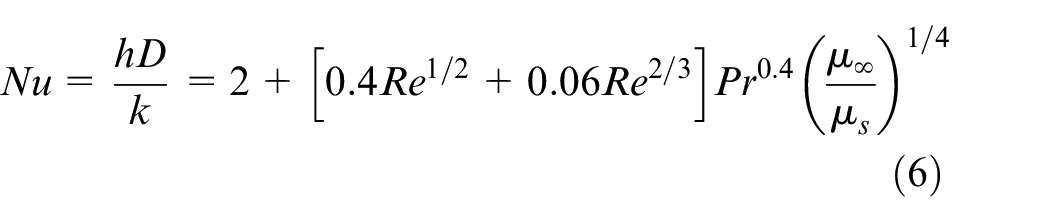
where h is the avg. heat transfer coefficient and
The surface area of a particle is calculated as

where r is the radius of the particle
The average rate of heat transfer is calculated as 27

Total heat transferred from the particle which is a variation in the particle energywhen it cools from 15,000 to 300 K is calculated as

where m is the mass of the particle
Time of cooling of the particle is calculated as 27
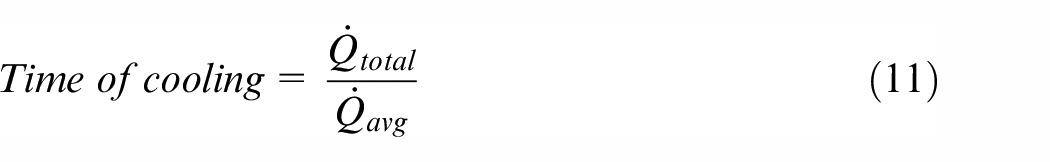
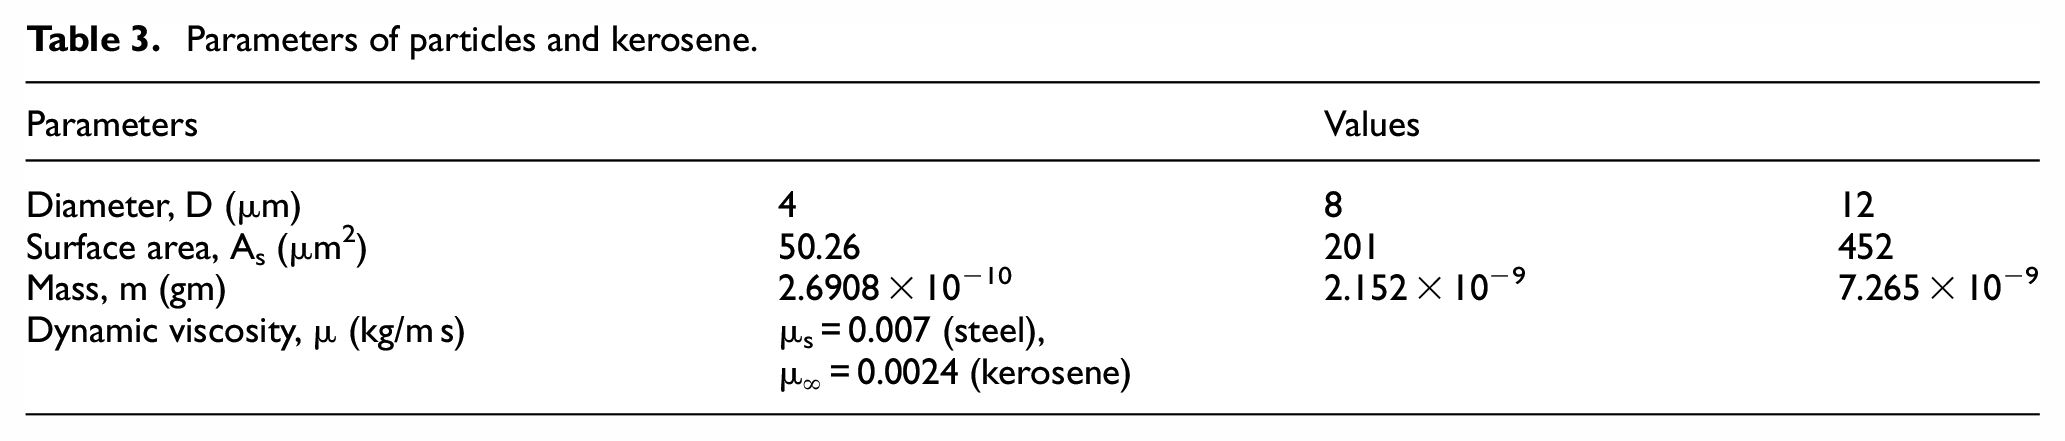
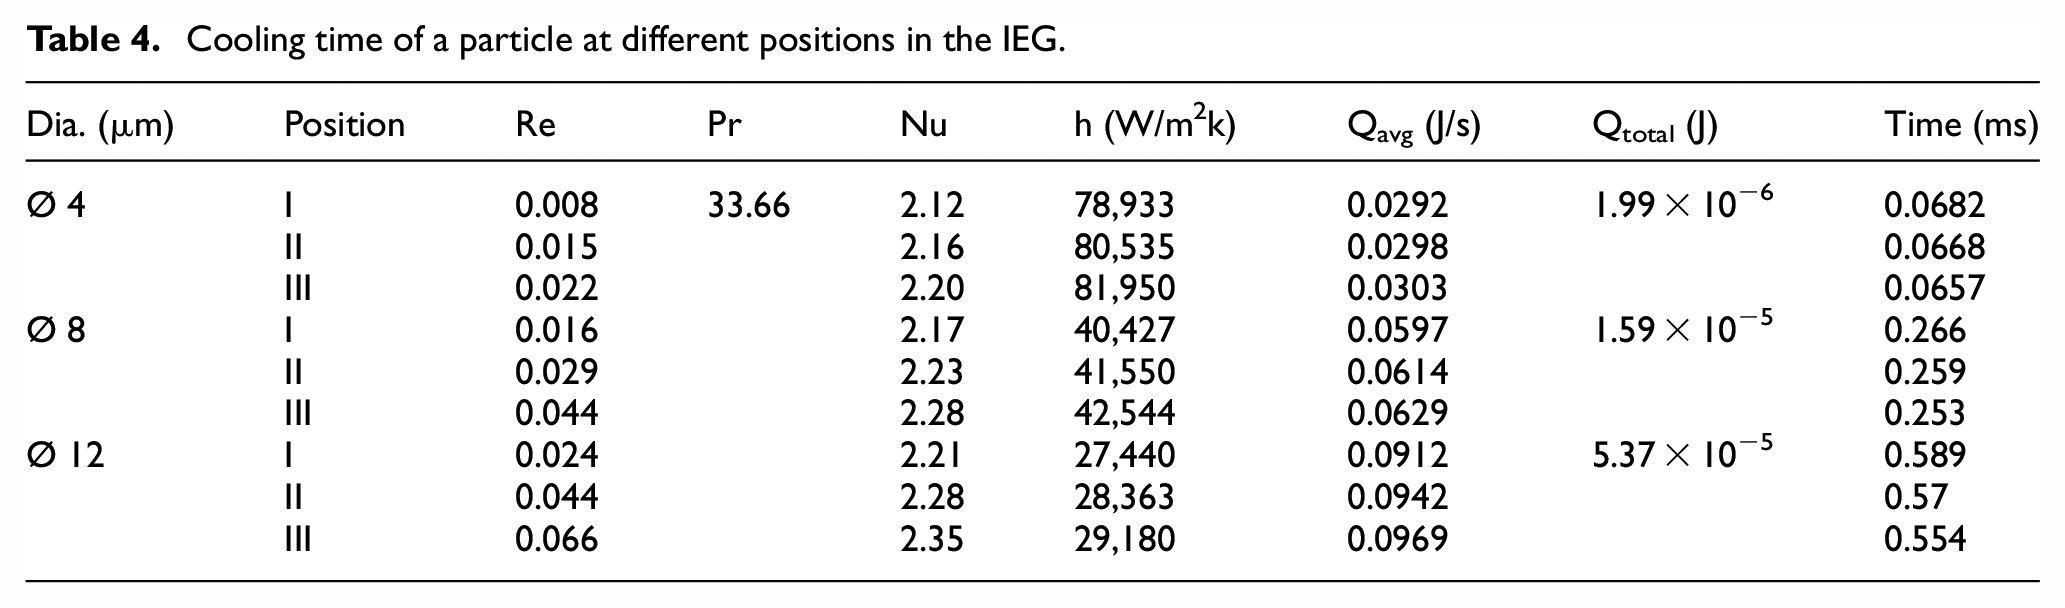
In this manner, the time of cooling of a particle of different sizes is calculated. The different values of particle and kerosene are given in Table 3 and the time for cooling of the particle is given in Table 4. The distance traveled by the particle before cooling is calculated by taking the product of the time and velocity of the particle. The velocity of the particle is assumed equal to the dielectric velocity. The velocity values in the table show the ADV at a different position in the IEG.
Parameters of particles and kerosene.
Cooling time of a particle at different positions in the IEG.
Comparison
The ADV is maximum in cylindrical tool in comparison with the slotted tool for various input conditions as discussed earlier. However, in spite of the higher velocity, the debris removal rate in case of slotted tool is higher due to stirring action caused by slots. The accretion or the deposition rate of the debris particles on the workpiece is less in slotted tool as against cylindrical tool due to effective flushing of debris. Accretion of the debris is predominantly observed on the inner faces of the slots due to accumulation of debris and this does not affect the workpiece surface. While using cylindrical tool, most of the accretion occurs on the workpiece surface making the μchannel tapered.
The comparison between the analytical and simulation method is represented in Figure 9. It reveals that the analytical method showed less value of time as compared to the simulation result. This is due to the assumption made in the analytical approach that the particle is stationary while in the simulation it is moving. In addition to this, it will be imprecise to specify that the time for cooling the particle of a particular size to be the same by an analytical approach. Taking this into consideration, it can be observed from the figure that when the particle size is small, two methods shows close resemblance and with the increase in the particle size, the variation increases. This is due to the underlying assumptions and boundary settings of the model. As the particle size is very small and it is at a very high temperature it cools within a few milli-seconds due to large temperature differences. The experimental method to find the cooling rate of the micro size debris particles is a difficult task. In μED-milling, micro and nano size debris particles are formed in large number which shows the acceptance of these results.
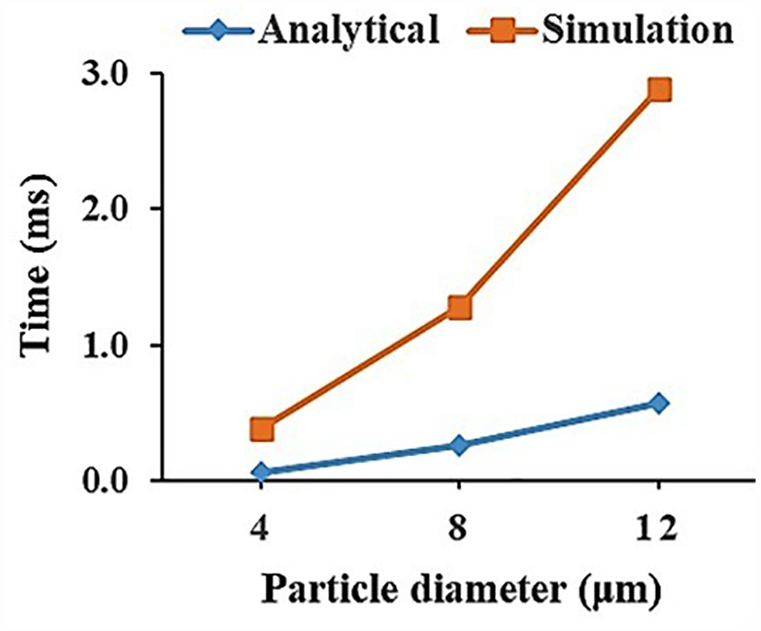
Comparison of the cooling time using analytical and simulation method.
Conclusion
The study of dielectric flow-field, debris particle movement, and cooling rate in the gap is carried out using the slotted tool. The effect of tool rotation speed, gap size, nozzle inlet velocity on the dielectric velocity in the IEG is investigated. The particles cooling rate is calculated using the analytical and simulation method. Following conclusions are drawn:
The tool rotation is the key driving force to increase the dielectric velocity in the IEG. Large pressure and velocity variation are detected in the slot due to a sharp variation in the dielectric flow direction.
The slotted tools are found efficient as compared to cylindrical tool in debris flushing as the slot provided accumulates the debris particles. The slotted tool 4 is found best, as the ADV is maximum near the workpiece as compared to other tools. Besides, the vortex flow observed in the slot collects the particles entered the slot and the particles are not ejected as high dielectric velocity surrounds the periphery of the tool. Due to this, maximum particles are removed from the gap.
The particle cools at a very high rate and the distance traveled mainly depends on the initial particle position in the IEG. The analytical approach agrees well with the simulation for particles of small size.
The CFD simulation of the dielectric flow-field and debris cooling rate can be verified by the experimental method which is quite difficult task due to small IEG. This requires a special microscopic lens with high-speed camera arrangement to capture the images which can be the upcoming opportunity for investigation.
Footnotes
Declaration of conflicting interests
The author(s) declared no potential conflicts of interest with respect to the research, authorship, and/or publication of this article.
Funding
The author(s) received no financial support for the research, authorship, and/or publication of this article.