
Abstract
To cope with an increasingly competitive market environment, manufacturers are utilizing modular technology to guide the production process, and a vital activity in the module partition is to determine the optimal granularity levels. A modular design methodology is developed for obtaining the optimal granularity of a modularized architecture in this paper. A relationship extraction solution is executed to automatically construct the design structure matrix (DSM) from the 3D CAD assembly model. Hierarchical clustering algorithm is implemented to form a hierarchical dendrogram with different granularity levels. An improved Elbow method is proposed to determine the optimum granularity level and corresponding modularity spectrum during the dendrogram process. The computational framework for hierarchical clustering and modularization with improved Elbow assessment operators is explained. Based on a existing literature example and a jaw crusher modular design case, comparative studies are carried out to verify the effectiveness and practicality of the proposed method. The methodology is characterized by running independently on the computer in data visualization format without human involvement, and the obtained result with optimized granularity favor further modular design work.
Keywords
Introduction
The consumer demands for product variety and upgrade have been increased dramatically, driving most enterprises to develop products with modern design theories and methods. 1 Among various design technologies, modular design is considered as an efficient solution to address the problem of design for variety. 2 The modular design is a way that divides a system into smaller parts or modules that could be independently produced and combined to fulfill various customization requirements. 3 As a modern design methodology, it can effectively support the product variety and design for mass customization (MC), 4 facilitate product maintainability, 5 and promote product sustainable 6 and environmentally friendly 7 development. The granularity in module partition describes both the number and the size of the blocks. 8 Generally speaking, the module at a higher level of granularity is more abstract, whereas a lower granularity matches a detailed module assembly. Different module granularity levels influence the design process simulation, 9 design tasks sequencing, 10 and recovery profit. 11 Therefore, an appropriate module granularity level will be benefit for the system modularization architecture.
Aware of the special significance of granularity in modular design, scholars have proposed various approaches to identify optimum module granularity. To figure out how modular granularity affects modularity, Chiriac et al. 8 tested the impact of a wide range of module granularity on the modular quality. However, a quantitative analysis is still absent on which level of granularity is the most suitable for a modularity architecture. Tilstra et al. 12 presented the high-definition design structure matrix for modeling product architecture, facilitating to put complex model into a highly detailed sub-model. Although specific granularity is conducive to modeling tasks, an overly detailed granularity may beyond the cost in real-life situations. Algeddawy and Elmaraghy 13 utilized the Cladistics tool to generate a phylogenetic tree by hierarchically setting different entities into subsets. Each possible granularity level is evaluated by the Modularity Index (MI), enabling the selection of optimum granularity. However, the specialized Biology classification tool may be hard for the engineer to operate on. Li et al. 14 developed a method to cluster component into multiple dendrogram level. To evaluate the granularity of modules, the distance in the vertical axis is divided into several sections, and each corresponding granularity level is measured by the modularity index Q. Likewise, based on graph clustering analysis, Qin et al. 15 managed to design a product platform for the product family development and mass customization. In order to acquire various clustering granularity, the branch in the minimum spanning tree with the longest link value is cut off firstly, and then the same step continues with the next longest distance. However, there is a risk in the above two articles that because of the distinct and interval-based threshold distance values, the potential optimal module number might be skipped. In this paper, the hierarchical clustering algorithm is employed to shape module scheme with multiple levels of granularity, and each possible granularity is evaluated simultaneously with the clustering process to avoid the risk of missing modular granularity results.
As the foundation and premise of modularization analysis, component corelationship should be set up first. The majority of current approach rely on experienced designers and manual operation. 16 That might be a cumbersome, time-consuming process, and an operator might miss connection or make mistakes. 2 Meanwhile, researchers have put attention on correlation extraction from the CAD assembly model. By computing the relative degree of freedom (DoF) between two assembled parts sharing a set of interfaces, Li and Xie 16 proposed a method to search and expose the adjacency relationships within the assembly model. However, the mapping relationship between DoF and relation types involves human judgment. Compared to the relative DoF requiring assembly constraint, the mate extraction method in their work focuses on the geometrical structures feature between two related parts. Deshmukh et al. 17 conducted a system for performing content-based mate searching on assembly models. However, the mate characteristic of an assembly is not usually explicitly stored in CAD files. Thus, the engineer has to put in additional work to fulfill particular characteristics, which may hinder its wider applications. In addition, Mathew and Rao 18 executed an algorithm to identify connections within assembled parts. With the help of Visual Basic linking to the feature tree of SolidWorks assembly model, the mate connection information between components was extracted and saved in a database. In the same way, Hasan et al. 19 proposed a B-rep feature recognition algorithm that successfully extracted mates from a 3D assembly model. Their algorithm can extract the geometry features, topology features, and mate information through Application Programming Interface (API) techniques from the Feature Manager Design Tree. Nonetheless, above approaches also have their limitations that require the designer to assemble components in a constrained manner. Moreover, information data maybe incomplete for the reason that the designer might not be able to define all possible assembly mates, otherwise, the 3D assembly model would be overdetermined. 20 In our work, a broad applicability method was proposed to automatically capture connection relationships from the CAD model.
Apart from component correlation modeling, modularity evaluation for hierarchical architecture decomposition is another vital part during module partition. Aiming to facilitate module combination and replacement, the ideal module partition is often with the maximum internal relationship and the minimum external relationship.
14
To achieve such structure, some assessment indexes are adopted to select optimal module partition spectrum. These indexes, take a specific objective function for clustering evaluation, can be broken down into two categories: data-based index and connection-based index. The data-based index focuses on the cohesion structure between elements, including the Silhouette(Sil) method,
21
the Calinski-Harabasz (CH) index,
22
the Gap-statistic method (Gap),
23
the Davies-Bouldin (DB) index,
24
and the elbow method (EM).
25
The connection-based index tend to reduce the interactions between different modules in DSM topology such as the modularity index (MI),
13
the minimum description length (MDL),
26
the integrative complexity (IC),
27
and the modularity index Q.
27
Apart from the above index, a formula recommends the square root of half the number of components as the potential number of modules.
28
Besieds, for a product with N parts, a formula assumes that the possible range of modules between
How to extract the correlation automatically with the CAD assembly model and store them in a DSM, and then figure out the moderate granularity of modules from this DSM, are the main problem waiting to be solved in this paper. The secondary development of SolidWorks with Visual Studio tool is utilized in this paper to extract the connection relationship between the components automatically. The elbow method 31 is modified by making a ratio between generalized slope on either side of the potential elbow point to visually evaluate the granularity of each partition scheme, and achieve a trade-off modular partition between the cluster number and size. Throughout the above work, the methodology is proved to generate optimal modular granularity with 3D assembly CAD model cases. The automatic generation of correlation will significantly increase the present efficiency in DSM construction. Moreover, it is convenient to find the optimum granularity of modules with our improved elbow assessment and hierarchical dendrogram techniques for clustering data visualization.
The rest of the paper proceeds as follows: Section “Methodology” describes the related techniques, including the automatic extraction of correlation, hierarchical clustering, improved elbow assessment method, and an introduction of the modularization framework. Section “Case illustration” outlines an existed wind turbine in previous literature and results of a jaw crusher case, along with discussion of the case study. Section “Conclusions” summarize the contribution and present future research directions.
Methodology
DSM automatic generation
The DSM is a diagonal-square matrix, and its elements represent the connection relationship between component with each other. The “0” or “1” in the Boolean DSM indicates whether there is a connection between parts. As the primary feature-based design tool, SolidWorks, the industrial CAD system, has a significant benefit in that it provides an entire API techniques to extend and customize software applications. 18 The API functions are critical and essential to the development of a new application. It is often used to automatically shape component-based DSM from the assembly model. The assembly model created by CAD systems contains a great deal of potential information. It can be retrieved and then utilized to generate the DSM with the help of API techniques.
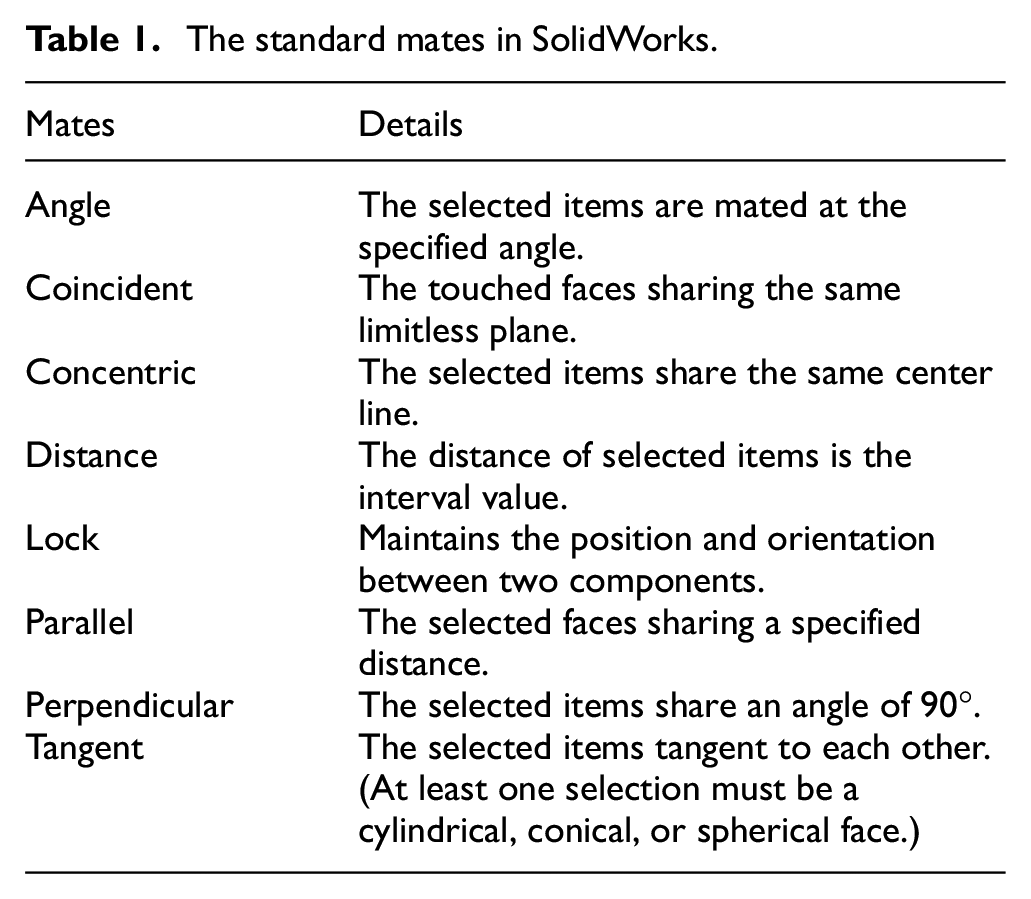
In the SolidWorks, the Standard Mates including the angle, coincident, concentric, distance, lock, parallel, perpendicular, and tangent mates. 32 Table 1 lists and describrs the standard mates. The above basic connection forms can be summarized into the following three types: the connection form of two planes, two curved surfaces, and a plane with a curved surface. In the assembly model, when two components are assembled together, some surfaces of the two components will come in contact with each other. 33 For this reason, if the distance between any two surfaces is zero, we could define that there is a connection between these two parts. It is worth pointing out that the above method is also applicable to other CAD software such as Pro/E, Unigraphics NX, and Catia.
The standard mates in SolidWorks.
The main idea of component connection extraction from CAD assembly models, is that the closest distance of connected components is zero. In other words, when the closest distance is zero, the two faces of different component contacted each other. First, the function “Get Active Object” is advanced to access the active assembly generated or imported in the SolidWorks environment. As for the face feature information extraction, “Get Bodies” and “Get Faces” function are applied to extract the parts and the faces from the assembly in turn. Afterwards, the distance between a pair of faces is calculated by the “Closest Distance” function. When a connection is detected, the extraction process will be ended up. Then, the next pair component takes the same step until all the component has been checked. The MS-Excel is utilized for data storage. Each blank will be assigned with the value of “1” when the connection relationship is recognized. The automatic generation approach of DSM is briefly shown in Figure 1, and explained below. To illustrate the method, an example of a universal joint assembly is shown in Figure 2.
Step 1: Open a CAD assembly product model in the SolidWorks software tool.
Step 2: Obtain the total number (N) of parts in the assembly.
Step 3: Create a matrix
Step 4: For i = 1 to N, j = 1 to N.
Step 5: If i = j, then go to Step 7.
Step 6: If i ≠ j, calculate the closest distance between part i and j, when the value is zero, then go to Step 7, else go to the next pair component.
Step 7:
Step 8: Export the matrix data to a MS-Excel file.
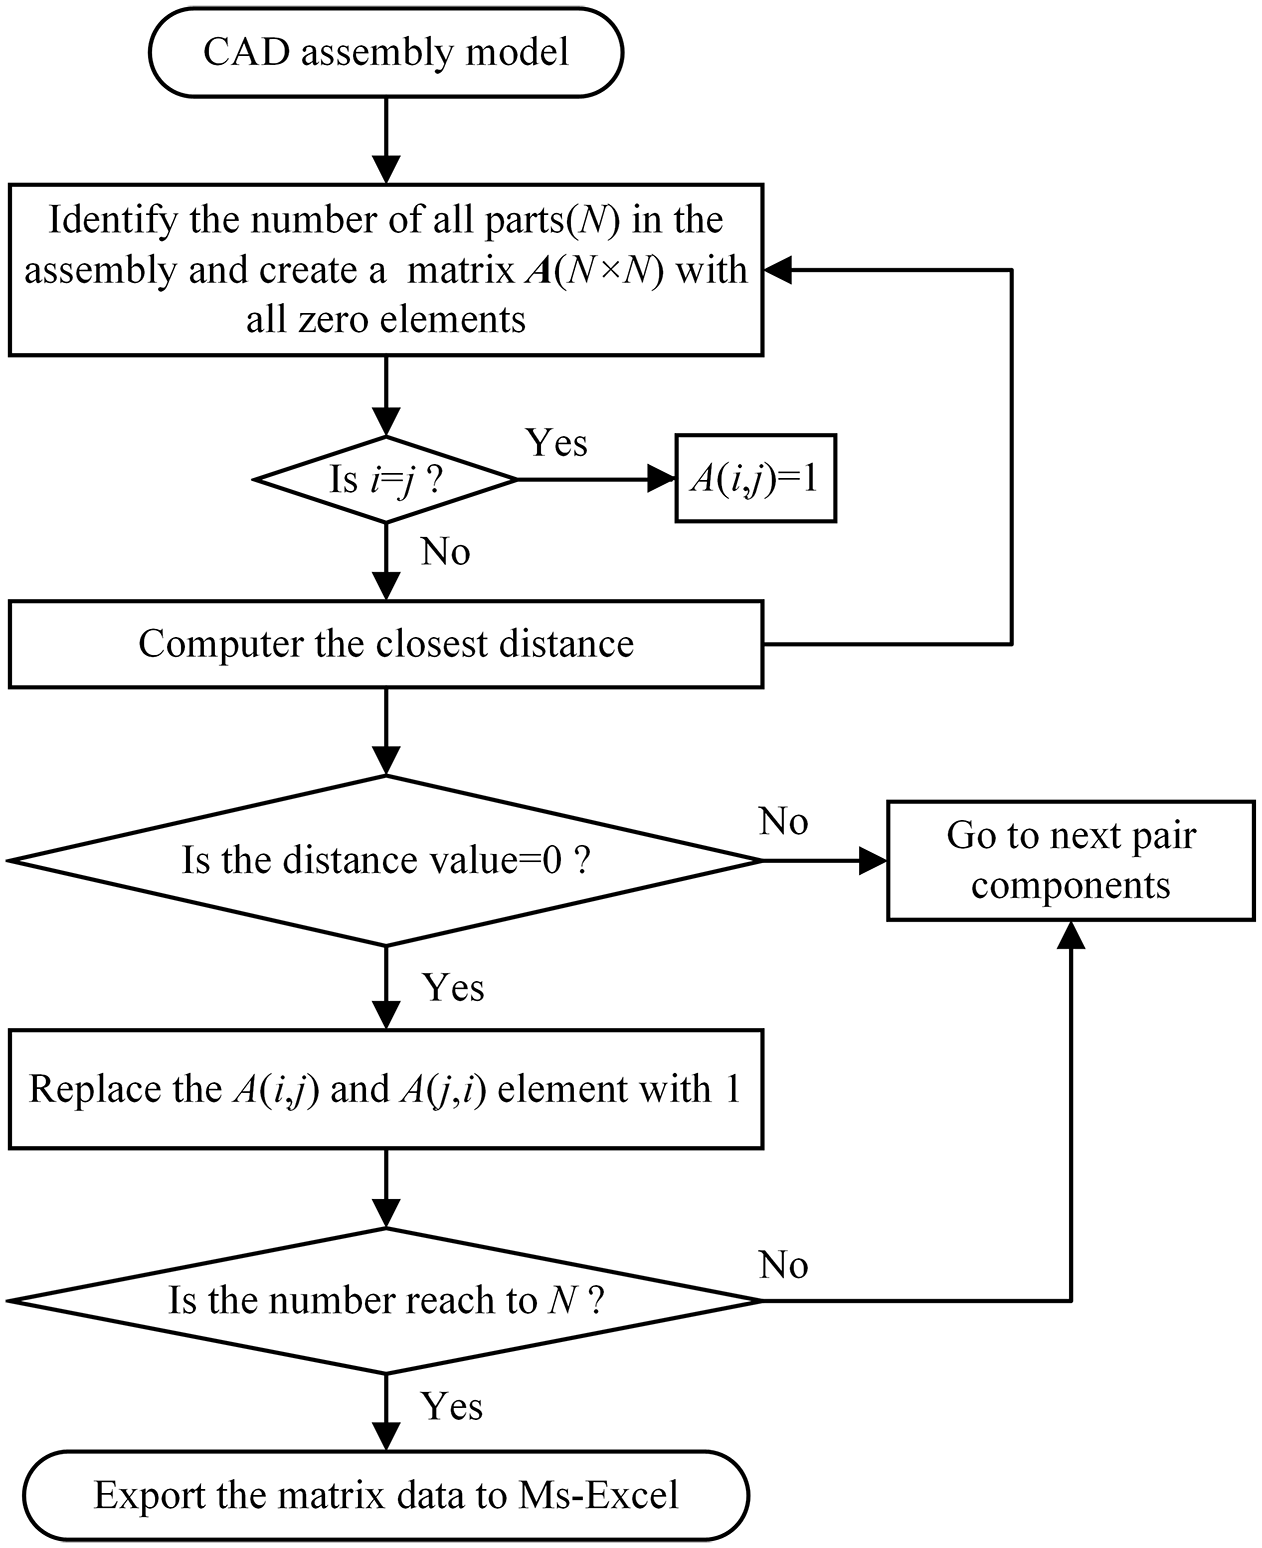
Flowchart of automatic generation of DSM.

Automatic generated DSM from a universal joint assembly.
Hierarchical clustering
Hierarchical clustering is an effective cluster method for forming groups or clusters into tree construction. It is commonly adopted to decompose and aggregate objects hierarchically according to the similarity between the clustered element. For the advantage that does not need to set the number of the clusters primarily, hierarchical clustering is often chosen as a hierarchical partition tool. In the beginning, each object to be clustered is regarded as a single cluster. Then similar clusters with the smallest distance are merged based on their coefficients. The same step is repeated until all objects are gathered into one cluster. The final dendrogram is a hierarchal clustering structure with a visual illustration of different granularity. The “dendrogram” function in MATLAB can facilitate us to quickly and easily visual hierarchical clustering results. There are two parameters in the “dendrogram” that need to be set: “pdist,” which is used to measure the similarity between elements in a cluster, and the “linkage,” which is used to calculate the closeness between clusters. The similarity between objects is often quantified by distance value. As “Euclidean” distance is commonly used in “pdist,” 34 it is also selected in this paper. The “linkage” that plays a significant role in the clustering progress of clustering. Among all the parameters in “linkage,”“ward” takes the smaller separation sum of squares in each category and the larger sum of squared deviations between different categories as the objective function. Due to the favorable formation of cohesion clusters, “ward” parameter is chosen for clustering process in this work.
Improved elbow method
In modularity analysis, there is a major challenge on how to obtain the optimal module number. The elbow method is often employed to determine an unknown number of clusters in data analysis. 25 The curve shape of the elbow method is similar to the shape of the human elbow, and the elbow point is considered to be the optimal number of clusters. The real cluster k value can be determined by observing the degree of distortion of the cost function curve.
Assume that a total of N elements are divided into K clustering (
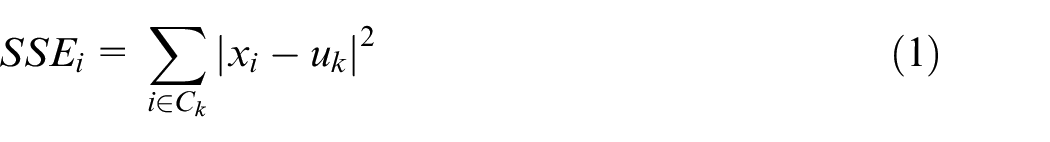
Correspondingly, the entire module division of the total sum of error square is calculated in formula (2) as
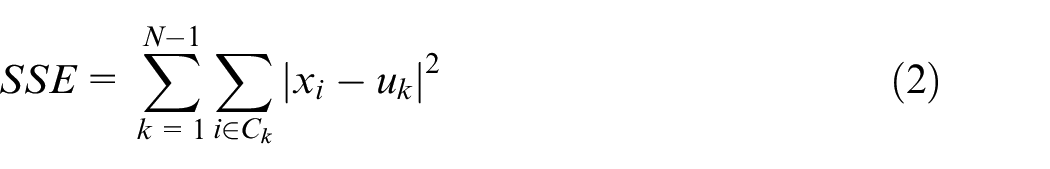
For a module clustering, the lower the SSE value, the tighter the cluster structure, and the higher the SSE degree, the looser the cluster structure. Overall, the distortion will decrease with the increase of the category, but in a certain interval, the distortion will be significantly improved with a critical point then decreased slowly. This critical point can be considered as a point with better clustering performance.
Generally speaking, the relationship between the number of clusters k and the SSE could be drawn as an elbow-like curve in Figure 3(a). It can be seen that as the number of clusters k is increased, the cost function gradually decreases. During this process, when the number of clusters k is less than the real cluster value, as the number of clusters k increases, the cost function decreases dramatically, which means that each aggregation of cluster category increases fast. When the number of clusters k is equal to the optimal cluster granularity, at the same time, the curve reaches an elbow-like position. After that, the aggregation change trend has no significant priority. This critical point can be considered as a point with better clustering performance. The above overall process can be summarized as balancing the number and size of the modules.The traed-off between the module number and size will enable to obtain the appropriate granularity in modularization.
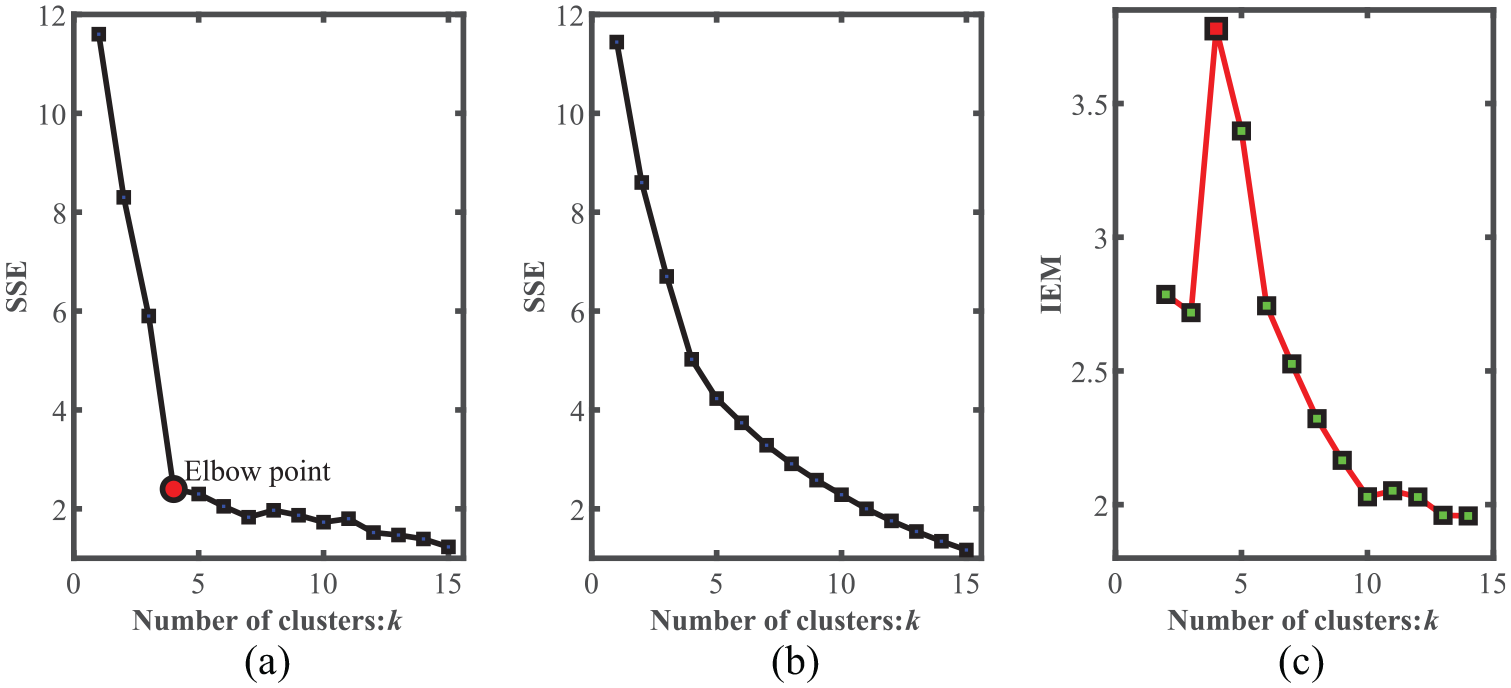
The cost function curve.
In Figure 3(a), we can clearly observe the elbow point position. However, it is not always the case. Sometimes it is not easy to recognize the appropriate elbow position purely by eyesight, and the elbow point position maybe not so obvious and unambiguous as in Figure 3(b). To improve the situation like Figure 3(b), an improved elbow method (IEM) is developed by us, which can visually identify the clusters number in an apparent manner as shown in Figure 3(c).
Based on the generalized slope characteristics in the original curve, formula (3)–(5) is defined to obtain the clustering assessment result for the improved original elbow method:
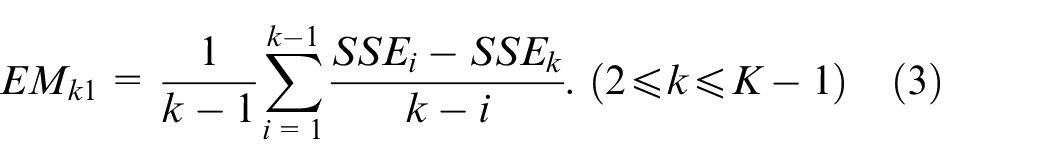
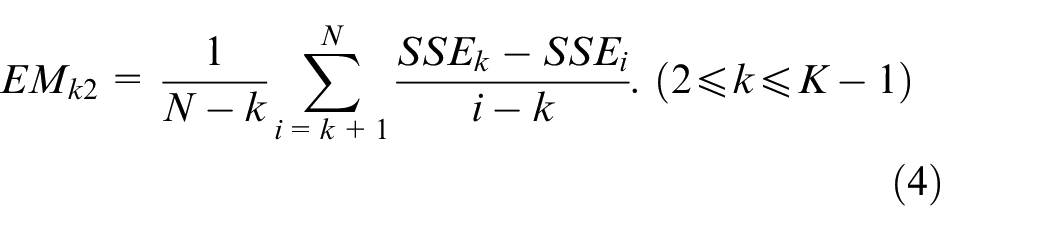
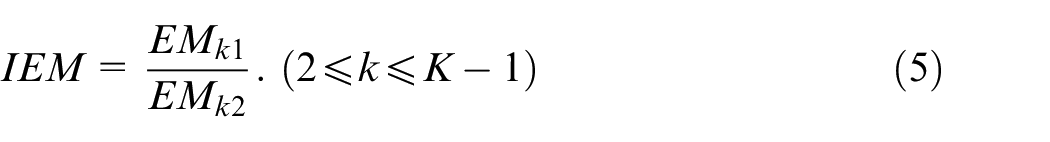
where k represents all the possible elbow points, K stands for the number of possible clusters. The equation (3) provides an average downward trend value of a specific potential elbow point. The difference value in the vertical axis between the potential elbow point and the left-side point is calculated. Then the ratio is calculated by the above difference value and the distance between the horizontal axis of these two points. In the mathematical view, the above ratio represents descent rate of the elbow method curve. When it comes to module partition, it represents the improvement of cluster aggregation in a module. For the sake of taking all the data into consideration, we have performed the above solution for the elbow point and all the left points. To lower the influence of outlier values on the final result,
The proposed modular design framework
Based on the previously automatically generated DSM, hierarchical clustering, and improved elbow assement method, a framework to identify the optimal granularity level of modular partition is proposed and illustrated in Figure 4. In the process of connection extraction between components, a diagonal-square DSM is used to store the correlation among parts. With the help of Visual Studio, the part connection relationships in the CAD model are extracted. Furthermore, a hierarchical clustering algorithm is taken into account to form a hierarchical architecture clustering. The closest two elements between each other are clustered into one group. At the same time, correspond clustering spectrum is evaluated by the IEM. The above mentioned new group is viewed as the common element again. Then, all the elements will be re-executed the above procedure until all elements are merged into a single group. After that, the dendrogram is cut to get a rational module partition with the maximum IEM. Finally, the product CAD model is partitioned into the optimal granularity level. The above computational framework is explained below:
Step 1: Open a CAD assembly product model in the SolidWorks software tool.
Step 2: Utilize secondary development technology to build the DSM automatically.
Step 3: Group the two nearest elements into one cluster with the dendrogram function.
Step 4: At the same time, adopt the IEM index to evaluate the current modular partition from Step 3.
Step 5: Repeat Steps 3 and 4, until a complete dendrogram is formed. Selecting the maximum IEM value to segment the dendrogram.
Step 6: Segment the dendrogram with modular result having maximum IEM value.
Step 7: Obtain the optimal granularity and the matching module partition result.
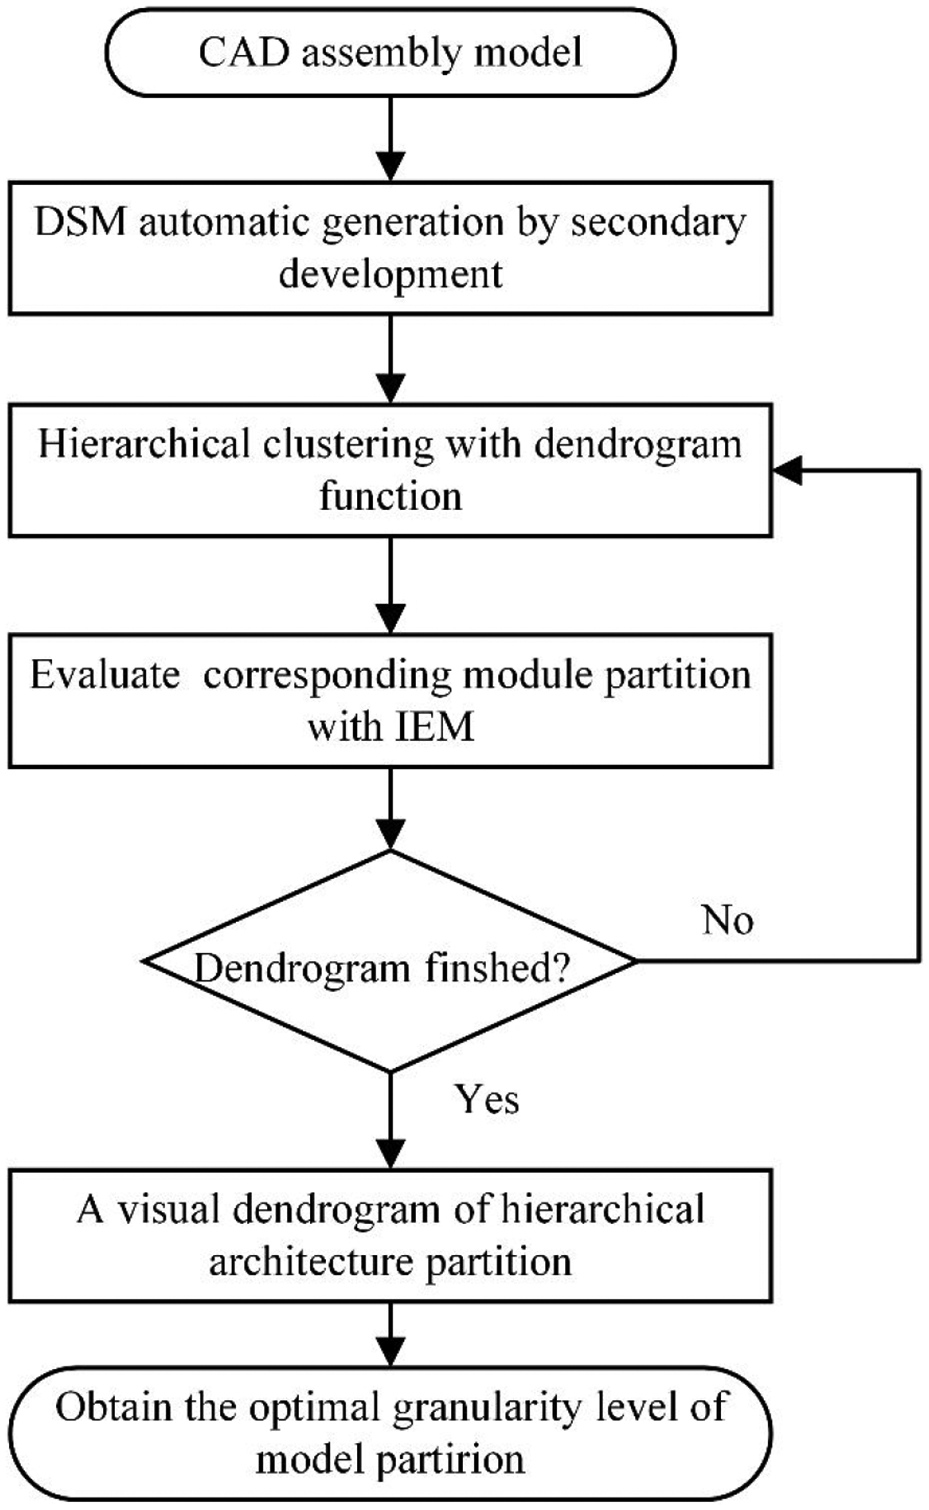
The framework of the proposed approach.
Case illustration
Case study for the wind turbine
The proposed method is first applied to the modular partition of complex mechanical products with a wind turbine. The case was published in the literature 35 for module partition of complex mechanical products based on complex weighted networks, the interval-valued intuitionistic fuzzy sets, and a modified Girvan-Newman (GN) algorithm. DSM of the studied wind turbine has 30 parts account for three pages. For saving space, a detailed DSM can be referenced in the original paper.
According to the proposed hierarchical clustering algorithm, the dendrogram of the wind turbine DSM is shown in Figure 5. The traditional elbow method curve is illustrated in Figure 6. It has a poor performance that has no obvious elbow point. The IEM values of different module partition spectrums are shown in Figure 7. The overall trend of the IEM is to increase sharply and then decrease rapidly. IEM reaches the peak value when the number of modules is 9. Despite the values oscillates at the initial and tail, they are still only some local optima. Besides, it is worth noting that the peak value significantly larger than most other values, which proves the outstanding discrimination of the IEM. Furthermore, the proposed approach partition result is consistent with the modified Girvan-Newman (GN) algorithm in the original article. 35 According to the experienced expert, each module realizes the independent function and is a reasonable partition of the wind turbine reality.
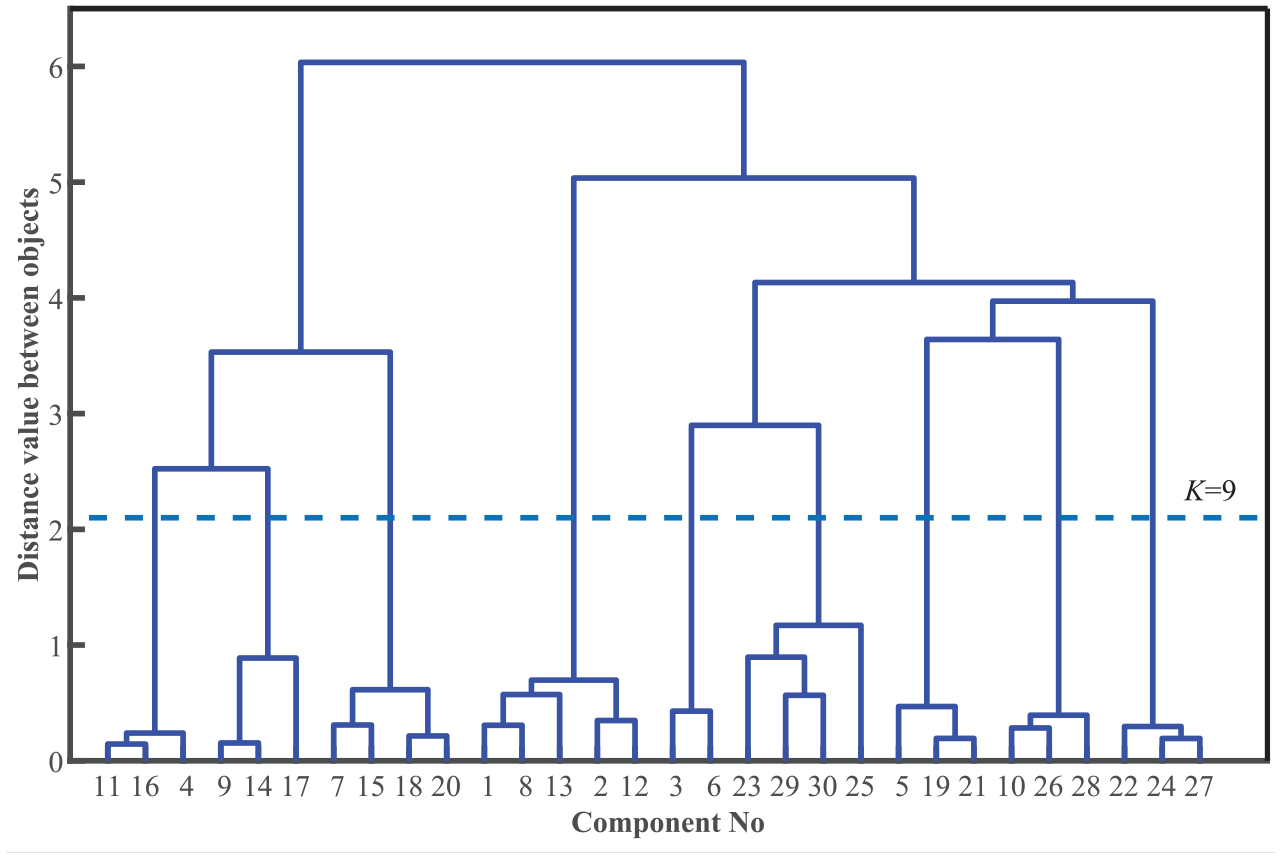
The dendrogram of the wind turbine.
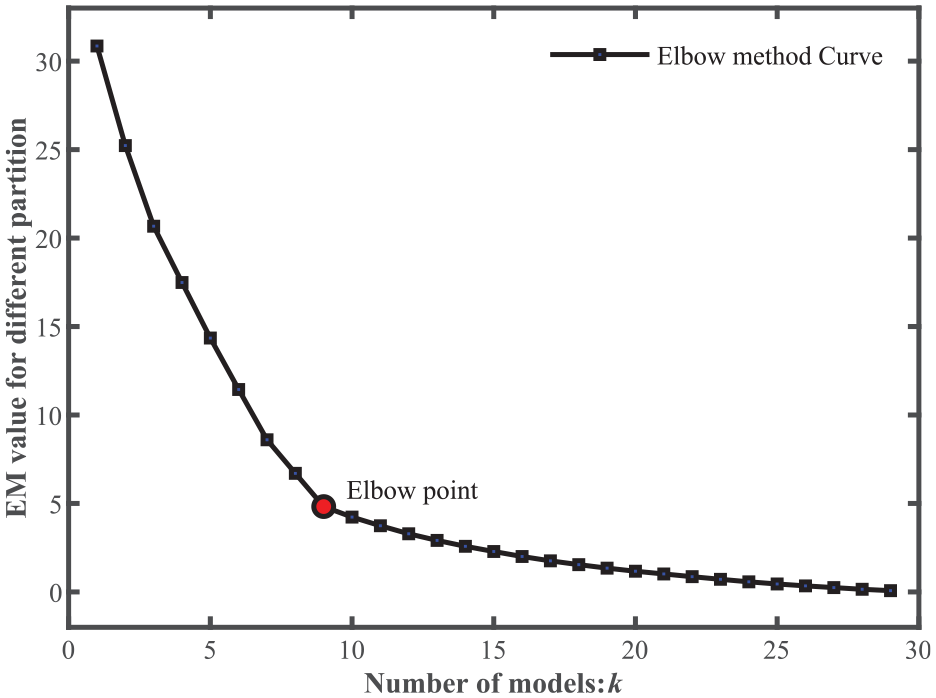
The elbow method curve of the wind turbine.
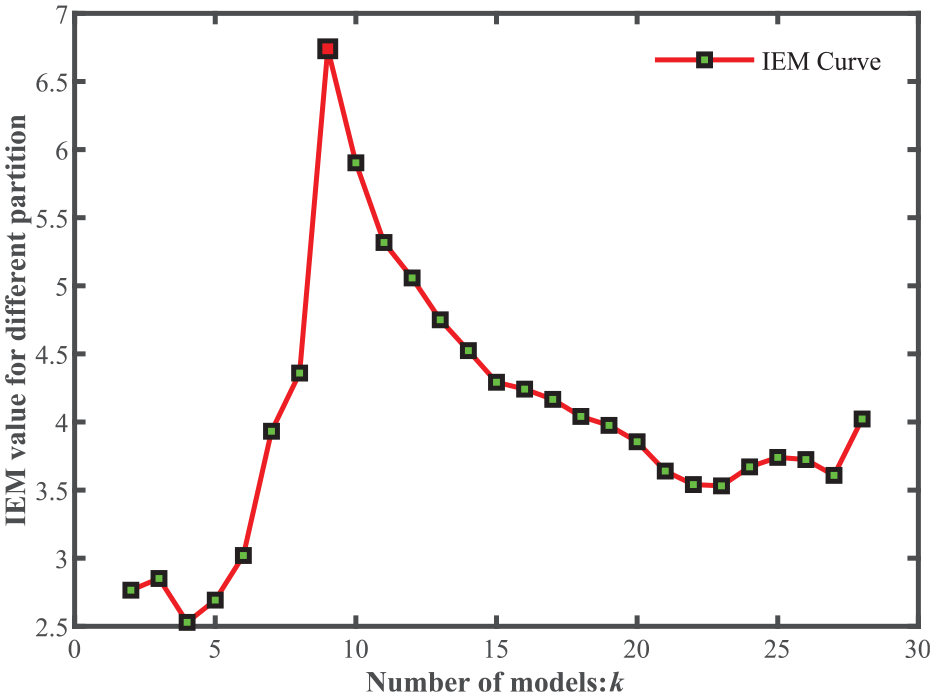
The curve of improved elbow method index of the wind turbine.
Moreover, the other four clustering indexes are taken for comparison in determining the optimal granularity. The Sil method 21 is adopted to examine whether an element is classified well or not. The range of Sil is from −1 to 1. If the Sil value is more closer to 1, the clustering will be more satisfactory. The CH index 22 evaluate cluster validity based on the ratio of the cohesion between clusters and within a cluster. A relatively high CH value indicates there is a close relationship between objects in a cluster. The Gap is another index propped by Tibshirani et al. 23 to determine the appropriate number of clusters. It compares the inter-cluster variance with the expectation value of random distribution clusters. An appropriate number of clusters will bring Gap to a higher value. Davies and Bouldin 24 proposed the well-know DB index to measure cluster validity. Its evaluation principle is based on enlarging the proximity of the object and reducing the similarity between each cluster. In opposite to these three metrics, DB value is inversely correlated with clustering quality. As is mentioned, four indexes are employed to compare with the IEM evaluation performance. These four indexes value of the wind turbine are shown in Figure 8.
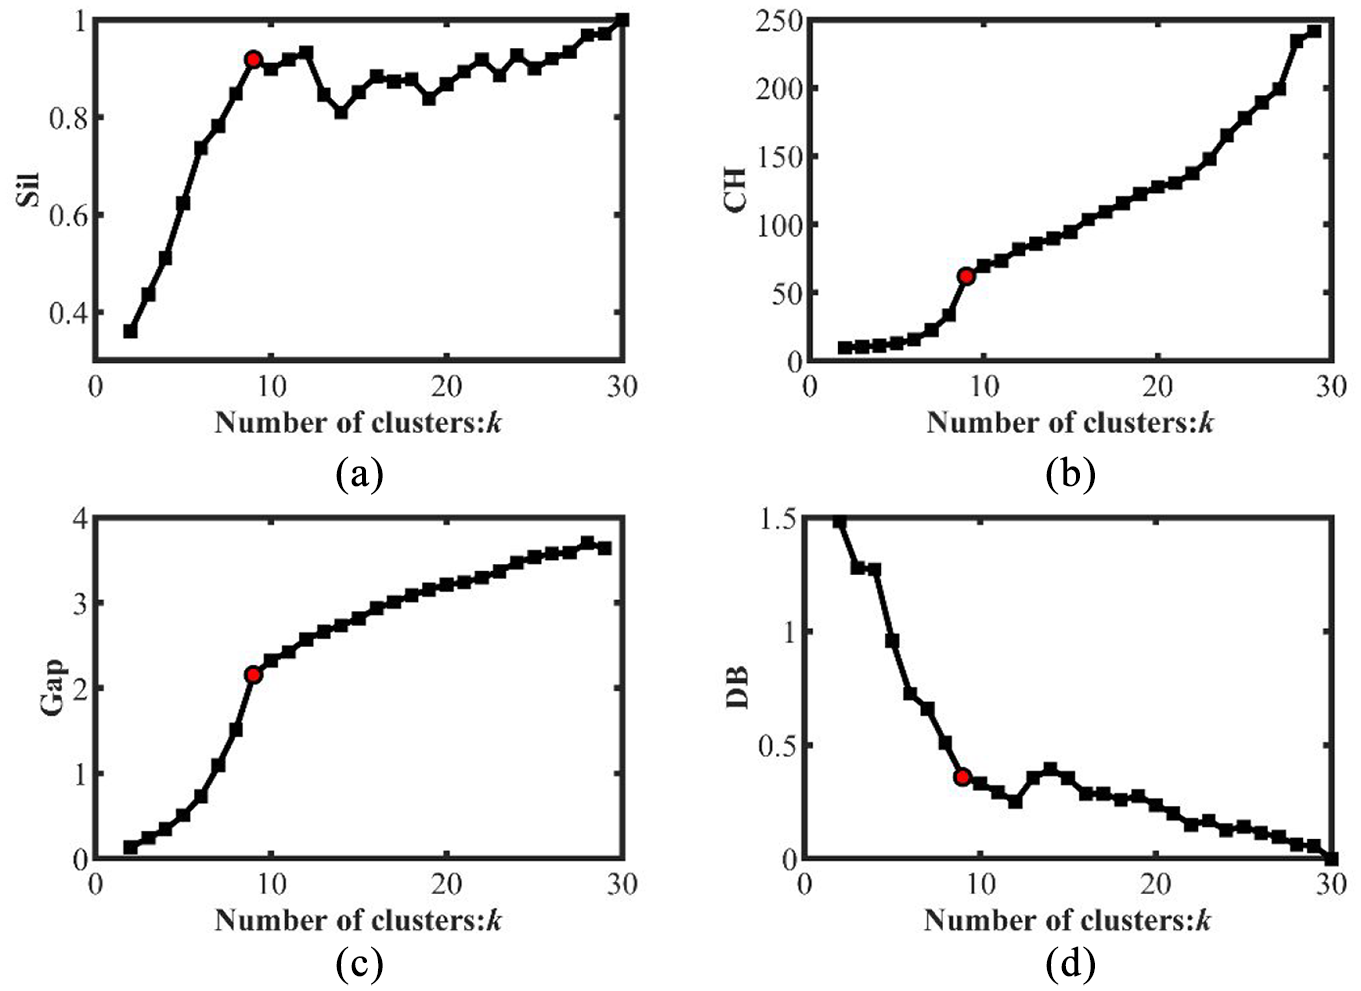
The curve of (a) Sil, (b) CH, (c) Gap, and (d) DB.
It can be noted that the overall trend for the four indexes is that the cohesion of the modularization increases as the number of modules increases. All of them suggest an extremely large number as optimal cluster numbers. As for the Sil and DB indexes, the clustering quality has been improved after nine modules, however the improvement is very weak. At the same time, when the number of modules is 9, there is also a sharp increase in CH and Gap indexes. After that, the clustering quality is not significantly improved. Thus, comparing Figures 8 and 7 acquired by our proposed IEM index, the IEM can more visually illustrate the optimum clustering result within a range of possible clustering numbers. The IEM outperforms the original elbow method in more clearly modular granularity identification, and is superior than the Sil, CH, Gap, and DB indexes as well.
Case study for the jaw crusher
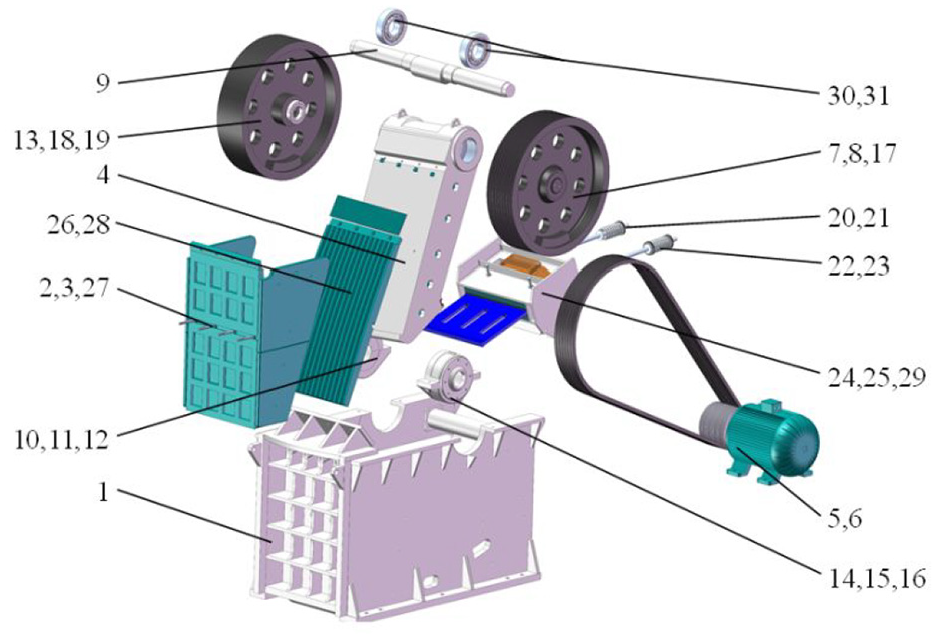
As shown in Figure 9, the jaw crusher has a typical structure and is extensively applied in crushing raw materials in coal and other industries. Before using the SolidWorks API to obtain DSM for jaw crusher, it is essential to state that not every part is necessary for modular analysis like ribs, frames, and fillets, which show little impact on the final partition result. Thus, some components are simplified in advance. A type of jaw crusher with 31 elements is utilized as another case in this paper. Based on the automatic correlation extraction method proposed in the methodology section, the DSM is constructed automatically and exhibited in Figure 10. It is a symmetric matrix with “0” or “1” integers. If two components share connections, the related blank is assigned the 1. Meanwhile, 0 indicates there is no direct correlation between the two components.
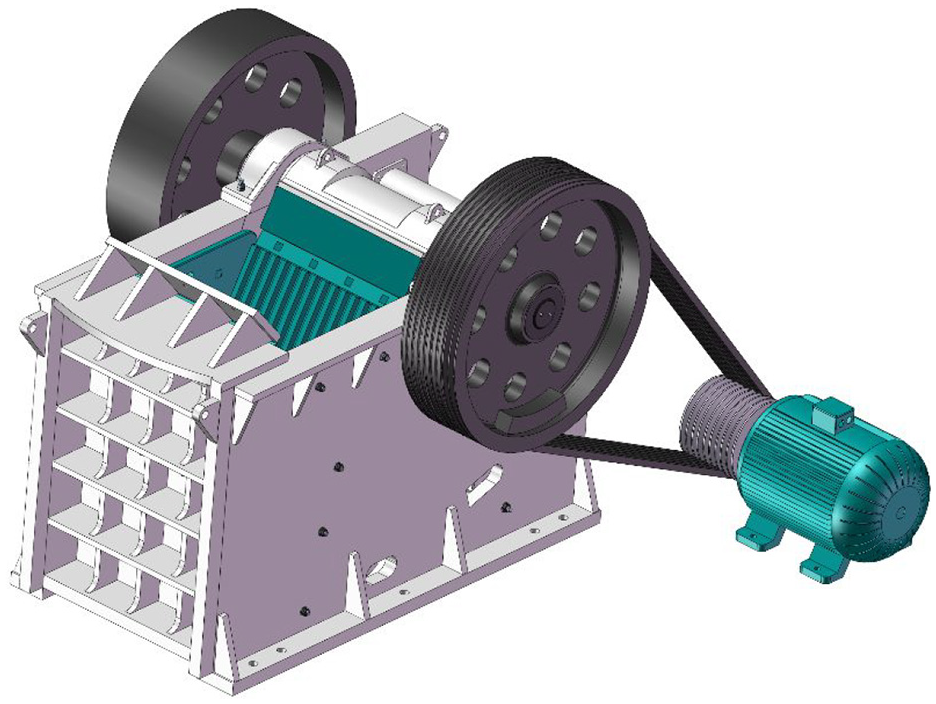
The basic CAD model of a jaw crusher.
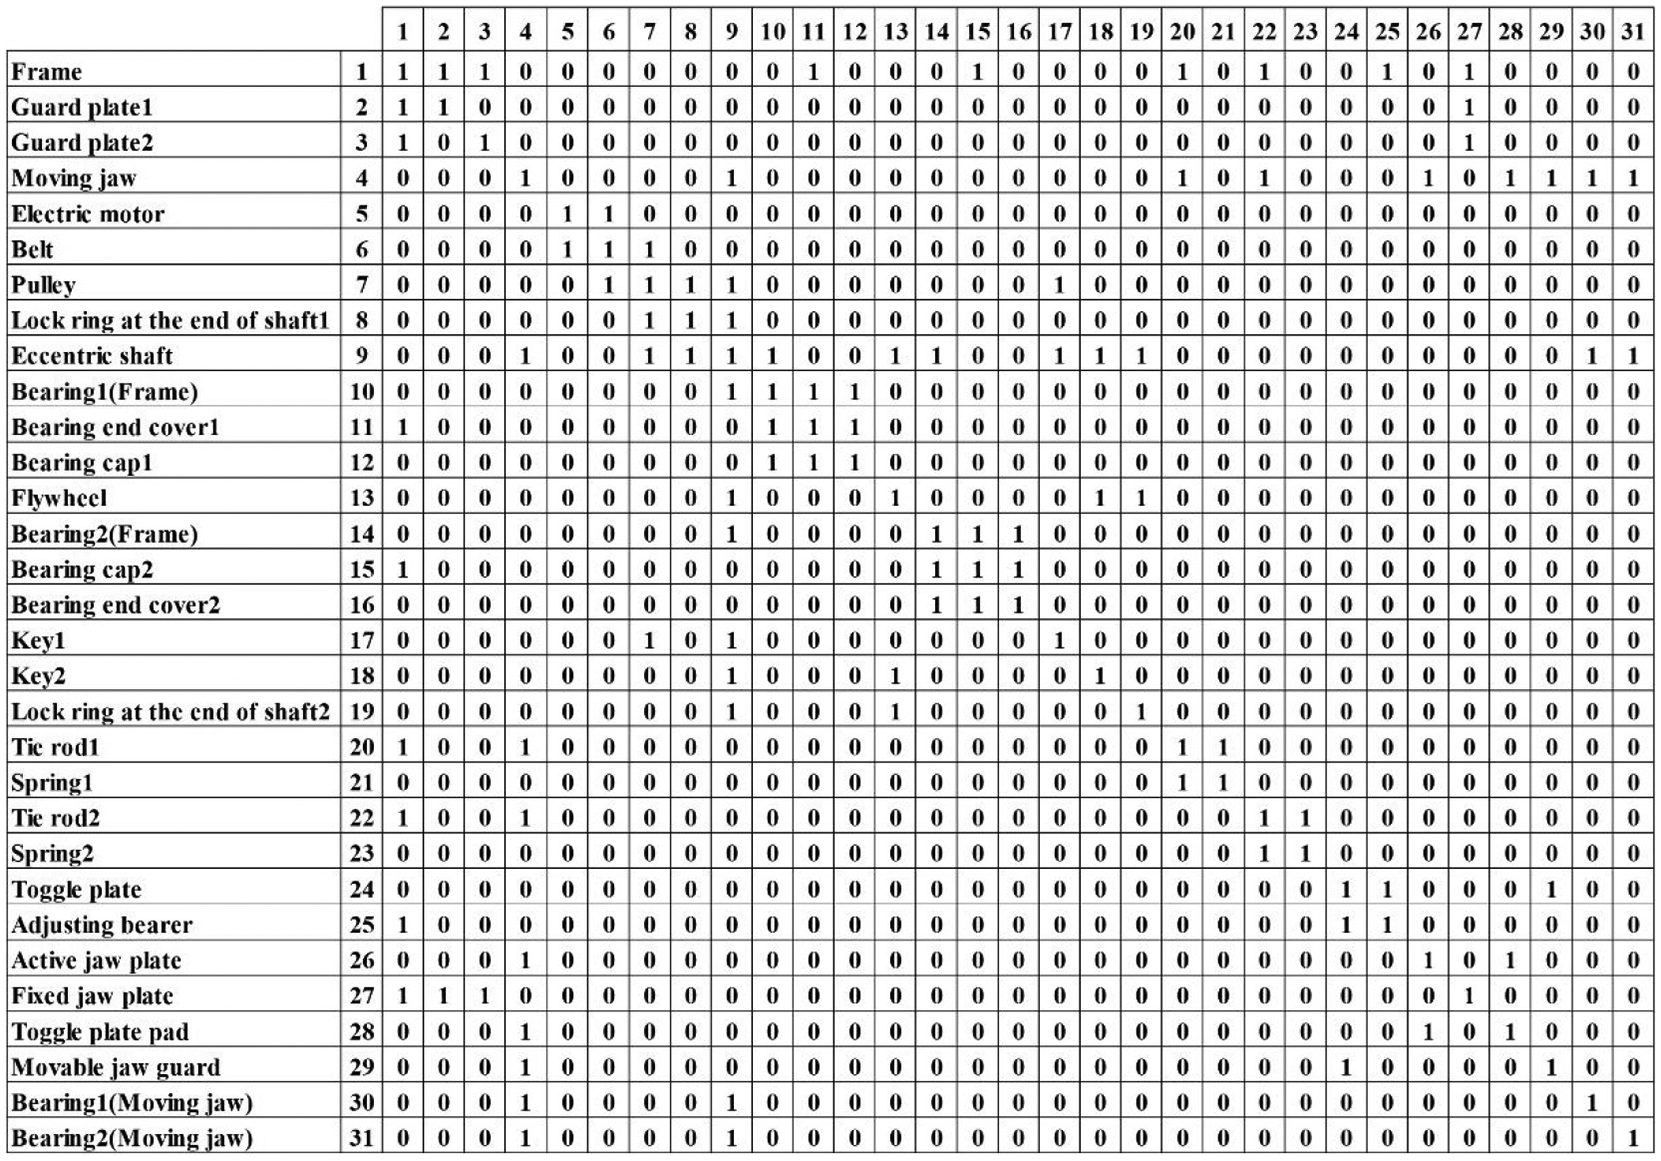
The DSM of the jaw crusher.
Similarly, in Figure 11, the elbow point position is difficult to judge merely by sight. As can be seen in Figure 12, when the module number is 14, the IEM reaches its peak value. Accordingly, it is separated into 14 modules with a blue line through the dendrogram in Figure 13. As can be observed in Figure 14, the expected module partition from M1 to M14 is lised below: {26,28}, {30,31}, {4}, {20,21}, {22,23}, {24,29,25}, {1}, {2,3,27}, {10,12,11}, {14,15,16}, {5,6}, {7,8,17}, {9}, and the final module {13,19,18}.
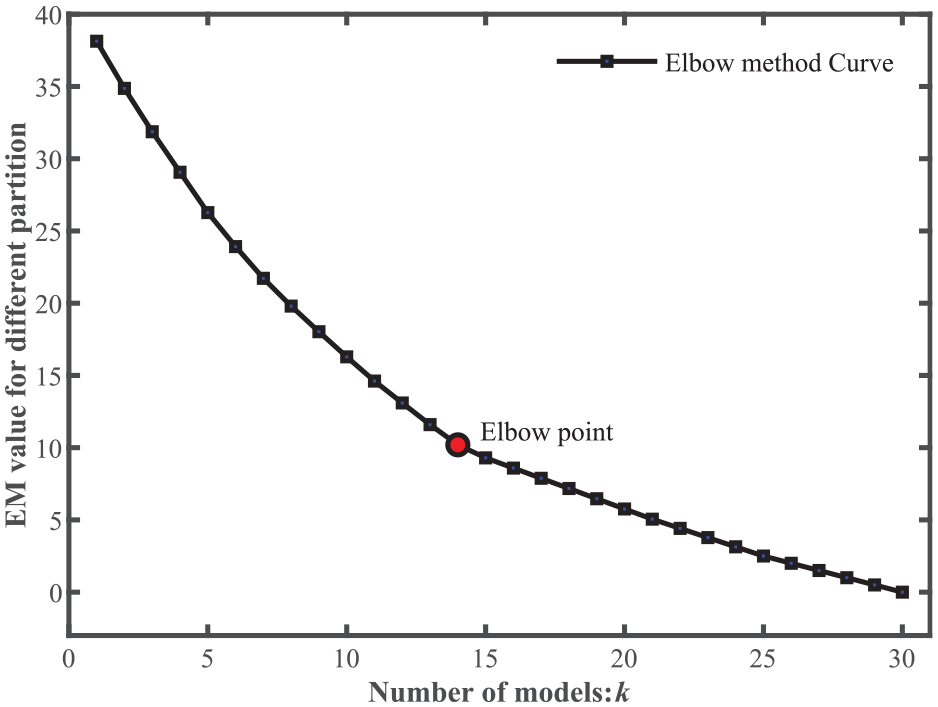
The elbow method curve of the jaw crusher.
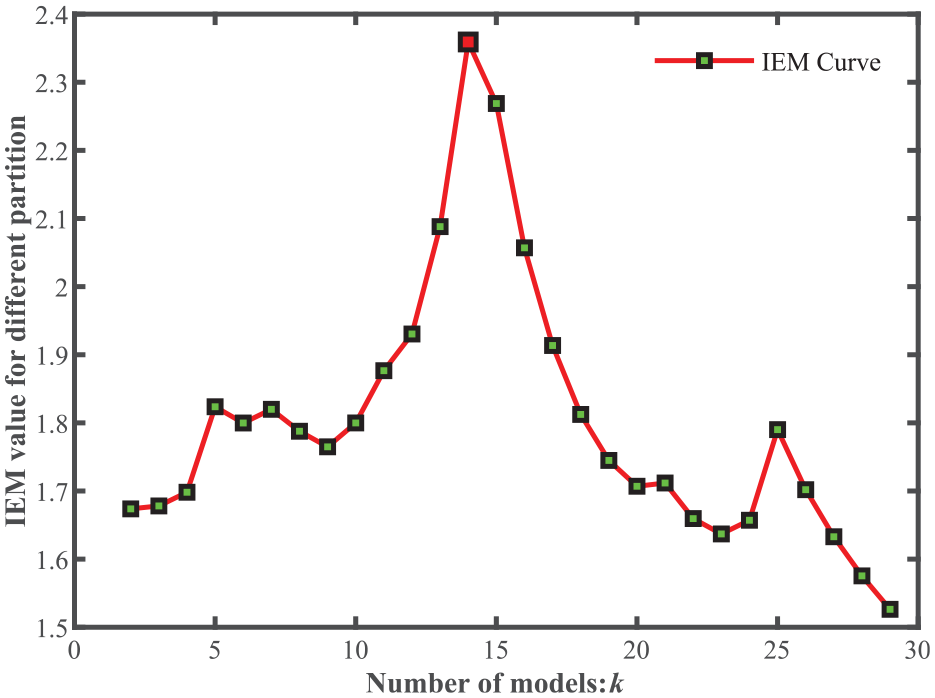
The curve of improved elbow method index of the jaw crusher.
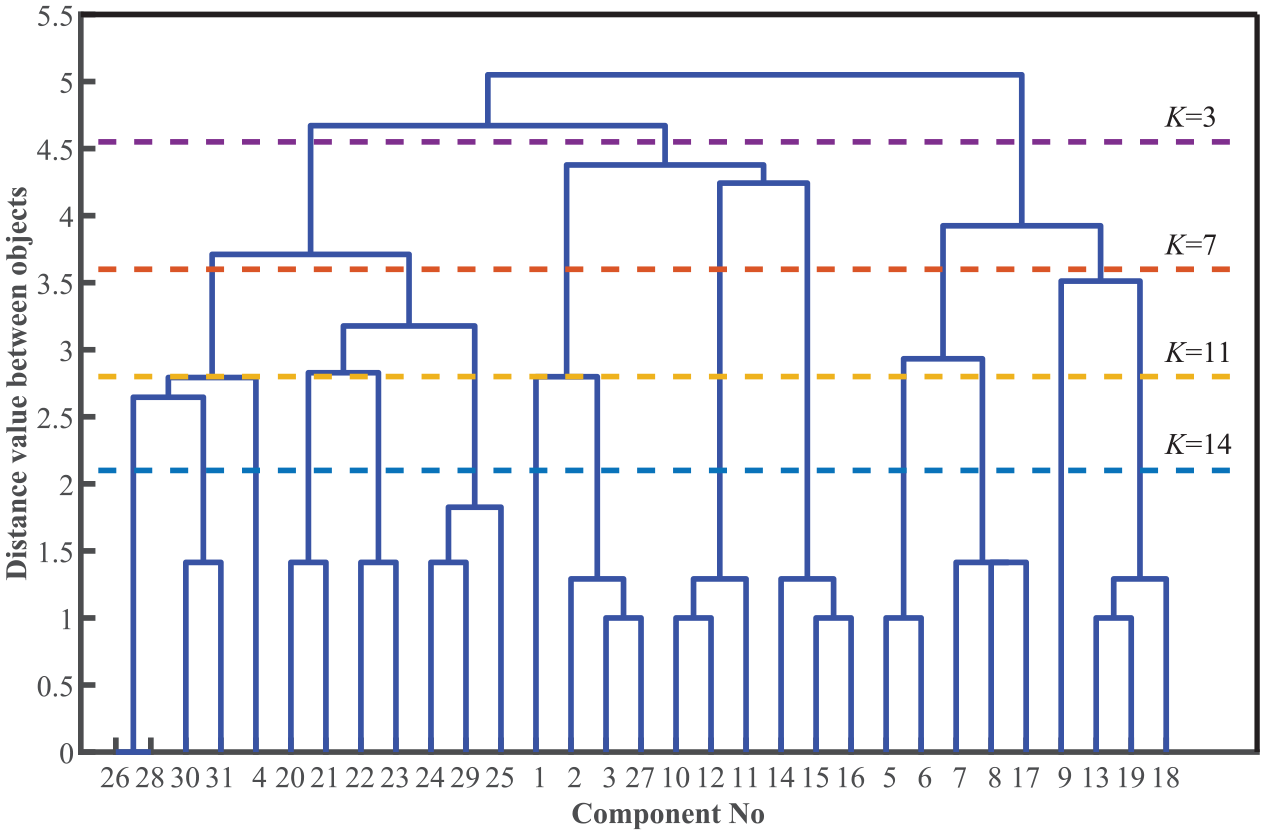
The dendrogram of the jaw crusher.
Module partition result of jaw crusher.
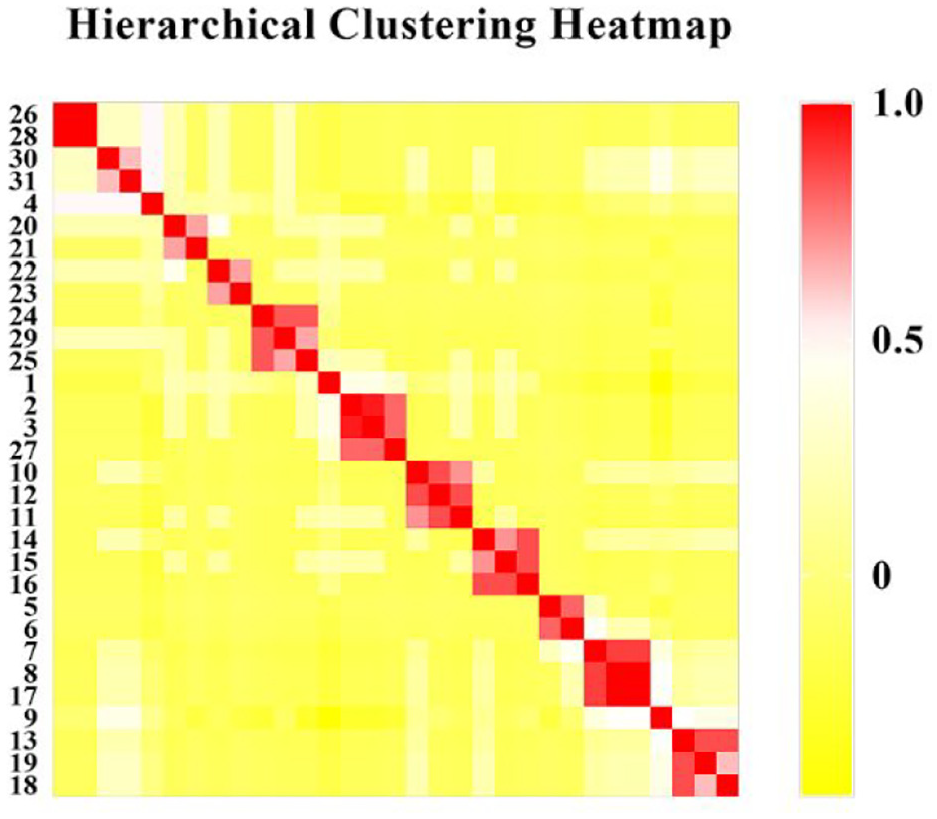
As display in a visual manner, the heat map method is taken to justify the validity. The GraphPad Prism 8 tool is taken to plot the heat map for the group segment in Figure 15 (The row label is same as the horizontal label in Figure 13). The connection strength is analyzed by “coefficient matrix” function. Community parts colored with deeper red mean the potential combination of a module. As is visualized from Figure 15, it has a strong related elements partten and the appropiate module number is verified as 14. The result of the division of the heat map shows that the color in the same module is darker, which can verify that the elements in the module obtained by our method are closely related.
Hierarchical clustering heatmap.
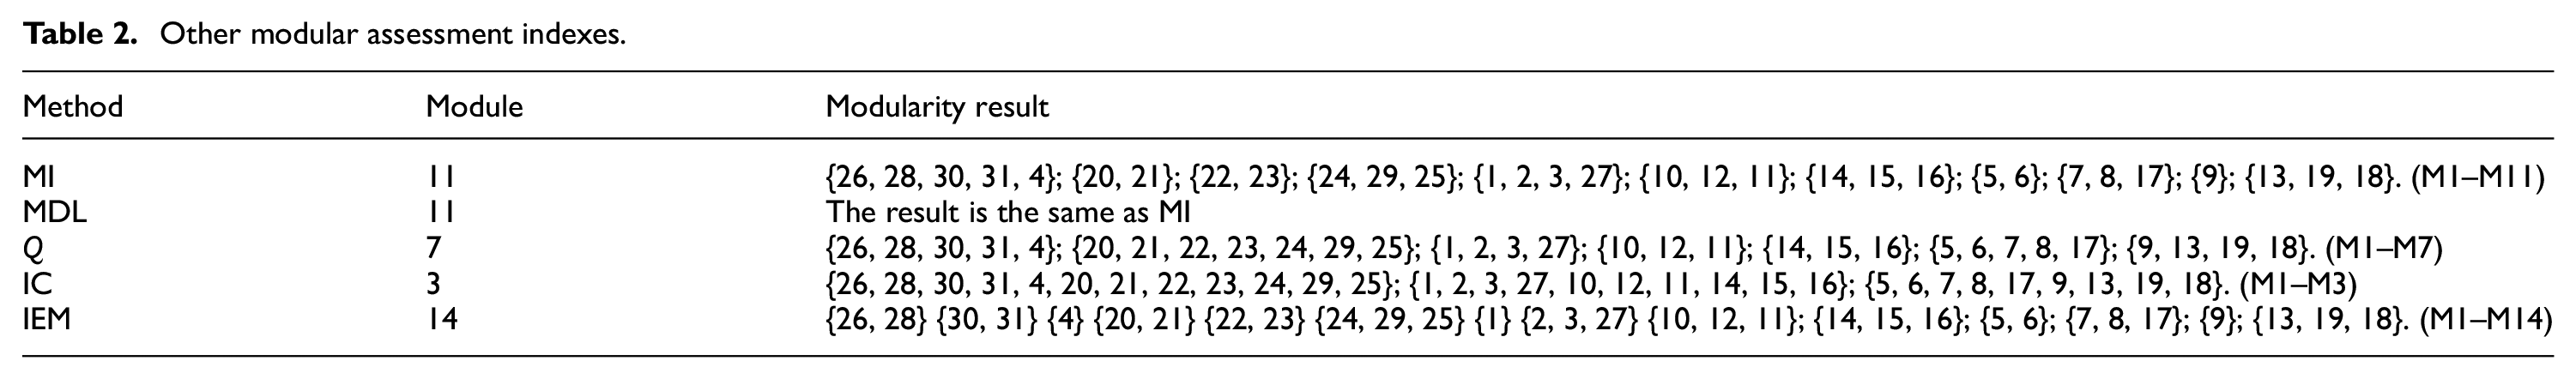
In the previous section, the proposed approach is compared with data-based index. For this part, a comparison experiment will be carried out between the presented method and the connection-based index. These modular indexes correspond to a specific cost function for the given DSM obtained by the hierarchical clustering algorithm. The MI takes the sum number of cells having interactions outside the clusters and lacking a connection in a module as the objective function. 13 The smallest MI corresponds to the most satisfying clustering partition. The MDL aims to minimize the mismatched data description in the DSM tropology and an ideal modular partition matches a small MDL value. 26 The IC tends to decompose a product into smaller modules or subsystems with a relatively simple structure. 27 A small IC value indicate how strongly components are coupled. The evaluation scheme of modularity index Q on the number of inter-module interfaces. Different from previous indexes, the Q value will increase as the modular result improves. 27 According to Table 2, MI and MDL methods tend to pick a large cluster number of 11 in component and link granularity. The modularity Q is performed to select the module partition when the cluster number is seven at the link granularity. As for IC, it tends to pursue the granularity at a smaller number of three modules.
Other modular assessment indexes.
Discussion
The first case indexes lay particular emphasis on clustering that the items within each cluster are homogeneous while the clusters themselves are heterogeneous. As demonstrated in Figure 8, taking the cohension as the only optimization goal will result in a particularly large amount of clusters. In fact,the optimal granularity must place emphasis on both the number and size of clustering. Apparently, these data-based indexes ignore the factor of cluster size. Since the DB and Sil values of 9 and 29 clusterings are almost similar, but 9 is distinctly small, we can presume that nine modules can be accepted as the best granularity. From another perspective, the clustering quality of CH and Gap is significantly increased at nine. As is able to obtain a higher clustering quality at a smaller number cost. The same can be applied to the results with nine modules as the optimal granularity. The above four indexes can reveal the best granularity to a certain degree, but these are manual quantitative analyses on polyline trends. Due to neglect the module size, these data-based indexes are not well suitable for searching optimal granularity in DSM clustering.
In contrast, the improved elbow method encourages balanced clustering by taking into account both the number of clusters and the module cohesion within clusters. In other words, it is less prone to very high or low granularity clusters than existing methods.The IEM index also shows a unique advantage of a visual and significant maximum value in determining the selection of module partition number.
Module partition work is favorable to new product development by replacing, adding, and removing modules. An optimal granularity plays a vital role in this process. Some parts whose shape hardly change, such as the bearing module {10,12,11}. At this point, a smaller granularity will bing redundant cost. Both MI, MDL and IEM modules spectrums do not subdivide the modules, which is reasonable and advisable. But for the key component assignment, MI and MDL still have shortcomings. For example, component 1, 4, 9 should be viewed as bus modules for all sharing many interactins with other ones. The second category tends to be modules at the mechanism level. The modularity Q result is an excellent example of the above analysis. However, some modules may contain a larger number of various components (M7). That could result in there is no apparent and significant similarity in a module. The third type of module partition at a larger granularity level and tends to cluster the components into a sub-assembly, as indicated in the IC result. That is a very high level of granularity and can be further divided into more suitable granular modules. Compared to other spectrums, even though our module partition spectrum requires more time and labor on the design stage, it requires less extra modification when combine modules to derivative new customized products. In the long run, the average cost is still superior to other schemes as it can be reused many times. More of all, our spectrum provides an irreplaceable advantage in a competitive market environment by utilizing existing modules to complete new product designs in the shortest time. This quite practical to facilitates rapid design and maintenance substitution.
In case of a product is consisting of N parts, some formulas have also been used to determine the number of clusters K, equation (6) 28 recommends an initial value for clustering. At the same time, equations (7) 29 and (8) 30 are offered to recommend an interval of module number.


It is likely that the optimized number locates outside the restricted interval. It should be pointed out that these formulas are suitable viewed as reference tools rather than the decisive benchmark. Because they are dependent on the previous examples instead of a new specific mechanical product case. Compared to this, the proposed approach is more concrete in line with the actual product case. In summary, as can be learned from the above discussion that the proposed approach enjoys the notable advantage is visual, practical, and concrete.
As a key stage in product development, the design stage is the most appropriate phrase to perfome module task. 36 Although physical details of products are unavailable. The proposed method could divide a new product into modules with CAD models at the design stage. At the same time, our extraction method is a kind of stable and objective. An inverted V-shaped curve of correlation between the module number and the objective function is found. Granularity level quality improves as the module number increases up to a point where is the optimal module partition, and then it declines with a further rise in modularization.
Conclusions
This paper proposes a novel approach for identifying the optimal granularity level of modular products. First of all, in order to generate DSM automatically, the DSM created work was carried out through access to the SolidWorks CAD model with Visual Studio. The distance value of parts was extracted as the criterion for judging whether there is a connection relationship. A mathematical tool of the improved elbow method is developed to obtain a visual division module partition result with the hierarchical clustering dendrogram. It reaches an optimal granulated modular and hierarchical architecture without inputting the number of modules in advance. The feasibility and superiority of this method are proved by two examples of mechanical products: a wind turbine and a jaw crusher. Therefore, it is worth considering applying DSM automatic generation technology and our IEM module division technology to the real world. The contributions of this work are summarized as follows: (1) The components-DSM is constructed automatically from the CAD assembly model to describe the structure of a mechanical product; (2) The improved elbow method is proposed to identify the optimal granularity of the module partition in visualized and hierarchical attributes.
Potential opportunities to extend the current research are as belows. The correlations among components are not always boolean or single connection adjacency.The further exploration expected to be investigated are correlations strength analysis and comprehensive relation establishment.
Footnotes
Appendix
Acknowledgements
Sincere appreciation is expressed to Dr. Dengzhuo Liu and Dr. Shuai Wang in China University of Mining and Technology, and the anonymous referees for their valuable comments that helped to improve the quality of the paper.
Declaration of conflicting interests
The author(s) declared no potential conflicts of interest with respect to the research, authorship, and/or publication of this article.
Funding
The author(s) disclosed receipt of the following financial support for the research, authorship, and/or publication of this article: The support of this work by National Natural Science Foundation of China (51475459) and Priority Academic Program Development of Jiangsu Higher Education Institutions of China (PAPD) are gratefully acknowledged.