
Abstract
The deviation vector at arbitrary location of large thin-walled structure caused by manufacturing process is different and has the characteristic of field distribution, which has great influence on the assemble quality. The deviation of each point on the part is not independent, and the final assembly deviation is difficult to be controlled. In this paper, the deviation field of large thin-walled structure is described by the linear combination of a series of basic deviation patterns. The deviation propagation model is established to quantify the contribution of basic deviation patterns between parts and assembly. A new two-step optimization method based on the adjustment of key control points of the part is proposed for the deviation control of large thin-walled structures. Firstly, the effective independent method is employed to obtain the optimal measurement points, which may characterize all basic deviation patterns of the part accurately. Then a new optimization model is developed to determine the key control points for special basic deviation pattern, which have little influence on the other basic deviation patterns. Based on the genetic optimization algorithm, the optimal key control points and the adjusted quantities for special basic deviation pattern are obtained, simultaneously. A case study on the assembly process of two cylindrical thin-walled parts with initial deviations measured by the Laser Scan Device is conducted. The basic deviation pattern with great influence on the deviation of assembly is determined firstly. The key control points and the corresponding adjusted quantities for this basic deviation pattern are calculated. The results indicate that the deviation of the assembled structure may be suppressed by the adjusted deformation of the key control points of parts. It is useful on the deviation control for the assembly process of large thin-walled structures.
Keywords
Introduction
Large thin-walled structures are widely used in the aerospace area due to its light weight, such as the fuel tanks in rockets. Owing to the weak stiffness and geometric continuity, shape deviations caused by the spring-back deformation appear inevitably and the assembling quality is affected directly for large thin-walled structures during manufacturing process. Moreover, the deformation at each point on the structures has influence on the final deviation of assembly, which makes the assembly deviation difficult to be traced and controlled. The traditional theoretical methods for deviation control of assembled structures mainly focus on the optimization analysis of local clamping layout. However, these methods can not be effectively used to control the assembly deviation for large thin-walled structures because the impact range of clamping points is limited. The deformation at arbitrary location may cause the new distribution of the assembly deviation. Therefore, a new optimization method to determine the key control points and the corresponding deformation of parts is necessary to be developed, which may improve the manufacturing efficiency and quality.
The prediction and control of deformation are difficult in the actual assembly process because of the weak stiffness of large thin-walled structures. A lot of studies have been carried out on the deviation analysis and control of the compliant assembly. Liu and Hu 1 proposed the method of influence coefficients (MIC), which is the most popular to study the deviation propagation in the compliant assembly. A sensitive matrix is derived to reflect the linear relationship of deviations between parts and assembly by using the MIC. Yue et al. 2 extended the MIC to the multi-station assembly by using the state-space model in modern control theory. Camelio et al. 3 combined the principal component analysis and MIC to consider the geometric covariance of variation sources. Mei et al. 4 proposed the assembly variation analysis method based on MIC and the interval approach. Moreover, Xing and Wang 5 put forward a power balance method to obtain a higher calculation accuracy for the deviation of assembly. Cai et al. 6 developed a unified variation model of the assembly of sheet metal, in which the overall 3D variation was decomposed into rigid variation in the in-plane direction and compliant variation in the out-of-plane direction. A fractal theory model was proposed by Pan et al. 7 to obtain the relationship between the part deformation, the clamping force, and the contact area. Qiao et al. 8 established a calculation method for assembly deviation based on surface deviation modeling, by which the maximum assembly deviation may be obtained accurately. Chang et al. 9 presented a successive calculating model to solve the local plastic deformation problem with the various influencing factors on the assembly deviation. Liao and Wang 10 used the wavelet analysis and finite element method (FEM) to study the impact of component variations with different scales on the assembly variation. Yi et al. 11 proposed a generic integrated approach for assembly tolerance analysis based on the shapes of skin model and the accuracy and reliability of assembly tolerance analysis may be improved effectively. Li et al. 12 established a deviation propagation model based on basic deviation patterns to describe the field distribution of deviation for large thin-walled structures. The correlation between the basic deviation patterns of part and assembly was established. The contribution of each basic deviation pattern of part to assembly may be calculated to provide the possibility for the deviation control of assembly. But the further investigation to establish the relationship between the basic deviation pattern and the control points is necessary.
Based on the assembly deviation analysis model, many deviation diagnosis and control methods have been developed combined with the FEM and statistical techniques. Ding et al. 13 developed a methodology for diagnostics of fixture failures in multistage manufacturing processes (MMP), in which the fixturing layout geometry was considered and the state-space model of the MMP process was established. Ceglarek and Shi 14 combined the principal component analysis and pattern recognition approach to detect and isolate dimensional deviations of part caused by fixture. In addition, the optimal layout of fixtures and measurement points is important for the diagnosis and optimal control of assembly deviation. Menassa and DeVries 15 used the Broyden-Fletcher-Goldfarb-Shanno optimization method to determine the “3-2-1” fixture support positions to realize the minimal workpiece deformation. Cai et al. 16 developed nonlinear programming methods to calculate the best “N” locating points in an “N-2-1” locating principle. A new fixture design methodology was proposed by Dahlström and Camelio 17 to analyze the sensitivity of the assembly deviation to the fixture deviation for different assembly configurations. Khan et al. 18 put forward an optimized configuration method to ensure the best classify of any fixture error. To achieve a balance between the measurement uncertainty and the cost of measurements, Djurdjanovic and Ni 19 employed the stream of variation methodology to evaluate various measurement schemes in multi-station machining systems. Ding et al. 20 proposed a comprehensive method on the diagnosability of the multi-station assembly process based on the state space model, by which the deviation diagnosis by the minimum measurement point arrangement was realized. Liao and Wang 21 developed an optimization algorithm to optimize the fixture and joint positions, in which the global optimization algorithm and finite element analysis was integrated to minimize the assembly variation. Abedini et al. 22 proposed an optimization method to realize the optimal layout of locators for minimum machining error in “3-2-1” locating approach based on the genetic algorithm. Shukla et al. 23 established an approach for optimal key characteristics-based sensor distribution in a multi-station assembly process, by which the variation sources responsible for product quality defects may be diagnosed and the maximum arrangement of measurement points may be realized. Bi et al. 24 presented an optimization method of placement of the measurement points on large aircraft fuselage panels based on the D-optimality method and the adaptive simulated annealing genetic algorithm. Ahmad et al. 25 combined the genetic algorithm and finite element analysis to minimize the sum of the nodal deflection normal to the surface of the workpiece with a new optimization method of the “N-3-2-1” fixture layout for large metal sheets. Huan 26 established an assembly location optimization method based on the algorithm of perfect match of weighted complete bipartite graph, which can reduce the influence and improve the assembly quality of stiffened panel effectively. Khodabandeh et al. 27 investigated a novel fixture layout optimization method, which combined multi-objective ant colony algorithm and FEM to optimize the fixture layout and the number of clamps simultaneously.
The current deviation control methods mainly focus on the optimization of clamping layout for the insensitive points in structures to reduce the assembly deformation. However, the deformation at various points is obviously coupled and has an effect on the assembly deviation of large thin-walled structures due to the weak structural stiffness. The impact range of the clamping points is limited for the optimization method of clamping layout in large thin-walled structures, which leads to the poor effect on the deviation control and complex fixture design. A new optimization method based on the deviation adjustment of the key points on parts is necessary to be developed for the assembly deviation control of large thin-walled structures.
In this paper, the assembly deviation propagation model based on the basic deviation patterns is established. The quantitative relationship of contribution of basic deviation patterns between parts and assembly is derived. A new two-step optimization method based on adjustment of optimal points on the part is proposed for the deviation control of large thin-walled structures. In the first optimization process, a set of key measurement points is determined to describe the deviation of part accurately by the effective independence method. Then, the key control points for the specific basic deviation pattern, which have little influence on the other basic deviation patterns, are obtained based on the genetic optimization algorithm. Meanwhile, the deformation at these key control points is calculated and the assembly deviation may be suppressed efficiently. Finally, the simulation for the assembly process of two thin-walled cylindrical parts is conducted to verify the proposed method of deviation control.
The deviation propagation model based on the basic deviation patterns
The deviation of large thin-walled structures is caused by the deformation during the manufacturing process. In the linear elastic deformation situation, the part deviation

where
The eigen-decomposition of the structural stiffness is introduced to derive the basic deviation patterns (BDPs) of the part. All of eigenvectors
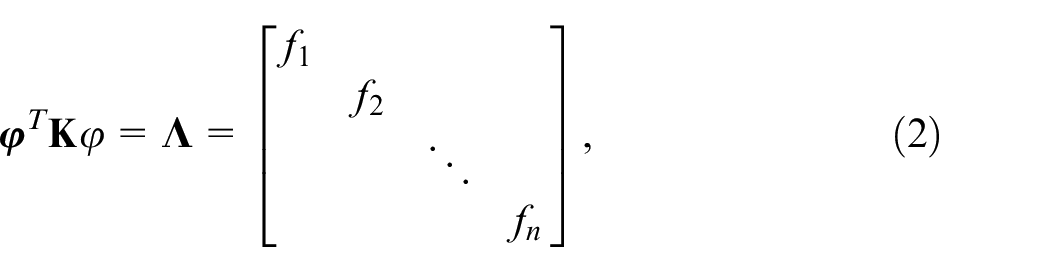
where the eigenvector
Substituting equation (2) into equation (1), the deviation may be rewritten as
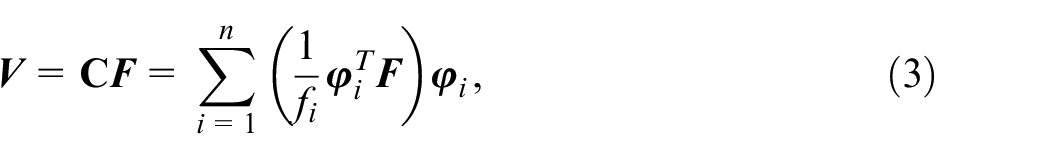
where
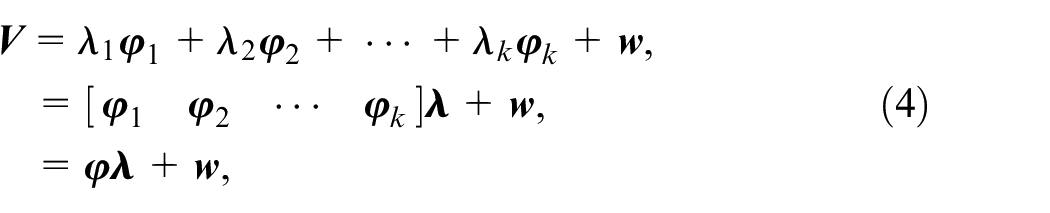
where
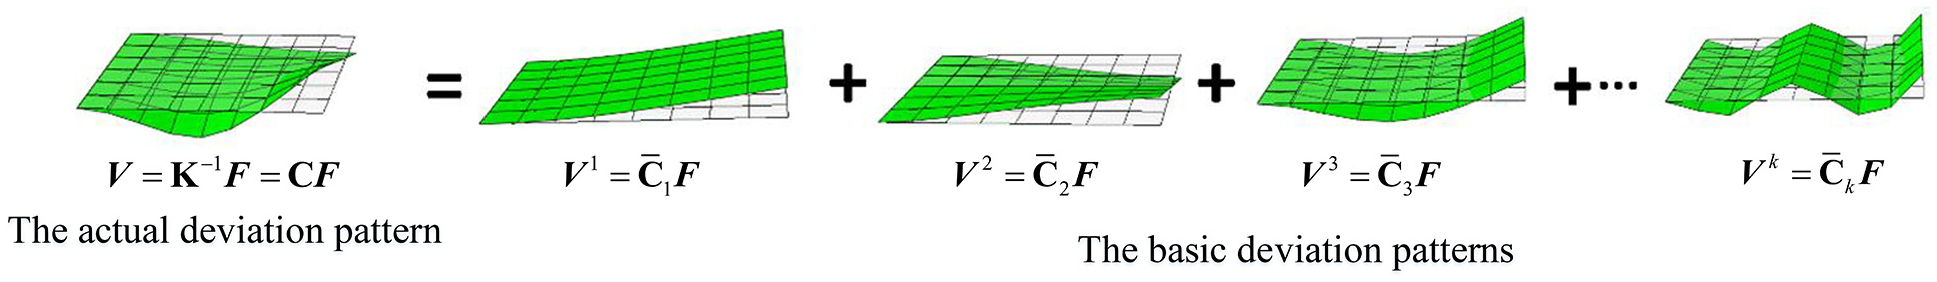
Deviation decomposition of part.
The least squares method is used to solve equation (4) and the deviation coefficients for the corresponding BDPs are derived as

here
In the assembly process, the spring-back force is equal to the clamping force as well as their directions are opposite based on the linear elasticity assumption, namely

where
Assuming that

where the dimensions of the columns of
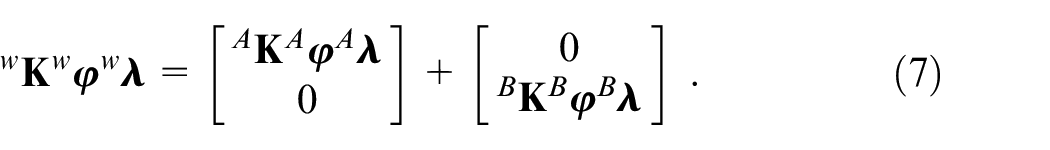
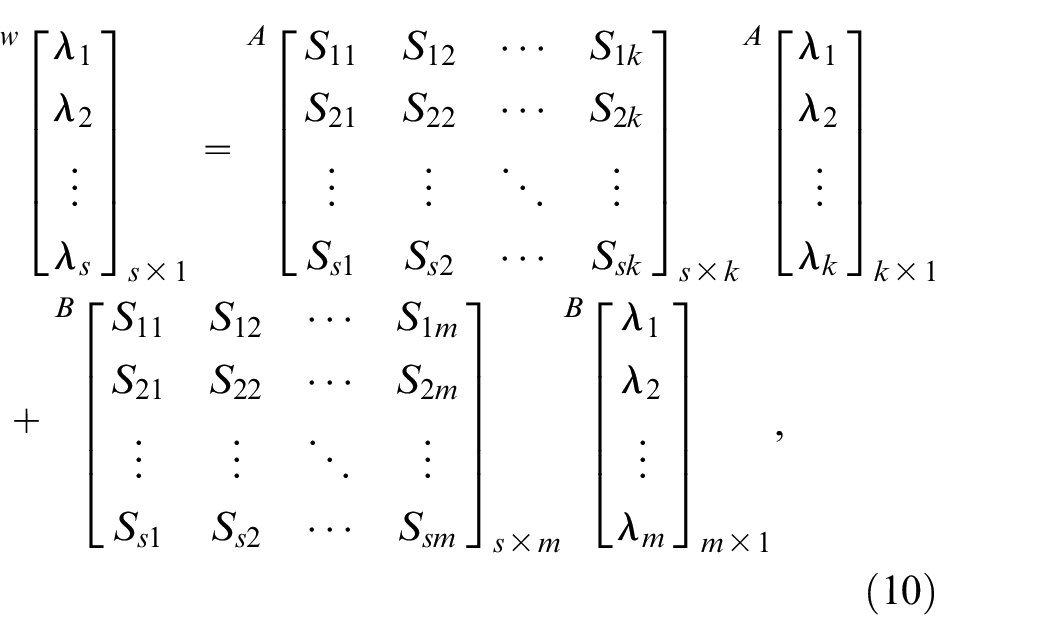
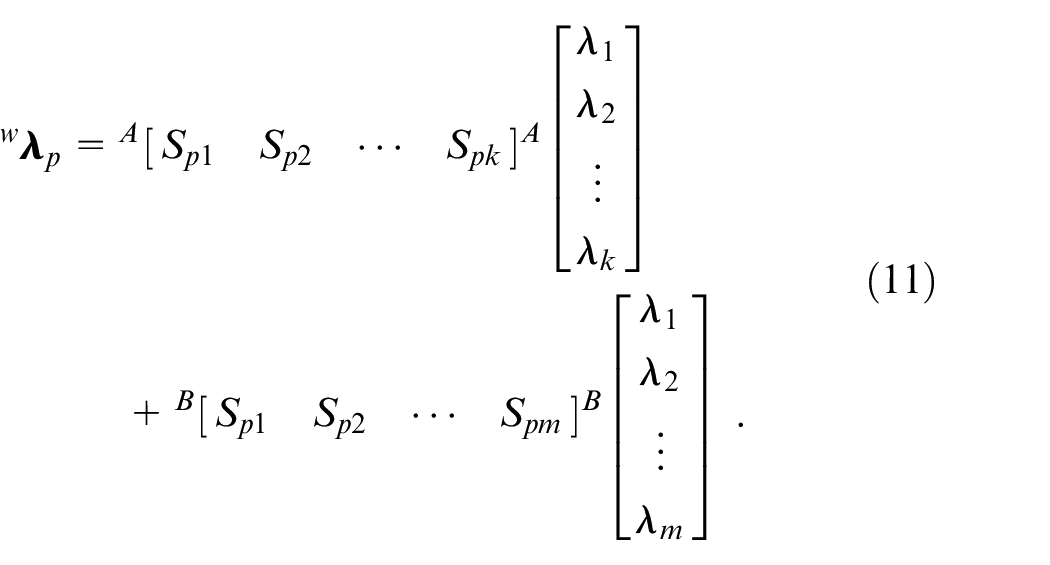
Substituting equation (8) into equation (7), the deviation propagation model for large thin-walled structures based on BDPs may be written as
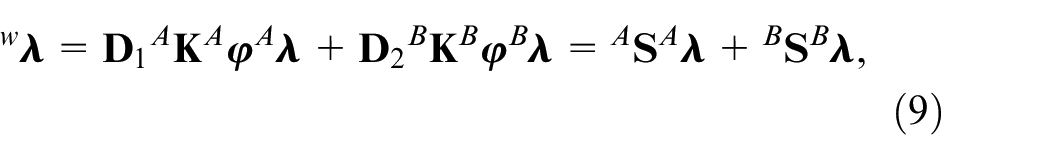
where
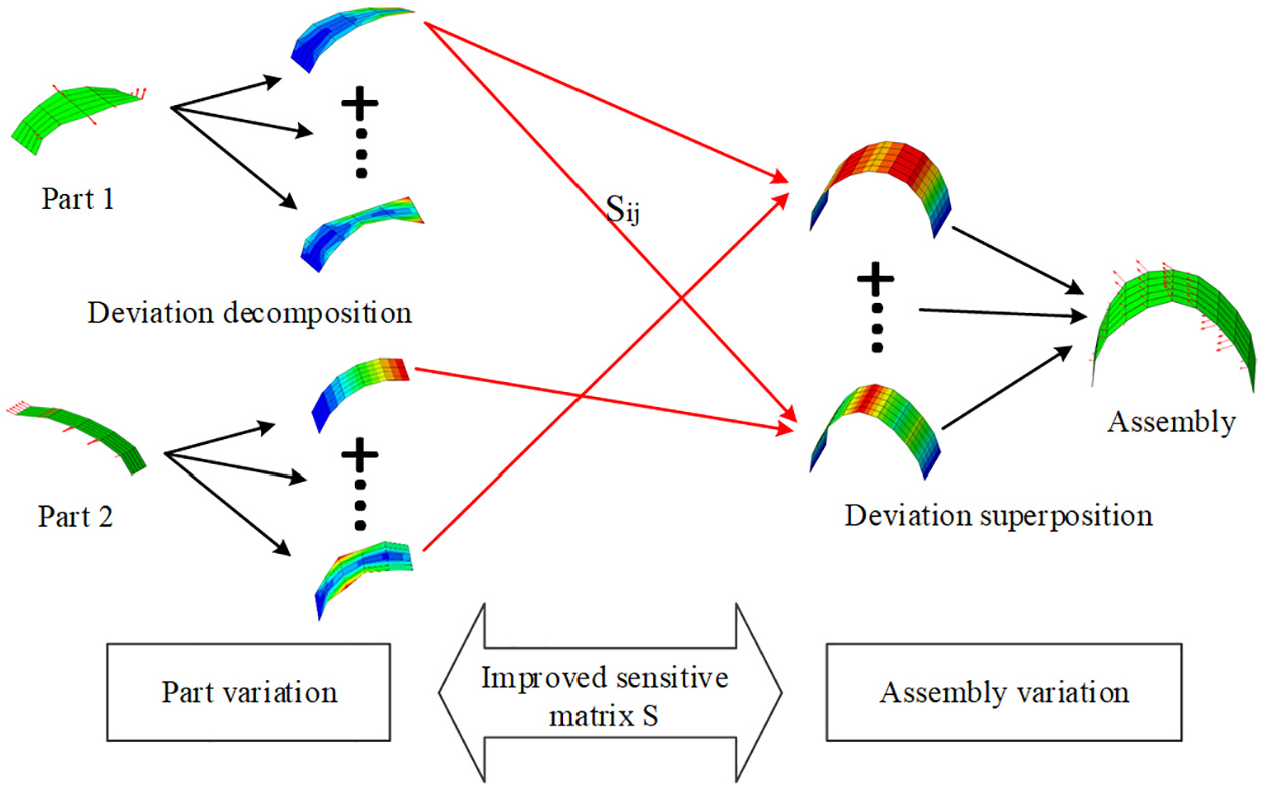
The analyzing process of the deviation propagation model for large thin-walled structures is illustrated in Figure 2. The parts and assembly may be described by the linear combination of a series of BDPs. Every element in the sensitivity matrix represents the effect of one BDP of part to that of assembly. The deviation coefficient of assembly may be denoted as
The sensitive analysis of the deviation propagation model for thin-walled structures.
where
Then, the relationship between the pth BDP of the assembly and the BDPs of the part may be described as
The ratio
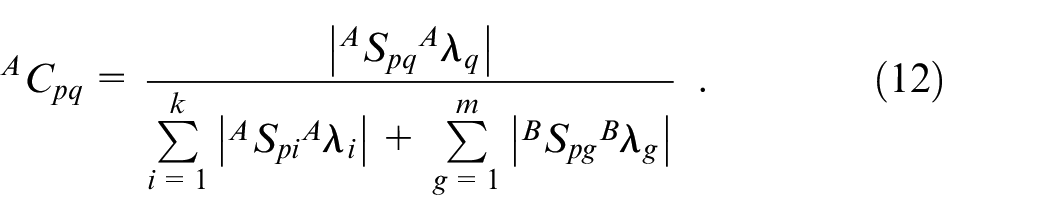
The contribution ratios of the BDPs of part to assembly obtained with the deviation propagation model may be used to trace the source of the assembly deviation. The specific BDP that has the greatest influence on the assembly deviation may be determined. The key control points and the adjusted deformation may be optimized to reduce the deviation of assembly.
Optimization of key control points for deviation of assembly
The deviation of large thin-walled structures is related to each point on the structures because of the spring-back deformation in manufacturing process. Discrete points are necessary to be used in the characterization and control of assembly deviation. A two-step optimization method for the deviation control of assembly based on the deformation of a series of key points on the structures is developed. Firstly, the points on large thin-walled structures with little influence on the overall deviation are eliminated by the effective independence optimization method. The least key measurement points are optimized to describe all BDPs of part. Then, the genetic algorithm is used to obtain the key control points and the corresponding adjusted deformation for the specific BDP of part in terms of the first optimization results. The contribution of specific BDP of part to assembly is decreased by adjusting the deviation of these points, which makes the reduction of deviation for the assembled structure. The key control points for BDPs of large thin-walled structure is shown in Figure 3. The hollow points are the key measurement points describing all BDPs obtained in the first optimization process, and the solid points are the key control points corresponding to the specific BDP in the second optimization.
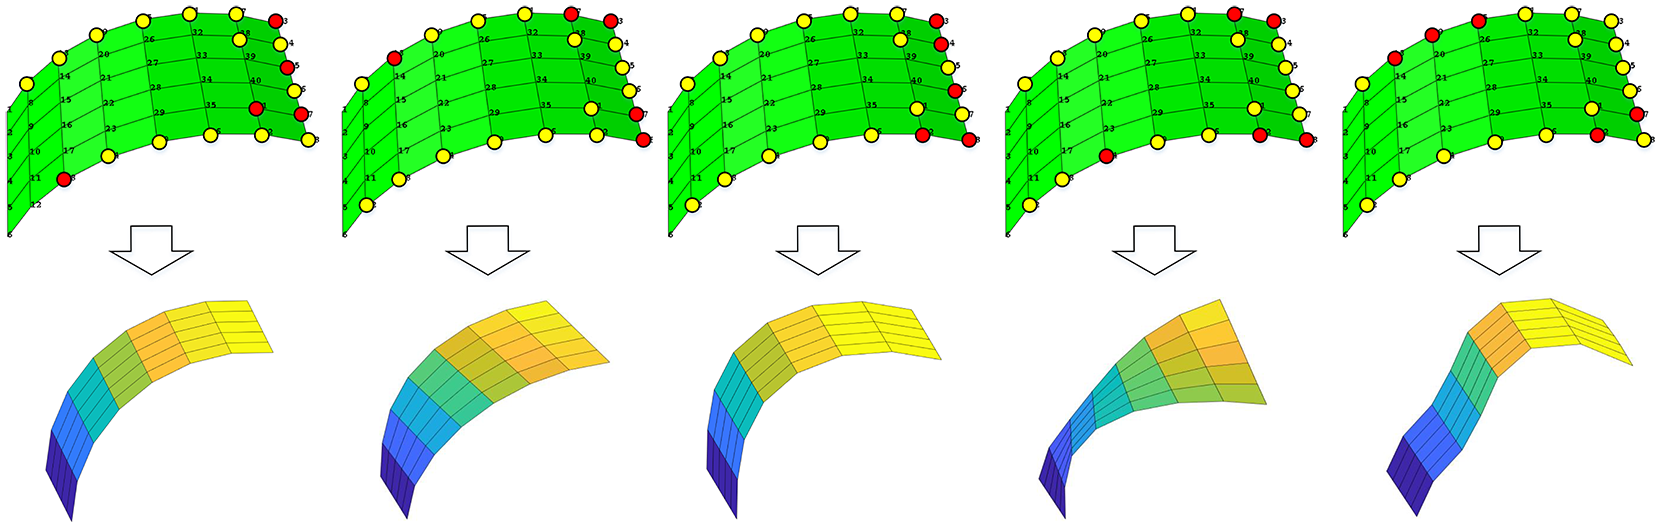
The relationship between the key control points and BDPs.
The optimal layout of key measurement points
According to the geometric characteristics of large thin-walled structure, the initial points on the structure are evenly arranged on the part and are shown in Figure 4. The effective independence method (EIM) is adopted in the optimization of the key measurement points. This method was proposed by Kammer
28
and was originally applied to the optimization of the measurement points for structural modal detection. Based on the distribution of initial points, the EIM is used to collect enough deviation information with the fewest measurement points during the optimization process. In the optimization method, the fisher information matrix

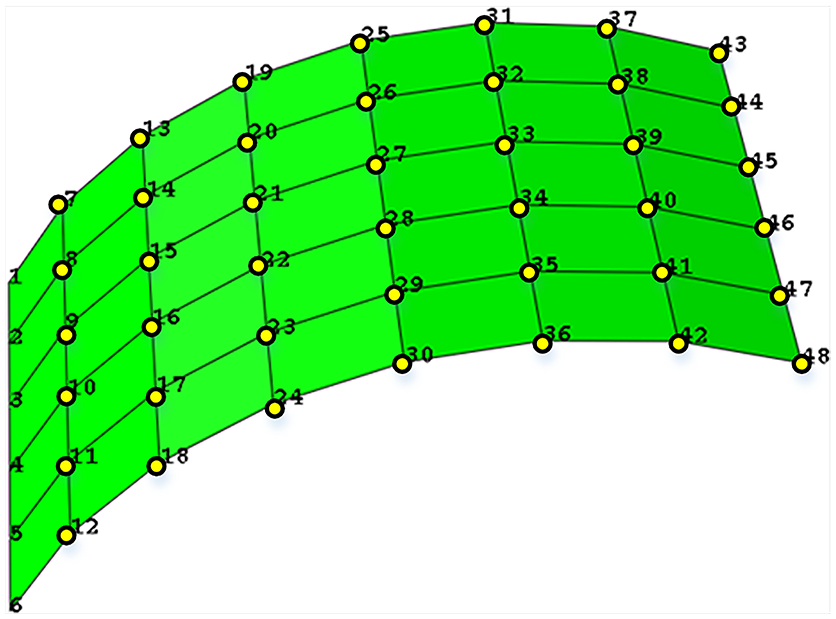
The initial distribution of points on the structure.
The BDPs are linear independence because the vectors are obtained by the eigen-decomposition of stiffness matrix. Then the fisher information matrix
The effective independence index of the ith point in the optimization process may be expressed as
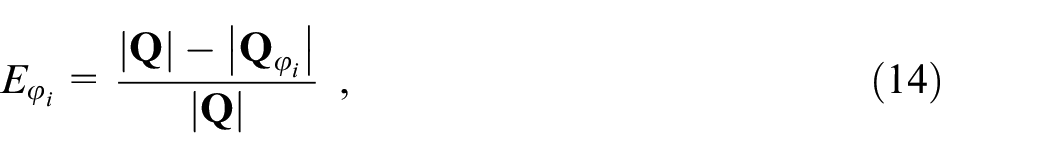
where
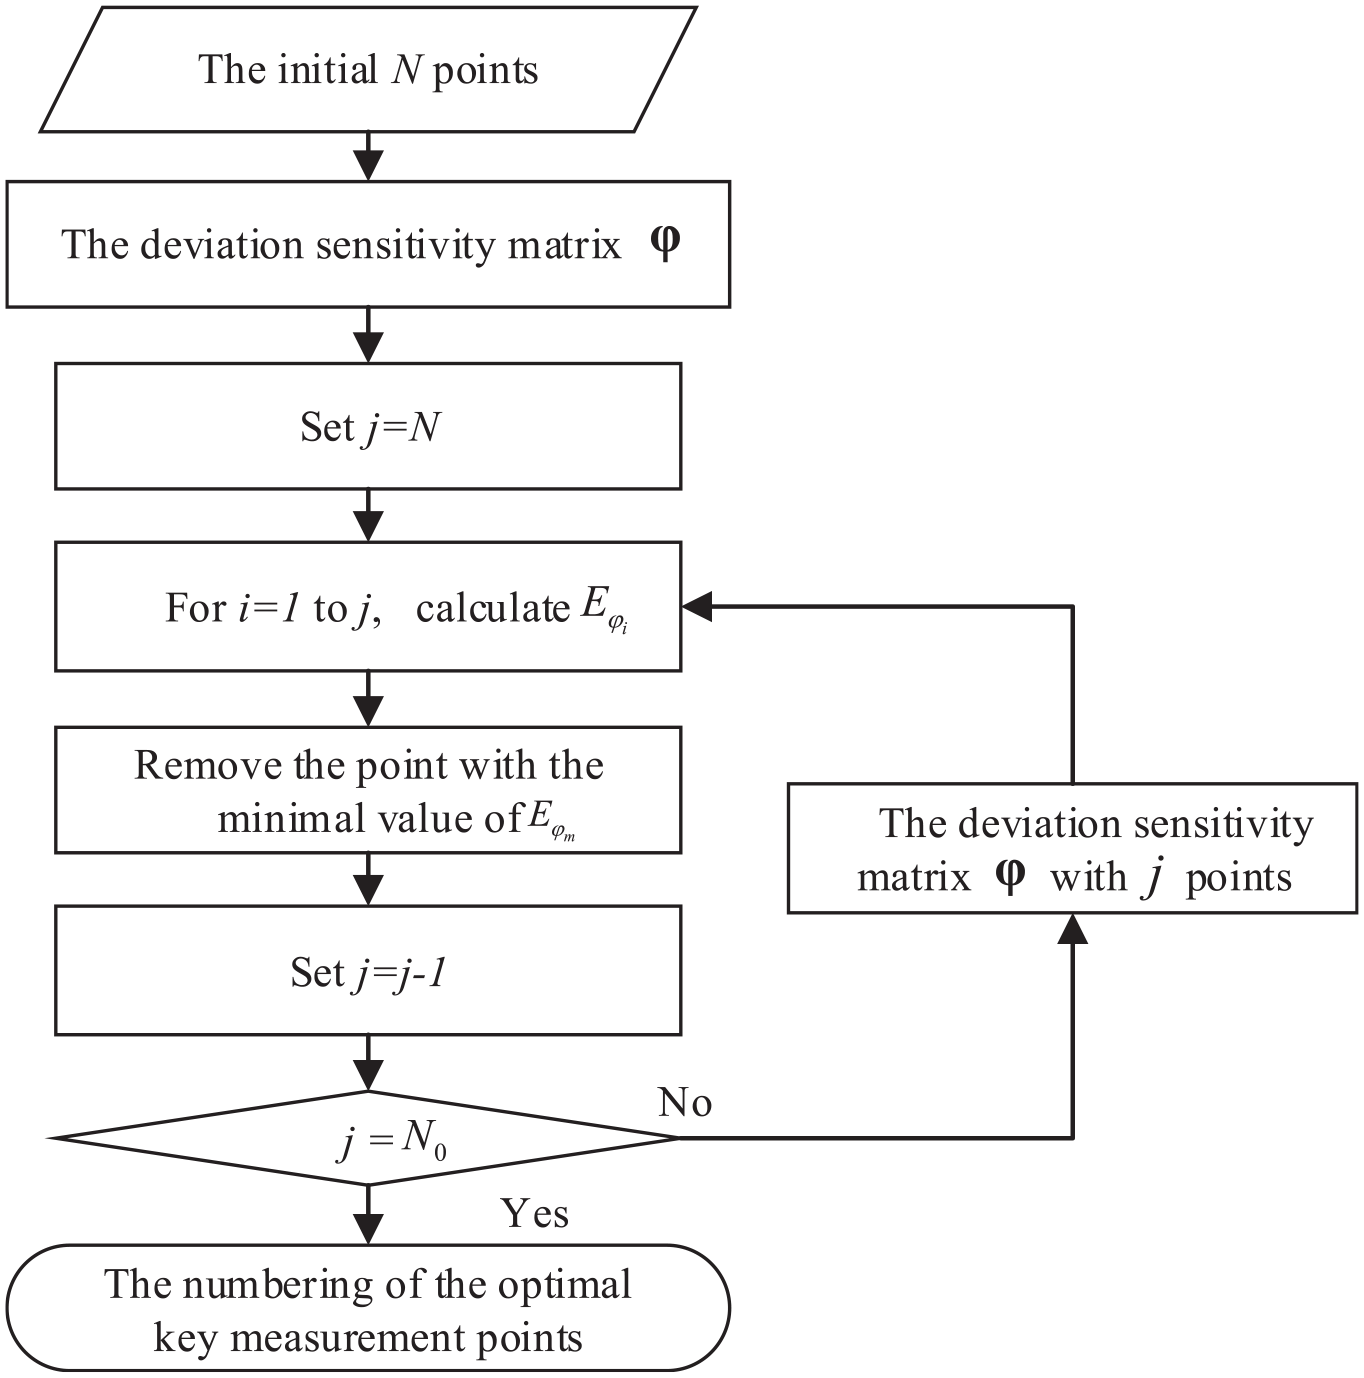
The optimization process of key measurement points based on EIM.
The number of initial points of the part is assumed to be N, and the key measurement points for deviation characterization of part after the optimal process is
where
where
The key control points for specific BDP
The deviation at every point of large thin-walled structure is not independent, and the adjustment of arbitrary point has great influence on the assembly deviation. The relationship between the adjusted deformation of control points and the assembly deviation is difficult to be established. The control points and the corresponding deviation adjustment of large thin-walled structures can not to be calculated by analytical methods. Therefore, the searching technique is efficient for the optimization of deviation control for large thin-walled structures.
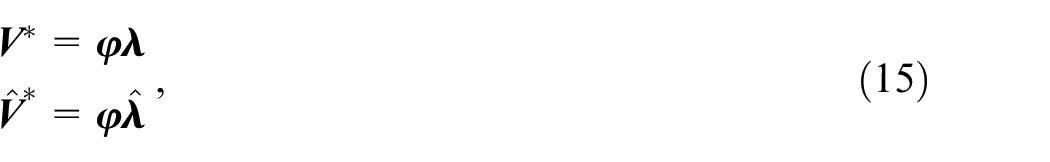
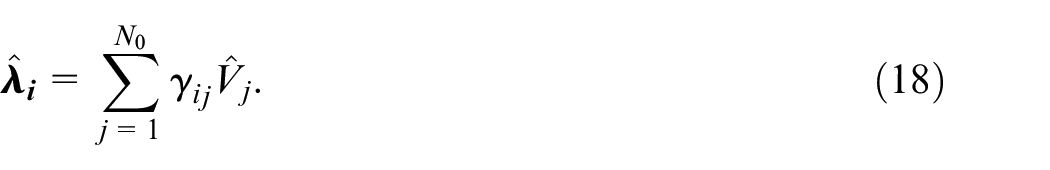
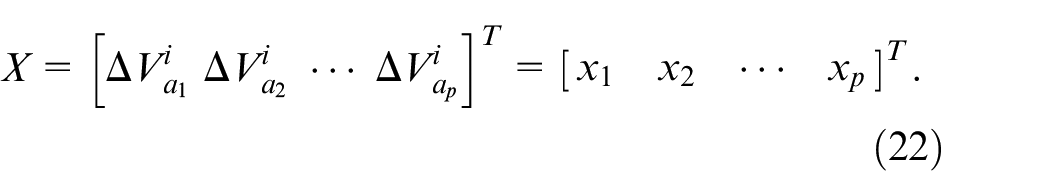
The BDPs may be described by the key measurement points based on the first optimization. So the deviation of part may be characterized by the optimal key measurement points, which is denoted as
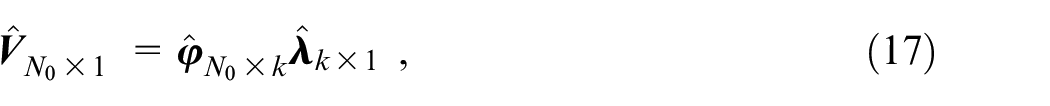
where
Set
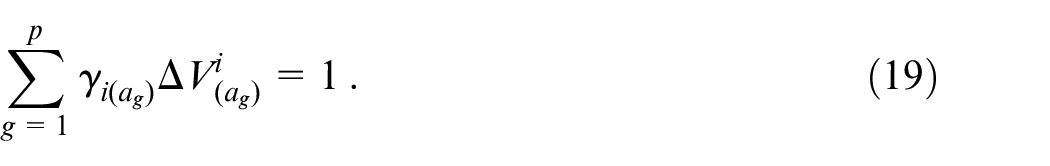
The jth column in the weight coefficient matrix
The number of key control points corresponding to each BDP is p. The index of the points corresponding to the ith BDP is denoted as
Meanwhile, the other BDPs are affected during the control process of the specific BDP. To measure the influence of the adjustment of the ith BDP on the qth BDP, the absolute change of the qth deviation coefficient is expressed as
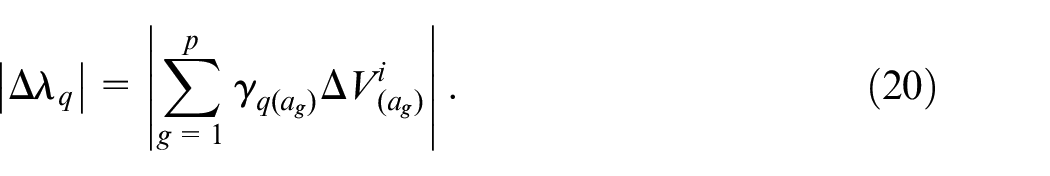
In order to evaluate the whole influence of the suppression of the ith deviation coefficient, an influence coefficient, T, is defined, which describes the mean value of the total change of the other deviation coefficients when
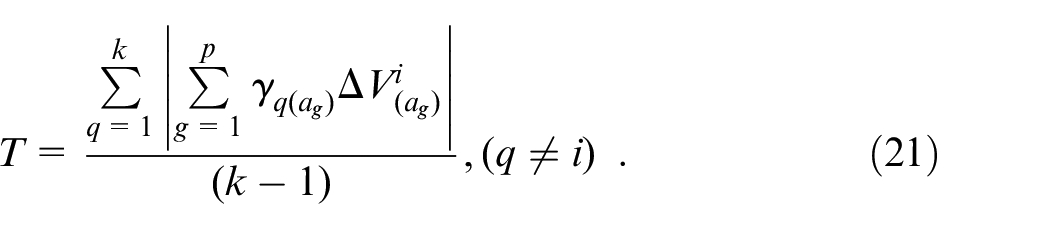
The optimization model is established to calculate the locations and the adjusted deformation of the optimal control points for each BDP. The design variables are the independent parameters which need to be obtained in the optimizing calculation. The index of the selected points to the ith BDP is assumed to be
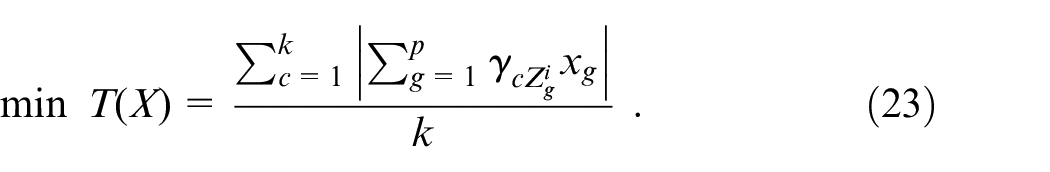
In this model, the objective optimization function T is the minimal mean value of the absolute change of all other deviation coefficients with the unit change of the ith deviation coefficient, which may be written as
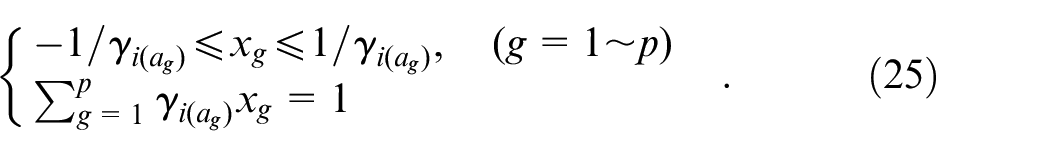
In order to prevent the range of the deviation adjustment for every control point is too large and the stability of the algorithm is affected, the adjustment range of each key control point is defined as

where
Therefore, the constraint equations of the optimization model may be defined as
Genetic algorithm (GA) is developed based on organismal evolution mechanism in genetics. The optimal solution is obtained by simulating the evolution law of nature in GA, and the specific algorithm flow is shown in Figure 6. In this algorithm, each point has three degrees of freedom. The design variables have high dimensions and characteristic of continuous random distribution, which contribute to the strong randomicity of the algorithm. In addition, the combination of control points is determined, and the possibility of local convergence of the optimization algorithm may be reduced by the traversal search of all combinations. Therefore, GA is adopted in the optimal algorithm for the deviation control of large thin-walled structures.
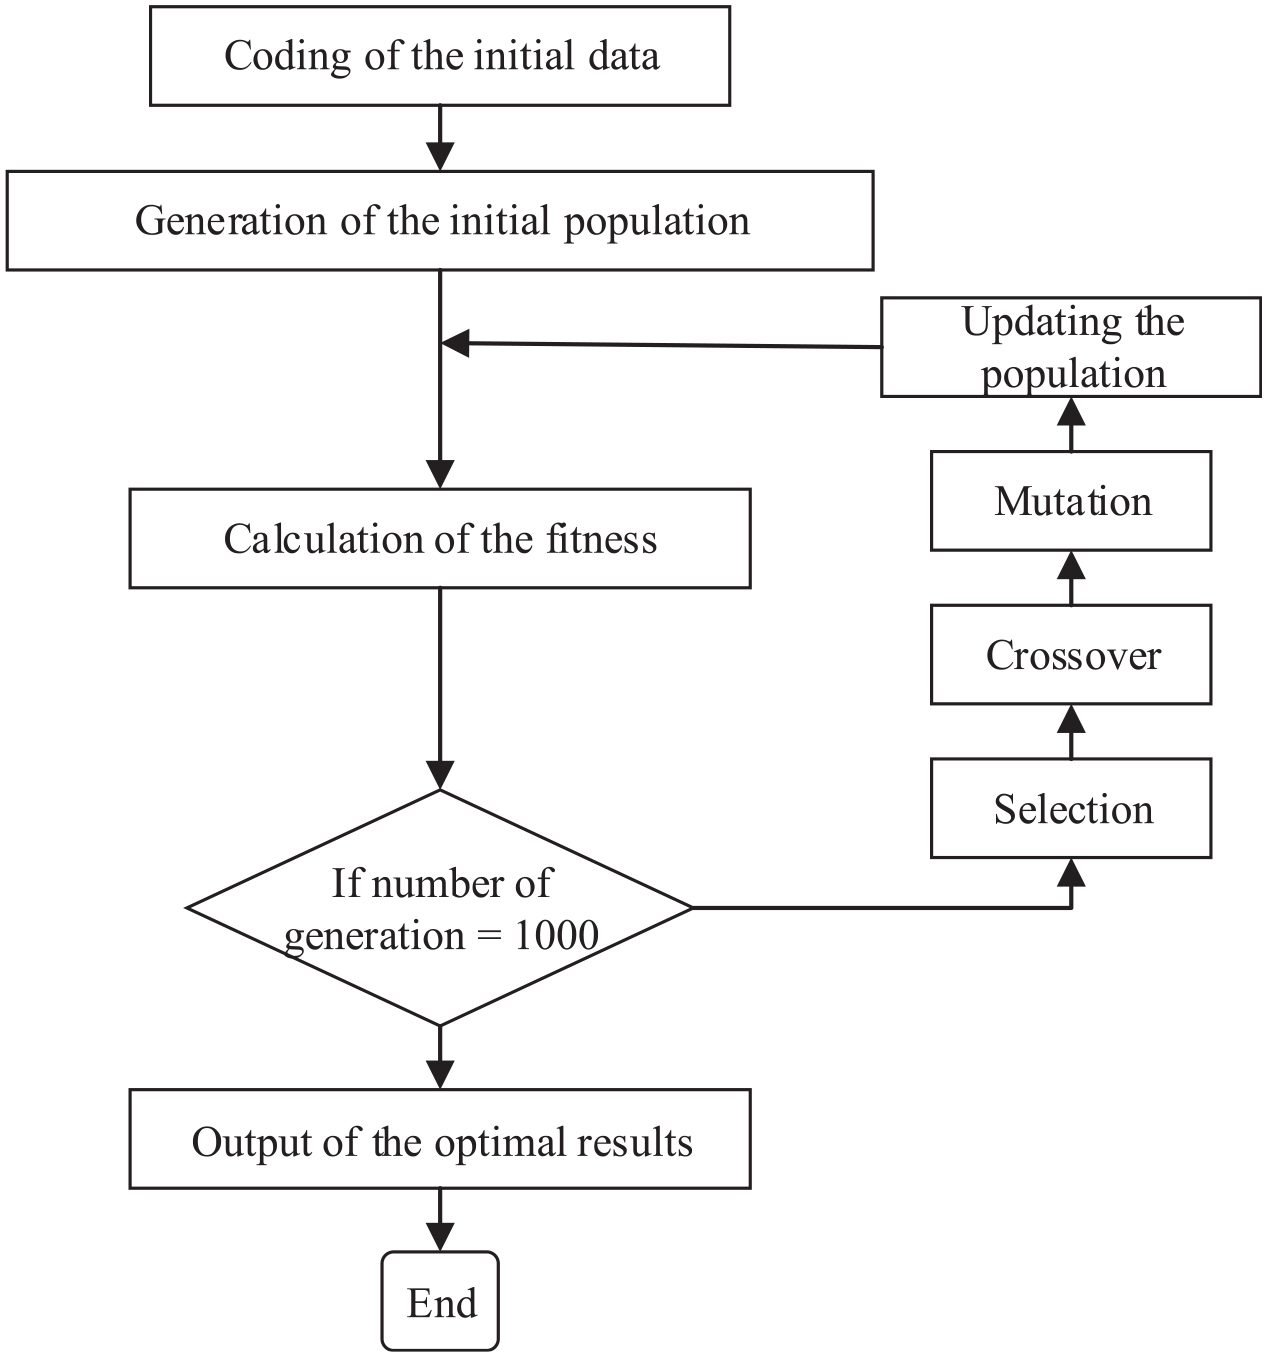
The flowchart of optimizing assembly deviation based on GA.
The optimization model is established based on the design variables, the objective optimization function, and the constrain conditions. GA is used to solve the optimal control points set and the adjusted deformation corresponding to each BDP. The contribution of specific BDP to the assembly deviation may be suppressed by adjusting the deviation of key control points. The optimized control after the traceability of the assembly deviation may be realized.
The algorithm flowchart to determine the optimal control point set for a specific BDP is shown in Figure 7. Firstly, the number P of the optimal key control points is defined for all BDPs. All of the possible combination may be calculated as
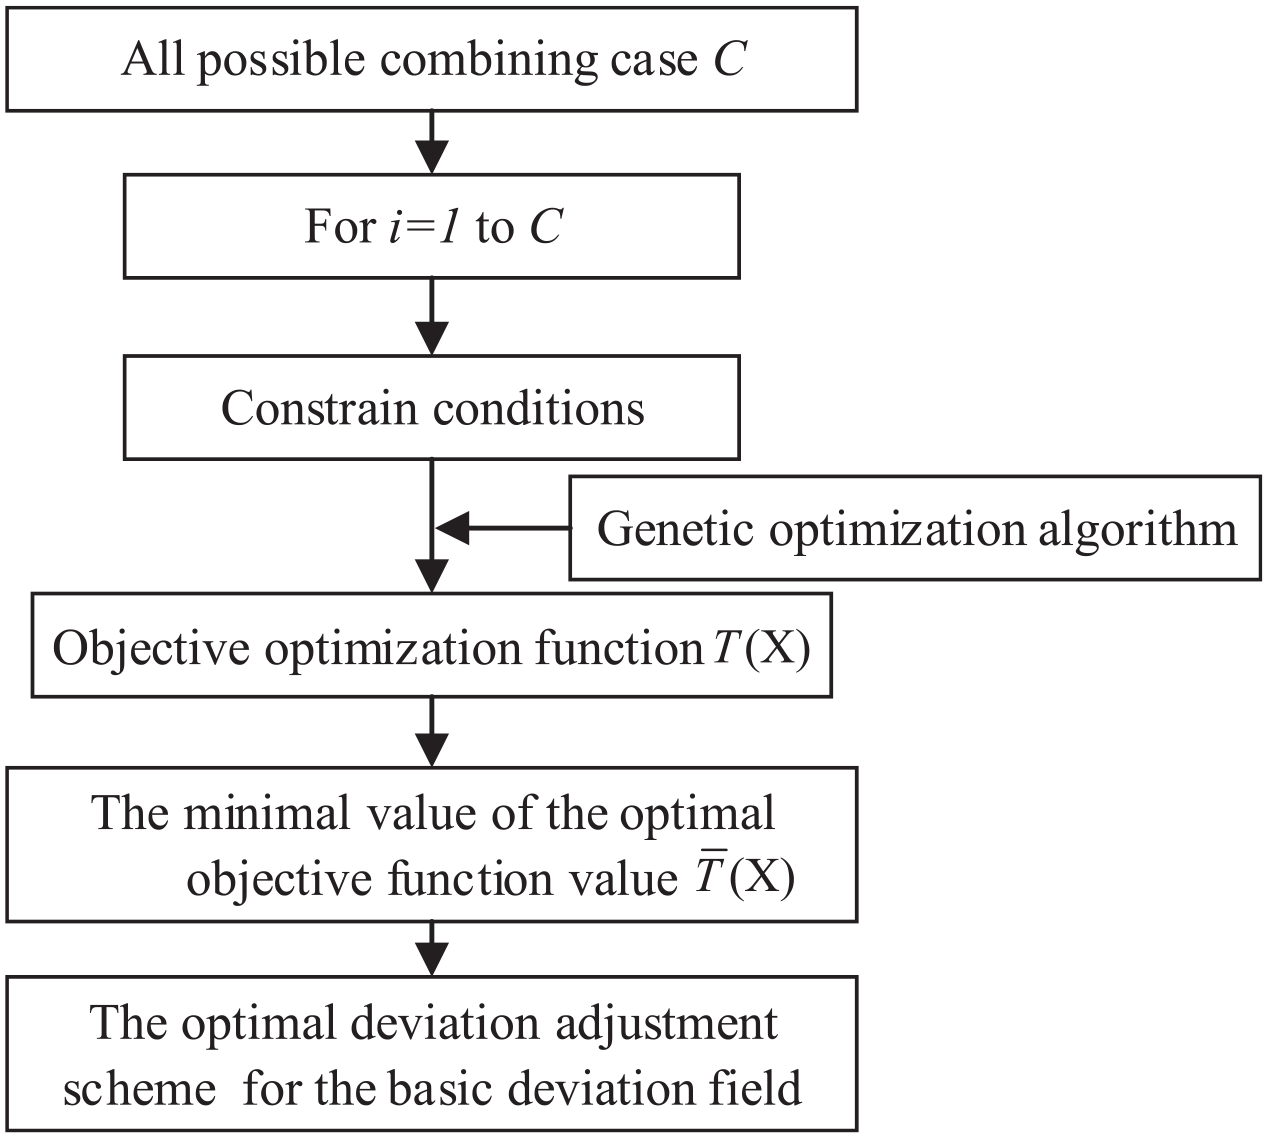
The flowchart of the optimal key control points of BDPs.
Case study
The deviations of two cylindrical thin-walled plates are measured by the FARO Laser ScanArm devices in order to obtain the reasonable initial deviations of parts, as shown in Figures 8 and 9, respectively. Then, the two plates are connected by the welding process. The radius of each plate is 500 mm, and the thickness is 1 mm. The material is aluminum alloy 6061 with Young’s modulus of 68.9 GPa and Poisson’s ratio of 0.3.
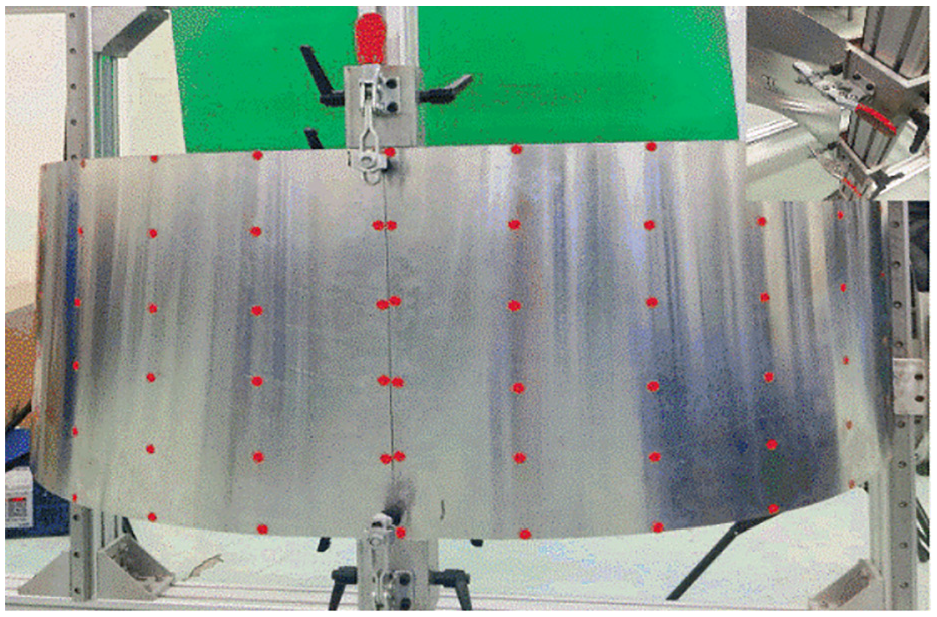
The experiment instrument for the assembly of two parts.
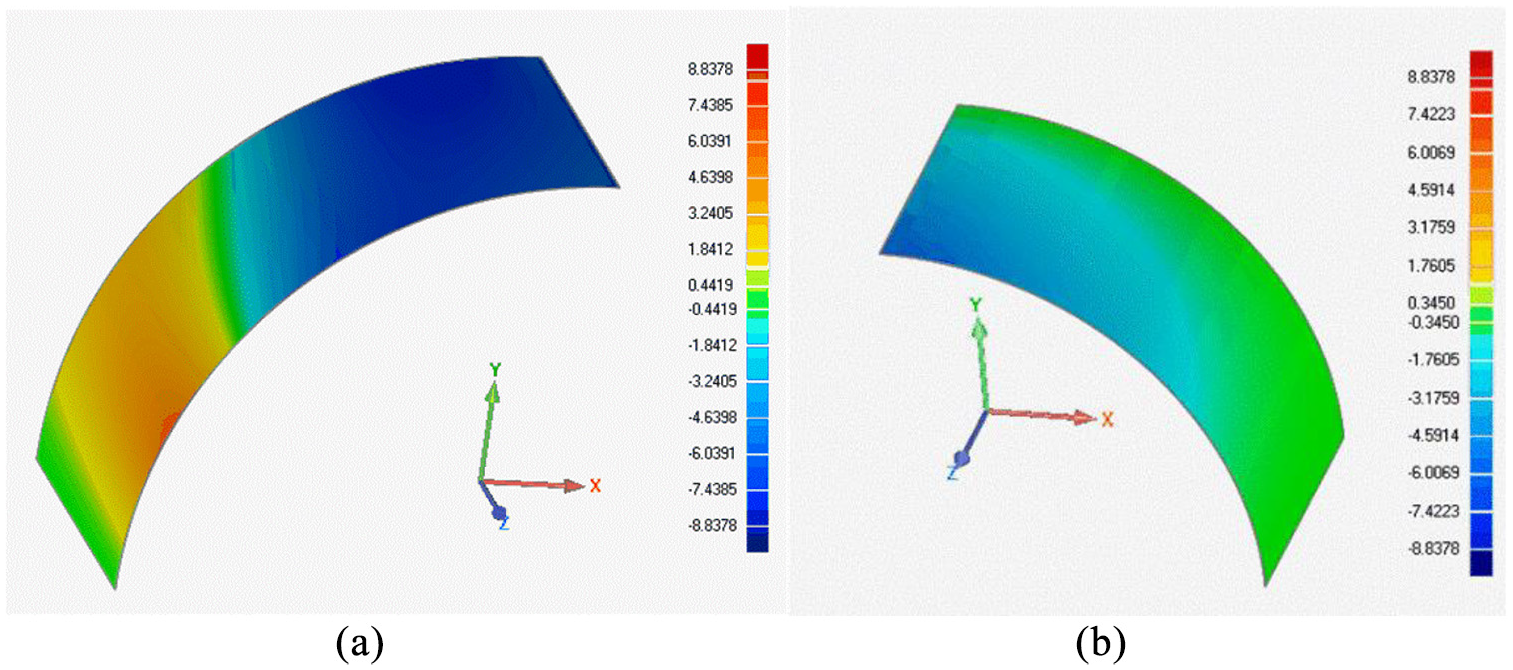
The initial deviation of parts: (a) Part A and (b) Part B.
Analysis of deviation propagation
In the assembly process, the edges of the two parts away from the weld are fixed. The structural stiffness matrix
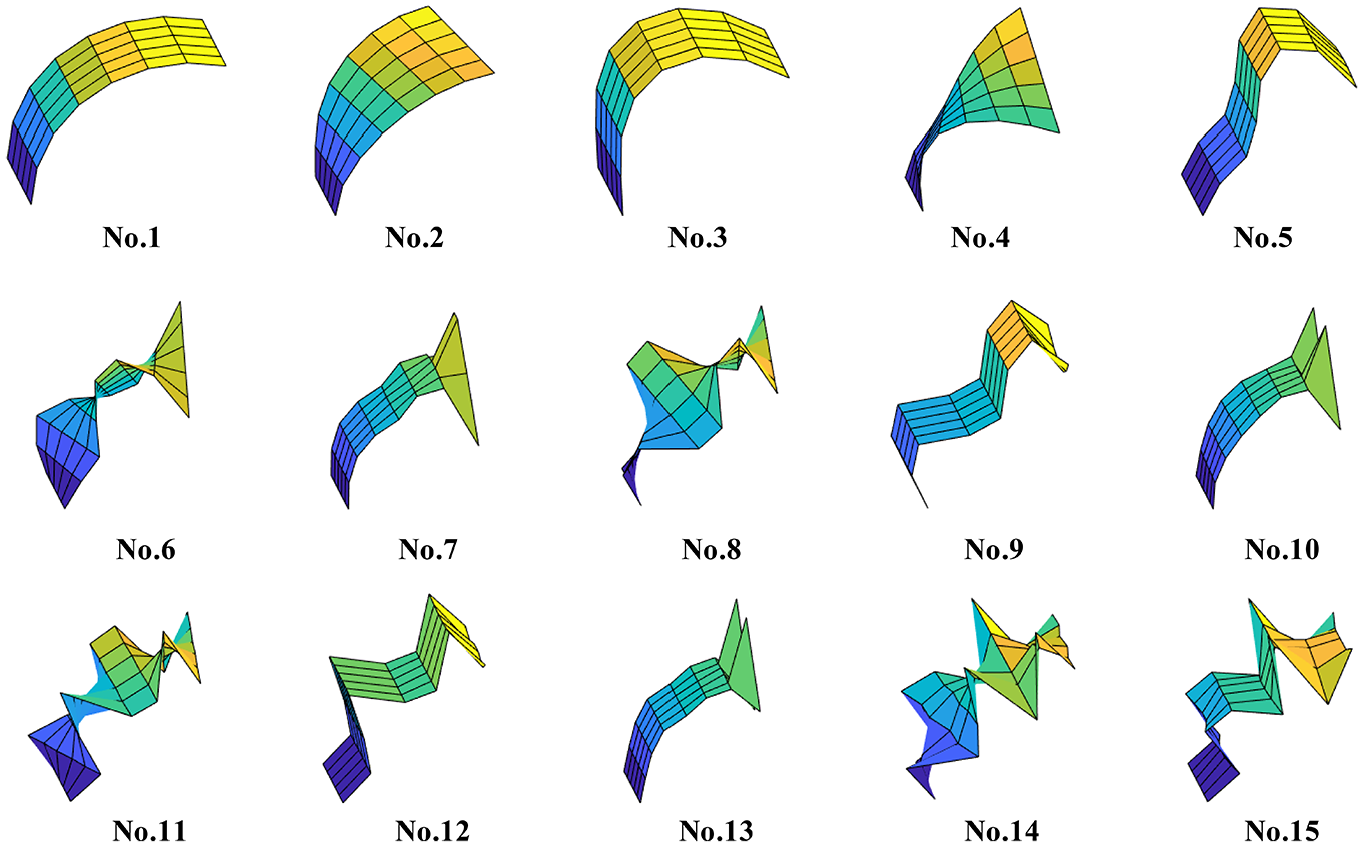
The fifteen BDPs of two parts.
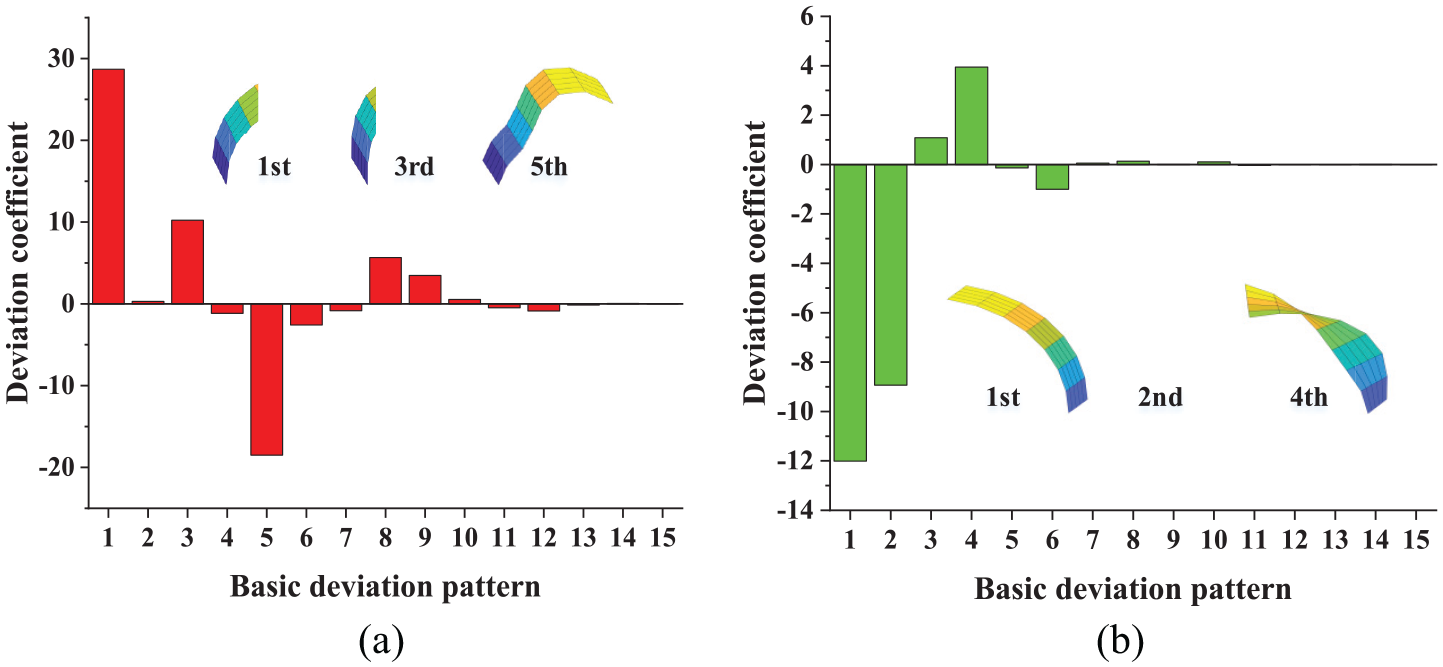
The deviation coefficients and three principal BDPs: (a) Part A and (b) Part B.
The basic deviation patterns of the assembly can be obtained with the Eigen-decomposition of
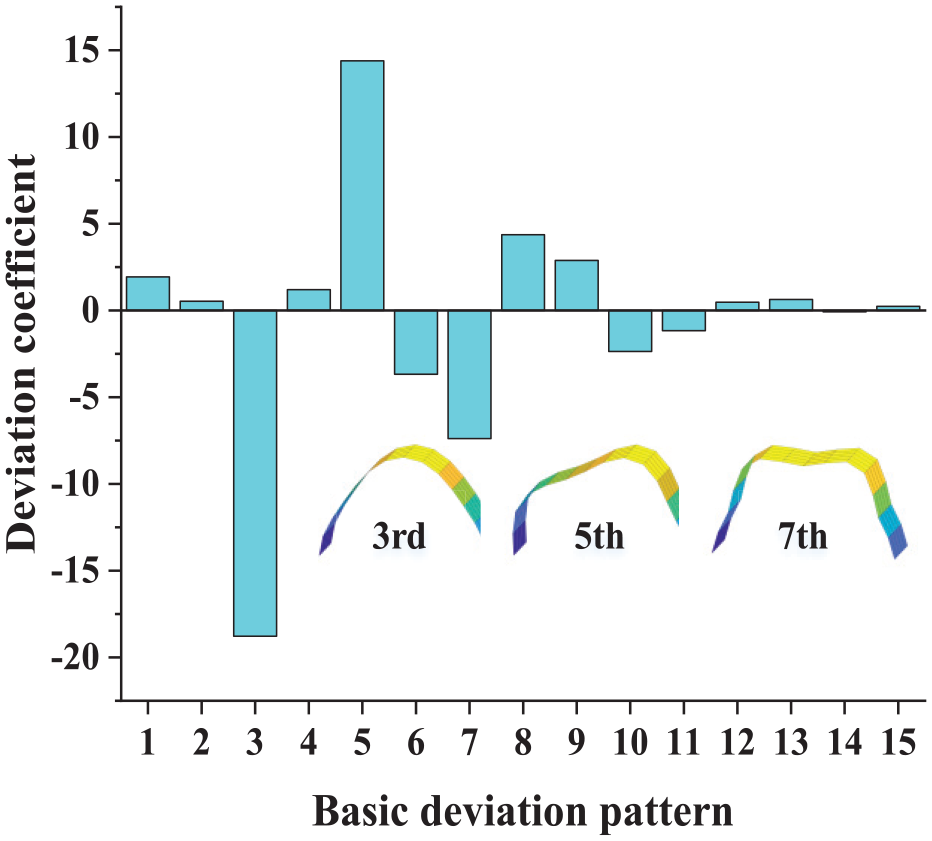
The deviation coefficients of the assembly.
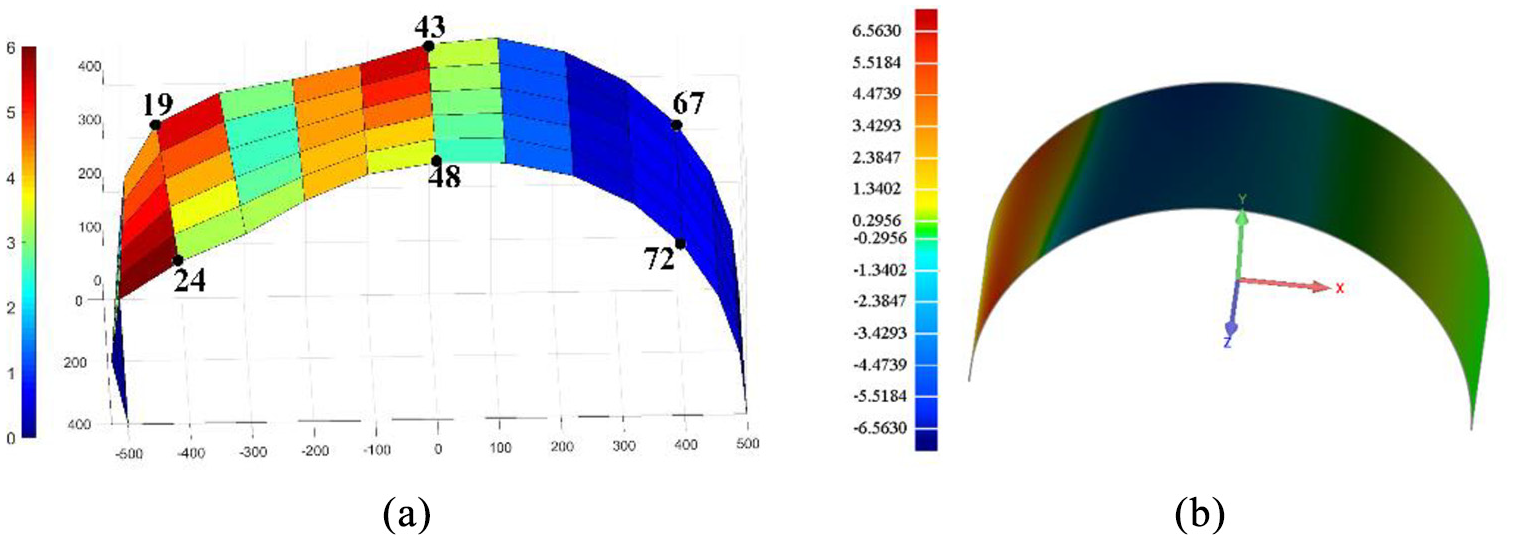
The comparison of the assembly deviation field: (a) numerical results and (b) experiment data.
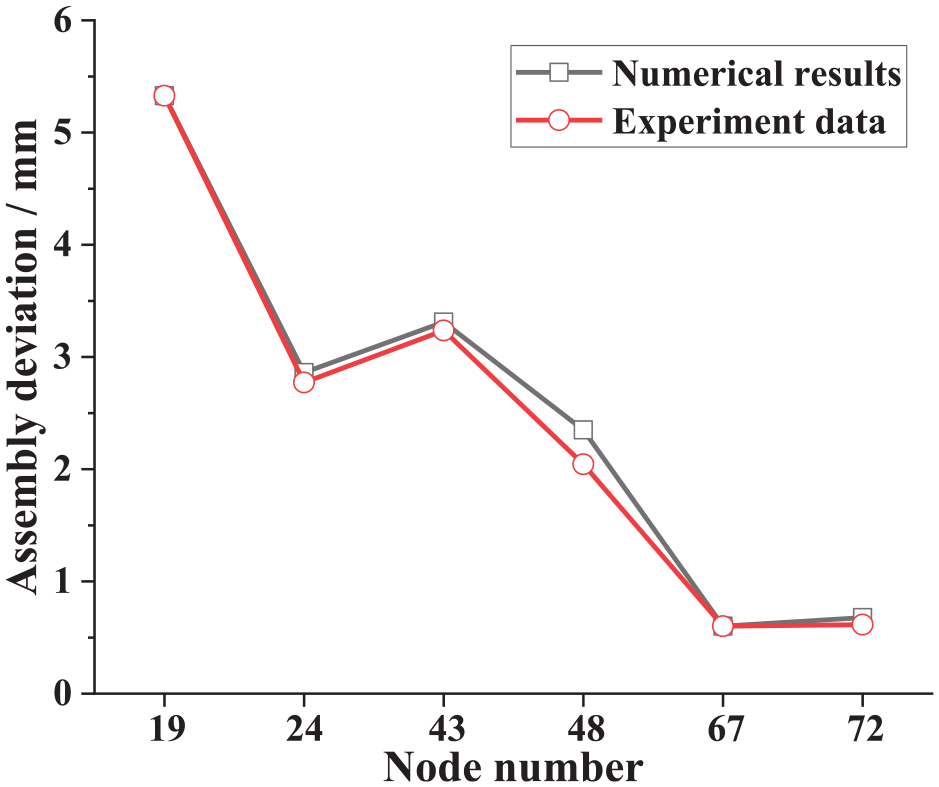
The comparison of the assembly deviation at several nodes.
Figure 11 shows that the principal BDPs of Part A are the first, the third, and the fifth ones, which are denoted as A1, A3, and A5, respectively. The principal BDPs of Part B are the first, the second, and the fourth and are denoted as B1, B2, and B4, respectively. The principal BDPs of the assembly are the third, the fifth, and the seventh illustrated in Figure 12, which are denoted as C3, C5, and C7, respectively. The contribution ratios between the principal BDPs of the parts and the assembly may be obtained according to the equation (8) and shown in Figure 15. Obviously, the principal BDPs of the assembly are mainly influenced by A3 and A5. The contribution ratio of A3 to C3 is 10.72%. In particular, A5 has a significant influence on the three principal BDPs of the assembly as shown in Figure 12, and the contribution ratios are 67.68%, 92.88%, and 62.52%, respectively. Meanwhile, some principal BDPs of the part may have little impact on the BDPs of the assembly, such as B2 and B4. Based on the contribution ratios, the deviation control can be carried out on the fifth BDP of Part A by the deviation adjustment of the key control points.
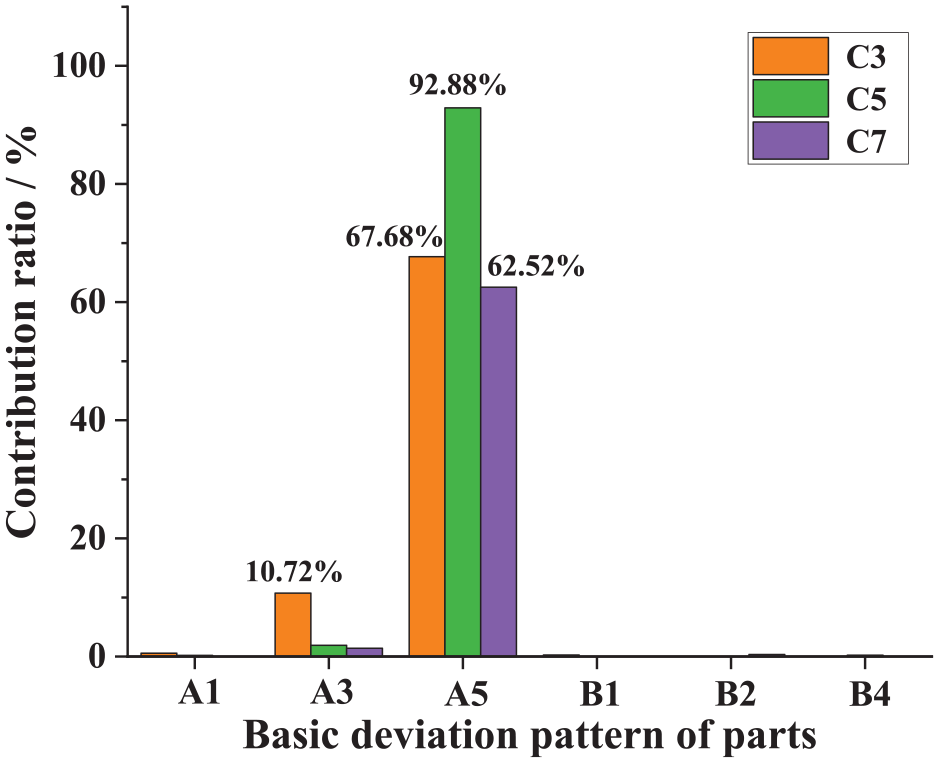
The contribution ratios in the assembly process.
The layout of the key measurement points on part
The optimal layout of the key measurement points is carried out on the Part A based on the contribution analysis. The meshing of part A is shown in Figure 16, which consists of 48 nodes and 35 elements. The nodes from 1 to 6 are constrained in the assembly process, and the deviations of the remaining 42 nodes are necessary to characterize the overall deviation field of the part. According to the EIM, several key measurement points can be selected and the relationship between the key measurement points and BDPs may be obtained.

The mesh of Part A.
The fisher information matrix of the optimal layout of measurement points is defined as
The change of condition number of
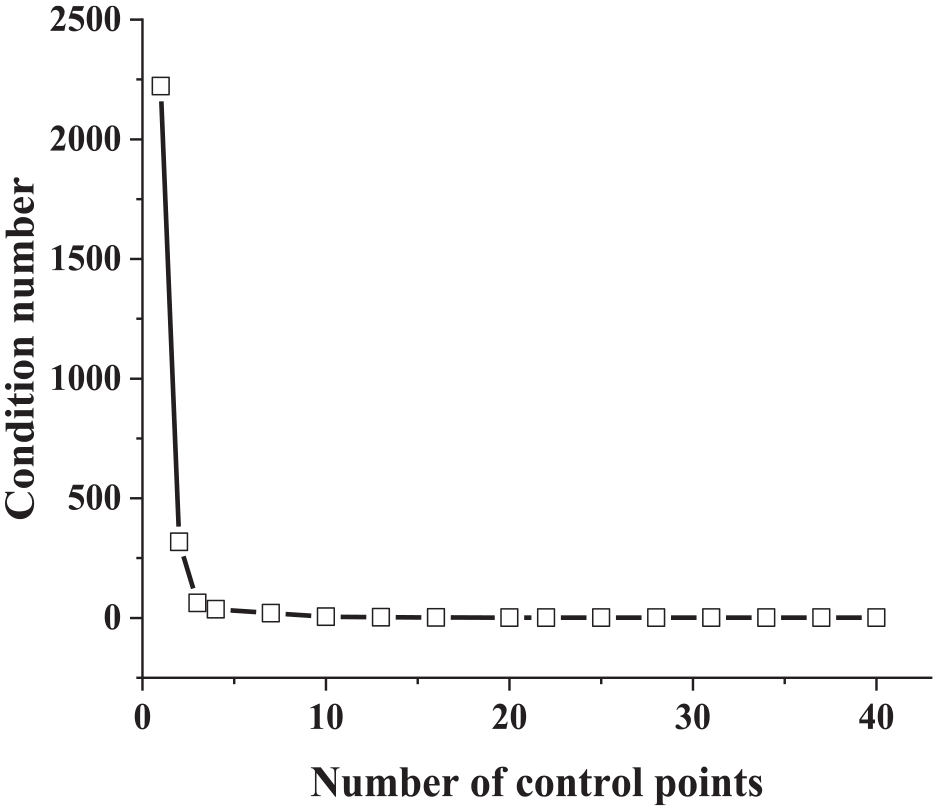
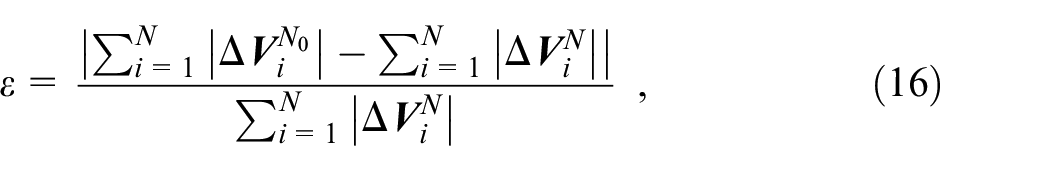
The value of condition numbers of
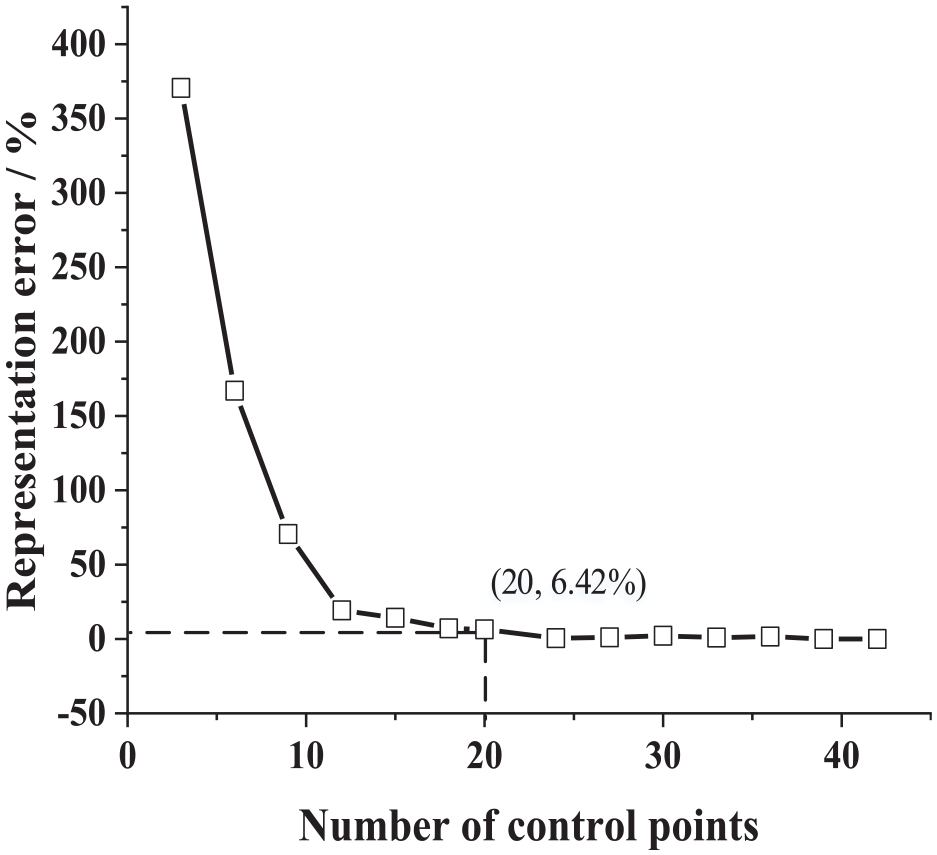
The representation errors during optimization.

The part with 20 key measurement points.
The comparison of the deviation coefficients calculated with 20 key measurement points and 42 points is shown in Figure 20. The maximal error calculated with 20 points occurs at the 12th BDP. The deviation coefficient calculated with the 42 points is −0.866 as well as that obtained with the 20 points is −0.923. The absolute error is 0.057. Therefore, the deviation description of part based on the key measurement points has high accuracy.
The comparison of optimization results of deviation coefficients.
The optimization deviation control of assembly
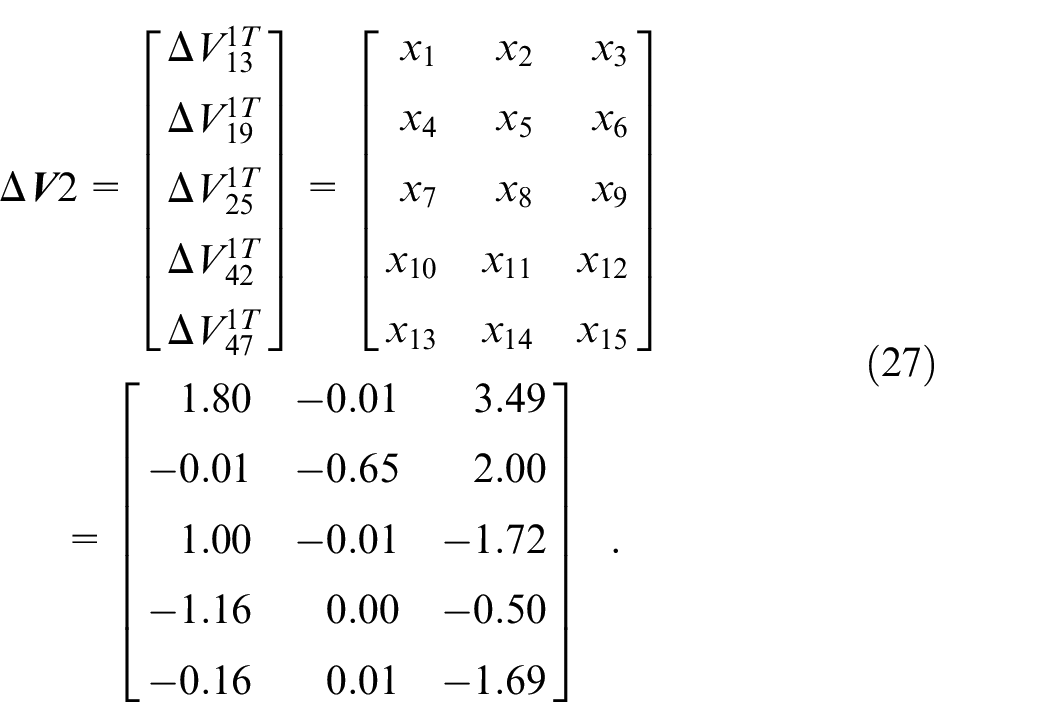
The relationship between key measurement points and the deviation coefficients after optimal layout of measurement control points may be obtained based on EIM. In order to improve the efficiency of the deviation control process, the number of key control points corresponding to each BDP is set to be five. According to the genetic algorithm, the number of key control points for each BDP and the corresponding deviation control value may be solved. In this case, the initial random number of individuals is 100, the selection probability is 0.6, the crossover probability is 0.8, the mutation probability is 0.1, and the maximum evolution generation number is 1000.
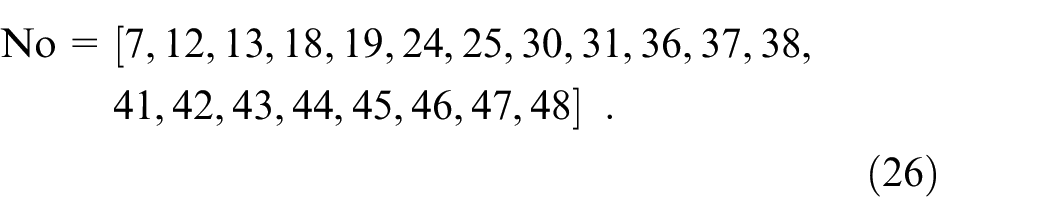
All possible combinations of five control points among the 20 key measurement points of the part are
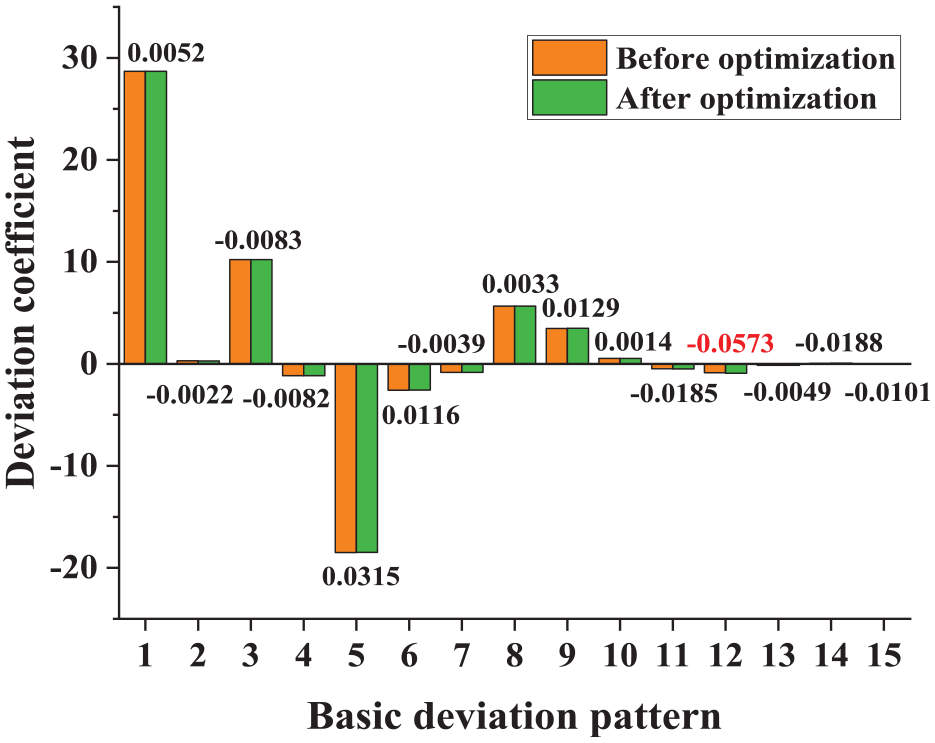
The changes in the fifteen BDPs after the optimization are shown in Figure 21. The deviation coefficient corresponding to the fifth BDP of Part A before deviation control is −18.477. The deviations of the five key control points are adjusted with the optimization results, and the deviation coefficient of the fifth BDP is suppressed to −10.477. Obviously, the deviation coefficient of the fifth BDP of Part A is reduced significantly, and the deviation coefficients corresponding to other BDPs are little affected.
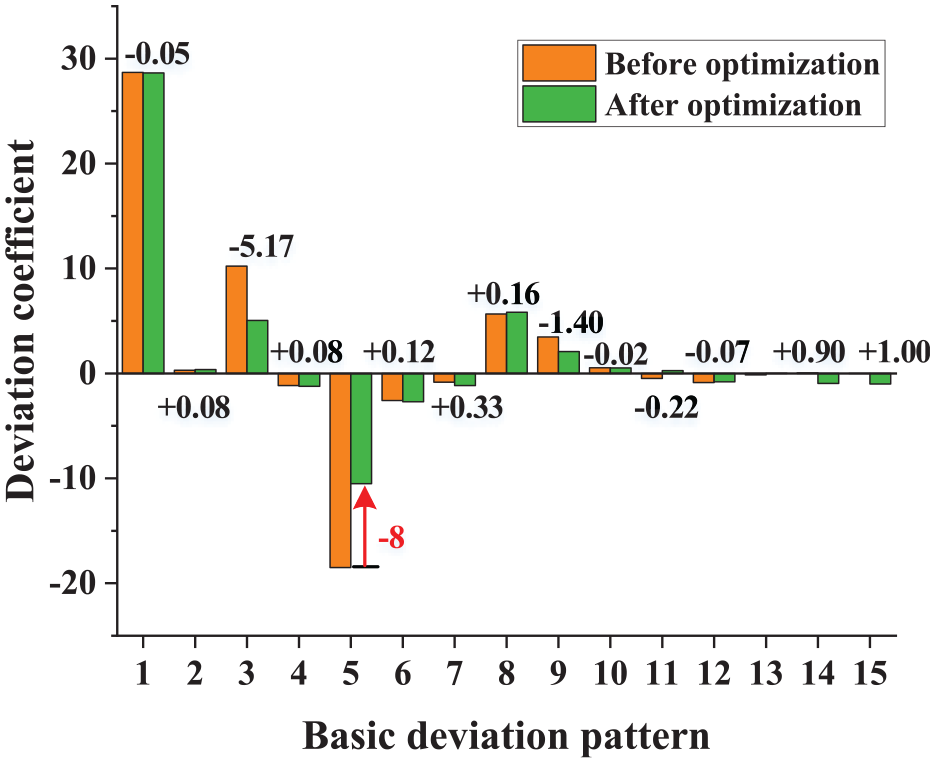
The comparison of the part deviation coefficients before/after optimization.
The performance of two-step optimization method is verified by the comparison of BDPs before/after optimization. The new deviation field of the assembly is calculated with the controlled Part A and Part B. The deviation of the assembly before and after control are shown in Figures 22 and 23, respectively. It can be seen that the deviation of assembly is reduced significantly after the optimization process. The maximal deviations of the assembly before and after optimization are 5.366 and 3.037 mm, respectively which appear at the 19th node. The mean deviation of all nodes on the assembly is calculated to evaluate the effect of deviation control. The mean deviations of the assembly before and after control are 2.298 and 1.275 mm, respectively. The relative decrement of deviation is 44.52%. The deviation coefficients of assembly are shown in Figure 24. The deviation coefficient of the third BDP of the assembly is well controlled from −18.778 to −9.266.
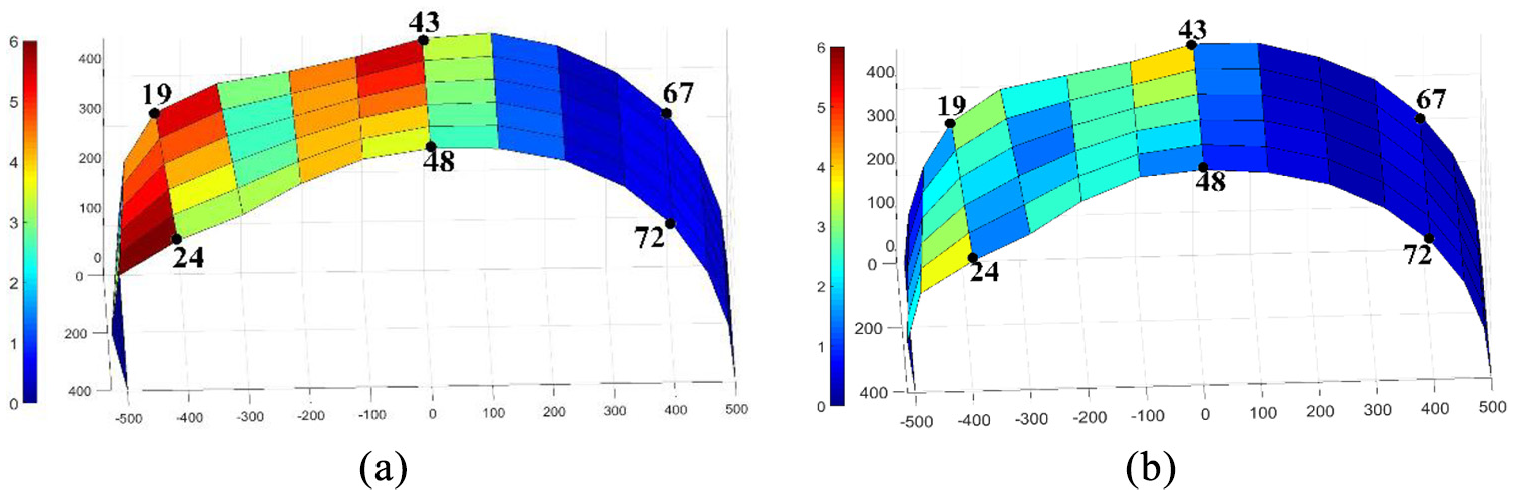
The deviation of the assembly: (a) before control and (b) after control.
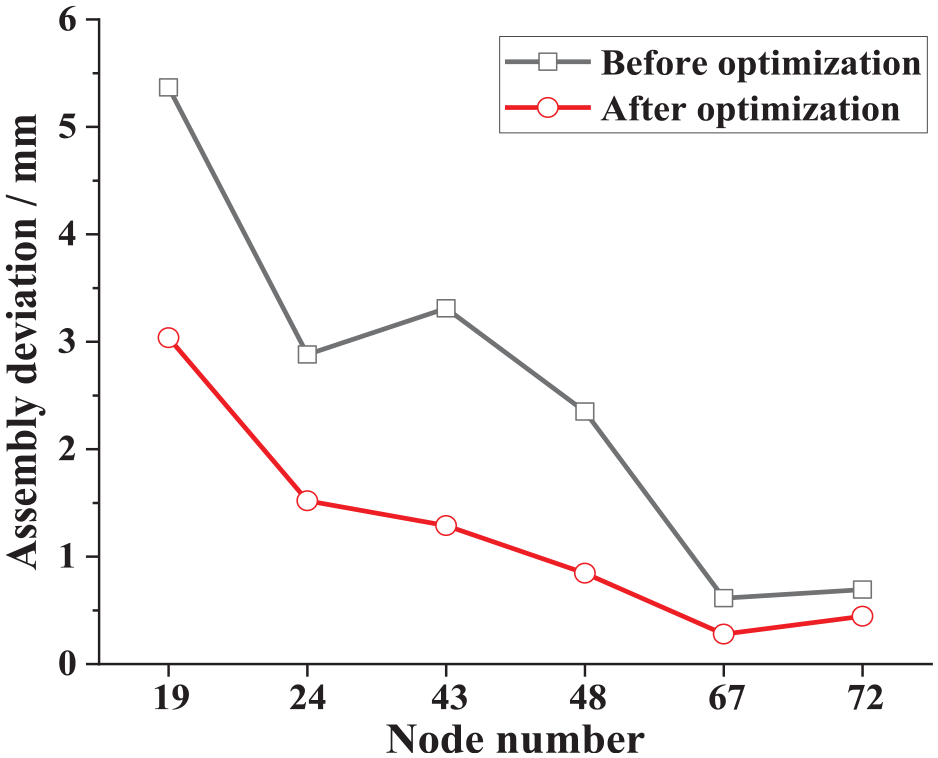
The comparison of the assembly deviation at several nodes.
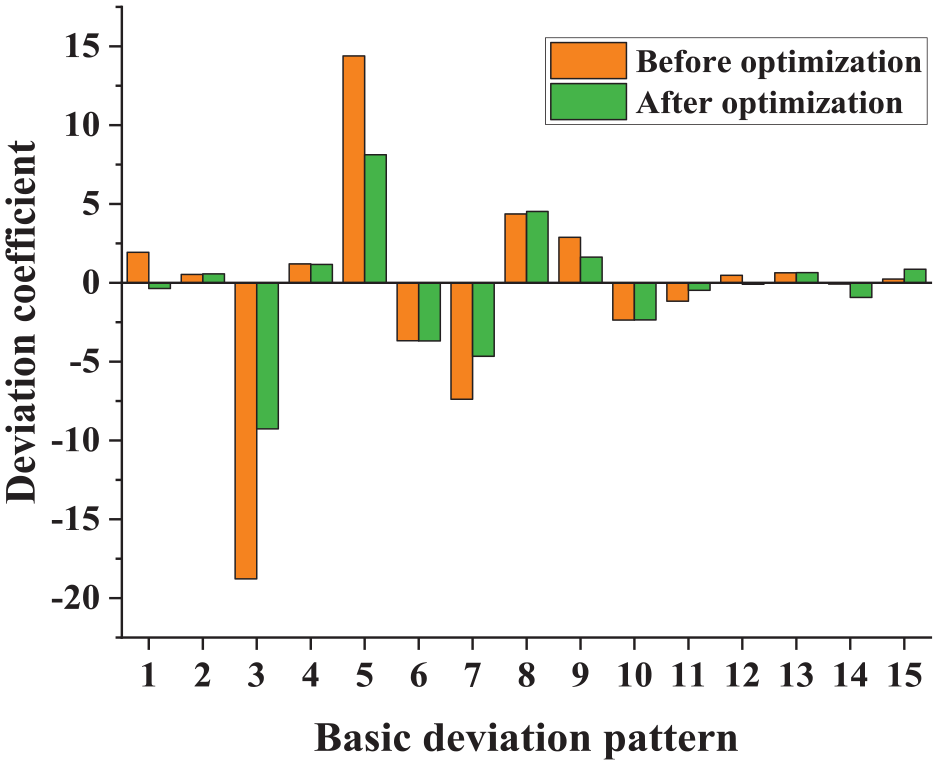
The deviation coefficients of the assembly before/after optimization.
Conclusions
In this paper, a new two-step optimization method based on the adjustment of the critical points of the part for the assembly deviation control of large thin-walled structures is proposed. The points with the least influence on the deviation characterization are removed and the optimal key measurement points are obtained by the effective independence method. A few points are selected to represent the deviation information of the structure, which greatly improves the calculation efficiency of the optimization control algorithm for deviation. The optimization model to obtain the locations and adjusted deformation of key control points corresponding the special basic deviation pattern of part is established. By adjusting the key control points, the contribution of the special basic deviation pattern of part to assembly is controlled and little effect occurred on the other basic deviation patterns. Meanwhile, the deviation prediction and control for the assembly process of two cylindrical thin-walled plates are carried out. The results show that the optimized key measurement points of the part may represent the deviation of parts accurately. The adjusted deformations of key control points for specific basic deviation pattern may effectively reduce the deviation of the assembly.
Footnotes
Appendix
Declaration of conflicting interests
The author(s) declared no potential conflicts of interest with respect to the research, authorship, and/or publication of this article.
Funding
The author(s) disclosed receipt of the following financial support for the research, authorship, and/or publication of this article: This work presented received the financial support from the National Key Research and Development Program of China (2019YFA0709001) and the National Natural Science Foundation of China (No. 51775345).