
Abstract
Boosting energy efficiency and machining quality are prominent solutions to achieve sustainable production for turning operations. In this work, a machining condition-based optimization has been performed to decrease the total specific energy (SEC), carbon emission (CE), and average roughness (AR) of the actively driven rotary turning (ADRT) process. The processing factors are the tool rotational speed (Tv), depth of cut (a), feed rate (fr), and workpiece speed (Wv). The turning experiments of the mold material labeled SKD11 have been conducted on a CNC lathe. The regression method is employed to develop comprehensive models of the total specific energy, carbon emissions, and average roughness. The entropy approach is then applied to drive out the weight value of each ADRT response. Finally, the non-dominated sorting particle swarm optimization (NSPSO) is utilized to determine the optimal parameters. The findings indicated that the optimal values of the Tv, a, fr, and Wv are 77 m/min, 0.32 mm, 0.25 mm/rev., and 128 m/min, respectively. The SEC, AR, and CE are decreased by 18.07%, 10.46%, and 5.02%, respectively, as compared to the initial approach. Moreover, the developed active rotary turning operation can be considered as an effective technical solution to boost the machining efficiency of hardened steels.
Keywords
Introduction
The rotary turning operation using a round insert is alternative manufacturing to enhance the production rate and machining quality for turning hardened steels. For the self-propelled rotary turning (SPRT) process, the rotation of the round piece is executed based on the friction with the workpiece. Inconstant, the motion of the rotary tool is conducted using an external power in the actively driven rotary turning (ADRT) operation, as shown in Figure 1. The rotary turning processes provide a rest period, which has a significant contribution to lower turning temperature, longer tool life, higher productivity, and better quality, as compared to the fixed turning. Therefore, the rotary turning process has great potential to replace conventional machining solutions, such as turning, grinding, and polishing operations. 1
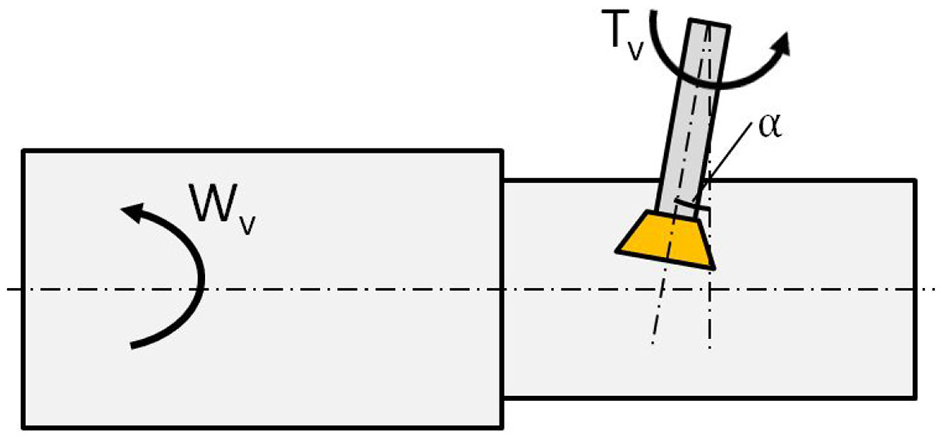
The kinematic scheme of the actively driven rotary turning process.
The optimal factors of different SPRT processes have been selected for improving machining responses. The influences of the workpiece speed (Wv), feed rate (fr), and depth of cut (a) on the turning temperature of the rotary and fixed operations were compared. 2 The outcomes revealed that the machining temperature of the rotary turning was evenly distributed than the fixed one. Similarly, the behaviors of the tool wear and the chip were investigated under the variety of the Wv, a, different workpieces, and various inserts. 3 The findings indicated that the wear was distributed on the flank surface, while a higher tool life was obtained. The analytical model of the tool wear for the SPRT operation of the AISI 4340 was proposed by Kishawy et al. 4 The authors stated that the developed correlation could be applied to predict the wear with acceptable precision. The characteristics of the tool wear, average roughness, and surface topography of the aerospace samples were analyzed under the variations of the machining parameters. 5 The authors indicated that the wear was only occurred on the flank surface, while the tool wear and roughness values were lower than the fixed turning. A neural network was employed to develop the approximate model of the turning force regarding the Wv, a, fr, and inclination angle (α), in which the accuracy was tested at random points using the experiments. 6 The author emphasized that the model precision was acceptable. The Oxley algorithm was used to construct the turning force model for the SPRT operation. 7 The findings revealed that the proposed model was adequate.
Ezugwu 8 emphasized that the turning force, tool life, and material removal rate could be enhanced with the support of the SPRT operation. The regression models of the average roughness and material removal rate were developed for the SPRT process of the hardened steel. 9 The outcomes indicated that the average roughness was decreased by 38.0%, as compared to the initial value. The regression models of machining force components for the self-propelled rotary face milling were developed regarding the milling speed, fr, a, and α, respectively. 10 The small errors between the experimental and predictive results indicated that the proposed models are significant. The fuzzy system (ANFIS) was applied to show the relations between the average roughness, energy consumption, and machining rate in terms of the Wv, fr, a, and α for the SPRT turning, 11 while the adaptive simulated annealing was employed to obtain optimum factors. The authors stated that energy consumption and roughness were decreased by 50.3% and 19.8%, respectively, while the material removal rate was increased by 33.2%. The energy efficiency, machining costs, and average roughness for the SPRT process were analyzed by Nguyen et al. 12 As a result, the energy efficiency was enhanced by 8.9%, while the roughness and cost were reduced by 20.0% and 14.8%, respectively at the optimal solution.
Additionally, various optimizations of different ADRT processes have been addressed in the published investigations. The regression models of the turning force and average roughness were proposed regarding the Wv, Tv, and fr for the ADRT and ultrasonic vibration assisted-rotary turning (UART) process of the aluminum alloy. 13 The outcomes revealed that the UART process could provide a lower cutting force and higher surface quality, as compared to the ADRT operation. The behaviors of the tool wear and turning force in traditional, rotary, and UART operations were assessed with the aid of a simulation model. 14 The findings revealed that the turning force was decreased around 50.0%, as compared to the traditional approach. Sasahara et al. 15 emphasized that the turning temperature and tool wear of the ADRT turning could be decreased with the aid of the oil mist. An attempt has been made to minimize the turning force and average roughness of the UART operation of the aluminum alloy. 16 The authors stated that the optimal values of the Wv, Tv, fr, and a were 40.0 m/min, 220.0 RPM, 0.08 mm/rev., and 0.3 mm, respectively. The impacts of the tool rotational speed and its direction on the turning force, machining temperature, and the formation of the chip were analyzed for the turning of the carbon steel. 17 The findings revealed that an increased tool rotational speed caused reductions in the turning temperature and machining force, while different cutting directions resulted in chatter marks. Similarly, the influences of the tool rotational speed and workpiece speed on the turning temperature for the ADRT operation of the stainless steel and Inconel. 18 The authors stated that a higher tool speed and/or workpiece speed caused a reduction in the turning temperature. The characteristics of the tool wear, turning force, and average roughness of the UART process were explored using a simulation model. 19 The obtained results indicated that the tool wear and turning force were decreased, while the roughness was reduced by 50%, as compared to the traditional rotary turning. The impacts of the tool rotational speed and workpiece speed on the turning force, chip flow angle, and chip thickness were examined. 20 The authors stated that increased tool rotational speed caused reductions in all turning responses. Unfortunately, the deficiencies of published works related to different ADRT processes can be listed as follows:
The influences of machining parameters on the total specific energy and carbon emissions for the rotary turning have not been analyzed. To decrease environmental impacts and obtain sustainable manufacturing, the energy consumed and carbon emissions should be minimized for the rotary turning operation.21,22
The empirical models of the average roughness, turning forces, and cutting temperature for various ADRT processes have been proposed in the previous publications. Unfortunately, the comprehensive models of the total specific energy and carbon emission have not been developed. It is necessary to develop predictive models of these technical responses under a variety of machining parameters, which can be used for prediction purposes.
The selection of optimal parameters to solve the trade-off between the total specific energy, carbon emissions, and average roughness for the ADRT process has not been presented. With increasing energy prices, environmental legislation, and global warming, reducing energy consumption as well as carbon emission and ensuring machined quality are the first priority to obtain sustainable development.23,24
In this work, a machining parameter based-optimization of the ADRT process of the SKD11 steel has been addressed to decrease the total specific energy (SEC), carbon emission (CE), and average roughness (AR). The comprehensive models of the SEC, CE, and AR are developed with the aid of the regression method. The ADRT parameters are the tool rotational speed (Tv), depth of cut (a), feed rate (fr), and workpiece speed (Wv). The weight of each turning response is determined using the Entropy approach. The non-dominated sorting particle swarm optimization (NSPSO) is applied to determine the optimal outcomes.
Optimization approach
Optimization targets
In the current investigation, the total specific energy, total carbon emission, and average roughness have been considered as the optimization objectives for the ADRT operation.
As shown in Figure 2, the total energy consumed (EC) in the ADRT process can be divided into the standby energy (ECs), transition energy for the spindle acceleration/deceleration state (ECt), air-turning energy (ECa), and energy consumed in the turning state (ECc), which is expressed as:

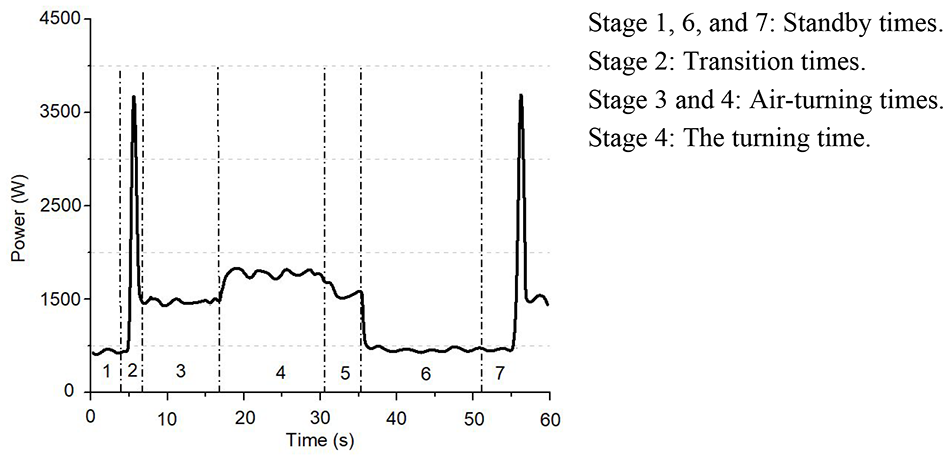
The power profile of the actively driven rotary turning process.
The energy consumed in the standby state (ECs) is calculated as:

where: Ps-the power consumed in the standby time; t1,6-the standby times.
The energy consumed in the transition state (ECt) is expressed as:

where: Vr-the resulting cutting speed; a, b, and c-the experimental coefficients regarding the machine tool used.
The value of the resulting cutting speed is computed as:

The energy consumed in the air-turning state (ECa) is calculated as:

where: Pa-the power consumed in the air-turning state; t3,5-the air-turning times.
The value of the power consumed in the air-turning state is calculated as:

where: Pop-the required operational power; k1 and k2-the regression coefficients.
The energy consumed in the turning time (ECc) is calculated as:

where: Pc-the power consumed in the turning time; tc-the turning time.
In this work, the response surface method is applied to construct the predictive model of the energy consumed in the turning time and the average roughness. The second-order form is widely applied due to the nonlinear characteristic.25,26
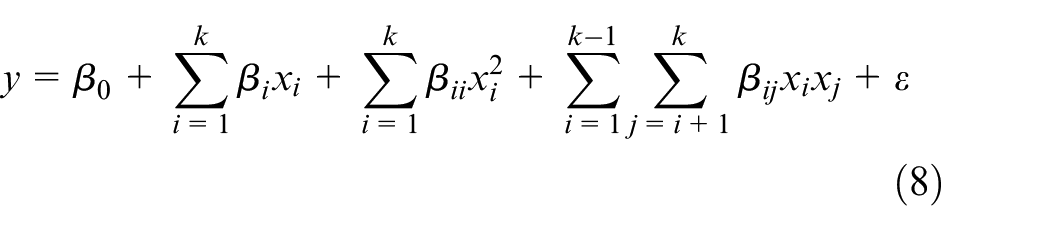
where: k and ε-the number of parameters considered and approximate error; βi, βii, and βij-the regression coefficients.
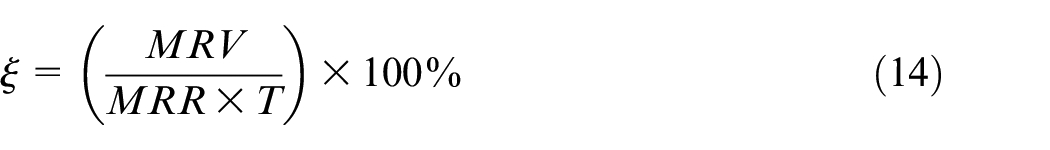
The total specific energy (SEC) is defined as the ratio of the total energy consumption to the material removal volume and computed as27,28:
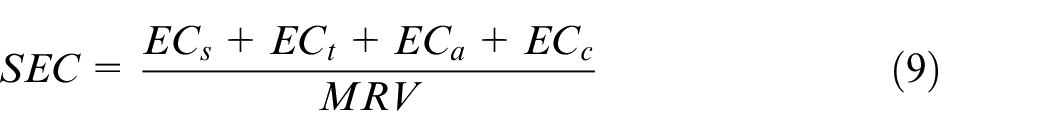
where MRV is the material removal volume.
The MRV value is calculated as:

where D and L the turning diameter and machining length, respectively.
The total carbon emission (CE) is calculated as:

where: CEe-the carbon emission of the electric energy; CEt-the carbon emission of the turning tool; CEc-the carbon emission of the chip generation.
The carbon emission of the electric energy (CEe) is calculated as:

where CEFe presents the emission factor for the electrical energy.
The carbon emission of the turning tool (CEt) is calculated as:

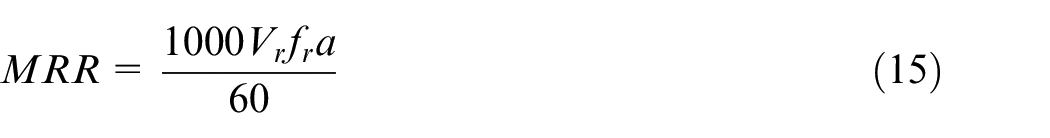
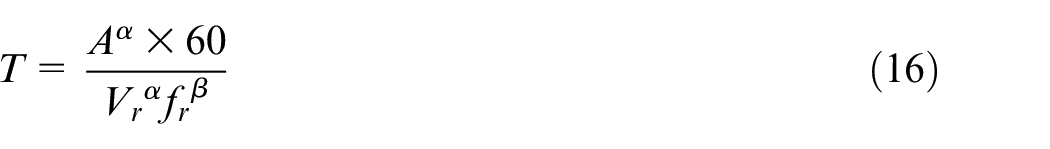
where: ξ- the tool life used; CEFt-the emission factor for the cutter; Wt- the mass of the cutter; MRR-the material removal rate; A-the coefficient related to the cutting conditions; α and β-positive constant parameters depending on the tool material and workpiece.
The carbon emission of the chip generation (CEc) is calculated as:

where: CEFc-the emission factor for the chip generated; ρ-the density of the workpiece.
The average roughness (AR) is measured from five points on the circular-cross section and the average value is computed as:
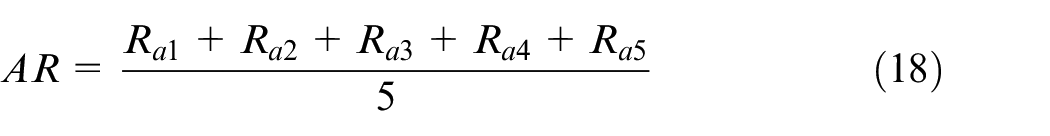
where Rai is the average roughness at the measured position.
Process parameters
A practical investigation indicated that ADRT factors are the characteristics of the turning insert (diameter, rake angle, edge radius, and materials), process parameters (inclination angle, tool rotational speed, workpiece speed, depth of cut, and feed rate), cooling conditions, and the workpiece materials.
In this investigation, the properties of the round insert and workpiece are considered as fixed conditions. The turning tests are conducted with the aid of the flood cooling and the inclination angle of 0° is used. Therefore, optimizing inputs includes the tool rotational speed, workpiece speed, depth of cut, and feed rate.
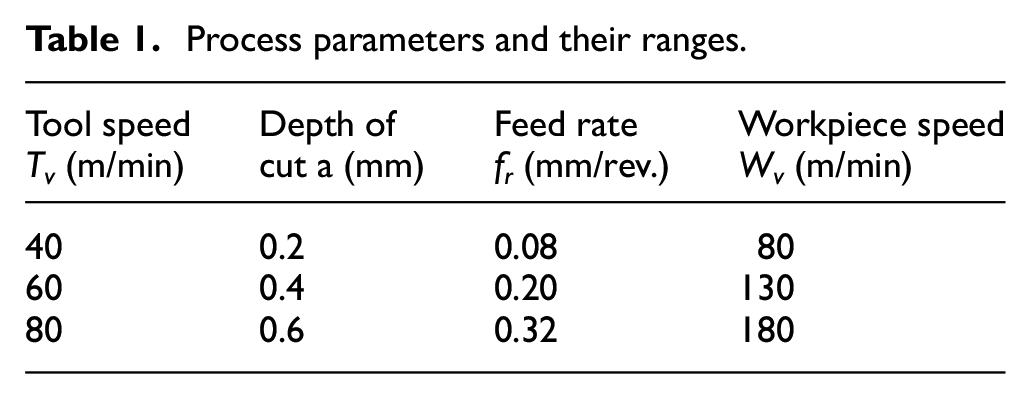
Four key parameters with their levels are shown in Table 1. The low, middle, and high levels of each parameter are determined based on the specifications of the machine tool used and recommendations from the manufacturer of the rotary insert. The turning trials are conducted at maximum ranges to guarantee allowable cutting power. Moreover, the highest values of turning factors are tested and verified with the literature review to ensure turning stability.
Process parameters and their ranges.
Optimization framework
The sequential steps of the optimization approach can be listed below, as shown in Figure 3(a):
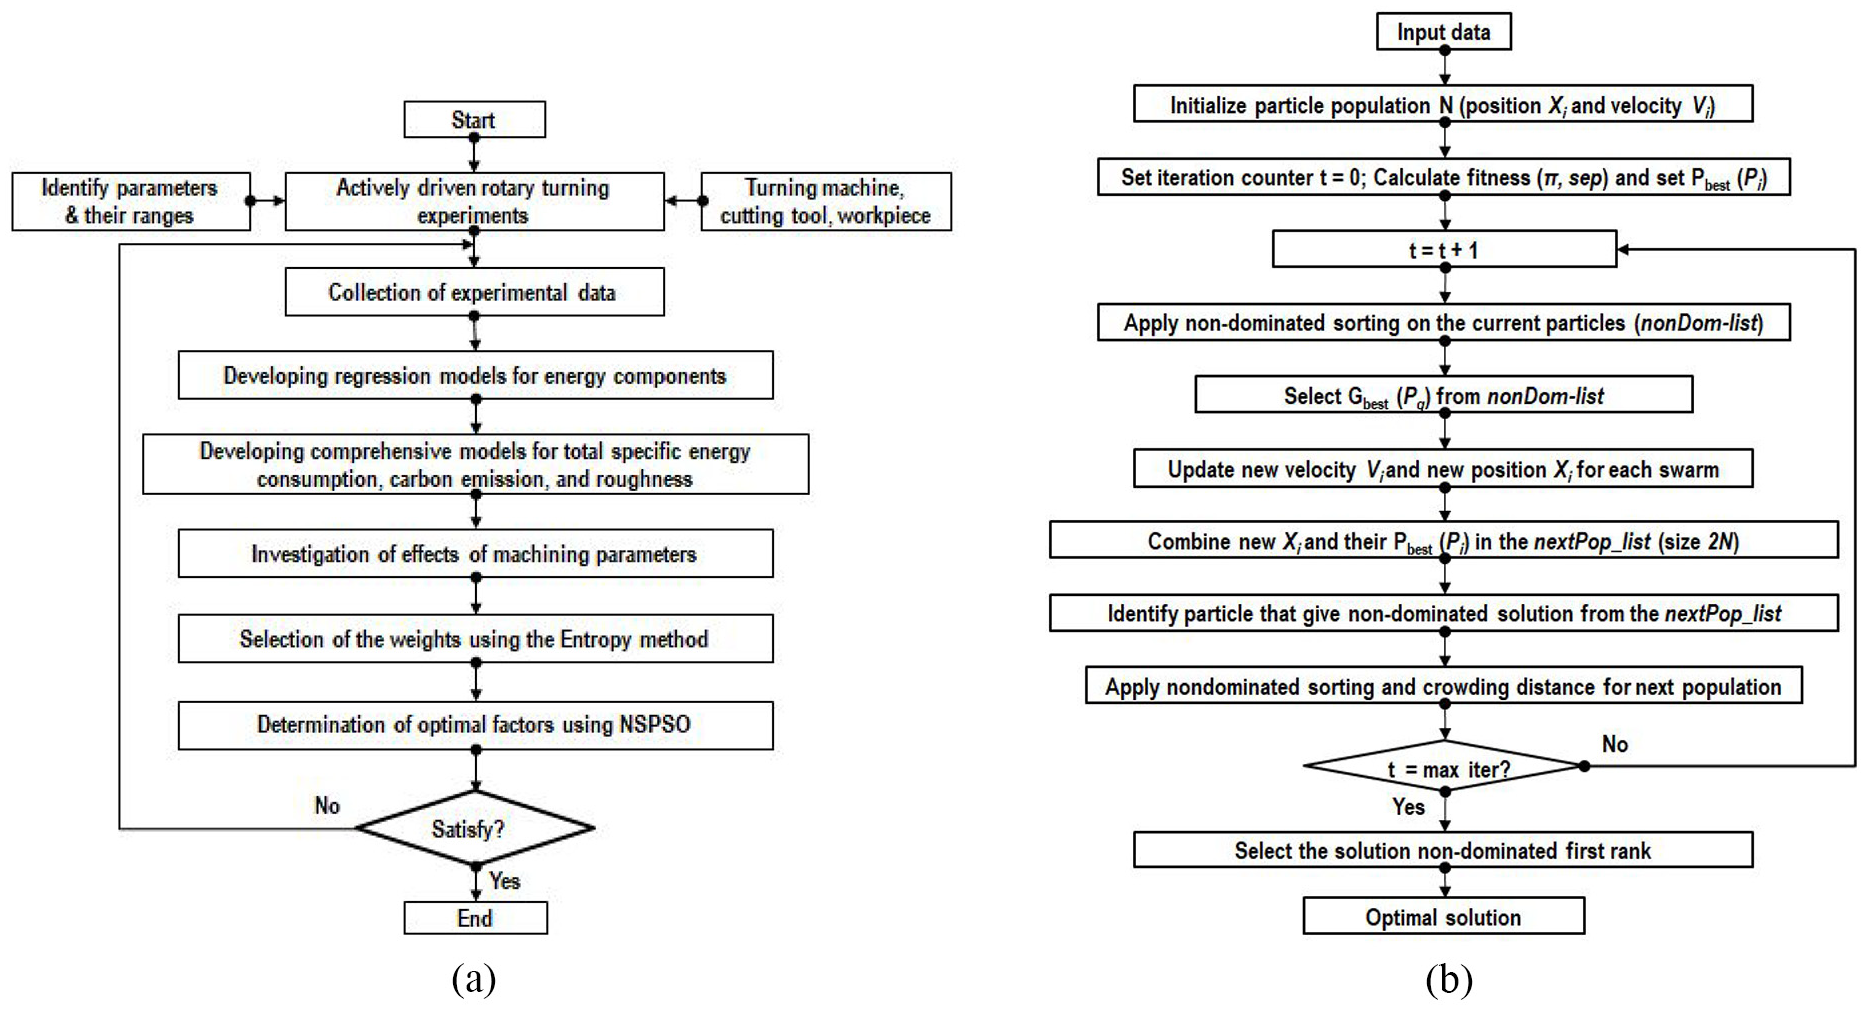
Optimization approach for the ADRT process: (a) optimizing procedure and (b) operating principle of the NSPSO.
The Box-Behnken method (BBM) is employed to produce the experimental matrix with the parameter combination.32,33 The BMM is an effective design of the experimental method, which combines a two-level factorial design. Three required levels of each parameter are “−1,”“0,” and “1,” which correspond with the low, middle, and high levels. The design points are placed on the middle points of the edge and the center of the block. As compared to the full factorial, the BBM is highly efficient due to a lower number of experiments. Therefore, the turning trails are conducted using the BBM matrix to save the experimental costs and human efforts.
Step 2: The regression models of the total specific energy, total carbon emissions, and average roughness are proposed regarding parameters considered.
- Development of regression models of the energy consumed in the transition state and power in the air cutting state.
- Development of regression models of the energy consumed in the turning state and average roughness.
- Development of the regression model of the total carbon emission.
Step 3: The weight of each turning response is calculated using the entropy method.34,35
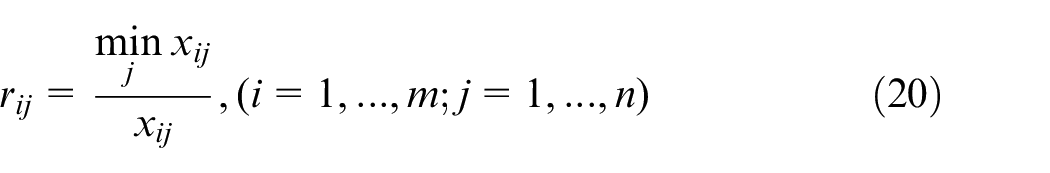
For higher the better approach, the measured response (rij) is computed as:
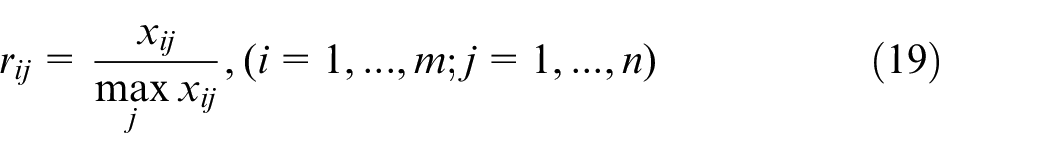
For lower the better approach, the measured response (rij) is computed as:
The values of the normalized responses (pij) are computed as:
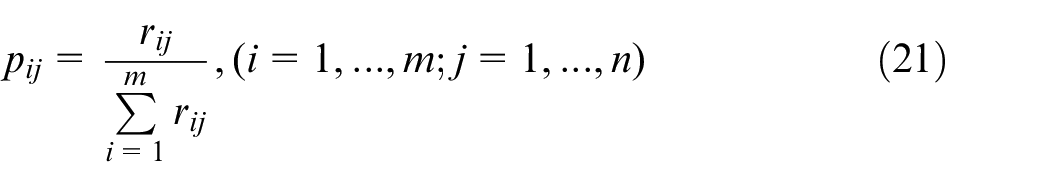
The entropy value (Ej) of the ith index is calculated as:
The entropy weight (wi) of each response is calculated as:
Step 4: Determination of optimal factors using non-dominated sorting particle swarm optimization (NSPSO).
NSPSO is an improved algorithm of particle swarm optimization (PSO) to solve multi-objective optimization. NOPSO enhances the working efficiency by using better personal best and offspring to effectively select non-dominated comparisons. Moreover, NOPSO compares all personal bests and their offspring in the entire population, which provides a proper determination to propel the swarm population toward the Pareto-optimal front. Three niching methods, including the crowding distance, niche count, and max-min operations are employed to improve the diversity of the Pareto front. The operating steps of the NSPSO are shown in Figure 3(b).
Experiments and measurements for the ADRT process
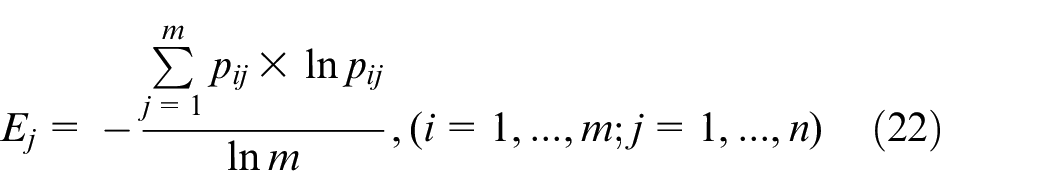
The diameter and length of each workpiece namely SKD11 are 40.0 and 250.0 mm. The heat treatment process is used to achieve the hardness of around 50 HRC for each specimen, as shown in Figure 4(a).
Experiments of the actively driven rotary turning: (a) measuring hardness of the specimen, (b) Rotary insert, (c) technical drawing of the tool shank, (d) fabricated rotary turning tool, and (e) rotary turning.
To achieve the desired hardness, two heating treatments, including quenching and tempering processes are employed to process the sample. In the quenching operation, the heating temperature of each steel bar reaches 850°C in a high-frequency induction furnace. The sample is kept at the heated temperature for 60 min. The specimen is soaked whole in the oil tank to arrive at the ambient temperature. The oxidation phenomena and carbon releasing are prevented with the aid of the charcoal. In the tempering operation, the steel bar is heated to 570°C and kept at a temped temperature of 70 min. The sample is then cooled in the normal air to arrive at the ambient temperature.
The Rockwell hardness is measured using a tester namely VERZUS 710RS produced by the INNOVATEST, Netherlands. A diamond identifier having a tip angle of 120° and a nose radius of 0.2 mm is employed to measure the hardness. The pressed load of 100 kgf and dwell time of 10 s are used for all hardness tests.
The carbide inserts having 15° rake angle and hardness of 91 HRC produced by MISUBISHI are used in all turning trials (Figure 4(b)). The technical drawing of the designed tool shank is depicted in Figure 4(c). The tool shank is fabricated using the mold steel labeled SKD61, while the hardness of the tool shank is around 80 HRC, as shown in Figure 4(d).
A CNC turning machine namely EMCO MAXXTURN 45 is employed to perform experiments. The device used has four axes to perform the turning and milling functions. The maximum power and speed of the main spindle are 12 kW and 8000 RPM, respectively. The maximum power and speed of the tool spindle are 6 kW and 4000 RPM, respectively. The sample is rigidly clamped by the chuck and the live center. The machining length of 26 mm is applied to each segment (Figure 4(e)).
The power consumed of the ADRT process is measured using a power sensor. The obtained power is kept on an internal card and presented using the software. The roughness values are measured with the aid of a tester labeled Mitutoyo SJ-301 using the ISO 4287 standard. The diamond tip of 5 µm radius is used to measure in the axial direction, while the length of 2.5 mm is measured for each segment.
Typical machined specimens of the ADRT operation are exhibited in Figure 4(f). The power roughness values at different conditions are shown in Figure 5.
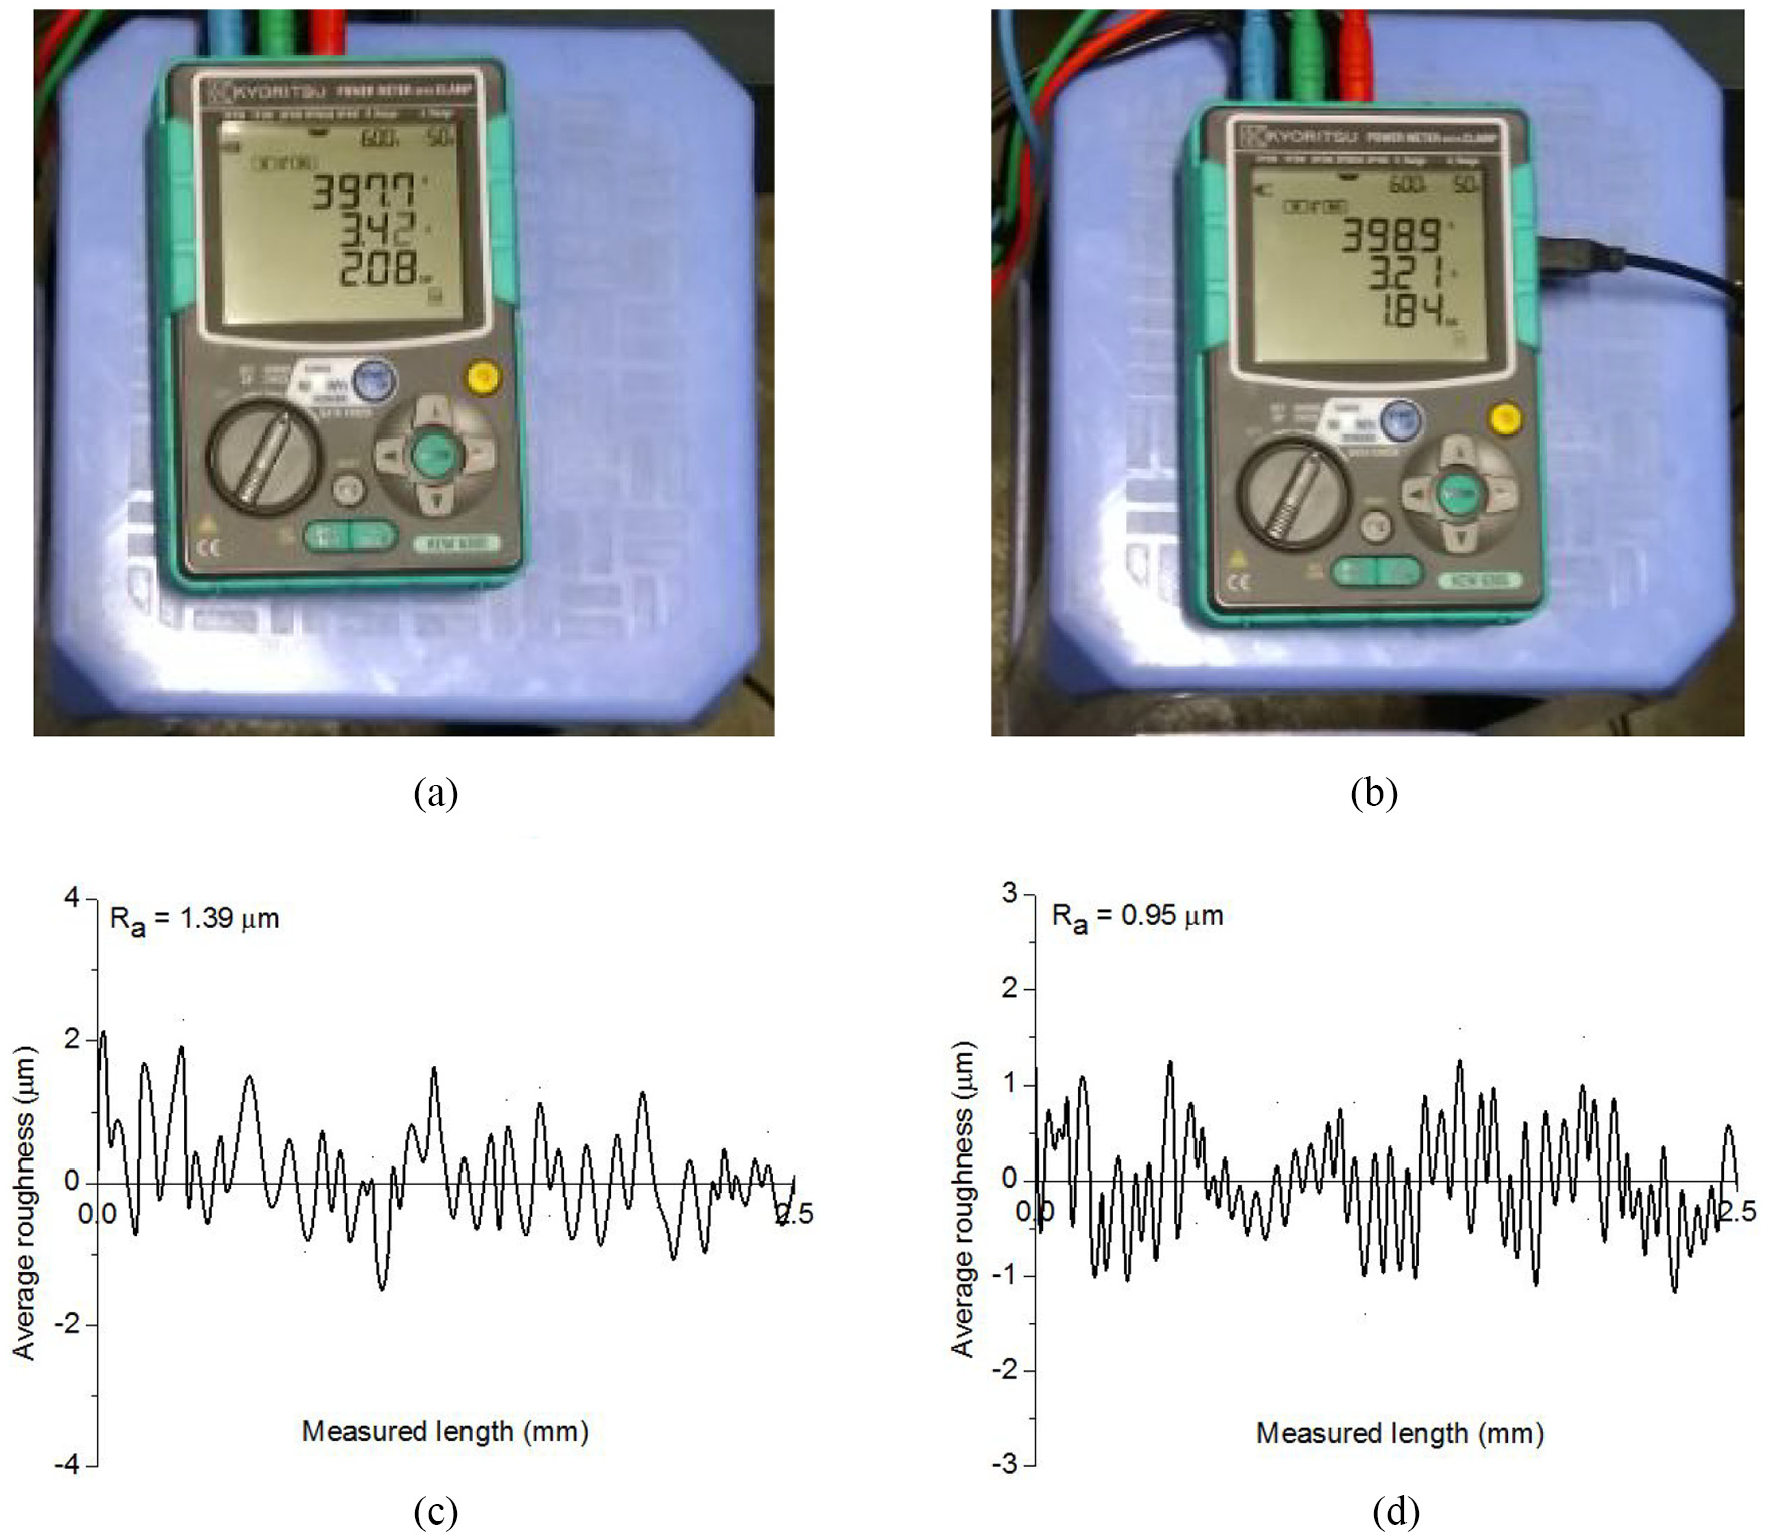
Measured responses at various experiments: (a) power consumed at turning conditions: Tv = 40 m/min, a = 0.40 mm, fr = 0.20 mm/rev., Wv = 130 m/min (replication 2), (b) power consumed at turning conditions: Tv = 80 m/min, a = 0.40 mm, fr = 0.32 mm/rev., Wv = 180 m/min (replication 3), (c) average roughness at turning conditions: Tv = 60 m/min, a = 0.60 mm, fr = 0.32 mm/rev., Wv = 130 m/min (replication 2), and (d) average roughness at turning conditions: Tv = 60 m/min, a = 0.60 mm, fr = 0. 20 mm/rev., Wv = 180 m/min (replication 3).
Results and discussions
Development of mathematical models for the energy consumed in the transition state and power in the air-cutting state
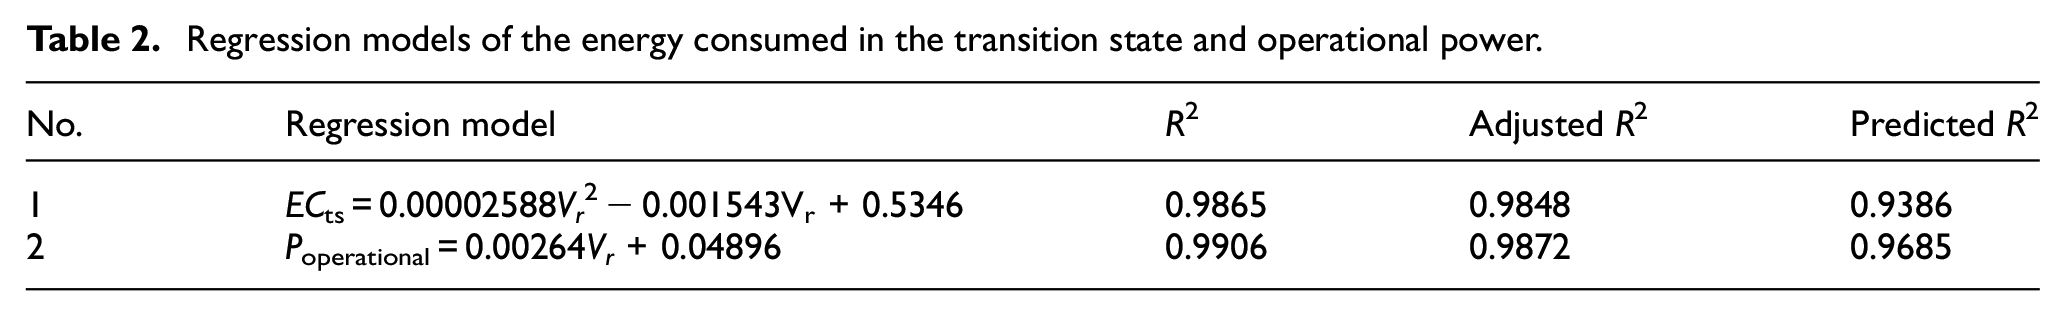
The mathematical models for the energy consumed in the transition state and power in the air cutting state were developed using the regression method, as shown in Table 2. The values of the coefficient determinations, including the R2, adjusted R2, and predicted R2 indicated that regression models are significant.
Regression models of the energy consumed in the transition state and operational power.
Development of RSM models for the energy consumed in the turning state and average roughness
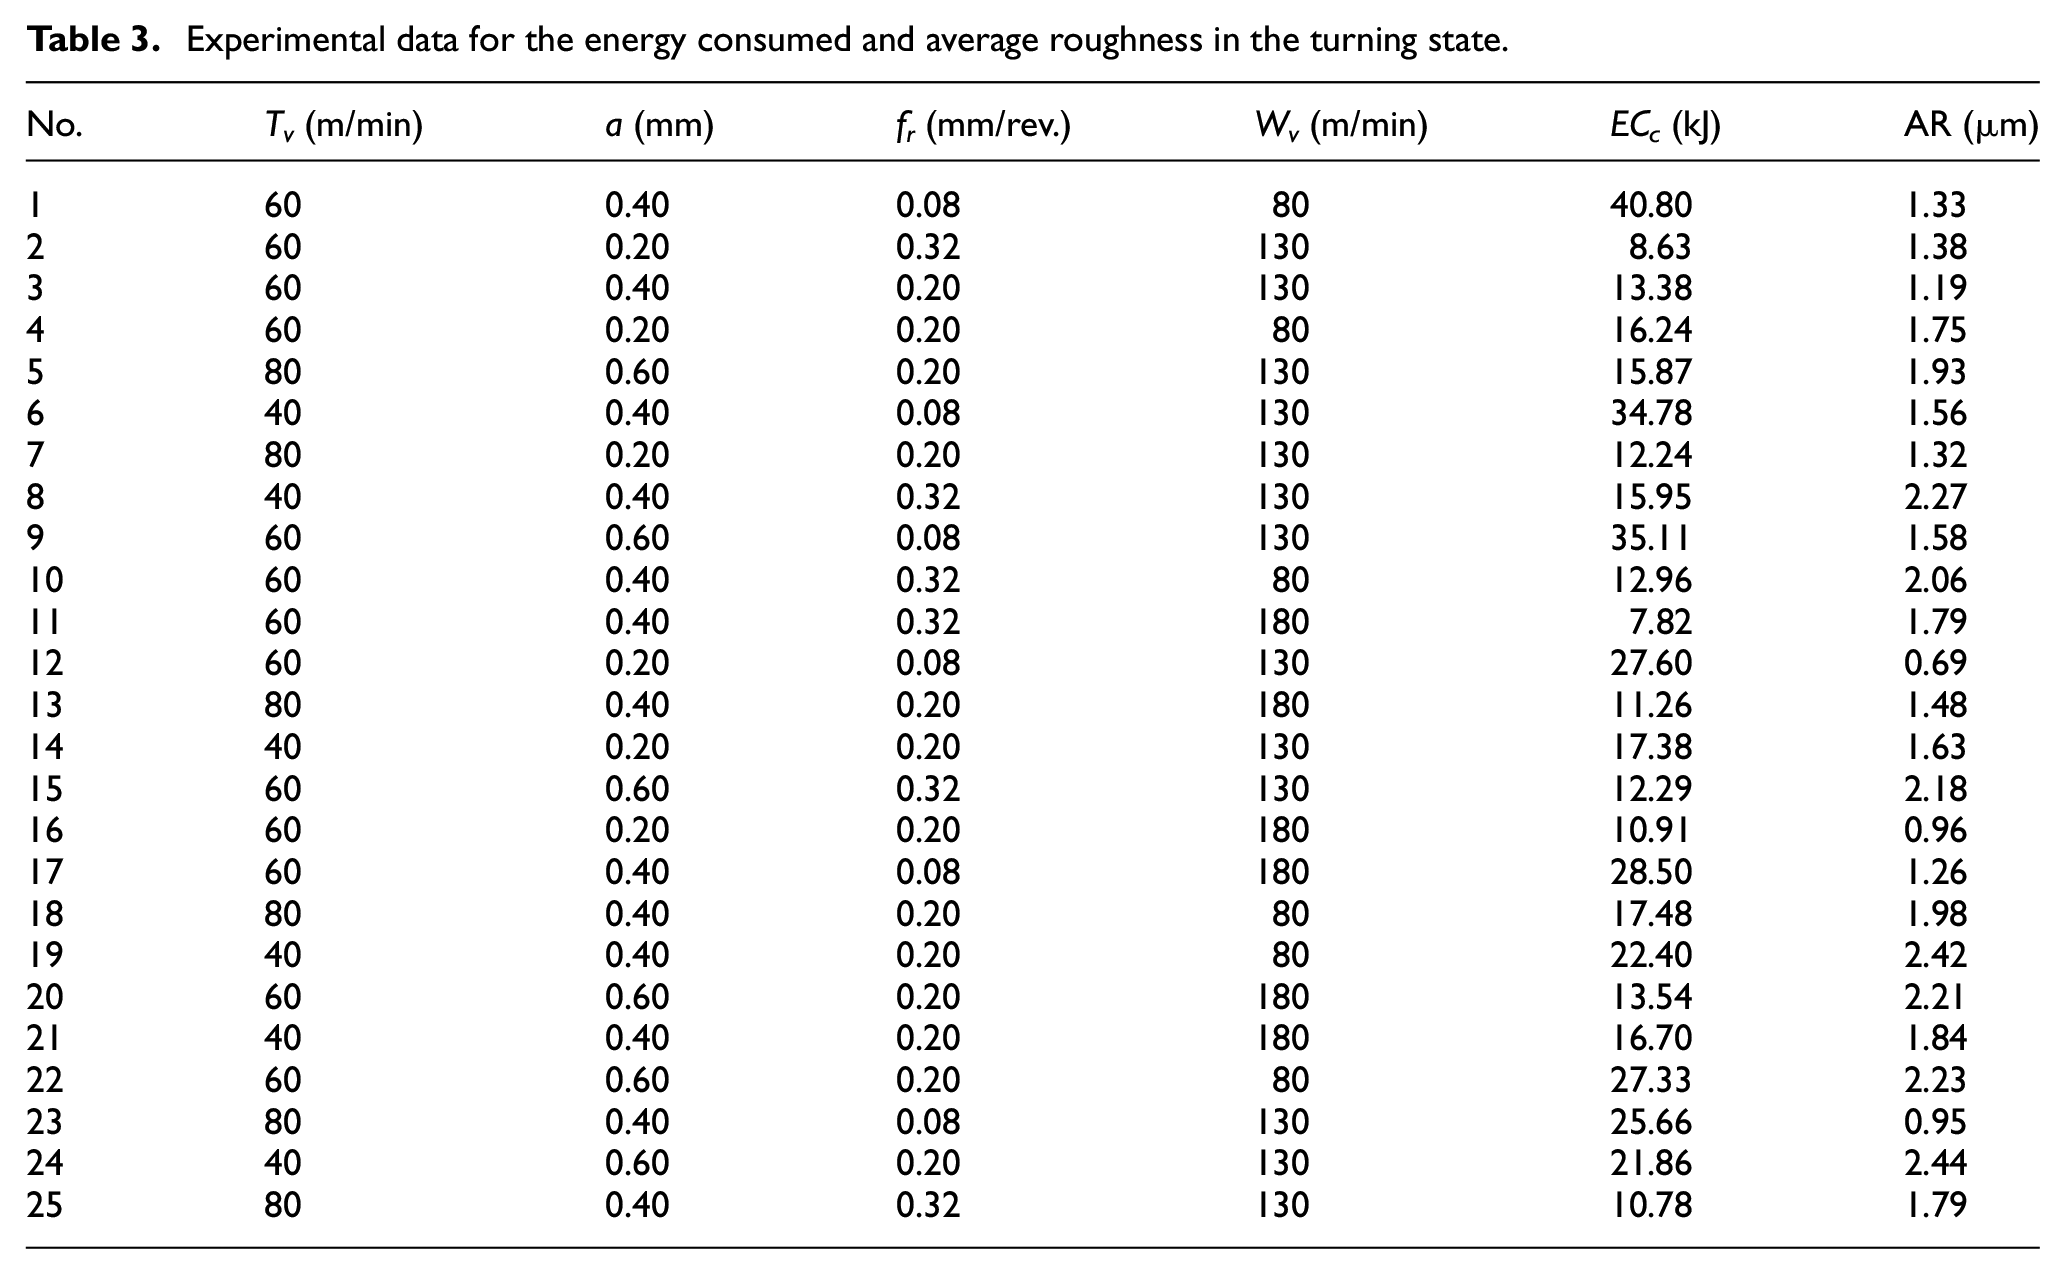
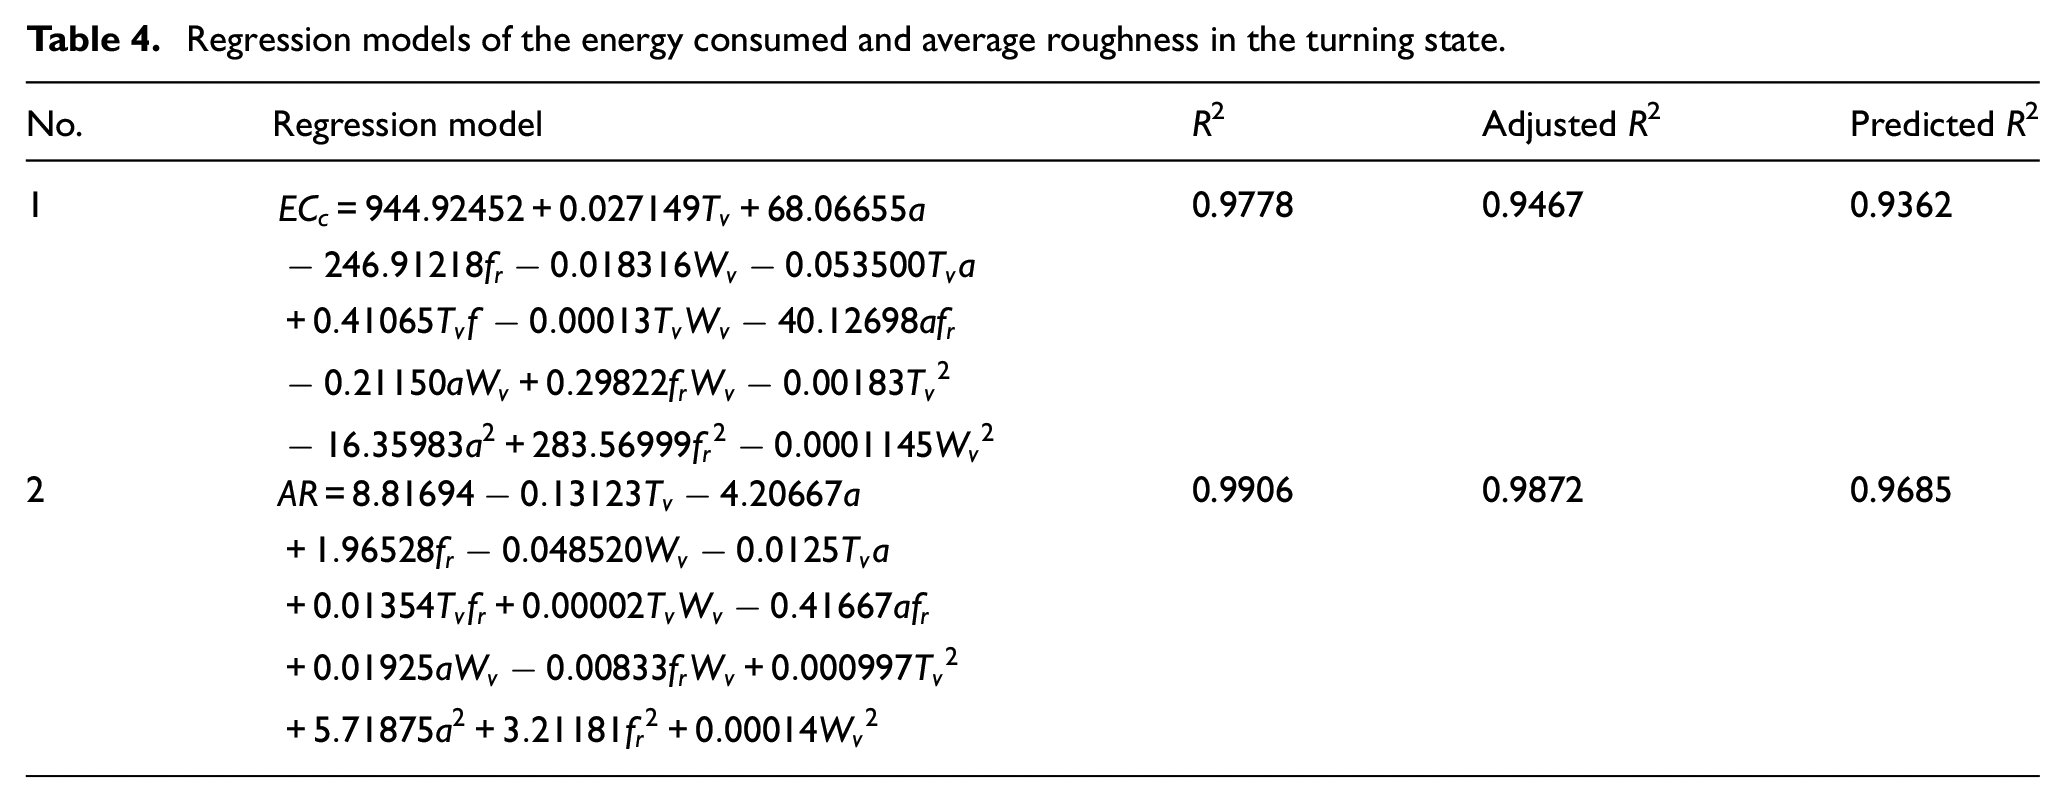
The experimental results of the ADRT operation for developing models of the energy consumed in the turning state and average roughness are shown in Table 3. The regression models of the ECc and AR are presented in Table 4.
Experimental data for the energy consumed and average roughness in the turning state.
Regression models of the energy consumed and average roughness in the turning state.
To confirm the adequacy of the RSM models, the comparative plots between the predictive and experimental values are employed, as shown in Figure 6. It can be stated that observed data are distributed on the straight line, while the disturbance data does not observe. Therefore, the proposed models are adequate.
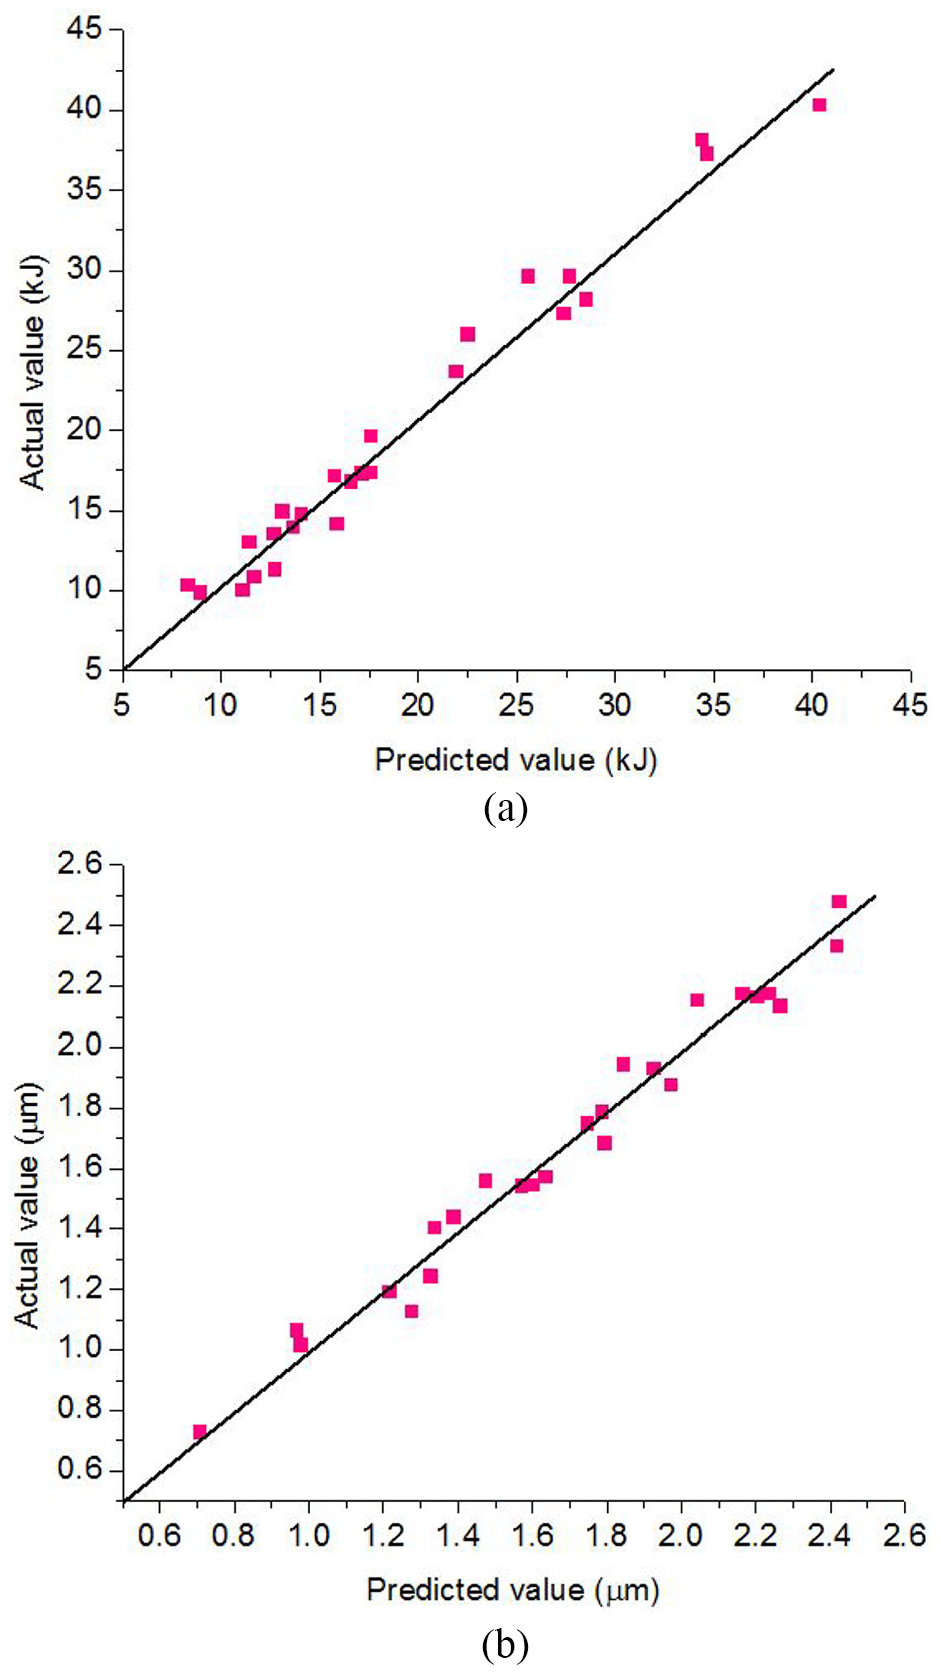
Investigation of the adequacy of the RSM models: (a) for the regression model of the energy consumed in the turning state and (b) for the regression model of the average roughness.
For the regression model of the energy consumed in the turning state, the R2 value of 0.9778 indicated that 97.78% of the experimental data are presented by the ECc model. The adjusted R2 of 0.9467 showed that 94.67% of the experimental data are described by significant factors. Additionally, the predicted R2 of 0.9362 revealed that the ECc model can be expected to explain 93.62% of the variability in any new data.
For the regression model of the surface roughness, the R2 value of 0.9784 indicated that 97.84% of the experimental data are presented by the AR model. The adjusted R2 value of 0.9482 described that 94.82% of the experimental data are described by the model considering significant factors. Additionally, the predicted R2 of 0.9342 revealed that the AR model can be expected to explain 93.42% of the variability in any new data.
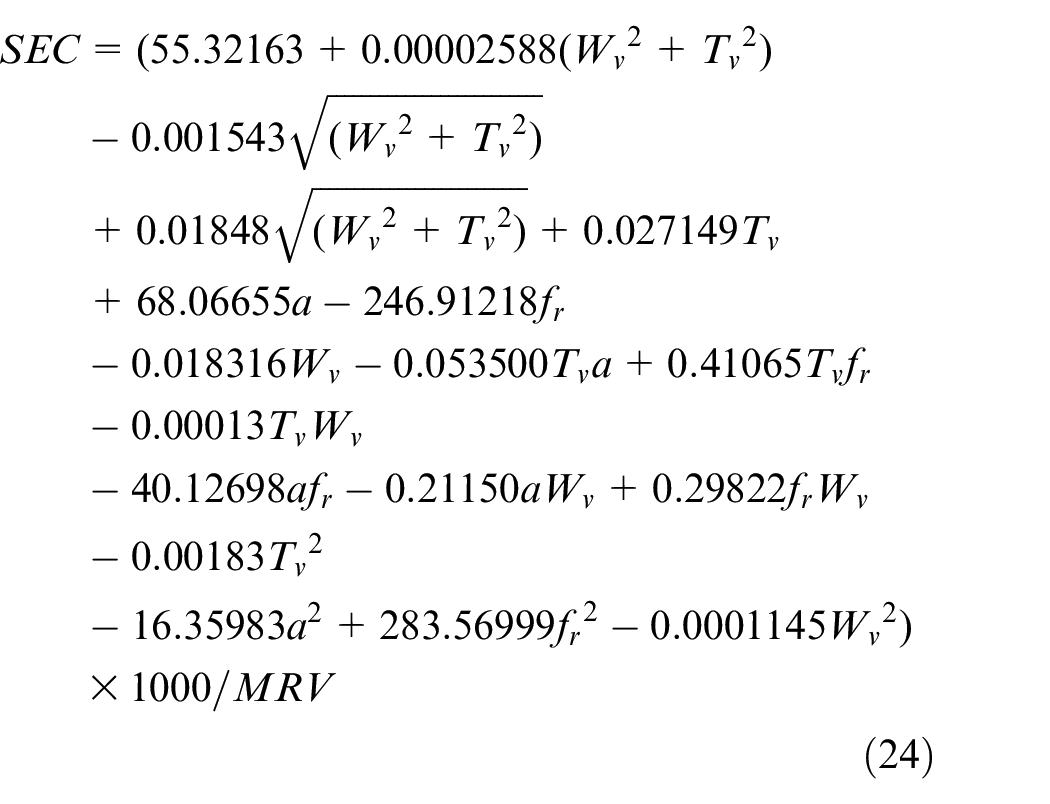
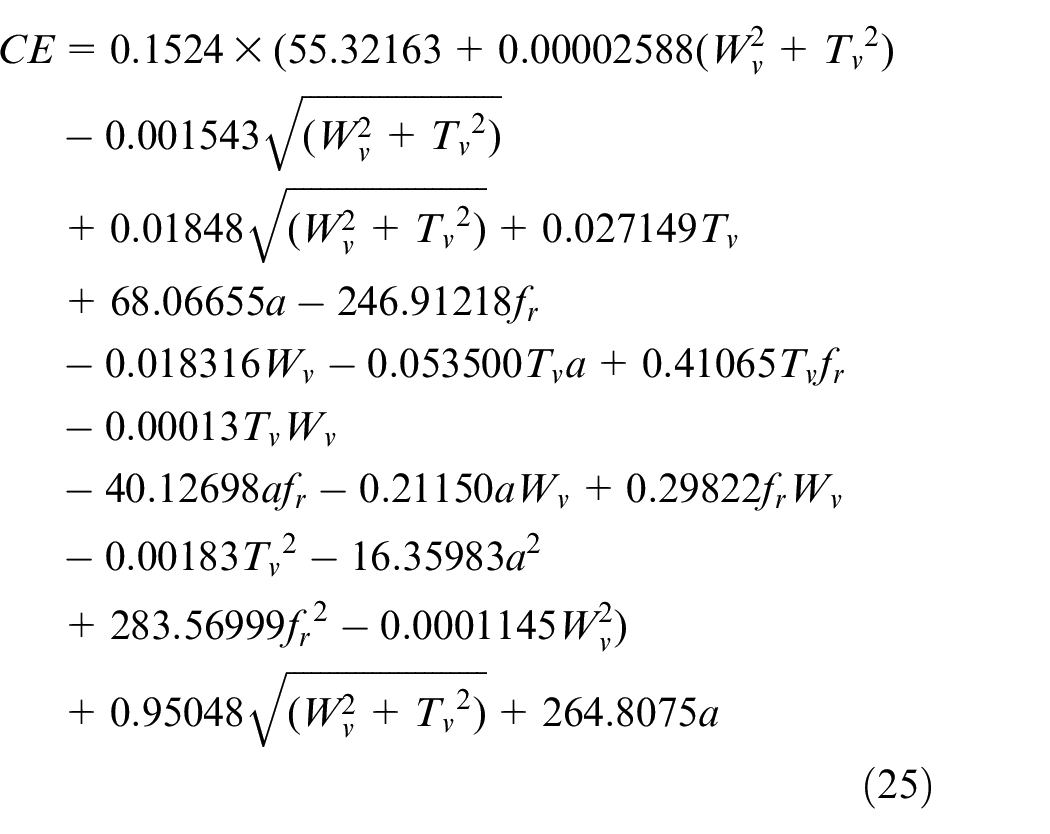
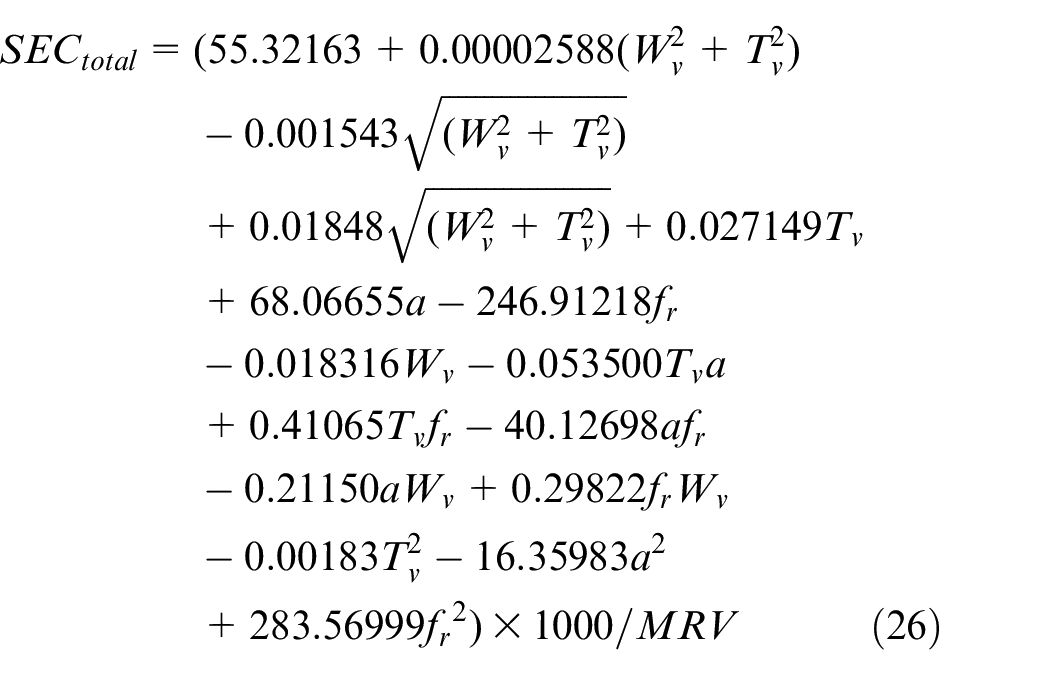
Development of regression models for the total specific energy, total carbon emission, and surface roughness
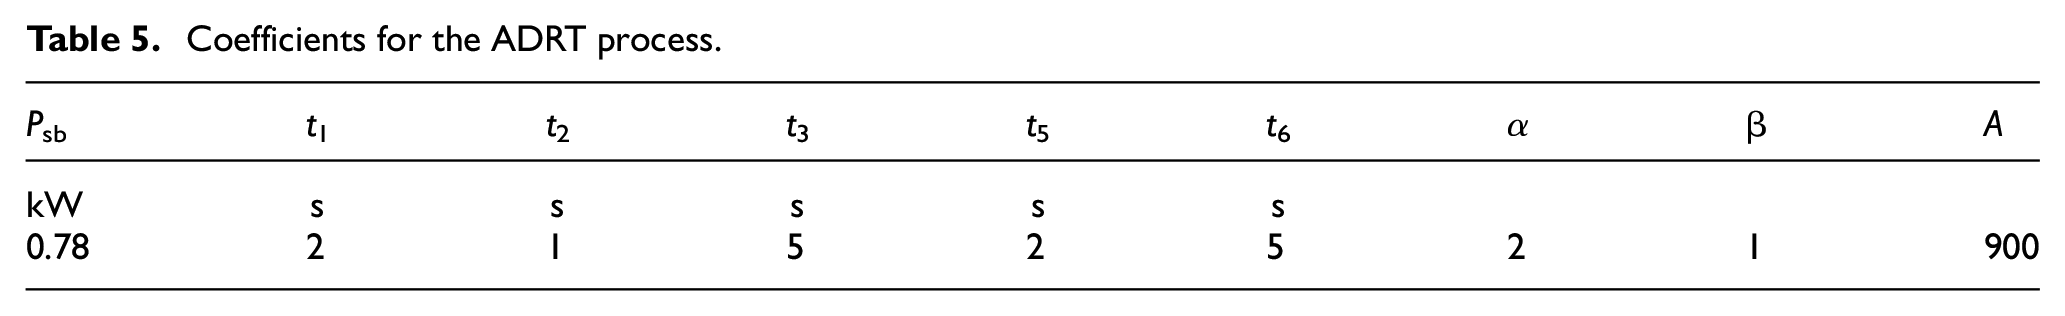
The coefficients for the ADRT process are shown in Table 5. The regression models for the total specific energy and total carbon emission are expressed as:
Coefficients for the ADRT process.
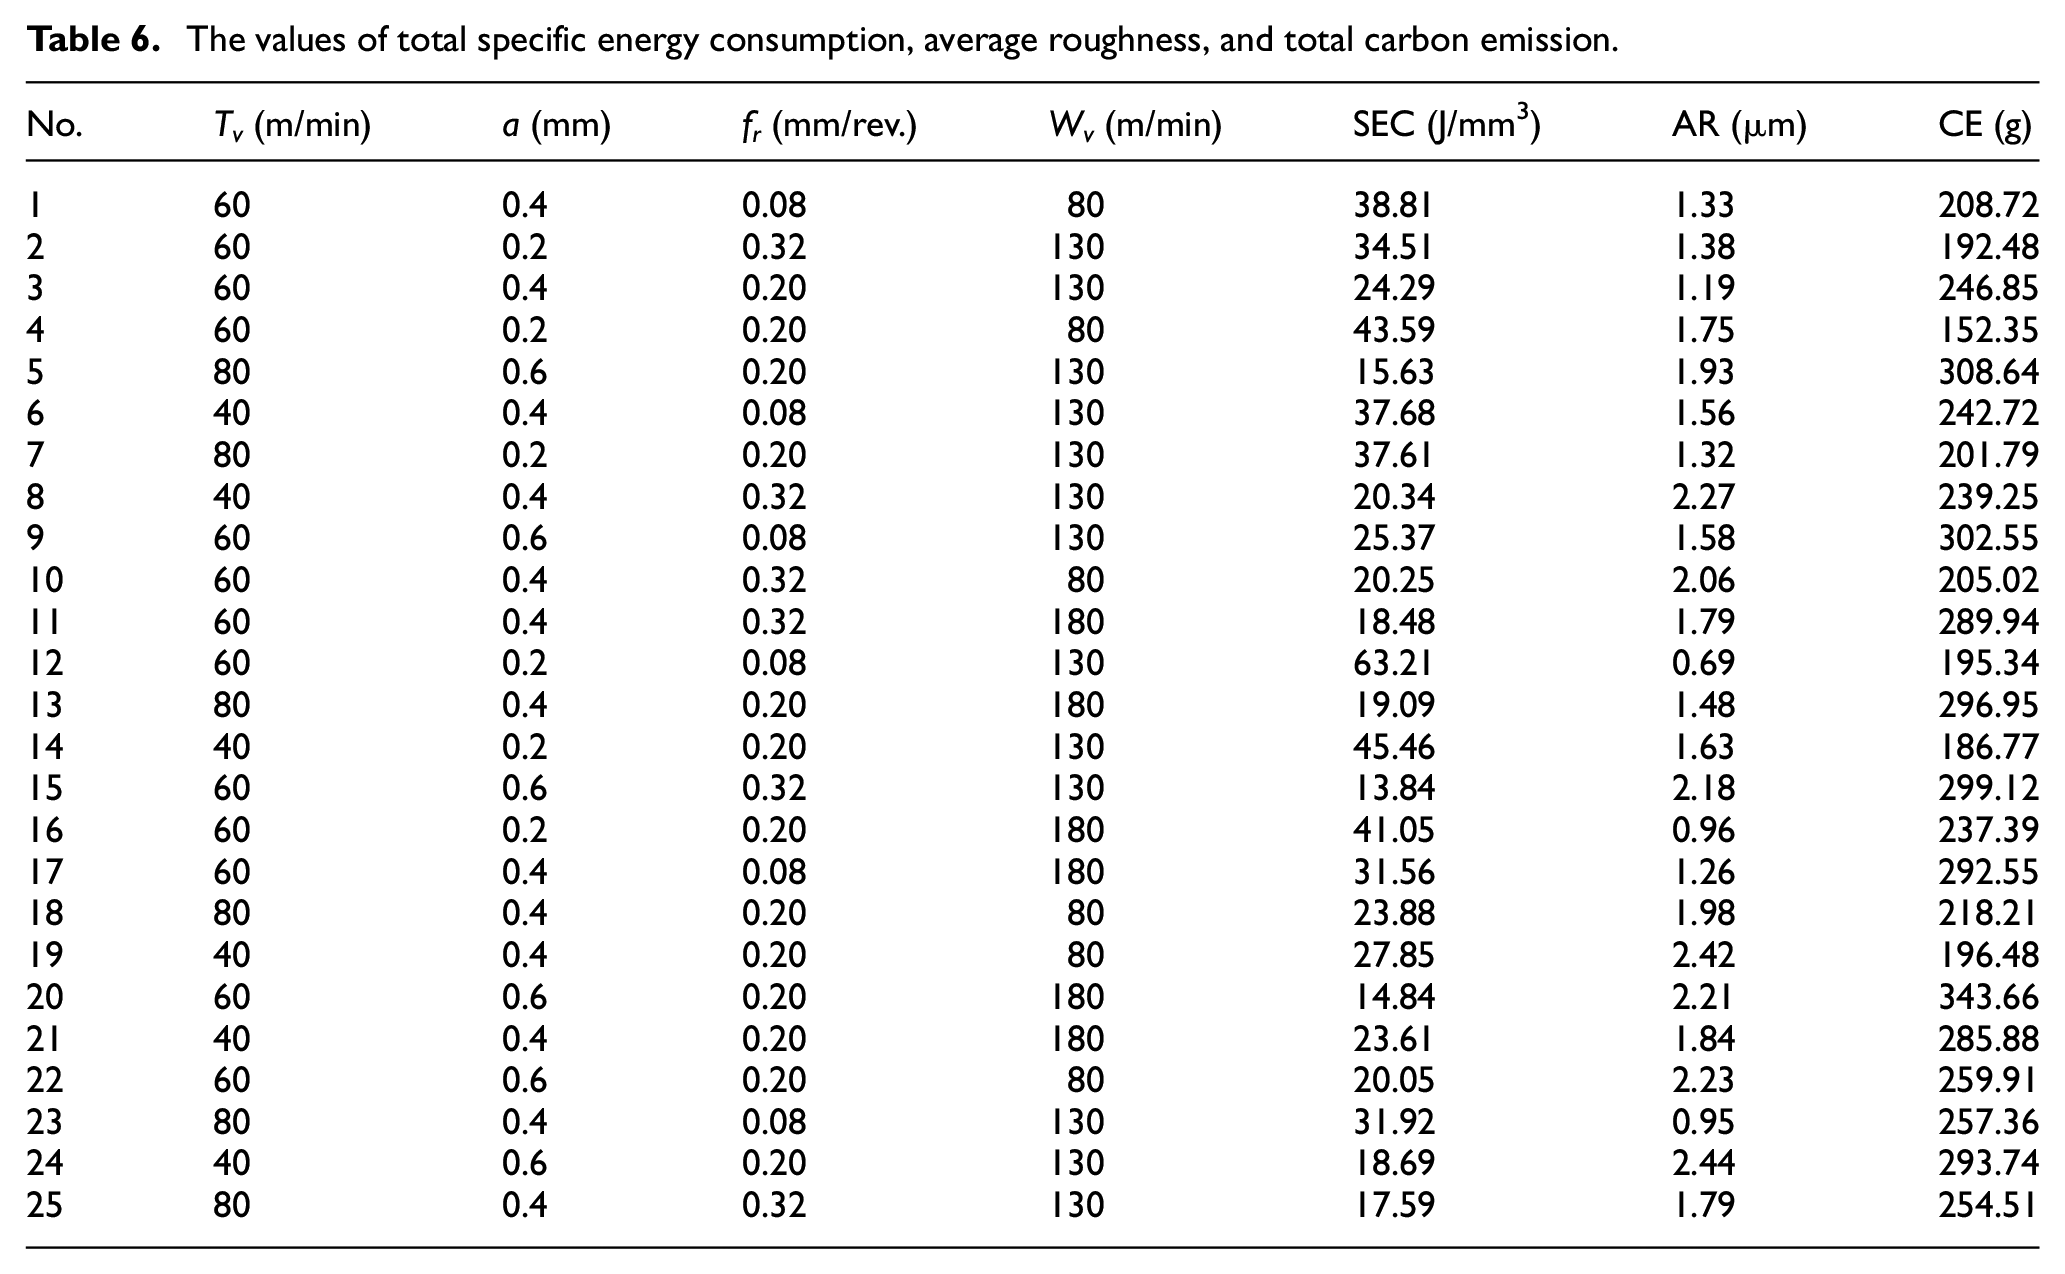
The values of the total specific energy, average roughness, and carbon emissions are shown in Table 6.
The values of total specific energy consumption, average roughness, and total carbon emission.
Parametric effects
Reducing energy consumption is an urgent demand to decrease environmental impacts and save machining costs. The influences of the ADRT parameters on the total specific energy are depicted in Figure 7.
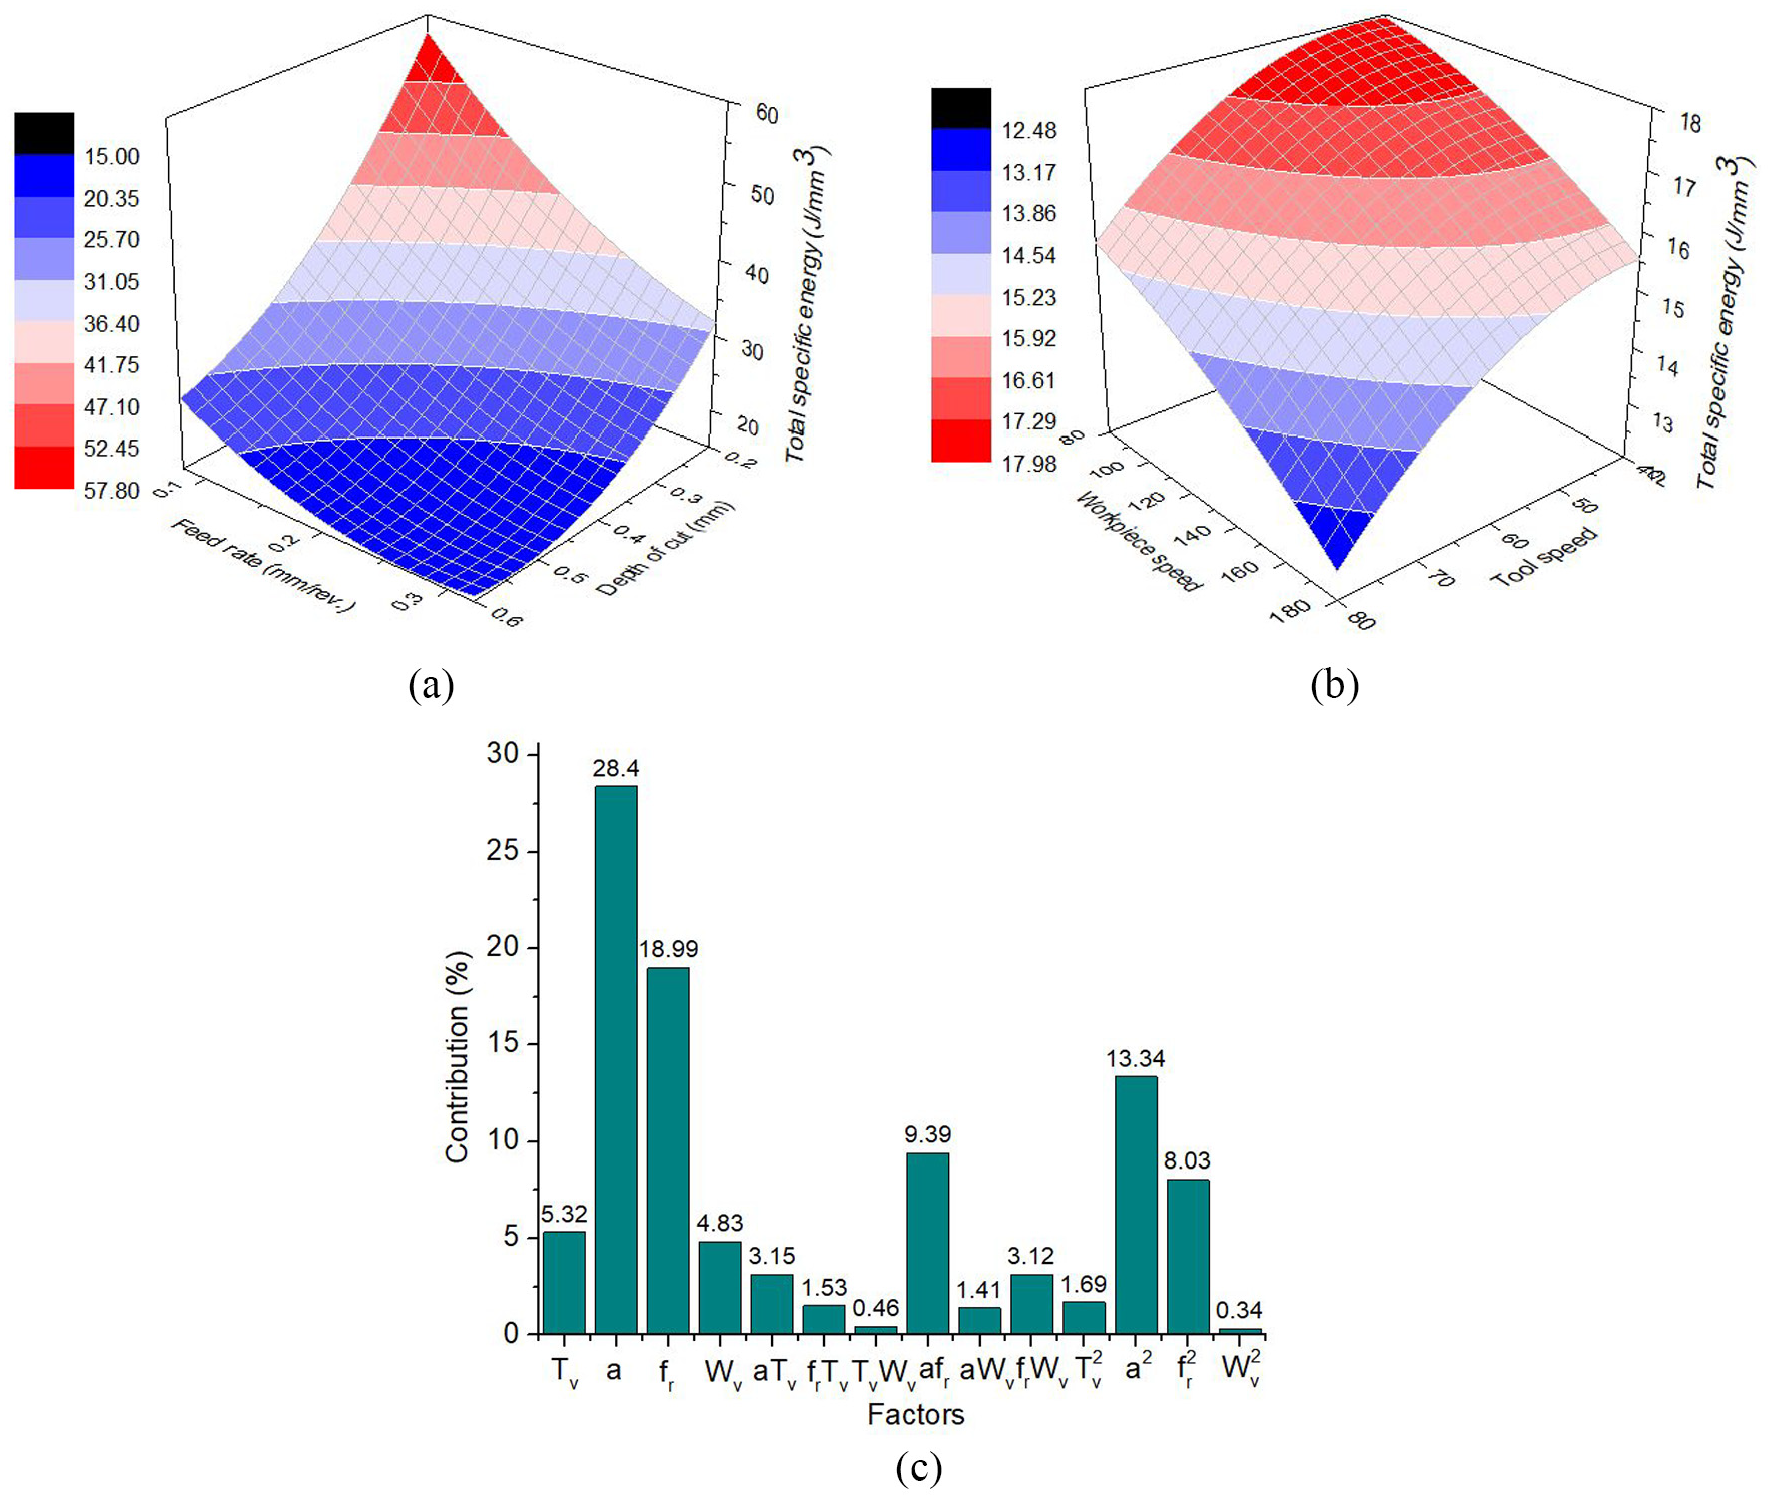
The effects of the parameters on the total specific energy: (a) the total specific energy versus the depth and feed, (b) the total specific energy versus the tool and workpiece speed, and (c) parametric contributions for the total specific energy.
Figure 7(a) presents the influences of the depth of cut and feed rate on the total specific energy. It can be stated that the feed rate and turning depth have similar impacts on the total specific energy, in which lower specific energy can be observed with an increased feed rate and/or depth of cut. When the depth of cut increases, a higher turning area is produced, this results in an increment in the turned volume; hence, the power consumed in the ADRT process is increased. Fortunately, an increment in the depth of cut causes a higher material removal volume, which leads to a reduction in the total specific energy. At a higher feed rate, the feed drive system consumes more electrical power to meet the desired setting. Fortunately, the machining time is decreased with an increased feed; hence, the specific energy is logically decreased.
Figure 7(b) exhibits the effects of the tool rotational speed and workpiece speed on the total specific energy. It can be stated that increased tool and workpiece speeds caused a reduction in the specific energy. At a higher workpiece speed, the main spindle consumed more electrical power to meet the desired value. Similarly, the power consumption of an external motor increases with an increment in the tool speed. Fortunately, higher tool rotational speed and workpiece speed lead to a decrement in the machining time, which causes lower specific energy.
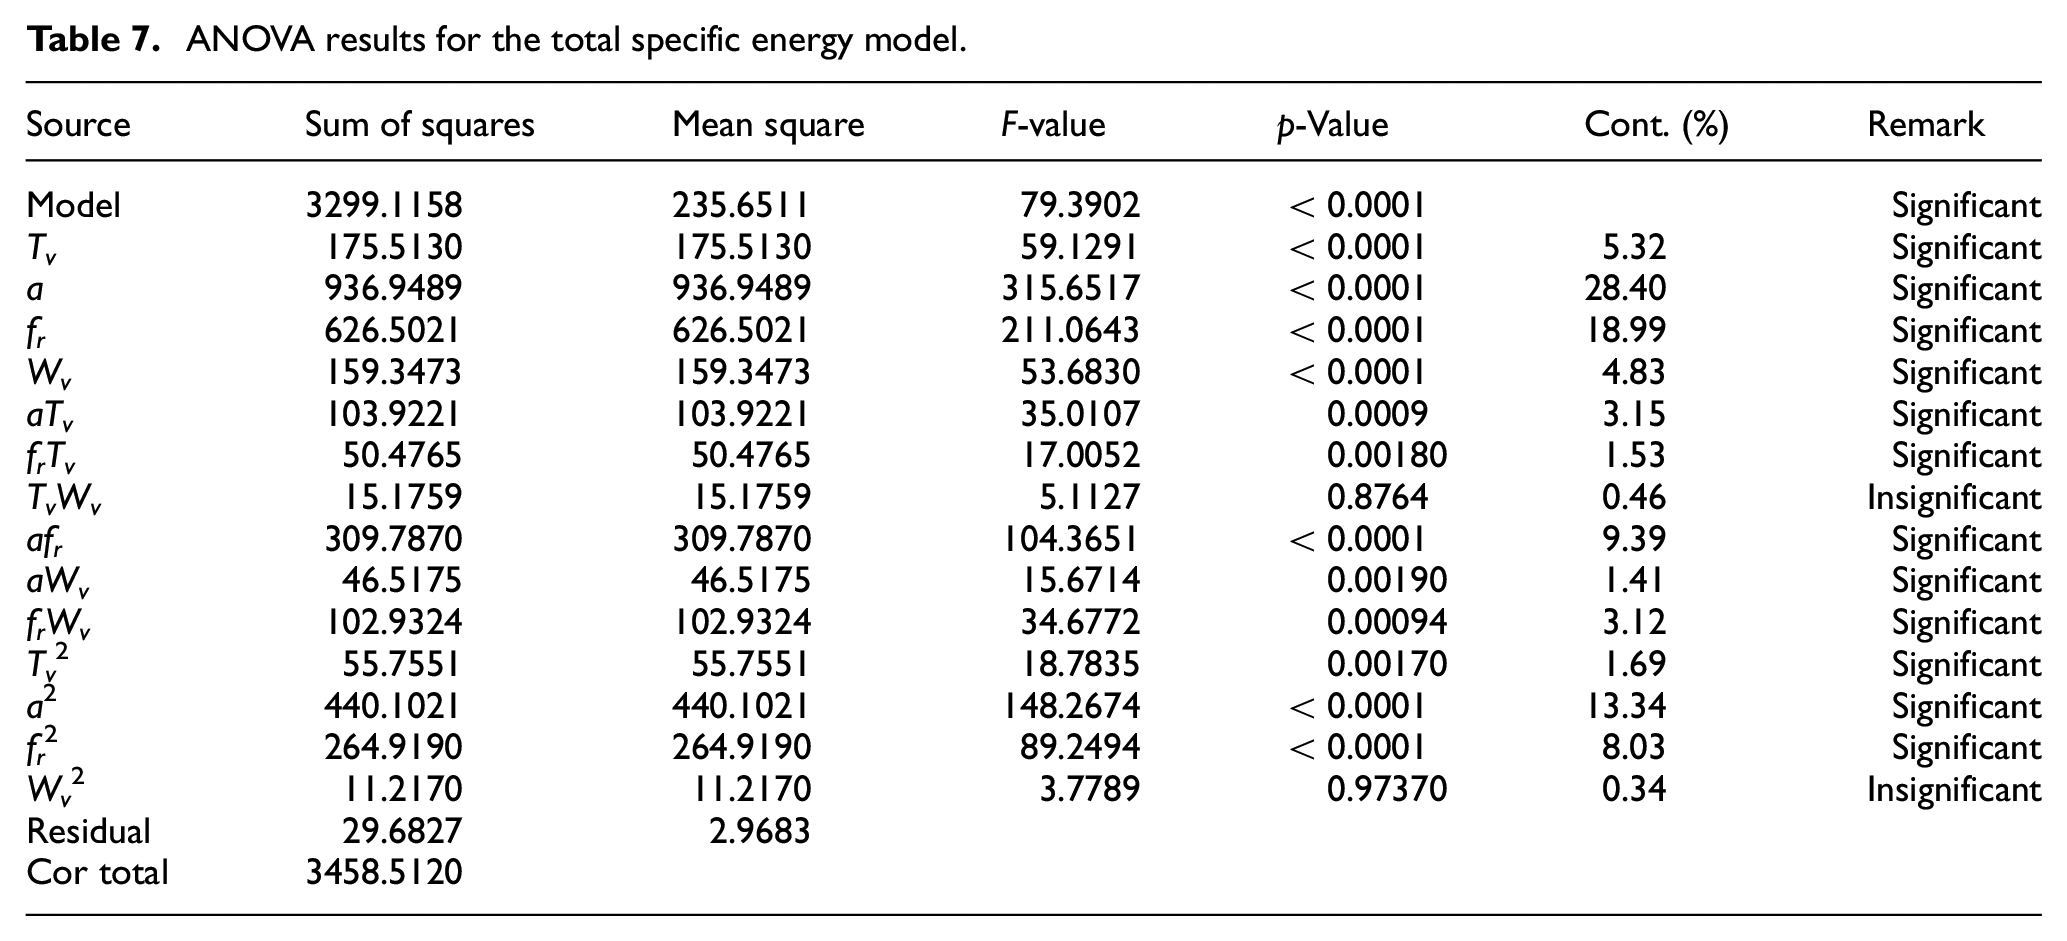
Table 7 presents ANOVA results for the total specific energy model with 95% confidence level. The meaningful terms are the single factors (Tv, a, fr, and Wv), interactive factors (aTv, frTv, afr, aWv, and frWv), and quadratic factors (Tv2, a2, and fr2). The contributions of the factors considered on the total specific energy model are depicted in Figure 7(c). For the single factors, the contributions of the a, fr, Tv, and Wv are 28.40%, 18.99%, 5.32%, and 4.83%. The contributions of the a2, fr2, and Tv2 are 13.34%, 8.03%, and 1.69%, respectively. For the interactive factors, the contributions of the afr, aTv, frWv, frTv, and apWv are 9.39%, 3.15%, 3.12%, 1.53%, and 1.41%, respectively.
ANOVA results for the total specific energy model.
Decreasing average roughness is an important indicator of the ADRT operation to enhance machined quality. The impacts of the ADRT parameters on the average roughness are depicted in Figure 8.
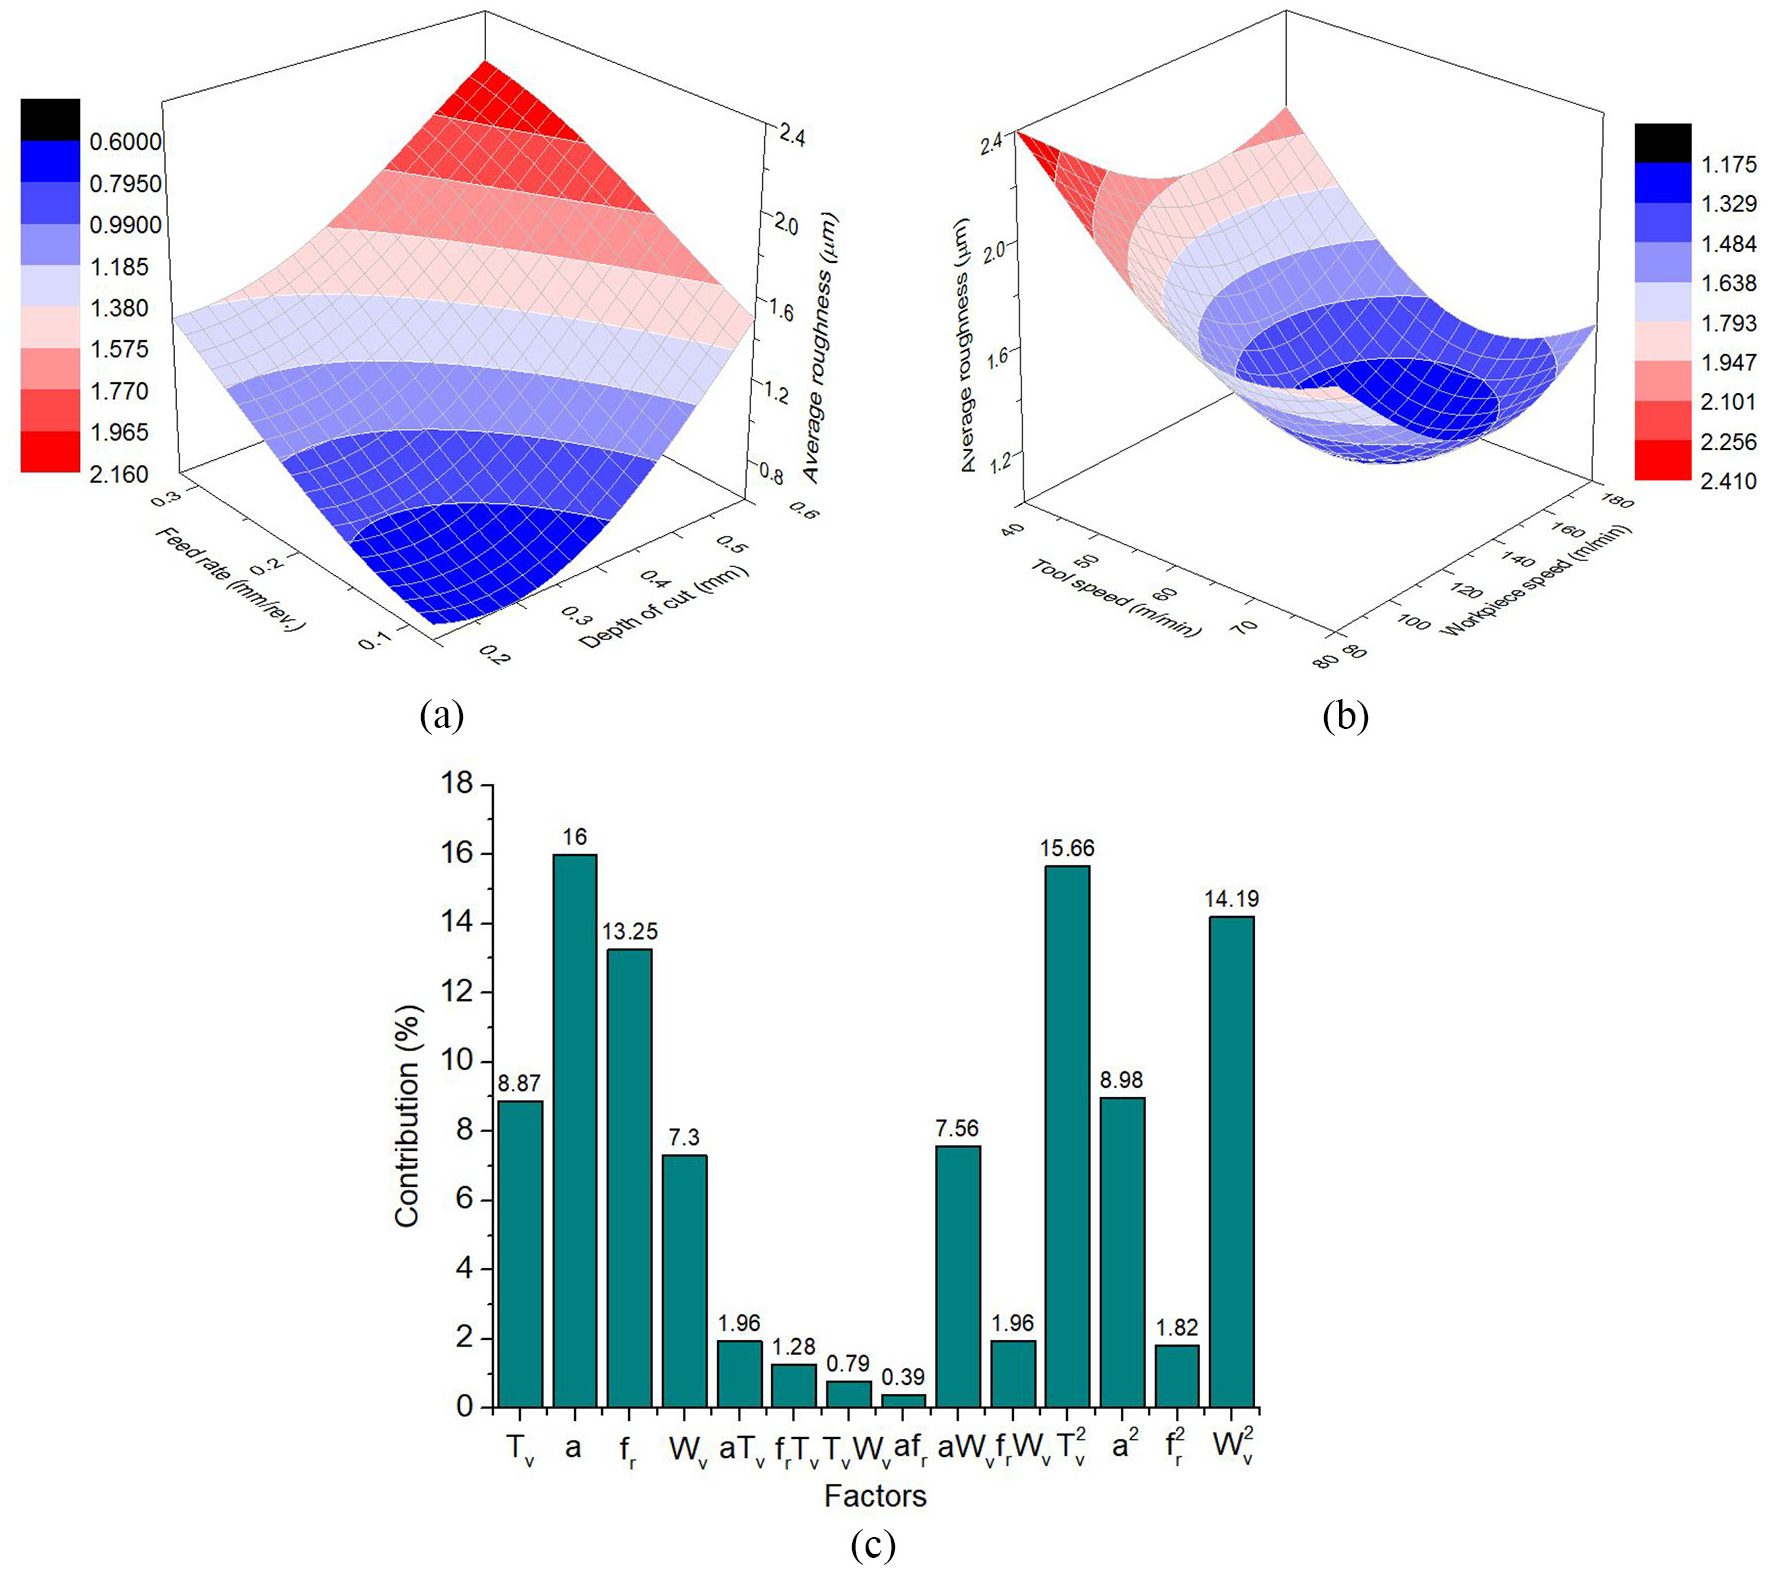
The effects of the parameters on the average roughness: (a) the average roughness versus the depth and feed, (b) the average roughness versus the tool and workpiece speed, and (c) parametric contributions for the average roughness.
Figure 8(a) presents the influences of the depth of cut and feed rate on the average roughness. As a result, higher average roughness is found with an increased depth of cut and/or feed rate. A higher depth of cut causes an increase in the chip thickness, which leads to a higher material removal volume. The turned material is heavily detached from the workpiece and higher roughness is produced. A higher feed rate causes a larger dimension between the successive turning paths, which causes an increased distance between the turned peaks. A larger machined mark is produced; hence, the average roughness increases.
Figure 8(b) presents the influences of the tool rotational speed and workpiece speed on the average roughness. As a result, the average roughness is decreased with an increased tool rotational speed and workpiece speed. Unfortunately, further tool rotational speed and/or workpiece speed causes an increase in the average roughness. Higher tool rotational speed and/or workpiece speed may decrease the frictional coefficient between the rotary tool and workpiece. The turned material is easily detached from the workpiece; hence, a lower average roughness is produced. Excessive tool rotational speed and/or workpiece speed may cause machining instability, which deteriorates the surface quality. Additionally, a further increase in the tool rotational speed and/or workpiece speed may lead to the work-hardening in the turned surface due to an excessive machining temperature. The turned chip is heavily detached from the machined surface; hence, a higher average roughness is produced.
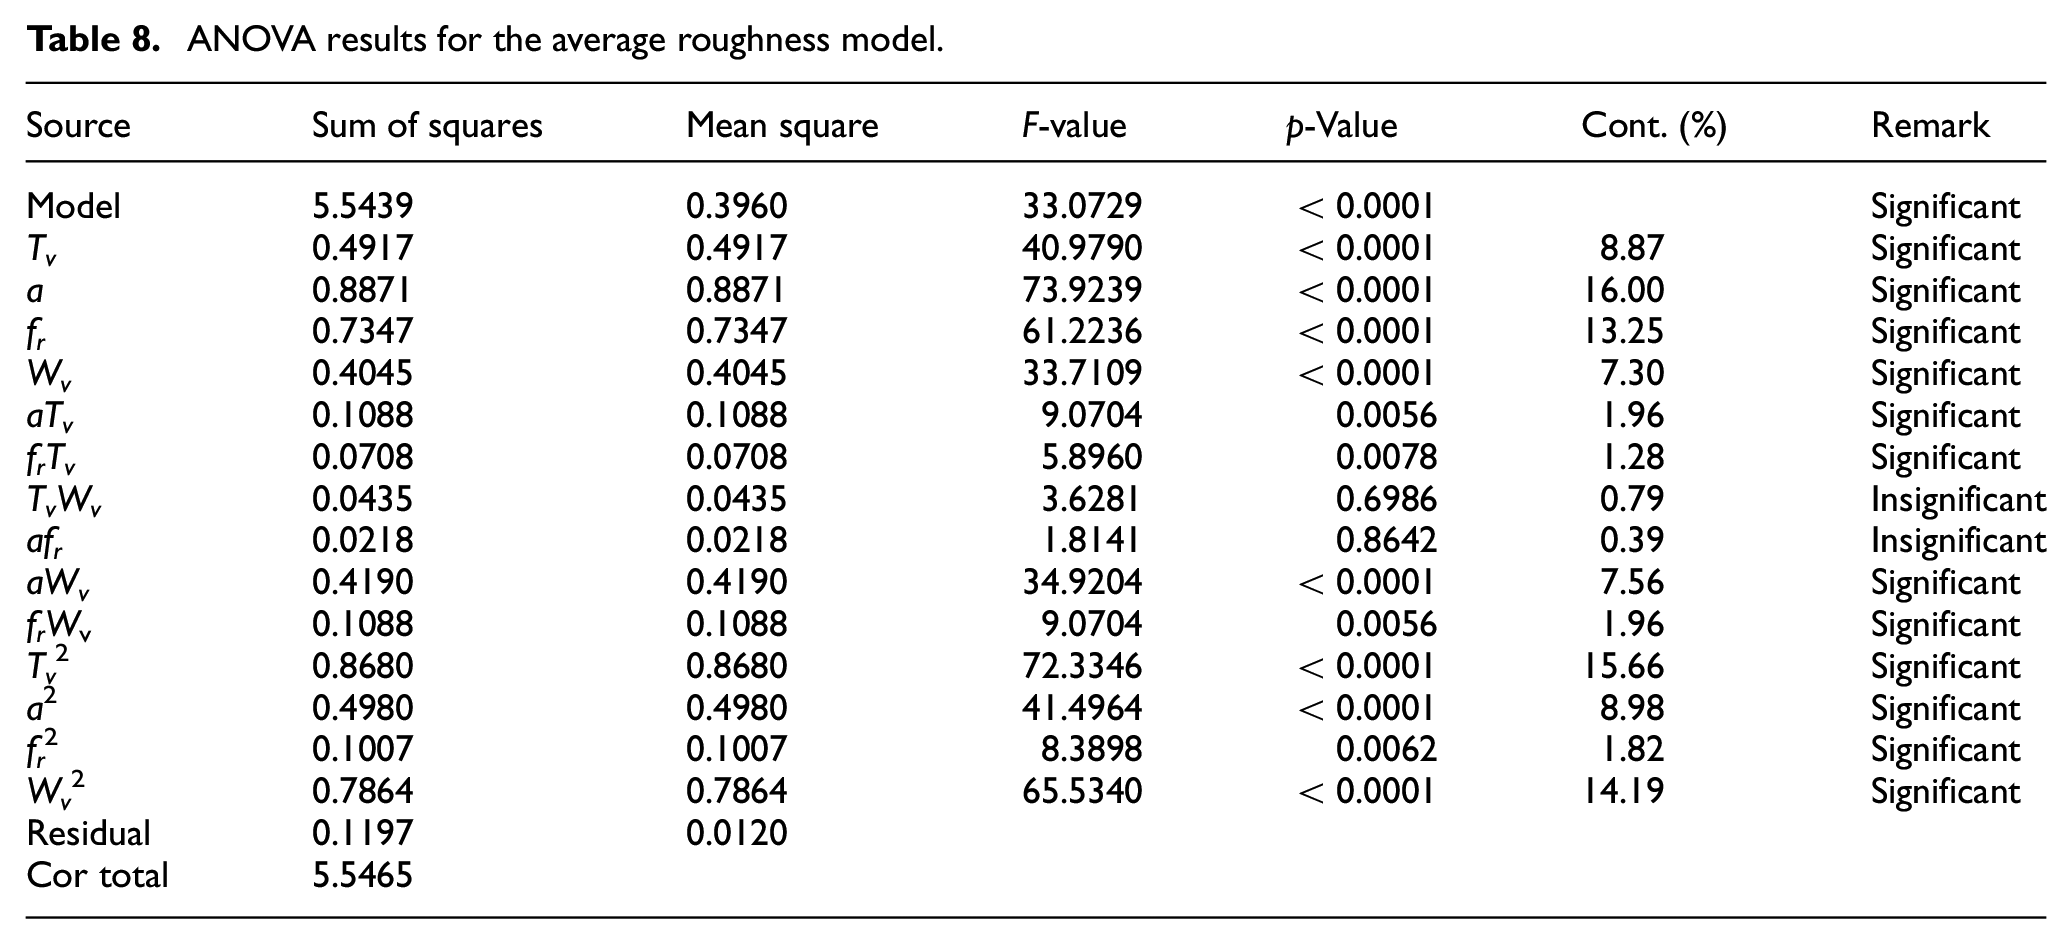
Table 8 shows ANOVA results of the average roughness model with 95% confidence level. The meaningful terms are the single factors (Tv, a, fr, and Wv), interactive factors (aTv, frTv, aWv, and frWv), and quadratic factors (Tv2, a2, fr2, and Wv2). The contributions of the factors considered on the average roughness model are depicted in Figure 8(c). The contributions of the ap, fr, Tv, and Wv are 16.00%, 13.25%, 8.87%, and 7.30%. The contributions of the Tv2, Wv2, a2, and fr2 are 15.66%, 14.19%, 8.98%, and 1.82%. The contributions of the aWv, aTv, frWv, and frTv are 7.56%, 1.96%, 1.96%, and 1.28, respectively.
ANOVA results for the average roughness model.
Reducing carbon emission is an effective solution to decrease environmental pollution. The influences of the ADRT parameters on the total carbon emission are depicted in Figure 9.
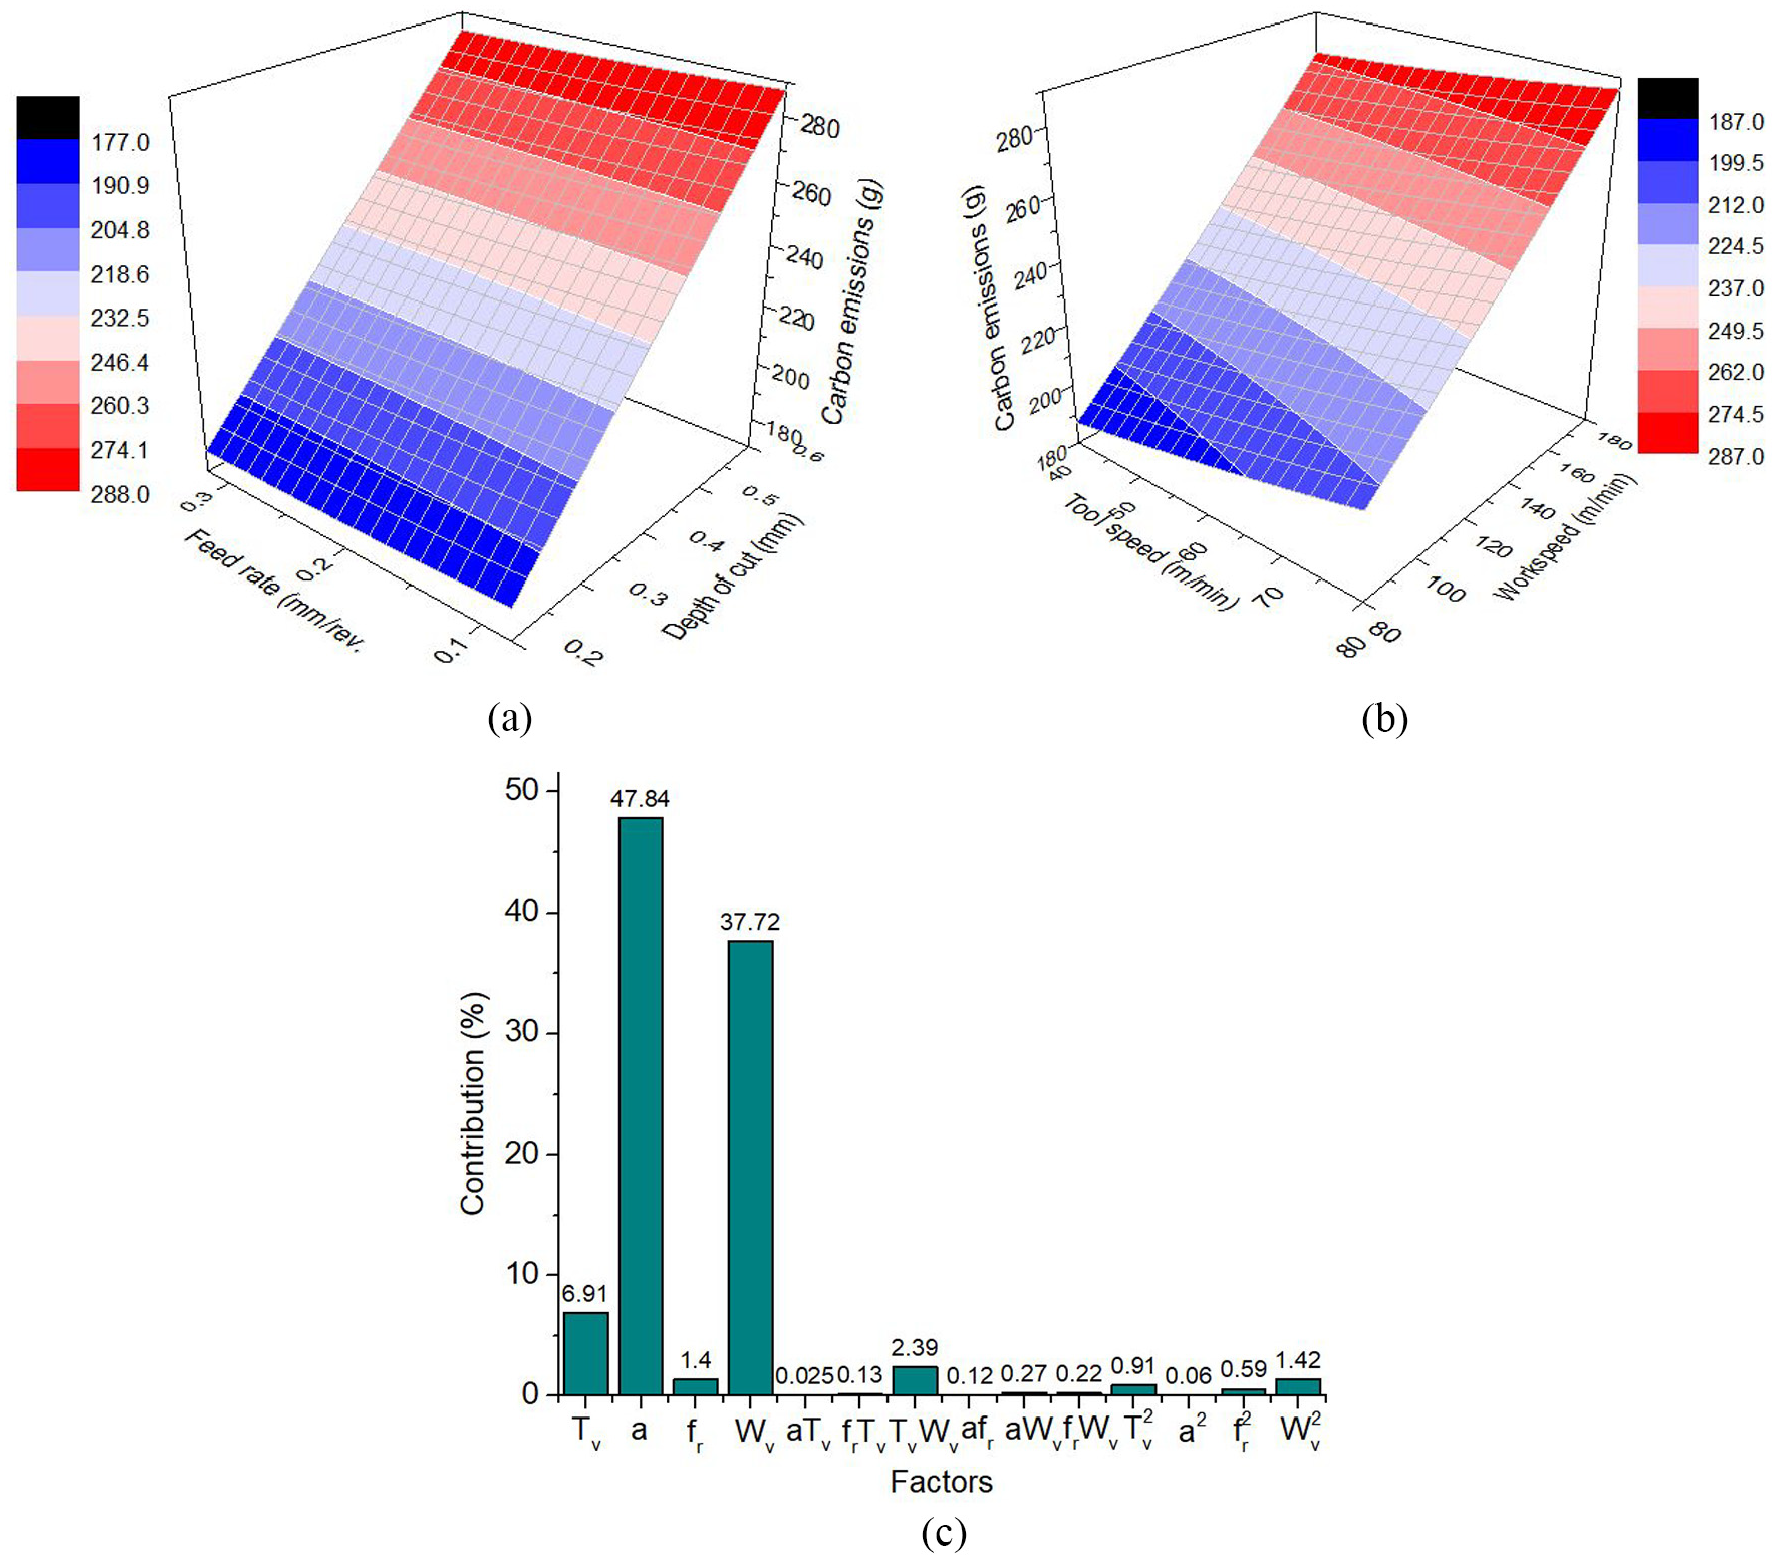
The effects of the parameters on the carbon emissions: (a) the carbon emissions versus the depth and feed, (b) the carbon emissions versus the tool and workpiece speed, and (c) parametric contributions for the carbon emission.
Figure 9(a) presents the influences of the depth of cut and feed rate on the total carbon emission. The feed rate and depth of cut have contradictory influences on the total carbon emission. It can be stated that carbon emission is decreased with an increased feed rate. As the feed rate increases, the total energy consumed decreases due to a faster turning; hence, lower carbon emission is produced. In contrast, an increased depth of cut leads to higher energy consumption, which causes a higher amount of carbon emission.
Figure 9(b) presents the influences of the tool rotational speed and workpiece speed on the total carbon emission. It can be stated that increased tool speed and/or workpiece speed leads to an increase in carbon emission. Higher tool speed and/or workpiece speed causes a reduction in the energy consumed in the turning time due to a faster turning. Unfortunately, higher energy consumed in the transition and air-turning states is required with an increased tool speed and/or workpiece speed. Moreover, higher tool and/or workpiece speed leads to a higher amount of carbon emission for the rotary tool and the chip generation.
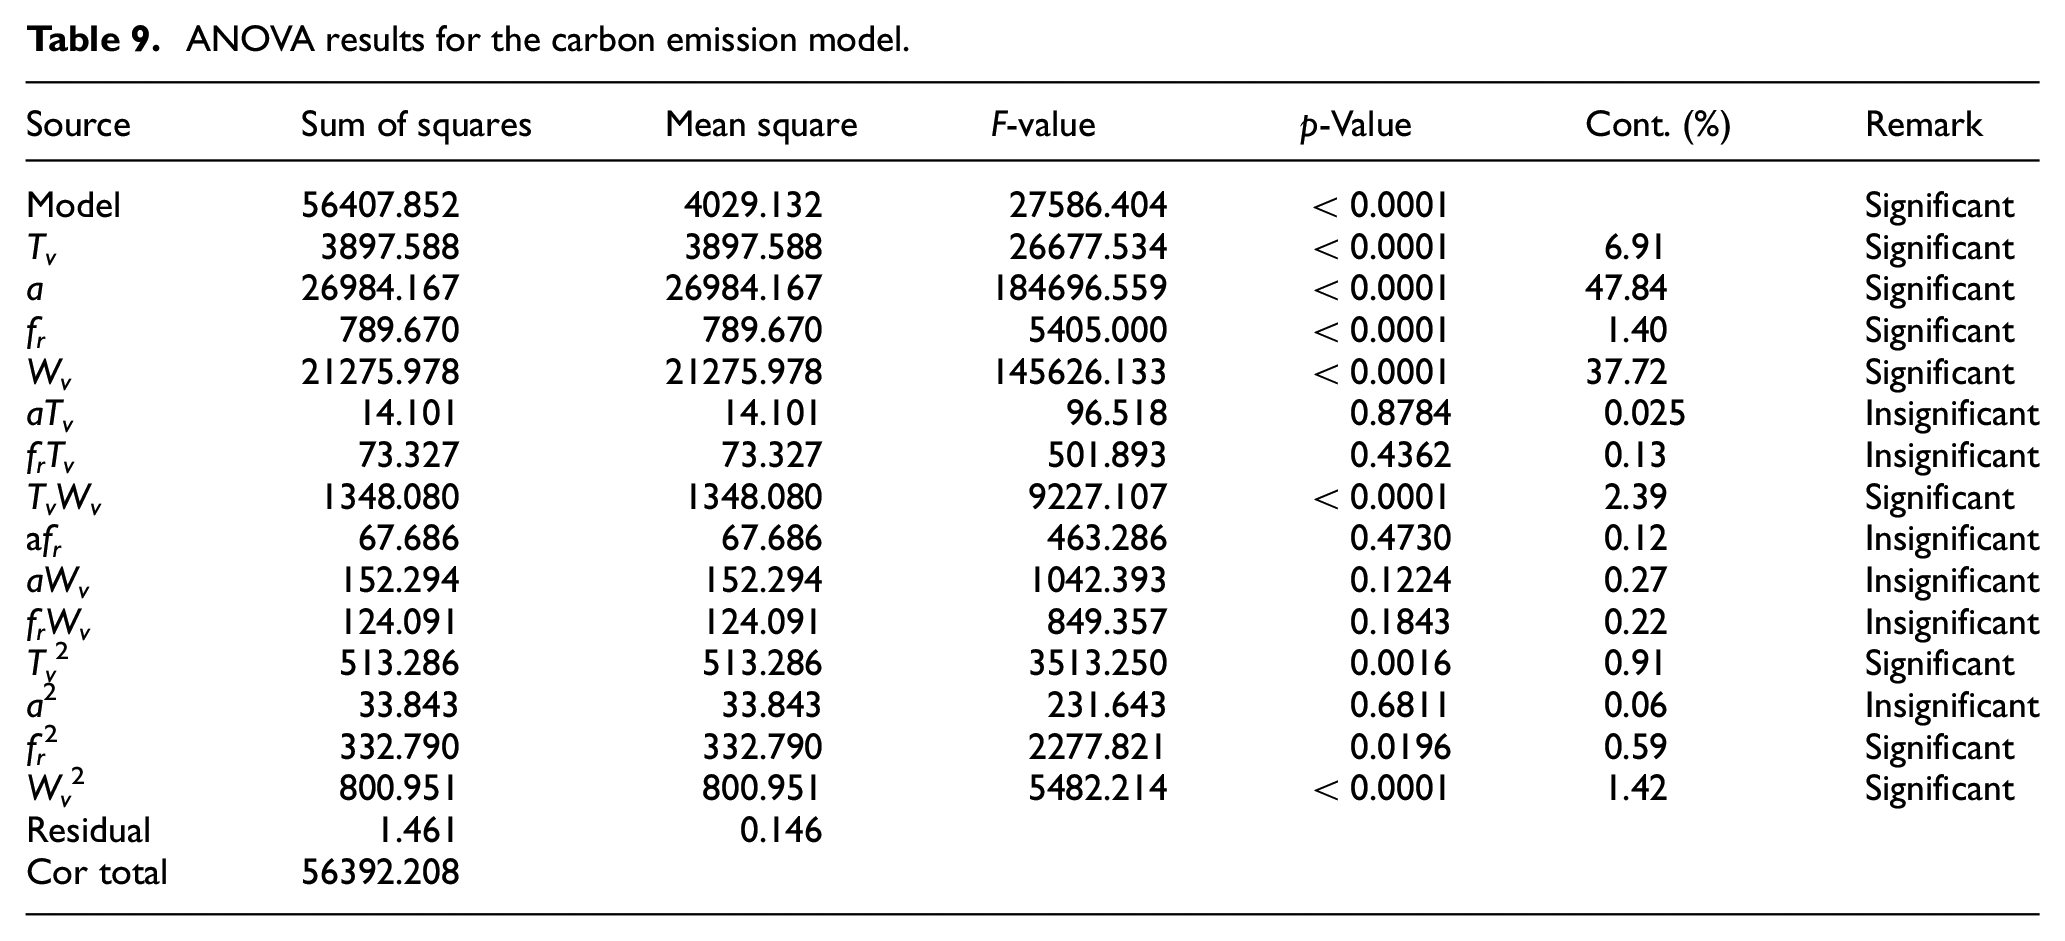
Table 9 shows ANOVA results of the carbon emission model with 95% confidence level. The meaningful terms are the single factors (Tv, a, fr, and Wv), the interactive factors (TvWv), and quadratic factors (Tv2, fr2, and Wv2). The contributions of the factors considered on the carbon emission model are depicted in Figure 9(c). The contributions of the a, Wv, Tv, and f are 47.84%, 37.72%, 6.91%, and 1.40%. The contributions of the Wv2, Tv2, and fr2 are 1.42%, 0.91%, and 0.59%. The contribution of the TvWv is 2.39%.
ANOVA results for the carbon emission model.
The reduced models of the SEC, AR, and CE after elimination of insignificant factors are expressed:
The surface morphology produced at various process parameters is presented in Figure 10. In this work, a scanning electron microscope labeled Nano Nova 450 is used to detect the surface morphology at different machining conditions. An increased feed rate and depth of cut significantly increases the average roughness. The small grooves, cracks, and waviness are obtained at a low depth of cut and feed rate (Figure 10(a)). Larger cracks, holes, and grooves are produced with an increased feed rate and depth of cut (Figure 10(b)).
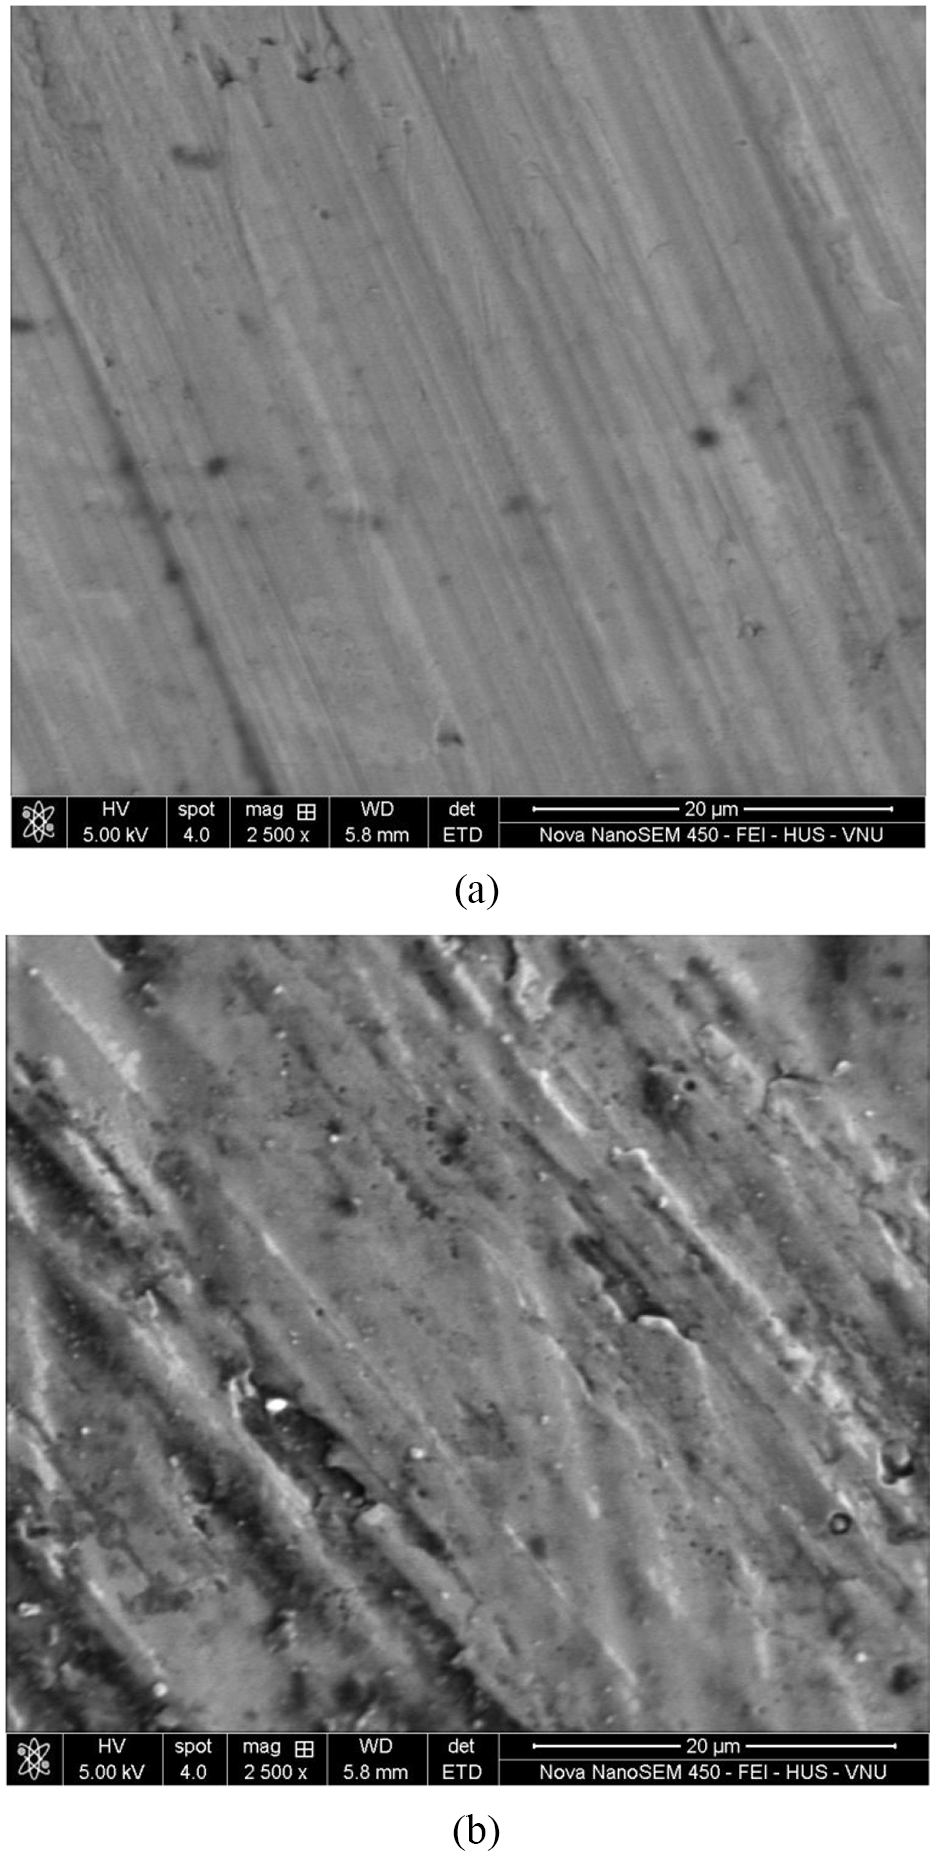
Surface morphology at various turning trails: (a) at process parameters: Tv = 60 m/min, a = 0.20 mm, fr = 0.08 mm/rev., Wv = 130 m/min and (b) at process parameters: Tv = 60 m/min, a = 0.60 mm, fr = 0.32 mm/rev., Wv = 130 m/min.
The surface images of the rotary insert after turning experiments are depicted in Figure 11. At the low feed rate and depth of cut, the wear behavior does not produce on the rake face. The shape of the circular insert is not much change (Figure 11(a)). Higher feed rate and depth of cut lead to a small fracture on the rake face. The integrity of the circular shape does not protect due to higher pressure and stress generated at higher feed rate and depth of cut (Figure 11(b)).
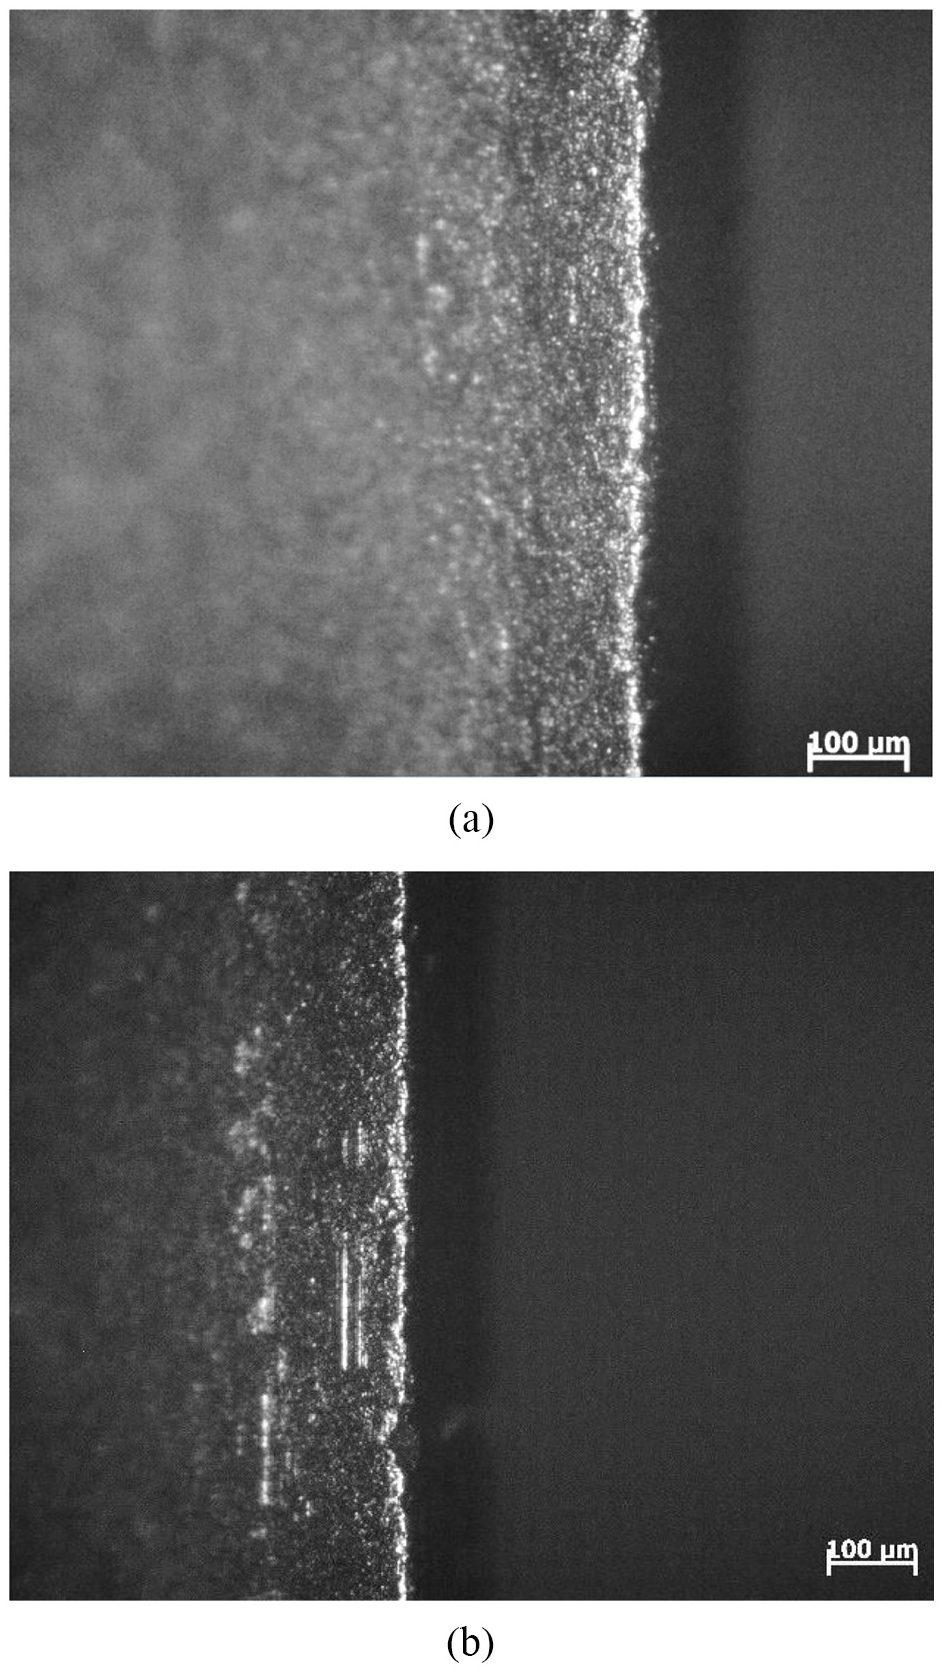
SEM images of the round insert at various turning trails: (a) at process parameters: Tv = 60 m/min, a = 0.20 mm, fr = 0.08 mm/rev., Wv = 130 m/min and (b) at process parameters: Tv = 60 m/min, a = 0.60 mm, fr = 0.32 mm/rev., Wv = 130 m/min.
Optimization outcomes
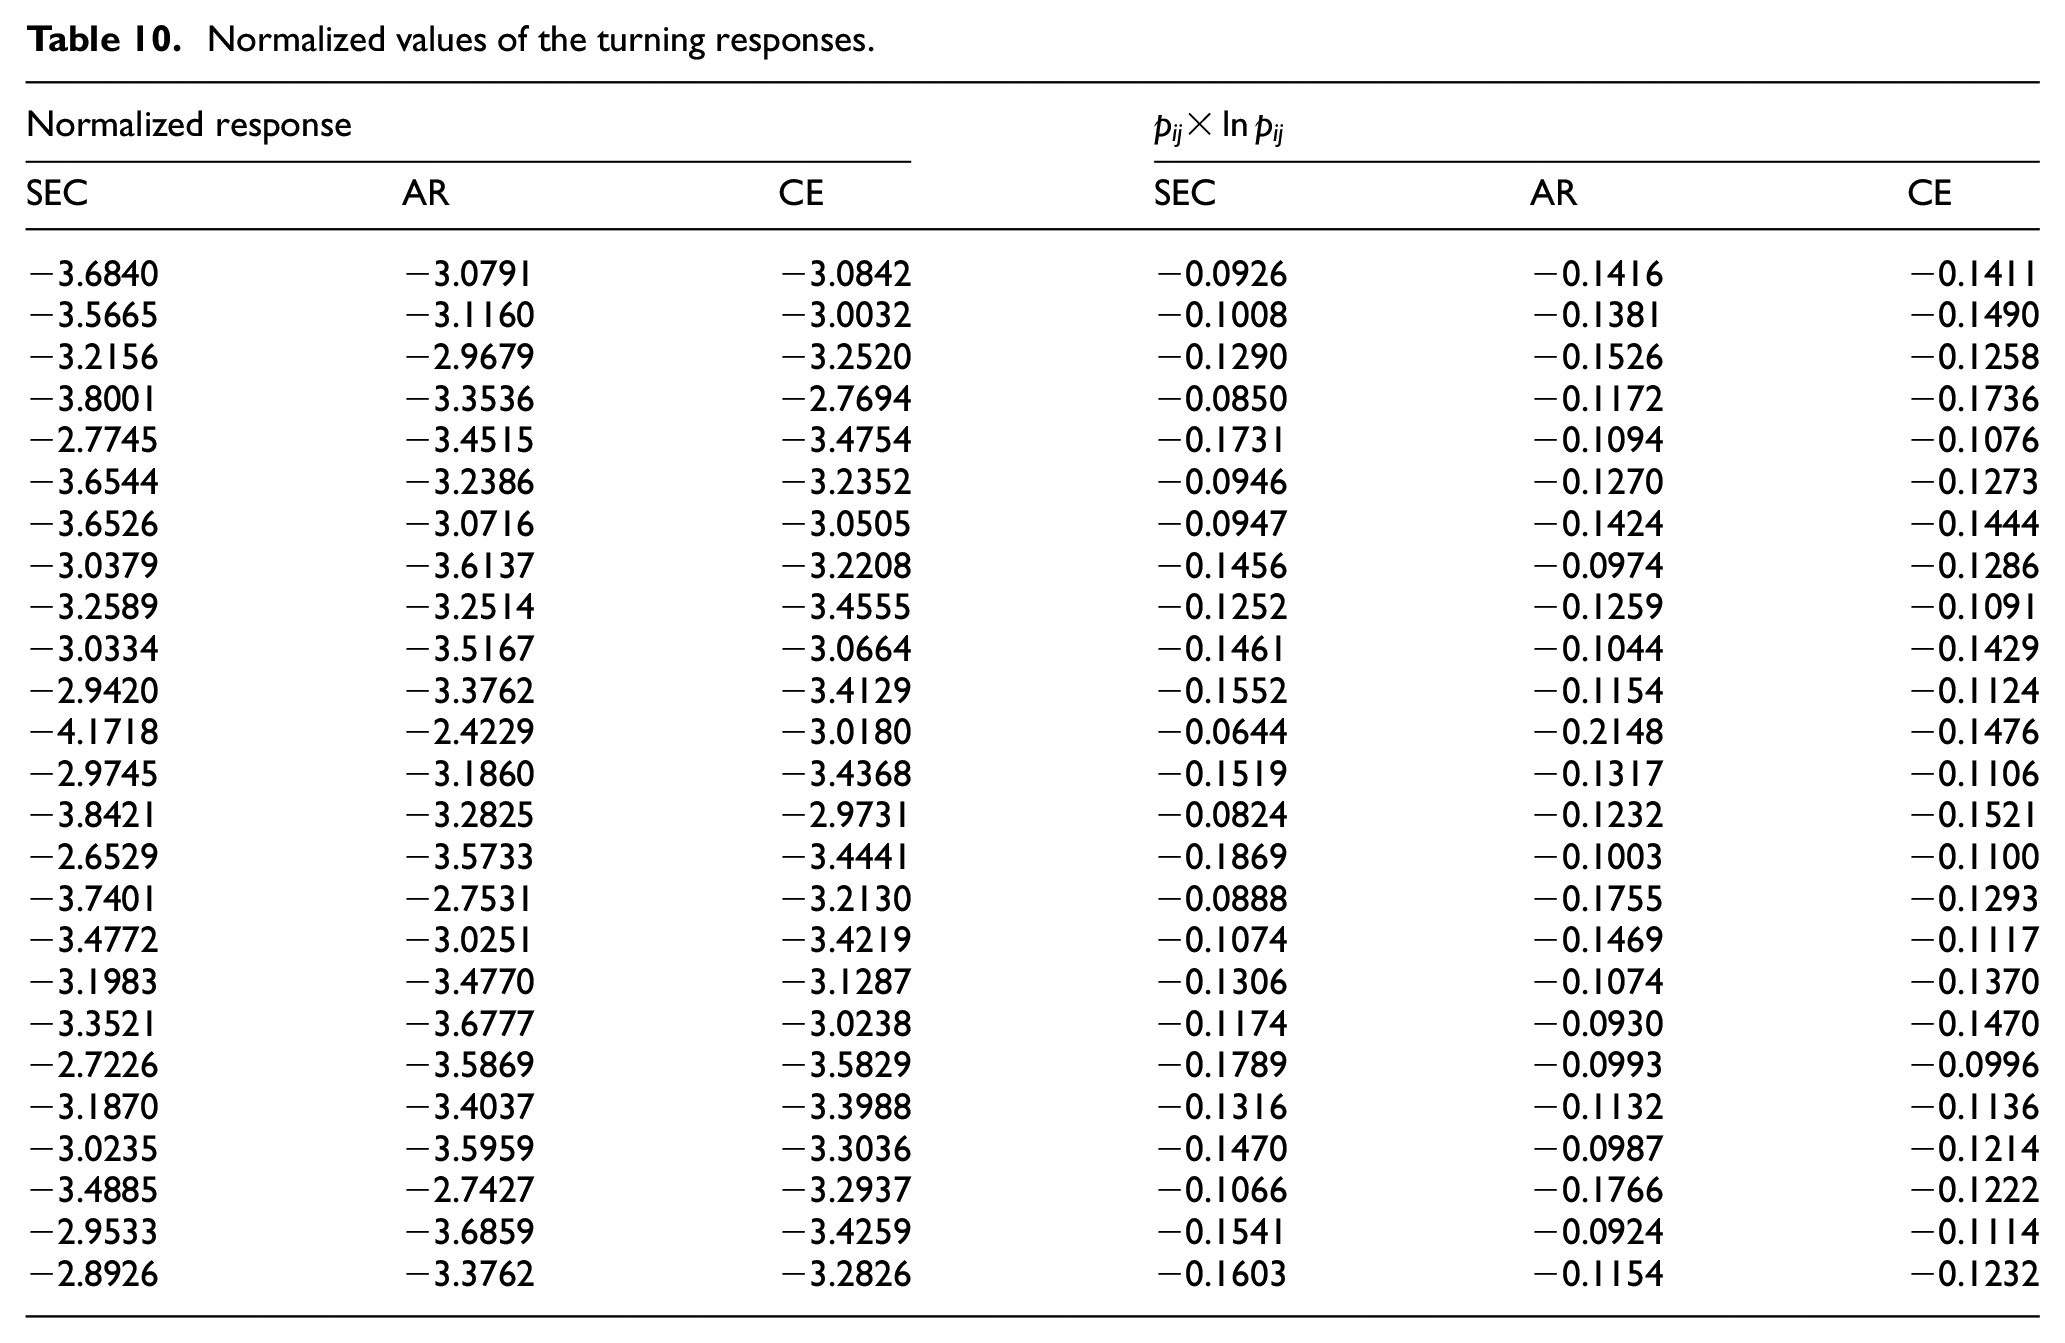
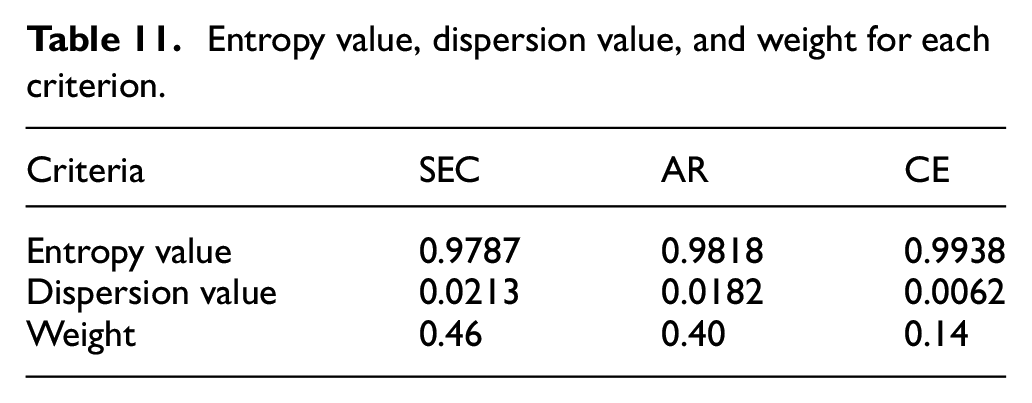
Table 10 presents normalized values of the ADRT responses, while Table 11 lists the entropy, dispersion, and weight values for the technical responses. As a result, the weight values of the total specific energy consumption, average roughness, and total carbon emission are 0.46, 0.40, and 0.14, respectively.
Normalized values of the turning responses.
Entropy value, dispersion value, and weight for each criterion.
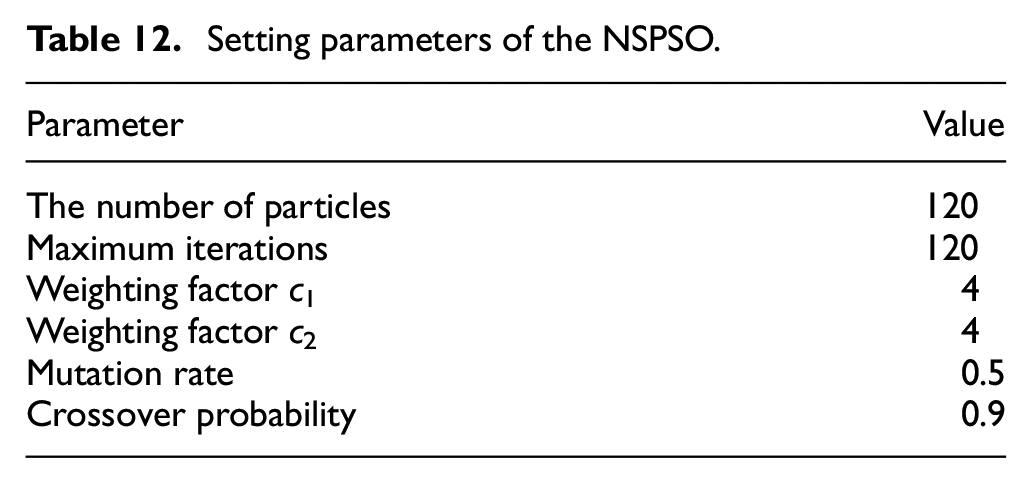
The operating parameters of the NSPSO algorithm are presented in Table 12. The Pareto graphs generated by NSPSO are depicted in Figure 12. It can be stated that machining performances have contradictory trends. The minimization of the average roughness may lead to an increment in the total specific energy and/or total carbon emission. It is difficult to achieve an optimum solution, which can satisfy all technological responses. Different feasible solutions are depicted on the Pareto fronts, which can be selected according to the specific machining target. Three typical solutions, including points 1, 2, and 3 are chosen to evaluate the turning performances in comparisons with the initial values.
Setting parameters of the NSPSO.
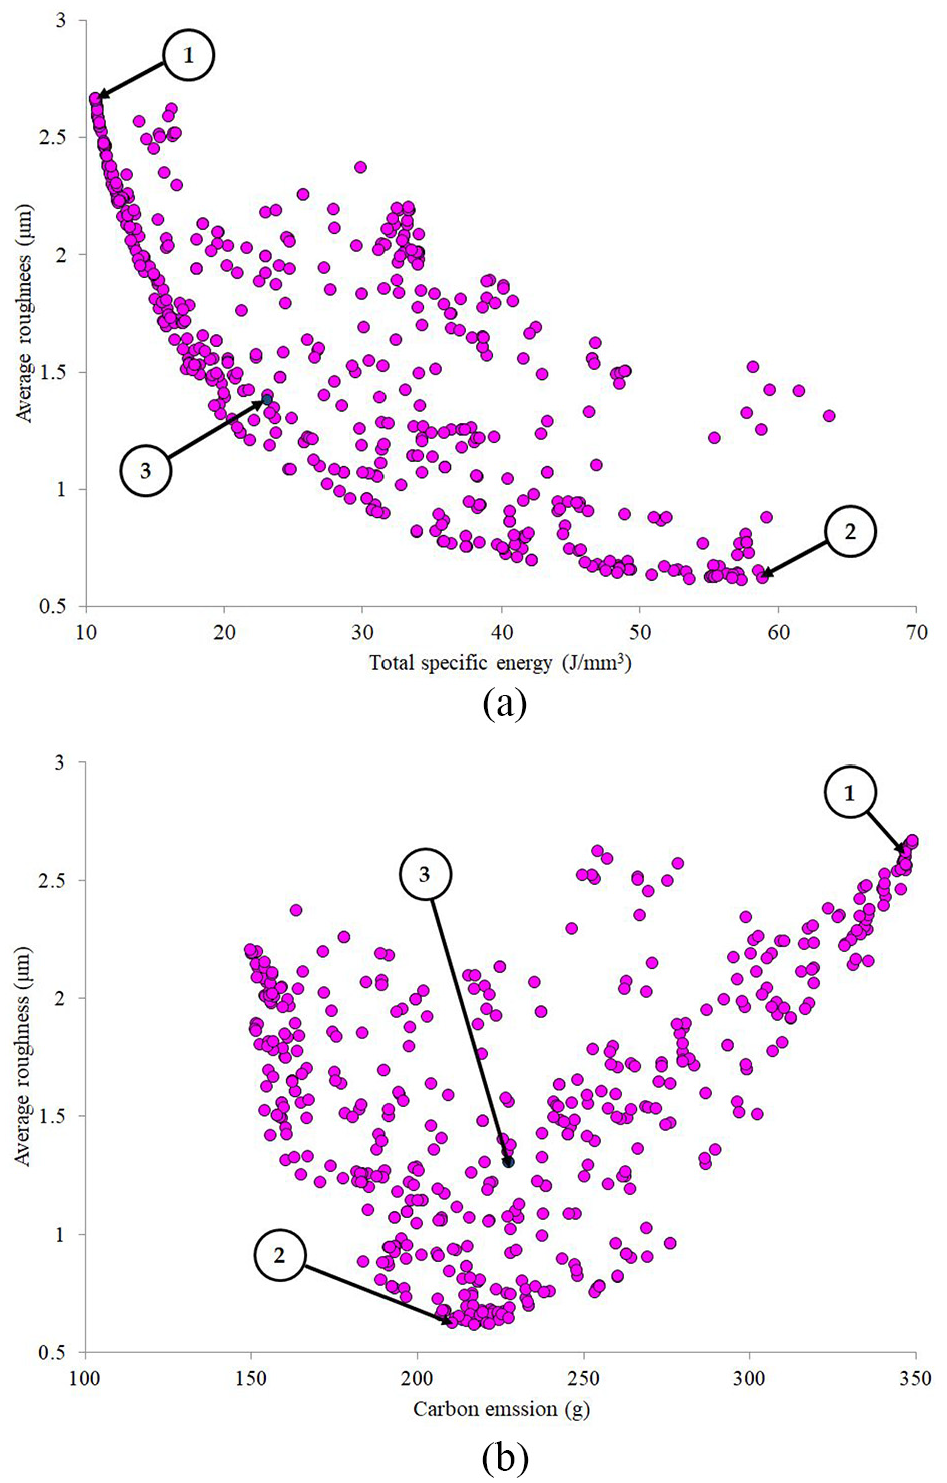
Pareto fronts: (a) average roughness and total specific energy consumed and (b) average roughness and carbon emissions.
For the first point, the average roughness and total carbon emission simultaneously increase, while the total specific energy decreases; hence, this solution does not satisfy the optimization requirement. For the second point, the total specific energy increases, while the average roughness and total carbon emission decrease; hence, this point cannot consider as a proper solution. For the third solution, the total specific energy, average roughness, and total carbon emission simultaneously decrease, as compared to the initial values. Consequently, the third point can be selected as an appropriate solution to enhance turning performances.
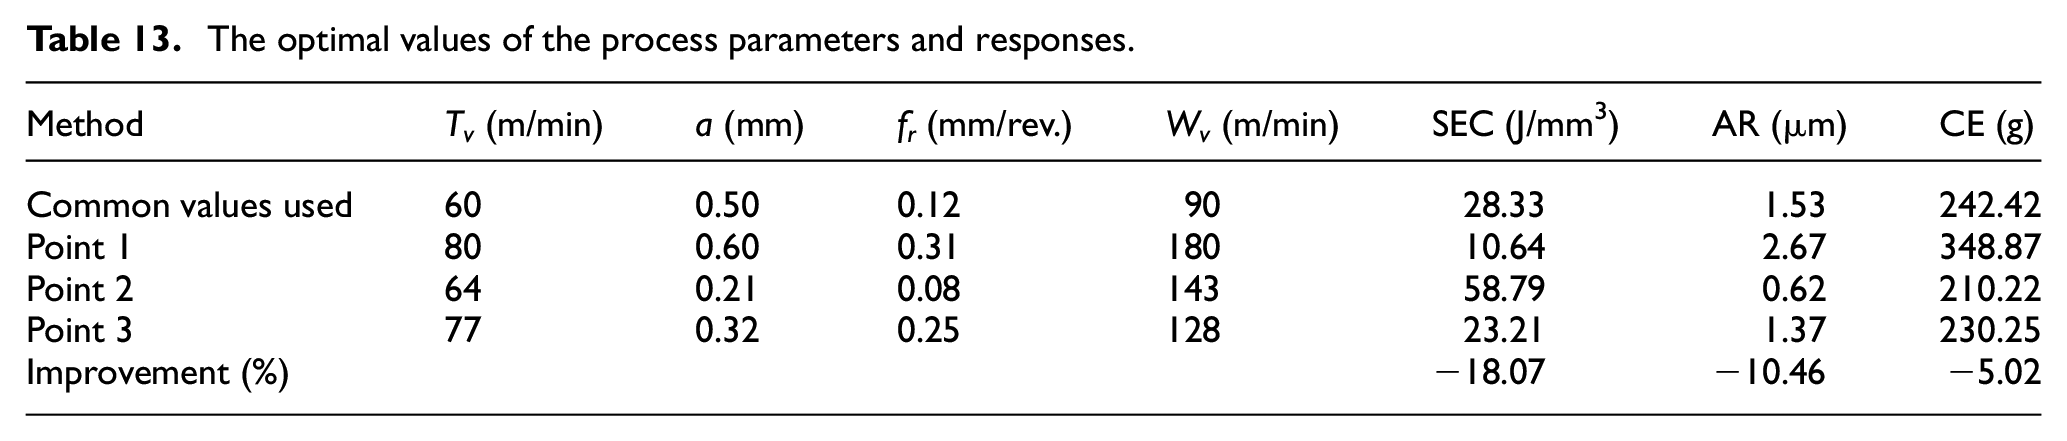
Based on the optimization requirement, the third point is selected as the optimal point. As a result, the optimum findings of the tool rotational speed, depth of cut, feed rate, and workpiece speed are 77.0 m/min, 0.32 mm, 0.25 mm/rev., and 128.0 m/min, respectively. The reductions in the total specific energy, average roughness, and total carbon emission are 18.07%, 10.46%, and 5.02%, respectively, as compared to the initial values (Table 13).
The optimal values of the process parameters and responses.
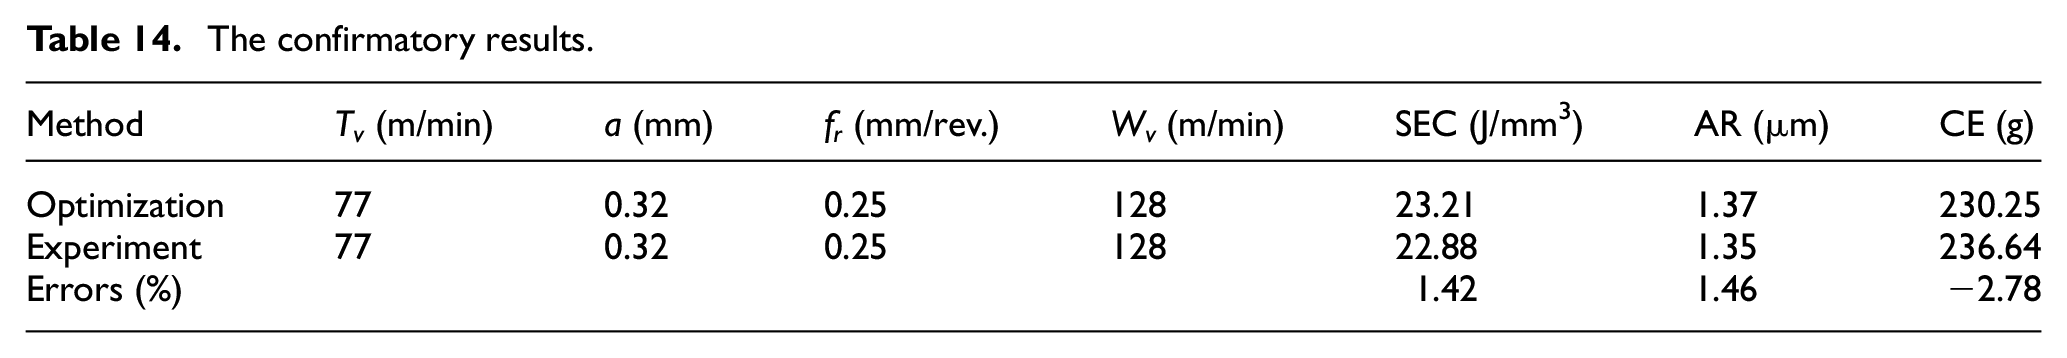
To investigate the effectiveness of the proposed approach, a confirmatory turning is conducted at the optimal solution. The deviations between the optimal results and experimental data of the SEC, AR, and CE are 1.42%, 1.35%, and 2.78%, respectively, as shown in Table 14. The acceptable errors (less than 5%) indicate that the optimization results are reliable and trustworthy.
The confirmatory results.
Conclusions
In the current work, a multi-response optimization of the actively driven rotary turning process has been performed to decrease the total specific energy, average roughness, and total carbon emission. The optimizing inputs are the tool rotational speed, workpiece speed, depth of cut, and feed rate. The regression method was applied to develop comprehensive models of the machining responses regarding process parameters. The entropy method was employed to calculate the weights of technological objectives. The non-dominated sorting particle swarm optimization was utilized to find optimal outcomes. The findings can be listed as bellows:
The maximum values of the depth of cut, feed rate, tool rotational speed, and workpiece speed can be applied to save the specific energy. Lower depth of cut and feed rate are recommended to obtain a smooth surface, while higher tool rotational and workpiece speed can be used to decrease the roughness. The lowest levels of the depth of cut, tool speed, and workpiece speed can be employed to decrease the carbon emissions, while an increased feed rate leads to a reduction in the carbon generated.
The predictive models of the total specific energy consumption, total carbon emission, and average roughness are significant. These models can be applied to predict the machining responses in industrial applications with acceptable precision. Moreover, the proposed models can be directly employed for the actively driven rotary turning operation of the hardened SKD11 steel without expensive costs and efforts.
As shown in the optimal setting generated by the non-dominated sorting particle swarm optimization, the optimal parameters of the tool rotation speed, depth of cut, feed rate, and workpiece speed are 77.0 m/min, 0.32 mm, 0.25 mm/rev., and 128.0 m/min, respectively. The total specific energy, average roughness, and total carbon emission are decreased by 18.07%, 10.46%, and 5.02%, respectively, as compared to initial values.
The proposed approach using the regression method, entropy weight, and on-dominated sorting particle swarm optimization can be used to model the comprehensive responses and to effectively select the optimal solution, as compared to the trial method and operator experience.
Practically, the energy consumption for the cutting tool and fluid has negative impacts on the environment and machining costs. Therefore, a comprehensive approach considering more sustainable performances can be addressed in the next investigation.
Footnotes
Appendix
Declaration of conflicting interests
The author(s) declared no potential conflicts of interest with respect to the research, authorship, and/or publication of this article.
Funding
The author(s) disclosed receipt of the following financial support for the research, authorship, and/or publication of this article: This research is funded by Vietnam National Foundation for Science and Technology Development (NAFOSTED) under grant number 107.04-2020.02.