
Abstract
Micro-feature arrays and large-area complex microscopic features on thin metallic sheet play an important role in micro-components. A novel technique-submerged water-jet cavitation shocking-is presented to generate micro-feature arrays on 304 stainless foils in this paper. High-speed camera shadowgraph images of the cavitation cloud were employed to analyze the impact zone. Then the forming depth, uniformity of forming depth and the thickness distribution of the micro-feature arrays were also studied. The results show that the forming region can be categorized into the jet-impact-zone, the bubble-impact-zone and the periphery-impact-zone radially. Bubble-impact-zone peaks in the depth of array micro-forming. The forming depth increases with time while the uniformity decreases with time. The forming parts have a uniform thickness distribution.
Introduction
In recent years, there is an increasing demand for micro-parts in micro-electro-mechanical systems.1,2 Micro-arrays are widely used in the fields of medical, communication, optics, chemistry, etc. 3 Some micro-forming techniques, such as the micro-stamping and the electro-chemical micro-machining have been utilized to manufacture these micro-arrays.4,5 However, the high cost, the long processing time, limited materials are still the bottlenecks facing the micro-forming.6,7 Thus, it is necessary to improve the existing processes and explore new techniques to better meet the industrial requirements.
Water-jet cavitation occur when a submerged water-jet issuing into a static water environment. Bubbles form in the shear layer of the jet and then collapse in the high pressure region downstream of the jet, which generates instantaneous high temperature and partial high pressure. 8 The water-jet cavitation can generate extremely high impact pressure and stress concentration on the surface of the object because of the highly-concentrated energy during the cavitation collapse, which has been successfully applied to the machining field for surface modification, polishing, honing, and deburring.9–11 Takakuwa et al. 12 used water-jet cavitation to improve the fatigue strength and corrosion resistance of duralumin plate. Water-jet cavitation can also be utilized for forming due to its high pressure. Soyama and Saito 13 successfully prepared a test plate that conforms to the radius of curvature of the aircraft’s main wing using water-jet cavitation. Chen et al. 14 used the laser-included cavitation to obtain square pits with a side length of 500 μm and circular pits with a diameter of 500 μm. However, there is no report on the array micro-forming of foils using water-jet cavitation now.
This paper used water-jet cavitation to investigate a process of manufacturing micro-arrays. 304 stainless steel foils were selected as the experiment materials. The range of the array micro-forming zone and the surface quality of formed components was studied. The influences of standoff distance and time on the forming depth and the uniformity were investigated.
Forming mechanism
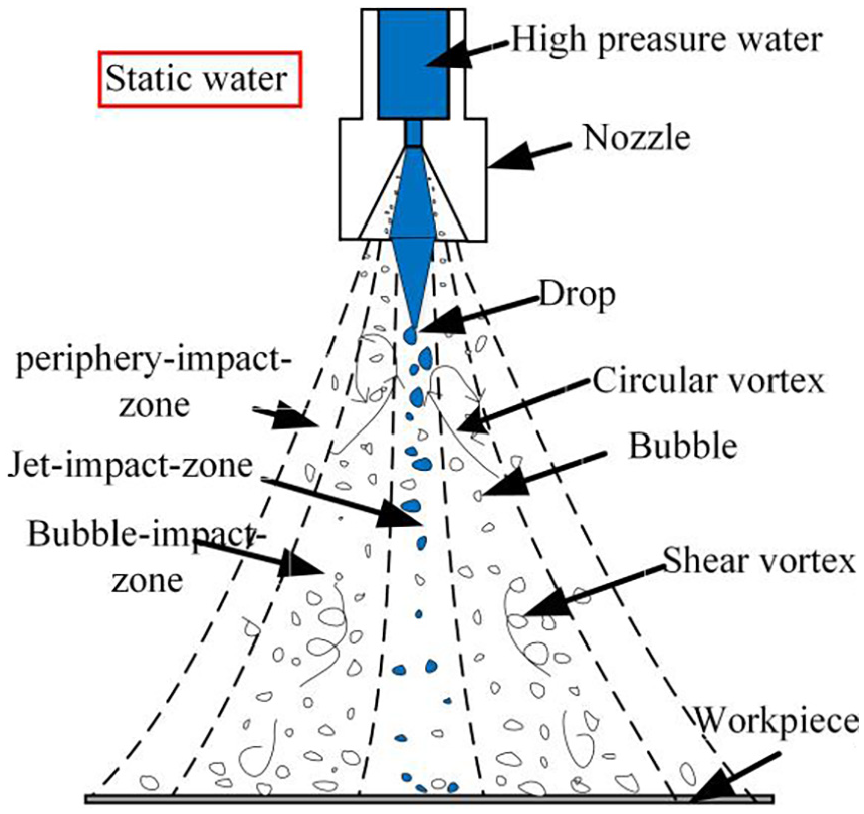
Figure 1 shows the forming mechanism of water-jet cavitation shock array micro-forming. Cavitation bubbles are generated in the shear layer of the high speed submerged jet in water. Then the bubbles accumulate and enlarge in the traveling downstream. This accumulation and enlargement process is influenced by the jet and ambient fluid. When the bubbles collapse at the surface of the sample, the highly concentrated energy (GPa) is generated as a result of instantaneously generated shock wave and micro-jet flow.15–17 As the peak value of local pressure exceeds the Hugoniot elastic limit (HEL) of the material, the workpiece experiences plastic yield. Since the below side of the sample is free, the workpiece will be drawn into the micro mold. It should be noticed that the workpiece must fit close to the micro-mold in this forming process.
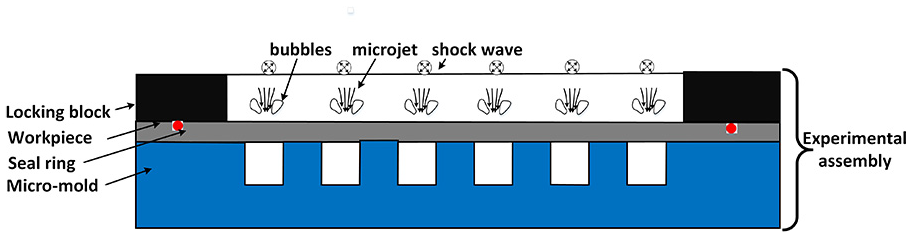
Schematic of water-jet cavitation shock array micro-forming.
Experimental method and procedure
Experimental setup
Figure 2(a) shows a diagram of the experimental system of present study. The tap water in the storage tank was stored for at least 24 h before the tests and the temperature was 25 ± 2°C. A high-pressure piston pump (COMET, Italy) was used to pressurize the water to generate a submerged cavitation jet in the test tank. The test tank was made of an acrylic resin with the size of 600 mm × 600 mm × 800 mm for the flow visualization. Although the maximum pump pressure is 30 MPa, the pressure selected was 20 MPa and the flow rate was 6 L/min in the experiments. A connector that can change the flow direction of the jet was installed between the pipe and the nozzle. The test nozzle selected was a horn-type one with an expansion angle of 30°, as shown in Figure 2(b). It was located at least 200 mm deep from the water surface to ensure the effect of the cavitation. The optimal size ratio of the nozzle was d:E = 1:8, 18 the throat diameter of the nozzle d 1.5 mm was selected. The cavitation number σ was a measure of the resistance of the flow to cavitation and can be written approximated as P2/P1. 8 The cavitation number σ = 0.005 was chosen with the upstream pressure P1 = 20 MPa and the downstream pressure P2 = 0.1 MPa after trial and error. 19
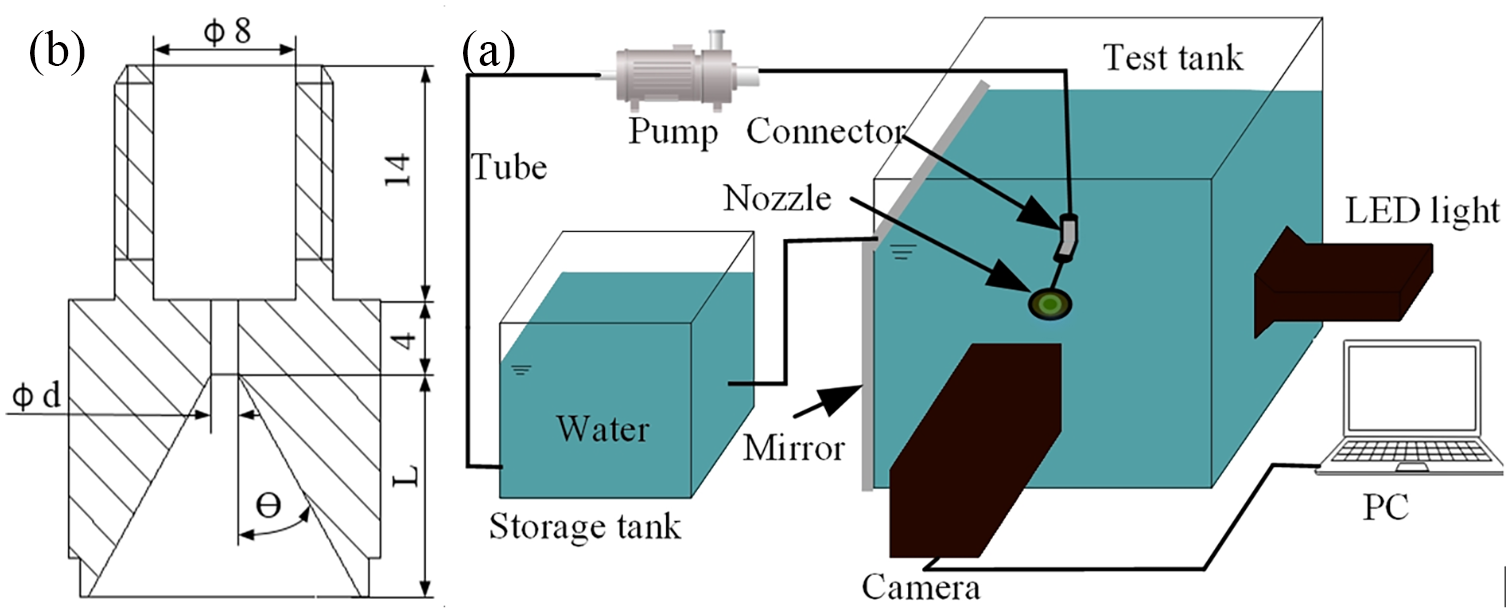
(a) Water-jet cavitation experimental system and (b) nozzle geometry diagram.
Observation of cloud collapse
To determine the relationship between the cavitation cloud collapse and the micro-forming of the foil, a high-speed camera at 6500 frame/s was used to observe cavitation jet from the axial direction through the transparent plate. An LED lamp was fixed on the side of the tank and a mirror was placed on the other side of the tank to strengthen the uniformity of the light. The nozzle was installed with the outlet pointing to the wall of the tank and the standoff distance selected was 120 mm. The standoff distance S was defined as the distance between the nozzle outlet and the wall of water tank. The shadowgraph images could be obtained because of the strong reflection of cavitation bubbles. The target area of images obtained from the camera was 64 mm × 64 mm with spatial resolution of 256 × 256 pixels.
Characterization of water-jet cavitation shock array micro-forming
The experimental assembly consisted of a locking block, seal ring, workpiece and rigid micro-mold, as shown in Figure 1. The nozzle was installed with the outlet pointing to the bottom of the tank. The assembly was fixed on the bottom of the test tank and perpendicularly below the center of the jet axis. 304 stainless steel foils were broadly used in micro-electro-mechanical systems (MEMS) because of its characteristics of good processing performance and high toughness. 304 stainless steel foils with a thickness of 80 μm (Rungu Electromechanical Company, China) was chosen and cut into a square with a size of 60 mm × 60 mm in this experiment. It was mounted on the fixture and positioned under the center of the nozzle. The flatness of the workpiece should be guaranteed. Figure 3 shows the micro-mold machined by wire cut electrical discharge machining (WEDM). The diameter and the depth of cavities on micro mold were about
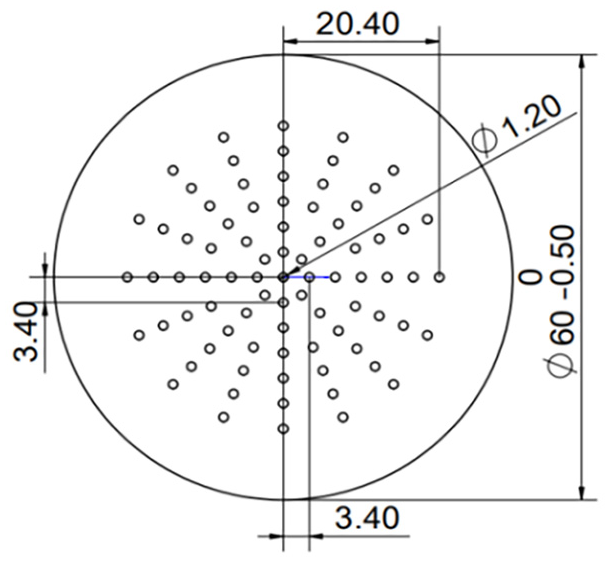
The shape and dimensions of the micro-mold.
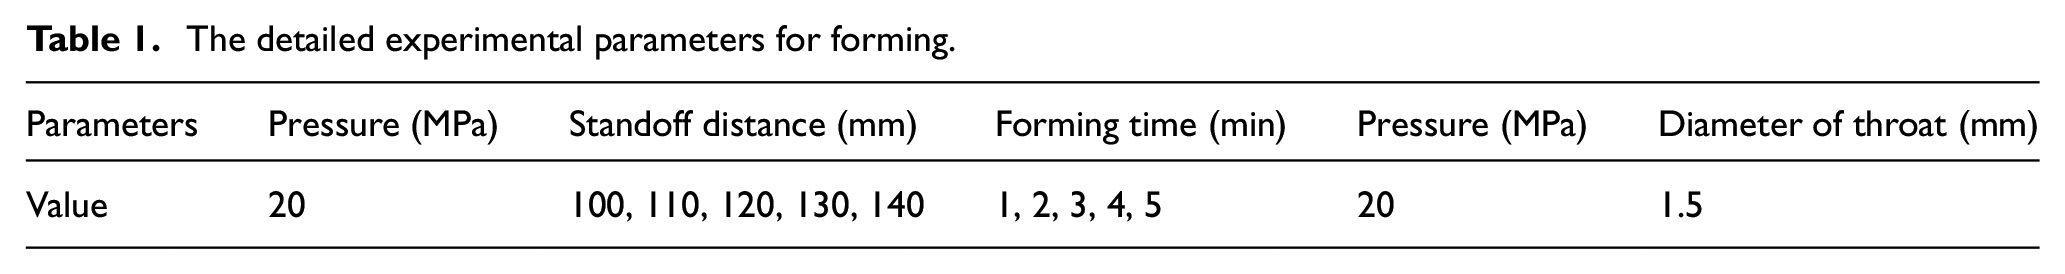
The detailed experimental parameters for forming.
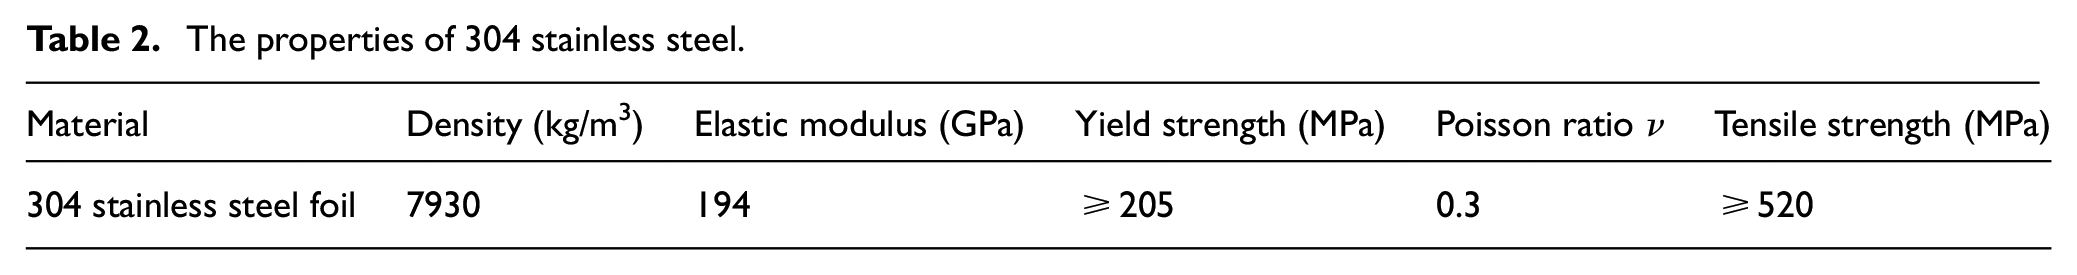
The properties of 304 stainless steel.
After the components were formed, a digital microscope (KEYENCE VHX-1000C) was employed to analyze the 3D profile and the forming depth, as well as the cross-section thickness. The forming depth was defined as the maximum depth of the formed part in this paper.
Result and discussion
Feasibility analysis
A macroscopic topographical view of the micro-formed sample with a test time of 5 min and a standoff distance of 120 mm is shown in Figure 4(a). The forming effect varies in different zones. The area with the relatively deeper craters is a ring named as bubble-impact-zone. The inner radius r1 and the outer radius r2 of the ring are approximately 9 mm and 19 mm, respectively. The depth of the crater in the jet center region and peripheral region of the ring named as jet-impact-zone and periphery-impact-zone is far less than that of the crater at the ring. Figure 4(b) displays a 3D topography of Crater b in Figure 4(a). Crater b has a smooth profile. Moreover, there is no crack and wrinkling on the surface of the formed component. Figure 4(c) shows the profiles of six craters in the L1 direction of the sample, indicated as a-j in Figure 4(a). The craters in jet-impact-zone and periphery-impact-zone were smaller than those in the bubble-impact-zone.
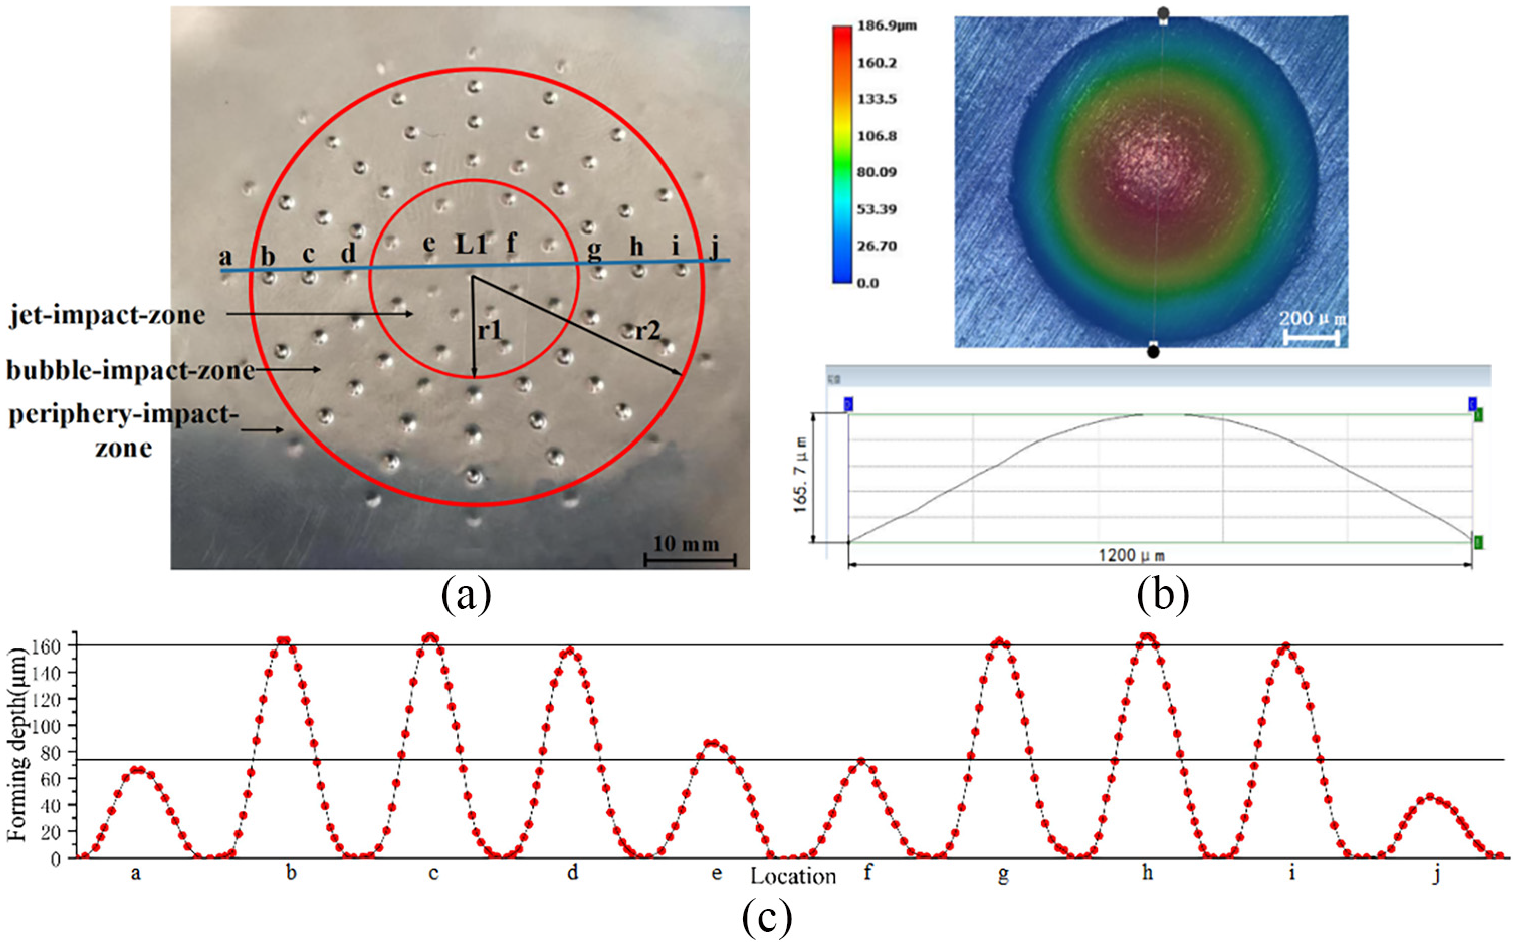
A typical workpiece with a test time of 5 min and a standoff distance of 120 mm: (a) 2D plot of workpiece, (b) 3D morphology of crater b, and (c) morphology curve of crater in L1 direction
To investigate the relationship between the cavitation cloud collapse and the array micro-forming, a high-speed camera was used to observe the cloud structure through the transparent plate. The sequential shadowgraph images obtained by the high-speed camera are shown in Figure 5, and Figure 6 shows the time-different images, obtained by subtracting the intensity of the two sequential shadowgraph images pixel by pixel and in the form of cloud images through IMAGESC function in MATLAB. Therefore, the red parts in the time-different images show the growth of bubbles and the blue parts the disappearance. The images have a time interval of 0.15 ms and exhibit the periodic cloud behavior of the cavitation water-jet. The collapse of cloud collapse occurs along the tank wall at 0.95 ms to 1.05 ms. The time-different images of Figure 6 show more clearly the corresponding event of cloud collapse. The cavitation cloud collapse occurs in a ring region, which is also well known as a typical erosion region of cavitation water-jet. This indicates that most of the cavitation bubbles are distributed along the outer shear layer of the jet and responsible for most of plastic deformation of the sample. According to the time-different images, the inner and outer ring radius were about 8 mm and 18 mm, respectively. This is consistent with the bubble-impact-zone.
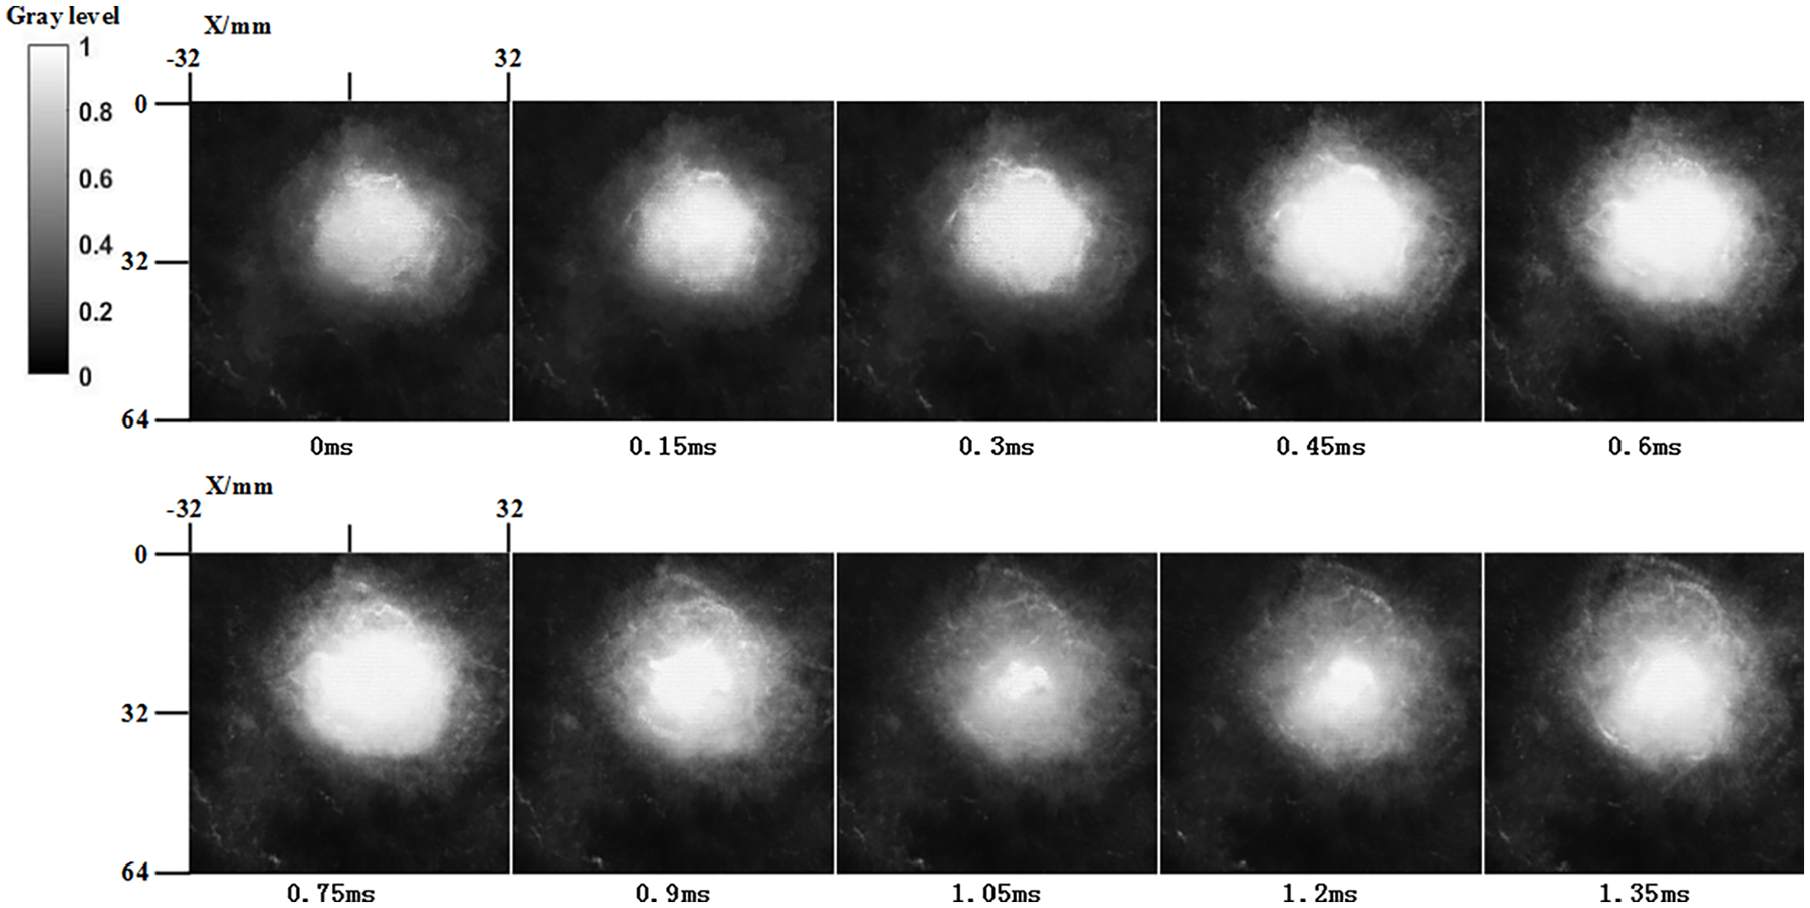
Time-resolved observation shadowgraph images.
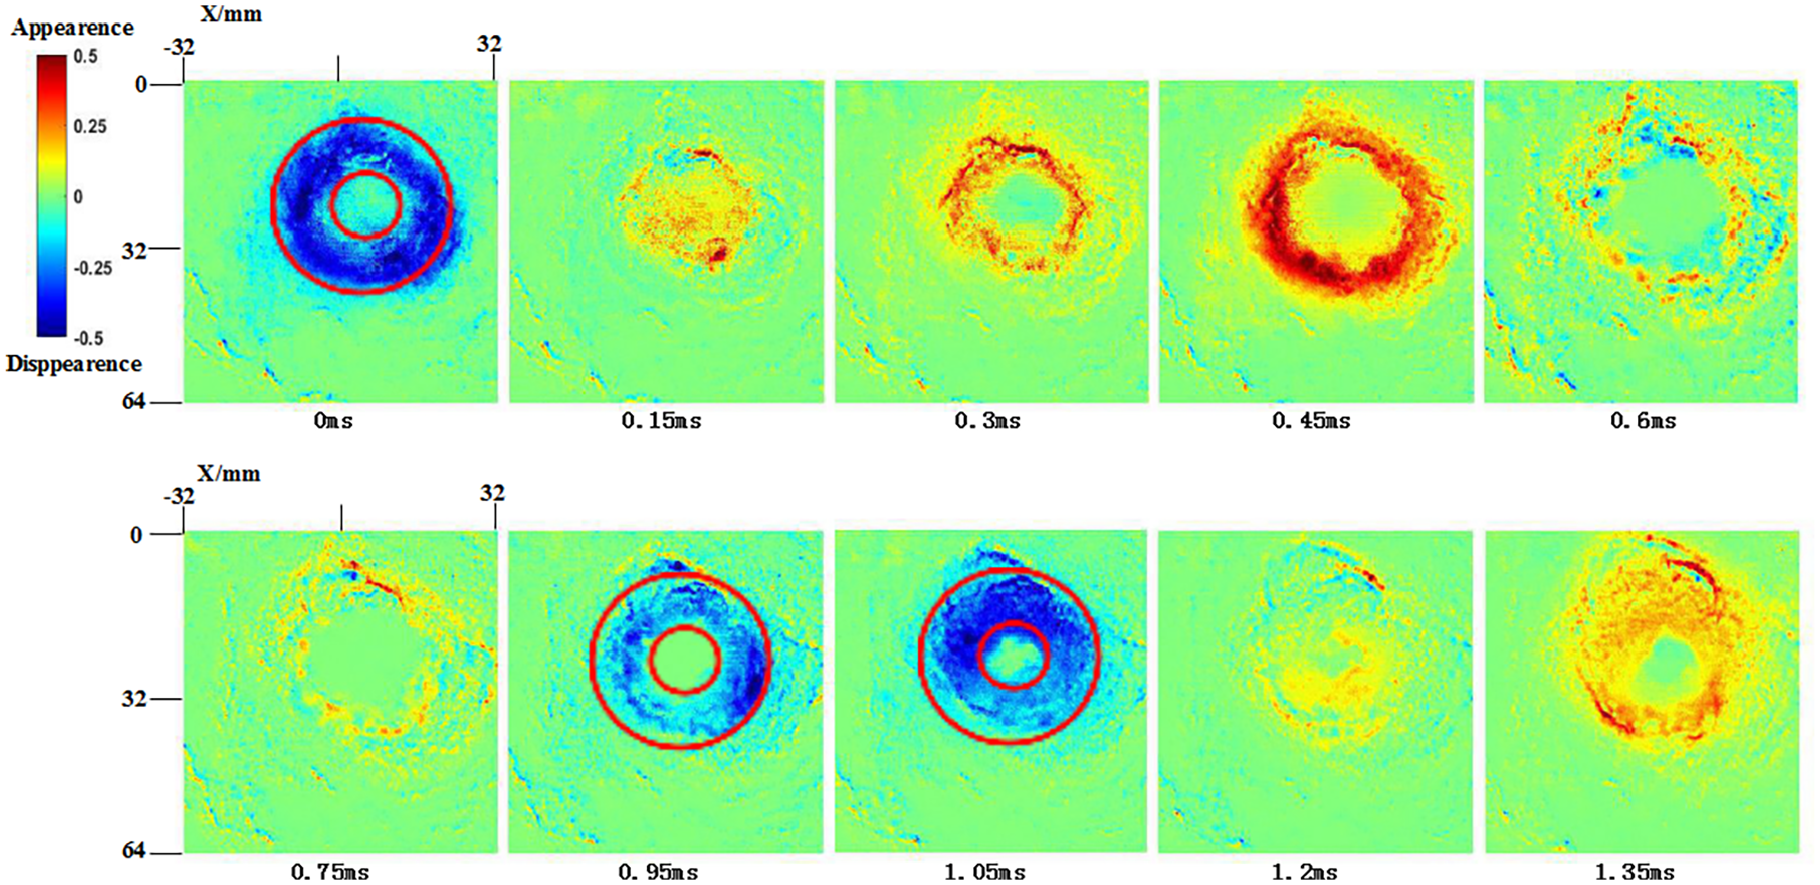
Time-resolved observation time-different images.
As the high-speed jet ejected from the nozzle is obstructed by the surrounding liquid, its velocity towards the workpiece is continuously slowing down (Figure 7). Meanwhile, the cavitation bubbles emerging from the jet center are also becoming less, leading to a reduction in the depth of the craters in jet-impact-zone. Due to the pressure gradient and vortex at the jet boundary, a large number of cavitation bubbles are generated at the edge of the jet in the bubble-impact-zone. The bubbles collapse above the sample, generating shock waves and micro jet, which shock the foil.20,21 Only a few bubbles appear and cause little impact on the material in the periphery-impact-zone. There was no strict boundary between the three regions.
Schematic diagram of submerged cavitation water-jet impact field.
Influence of time and standoff distance on forming depth and uniformity of forming depth
Forming depth
The time and the standoff distance are the key to water-jet cavitation shock array micro-forming. Thus, it is important to investigate the influences of these two parameters on the forming depth of craters in the bubble-impact-zone. Different time 1 min, 2 min, 3 min, 4 min, 5 min, and standoff distances 100 mm, 110 mm, 120 mm, 130 mm, 140mm were chosen. Three experiments were conducted with the data present being averaged under each condition.
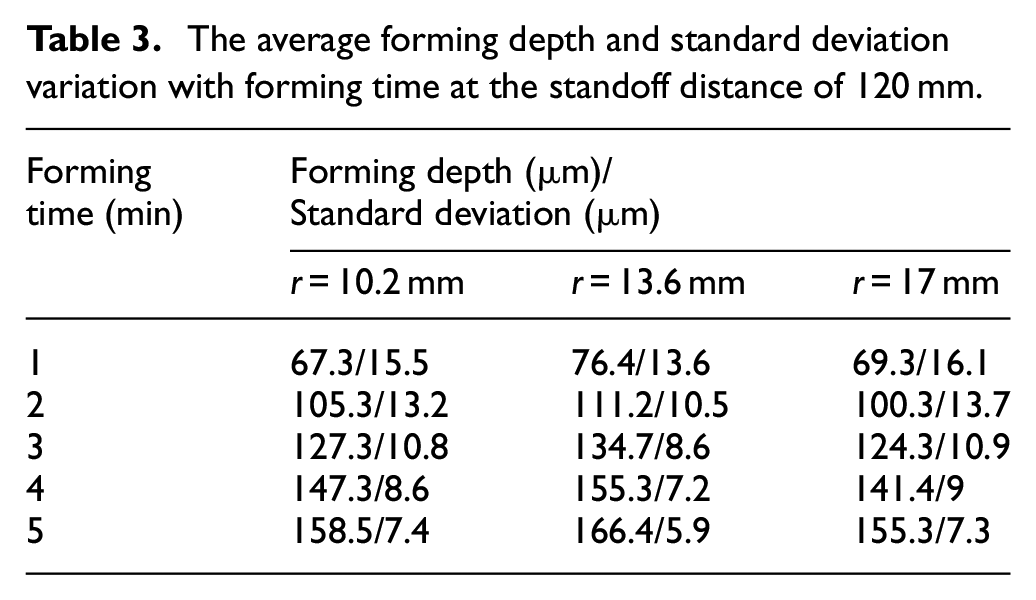
The results obtained for the standoff distance of 120 mm are shown in Table 3. Each value was the average one of all 16 micro-craters at each ring. The average forming depth at different radii all increased with time. The increase in average forming depth was quite pronounced when the time difference was relatively large. For example, the average forming depth was only 67.3 μm when the time t was 1 min while that was 166.4 μm when the time t was 5 min at the radius of 13.6 mm. The increased energy causes greater plastic deformation of the foils. The crater depth at the radius of 13.6 mm was deeper than the others. A large amount of bubbles collapse intensively in this region producing more energy.
The average forming depth and standard deviation variation with forming time at the standoff distance of 120 mm.
However, there is a risk of crack on the sample when the forming time continues to increase. As the experiment results showed, the shear crack was observed at the fillet of a micro-crater as the forming time rose to 8 min. The fracture area was observed under a high magnification lens through a digital microscope (Figure 8 marked with the solid line). As the workpiece was irreversibly deformed under the shock of water-jet cavitation, the high strain localization zones became thinner with the forming depth increasing. The blank holder force generated by the locking block prevented the material from flowing at the fillet of the crater at the same time. Cracks initiated and grew with time, and then the failure of the sample happened at these zones.
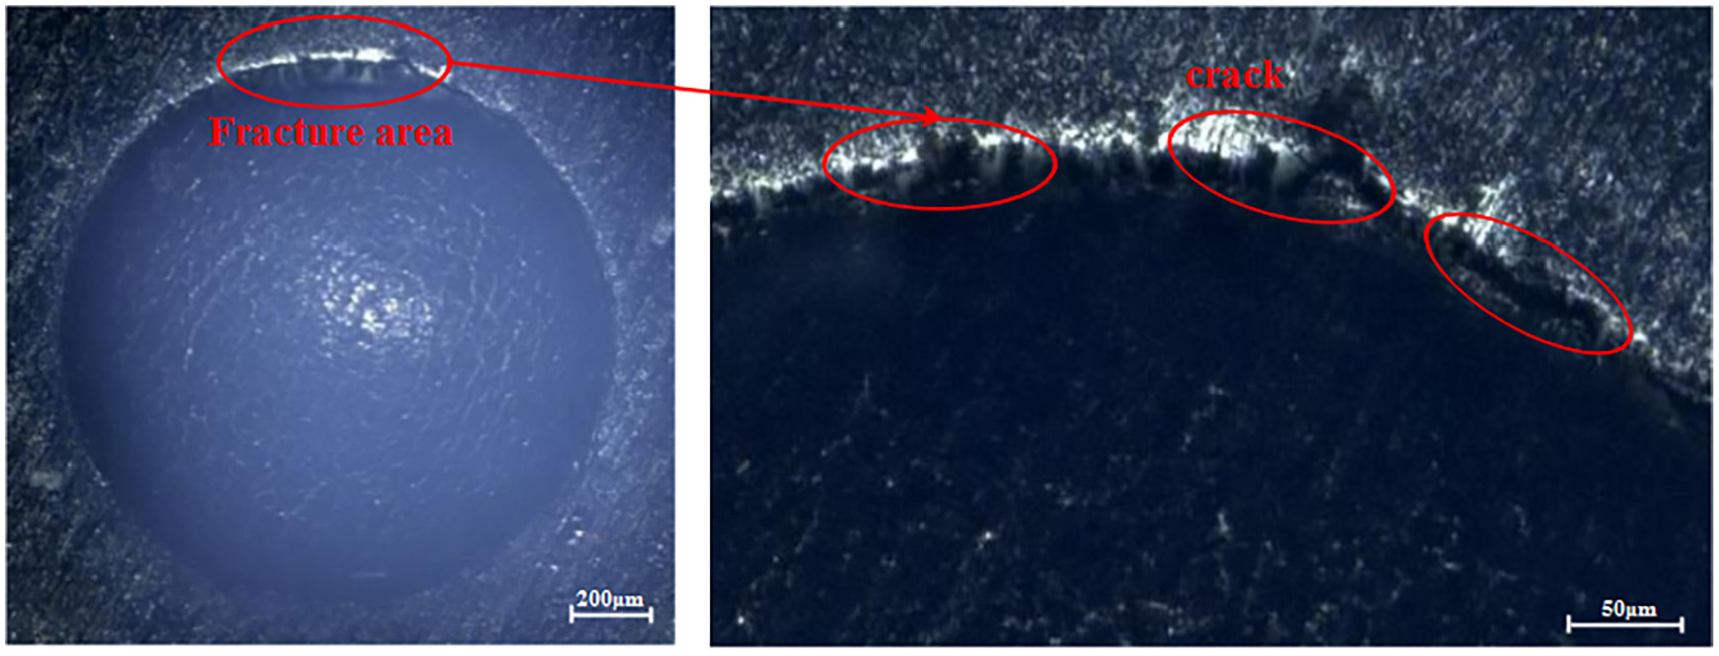
The morphology of fracture area.
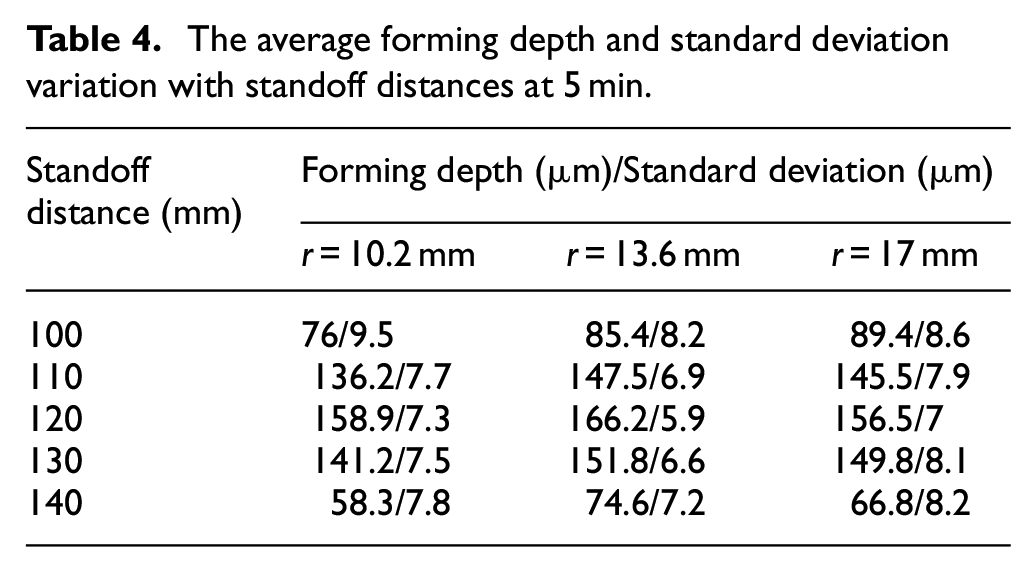
Table 4 displays the changes in the average forming depth with the standoff distance from 100 mm to 140 mm at 5 min. The forming depth increased first and then decreased with the increasing standoff distance. The forming depth at the standoff distance of 120 mm was apparently larger than that under other standoff distances. One explanation is that the bubbles concentration collapse range of cavitation jet is about 120 mm in the experiment. The majority of bubbles collapsed under this standoff distance, inducing the maximum shock wave and micro-jet. Therefore, the maximum energy reached to the surface of the workpiece, generating deepest craters.
The average forming depth and standard deviation variation with standoff distances at 5 min.
Uniformity of forming depth
The uniformity of the forming depth is an important criterion for the fabrication of array micro-features. Therefore, it is necessary to study the depth uniformity of water-jet cavitation shock array micro-forming. The processing parameters were the same as in the section “Forming depth.”Tables 3 and 4 in section “Forming depth” provide the values of standard deviation with forming time and standoff distances.
Table 3 shows the influences of time on the standard deviation of forming depth at the standoff distance of 120 mm. The standard deviation at different radii all decreased with time and the lowest standard deviation reached 5.9 μm at the radius of 13.6 mm when the time was 5 min. The bubble collapse impact load at the same point of the sample is random.22,23 Therefore, the energy act on the specimen surface becomes more and more uniform with time. The standard deviation of forming depth varied in the radial direction in the bubble-impact-zone and was the smallest at the radius of 13.6 mm when the time ranged from 1 min to 5 min. The collapsed cavitation bubbles in the outer shear layer of the cavitation jet are responsible for the plastic deformation of the sample. 23 More collapsed cavitation bubbles were present at the radius of 13.6 mm. Therefore, the energy became relatively uniform with increasing time here.
When the forming time was 5 min, the standard deviation of micro-craters at different standoff distances is shown in Table 4. When the standoff distance deviated from 120 mm, the standard deviation of micro-craters at each ring decreased. Therefore, the uniformity of the micro-crater arrays improved significantly at the standoff distance of 120 mm.
Thickness distribution
Thickness thinning of materials is inevitable in the forming process, and there is a risk of cracking if the thickness thinning ratio is too large, which will seriously damage the properties of the materials and even cause parts to be scrapped. Therefore, the thickness distribution of the formed parts after water-jet cavitation shocked was studied to manifest the plastic deformation behavior of 304 stainless steel foils.
The cold-mounted technique was used to characterize the thickness distribution of the formed part. The workpieces were cut to a 10 mm × 10 mm square, and then the treated workpieces were cold-mounted during the cold-mounted process. The samples were ground by 80 # to 5000 # sandpapers to the center of the crater cross-section after 12 h. The cross-section of craters was measured by a digital microscope (KEYENCE VHX-1000C) after polishing. Fifteen points were selected to characterize the distribution of the thickness from the top and the bottom surface. The schematic measurement location of 304 steel foils thickness distribution was shown in Figure 9.
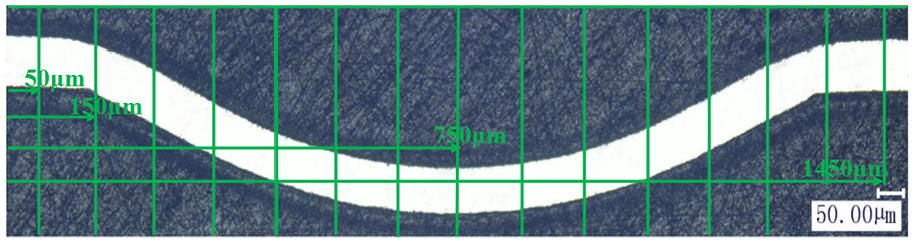
Schematic of measurement locations of thickness distribution.
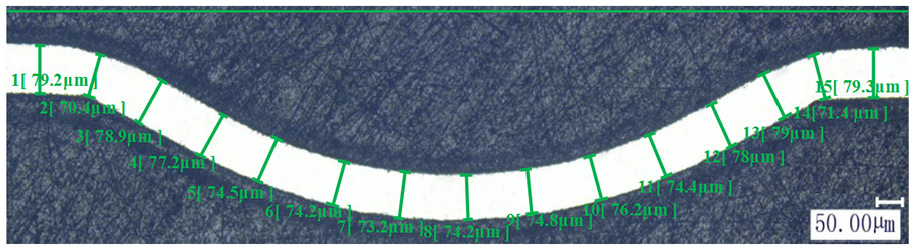
The components used in this section were formed at a standoff distance of 120 mm and with a time of 5 min. The schematic diagram of the measurement was shown in Figure 10. The initial thickness t0 of the cross-section was measured to be 80 μm and the measuring point thickness of the formed area was ti. The thickness thinning ratio was calculated by equation (1) 24 :
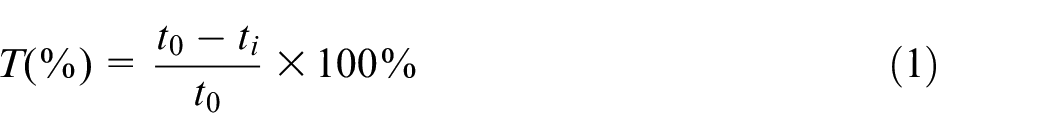
Thickness measurement of formed part at the 120 mm standoff distance and 5 min.
A comparison of the crater thickness thinning in the radial direction is provided in Figure 11. The thickness thinning rate first decreased and then increased from the fillet to the bottom of the formed parts. The maximum thinning rate of 13.5% was observed along the edge near the fillet of the mold. The rigid micro-mold limited the flow of materials. The thinning of the crater center was evident as the compressive stress acting on the center of the sample was pronounced. 25 In addition, the variation of thickness thinning in the craters in the radial direction was unapparent. The thinning rate of craters at the radius of 13.6 was slightly bigger than that of others. The thickness thinning ratio was between 2% and 10% for most of the formed parts, except the fillet of the mold. This indicates that the water-jet cavitation shock technique can provide uniform thickness thinning.
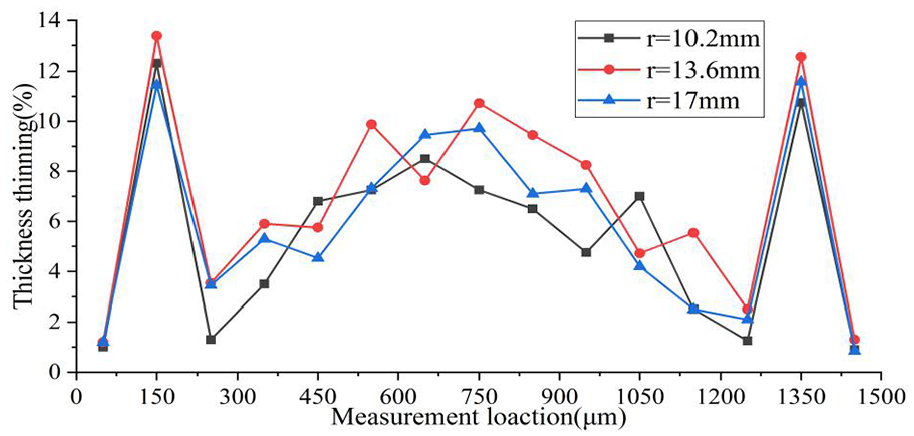
The distribution of thickness thinning ratio at different rings under the 120 mm standoff distance and 5 min.
Conclusion
The array deformation behavior of 304 stainless steel foils under water-jet cavitation was investigated in this paper. The feasibility of this new process was verified and the formation law was researched. The conclusions are obtained as follow:
(1) The forming areas can be divided into three categories: the jet-impact-zone, the bubble-impact-zone and the periphery-impact-zone from the jet center to the periphery. The bubble-impact-zone has the best forming outcomes. Most of the cavitation bubbles are distributed along the outer shear layer of the jet and mainly responsible for the plastic deformation of the sample.
(2) The influences of the time and the standoff distance on the forming depth and the uniformity of forming depth were studied. The forming depth and its uniformity of the parts are significantly improved at the optimal standoff distance (the optimal standoff distance in this experimental condition is about 120 mm). The forming depth increases with time while the standard deviation of micro-craters decreases with time.
(3) The thickness thinning rate of the parts in the bubble-impact-zone ranges from 2% to 10% except the fillet of the mold. This indicates that the formed parts having good uniform thickness distribution are fabricated through this process.
Footnotes
Declaration of conflicting interests
The author(s) declared no potential conflicts of interest with respect to the research, authorship, and/or publication of this article.
Funding
The author(s) disclosed receipt of the following financial support for the research, authorship, and/or publication of this article: This work was supported by the Research Foundation for Advanced Talents of Jiangsu University (No. 18JDG030), the Natural Science Foundation of P. R. China (No. 51575245, 51679112), the Jiangsu Province Key Research and Development Program (No. BE2016161), Research and Control of Cooperative Deformation Behavior of Steel/CFRP Lightweight Body Components with Differential Temperature Co-impact (XNYQC-002) and the China Postdoctoral Science Foundation (2020M671354).